1. Introduction
In the study of animal flight and fish swimming, we often observe biologically structured two-foil systems, such as pairs of insect wings and sets of fins on fish bodies. Evidence indicates that such systems gain aerodynamic or hydrodynamic advantages from the vortex interactions between the upstream and downstream foils. Warkentin et al. [
1] conducted experimental work that studied the aerodynamics of two insect wings with different spacing, flapping frequencies, and phase angles. This study provided foundational guidance for a systematic parametric investigation of a two-foil system. Wang et al. numerically studied passively pitching tandem plates inspired by insect hovering flight. It was found that the wing–wing interaction is essential for wake capturing and the aerodynamic performance of the tandem foils [
2,
3]. Tandem foil systems in aquatic creatures have been extensively studied, with research demonstrating significant improvements in their hydrodynamic performance. For example, in a dorsal fin–caudal fin system of a swimming fish, experiments have shown that the caudal fin, located downstream of the dorsal fin, interacts with the vortices shed from the upstream in different species of fish [
4,
5,
6]. Canonical tandem hydrofoil experiments have also revealed the importance of active pitching motion in the flow interactions between multiple tandem foils and the resulting collective force generation [
7,
8,
9,
10,
11], finding that the downstream foils are strongly affected by the spacing and the phase difference between the foil pitching motion and the wake vortices. Such performance enhancement can also be observed with larger objects. A study by Beal et al. found that, even outside the suction region of a bluff cylinder, a deceased fish can be propelled upstream if its flexible body resonates with the oncoming vortices generated in the wake of the cylinder [
12]. Many studies of the flight of insects and biomimetic flapping wings also discovered the importance of tandem wing configurations in lift generation [
2,
3]. A study on fluid–structure interactions in hovering flight [
13] provided relevant insights into the role of passive deformation in unsteady flows, which can inform the analysis of foil–foil interactions in flying snake gliding.
During aerial gliding, flying snakes (
Chrysopelea) tend to adopt a foil–foil interaction configuration [
14,
15,
16,
17,
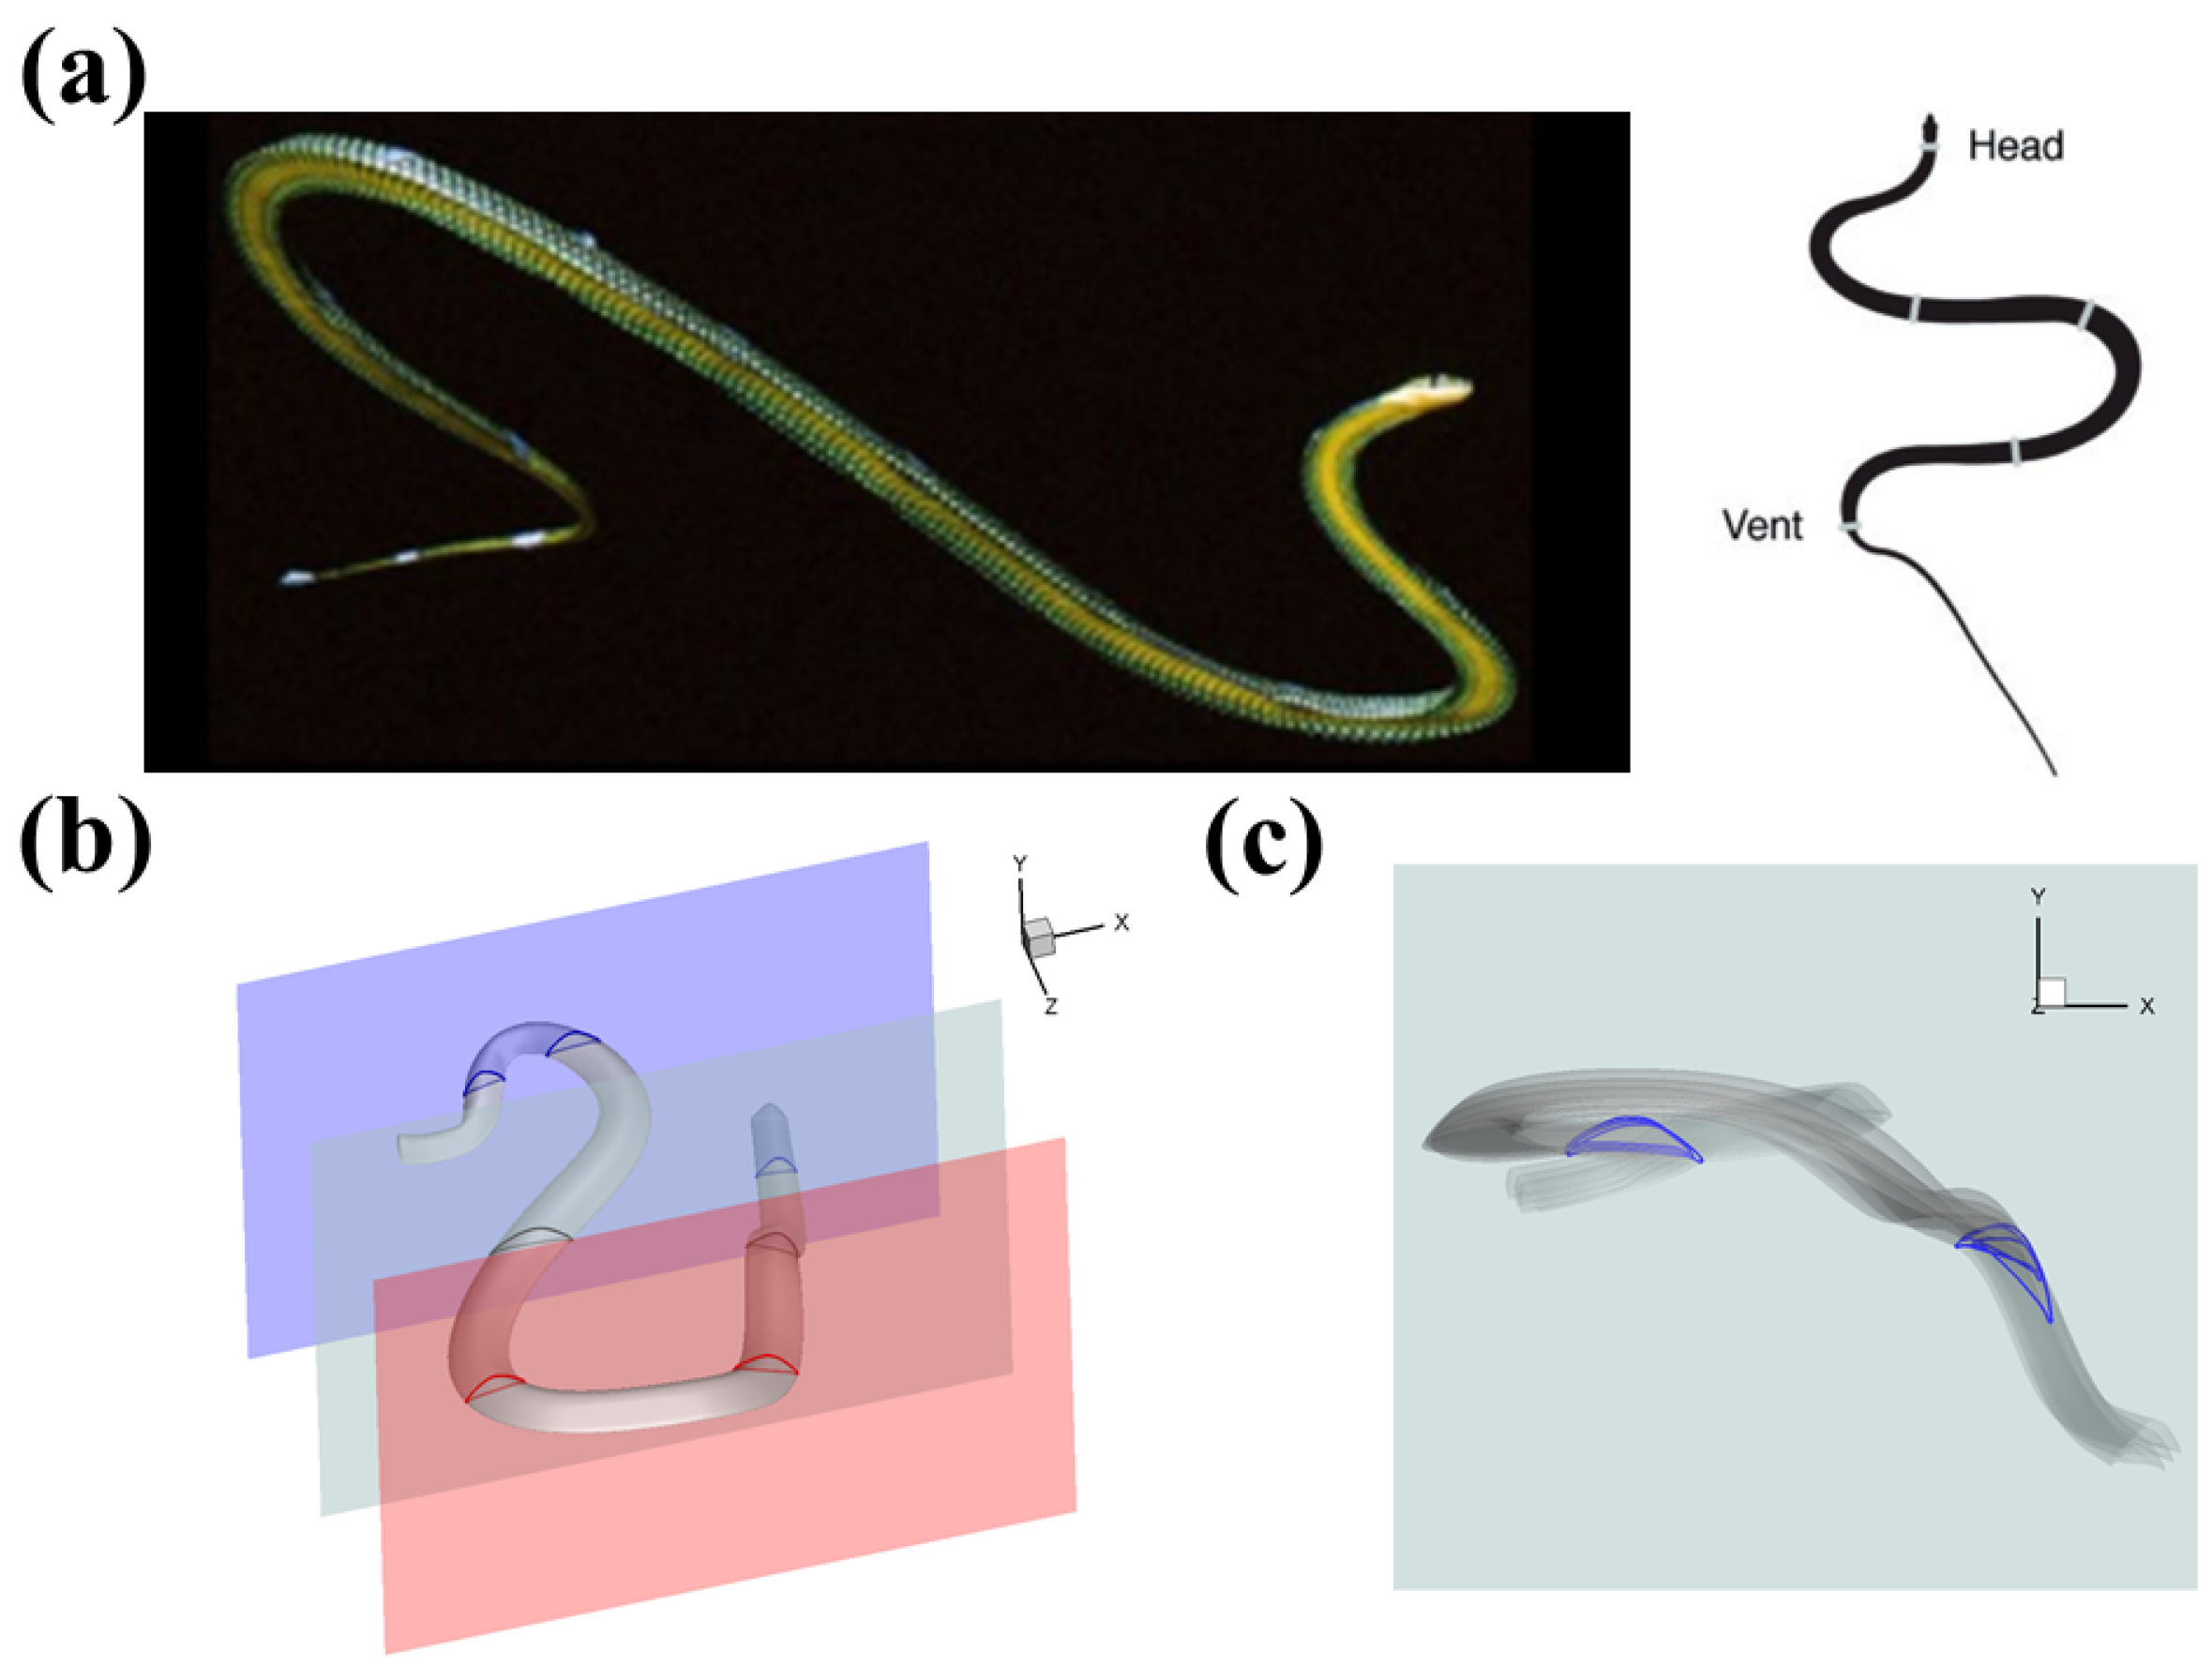
18]. As a highly specialized gliding species, these snakes utilize a unique form of locomotion that involves bending their bodies to create a large, undulating motion (
Figure 1a). The curved posture forms an S shape, allowing the anterior and posterior sections of the snake’s body to align in a tandem formation (
Figure 1b). Miklasz et al. were the first to discuss this formation and studied the interaction between the bodies using two in-line cylindrical foils [
19]. Their research revealed that the lift on the downstream foil is affected by the vertical displacement between the anterior and posterior sections of the snake. Subsequently, a more detailed analysis of the snake’s cross-sectional shape was conducted, both experimentally [
20] and numerically [
21]. The cross-section of the snake body is shaped like a triangle, featuring a flat ventral surface and rounded edges at both ends (see
Figure 1). This foil shape has been shown to play a significant role in generating lift. Based on this shape, Jafari et al. [
22] further investigated the interactions between the tandem body segments. Their study examined a wide range of horizontal (“the gap”) and vertical (“the staggered”) distances. Additionally, they explored different combinations of the orientation (the angle of attack (
AOA)) between the two airfoils. The results revealed that the average lift-to-drag ratio reached a maximum value of 2.2, which was almost 10% higher than that of a single airfoil. This optimal tandem arrangement modified the flow separation and the wake size, leading to enhanced lift in cases where the wake vortices are formed closer to the models.
It is important to note that previous research has left some unsolved questions that need further investigation. Firstly, the relative positions of the anterior and posterior bodies have not been thoroughly examined. In early studies by Miklasz et al. and Jafari et al., the posterior body was positioned below the anterior body. However, the 3D reconstruction of a flying snake gliding, illustrated in
Figure 1b, and derived from actual footage of a snake gliding [
15], shows that the posterior bodies can be elevated higher than the anterior body. This vertical configuration is attributed to the vertical bending associated with the undulation motion. According to the model proposed by Yeaton et al. [
15], vertical bending consists of a sinusoidal wave (referred to as a “vertical wave”) and an up-and-down motion of the posterior body (known as “dorsal-ventral bending” [
23]). As a result of these motions, various arrangements of tandem bodies can be observed. We presented a perspective view of a moment when the snake was performing aerial gliding. We selected three vertical planes parallel to the snake’s flight direction, as shown in
Figure 1b. In the red and light gray planes, the posterior body is positioned slightly below the anterior part. However, in the blue plane, three cross-sections co-exist simultaneously, with the middle cross-section sitting above the anterior cross-section. This observation indicates that, in some cases, the posterior body is positioned higher than the anterior body, which has yet to be thoroughly investigated. Secondly, in
Figure 1c, we present a series of time frames of the light gray vertical plane as seen from the side view. The anterior body stays still while the posterior body exhibits dynamic movement with a pitching down motion. This illustrates the dorsal–ventral bending motion, although the underlying flow physics of this phenomenon is still not fully understood. Preliminary results on the dynamic motion of the posterior body were discussed by Gong et al. [
24], who focused on heaving motion. However, the impact of pitching motion, which affects the angle of attack of the posterior body, has not been examined.
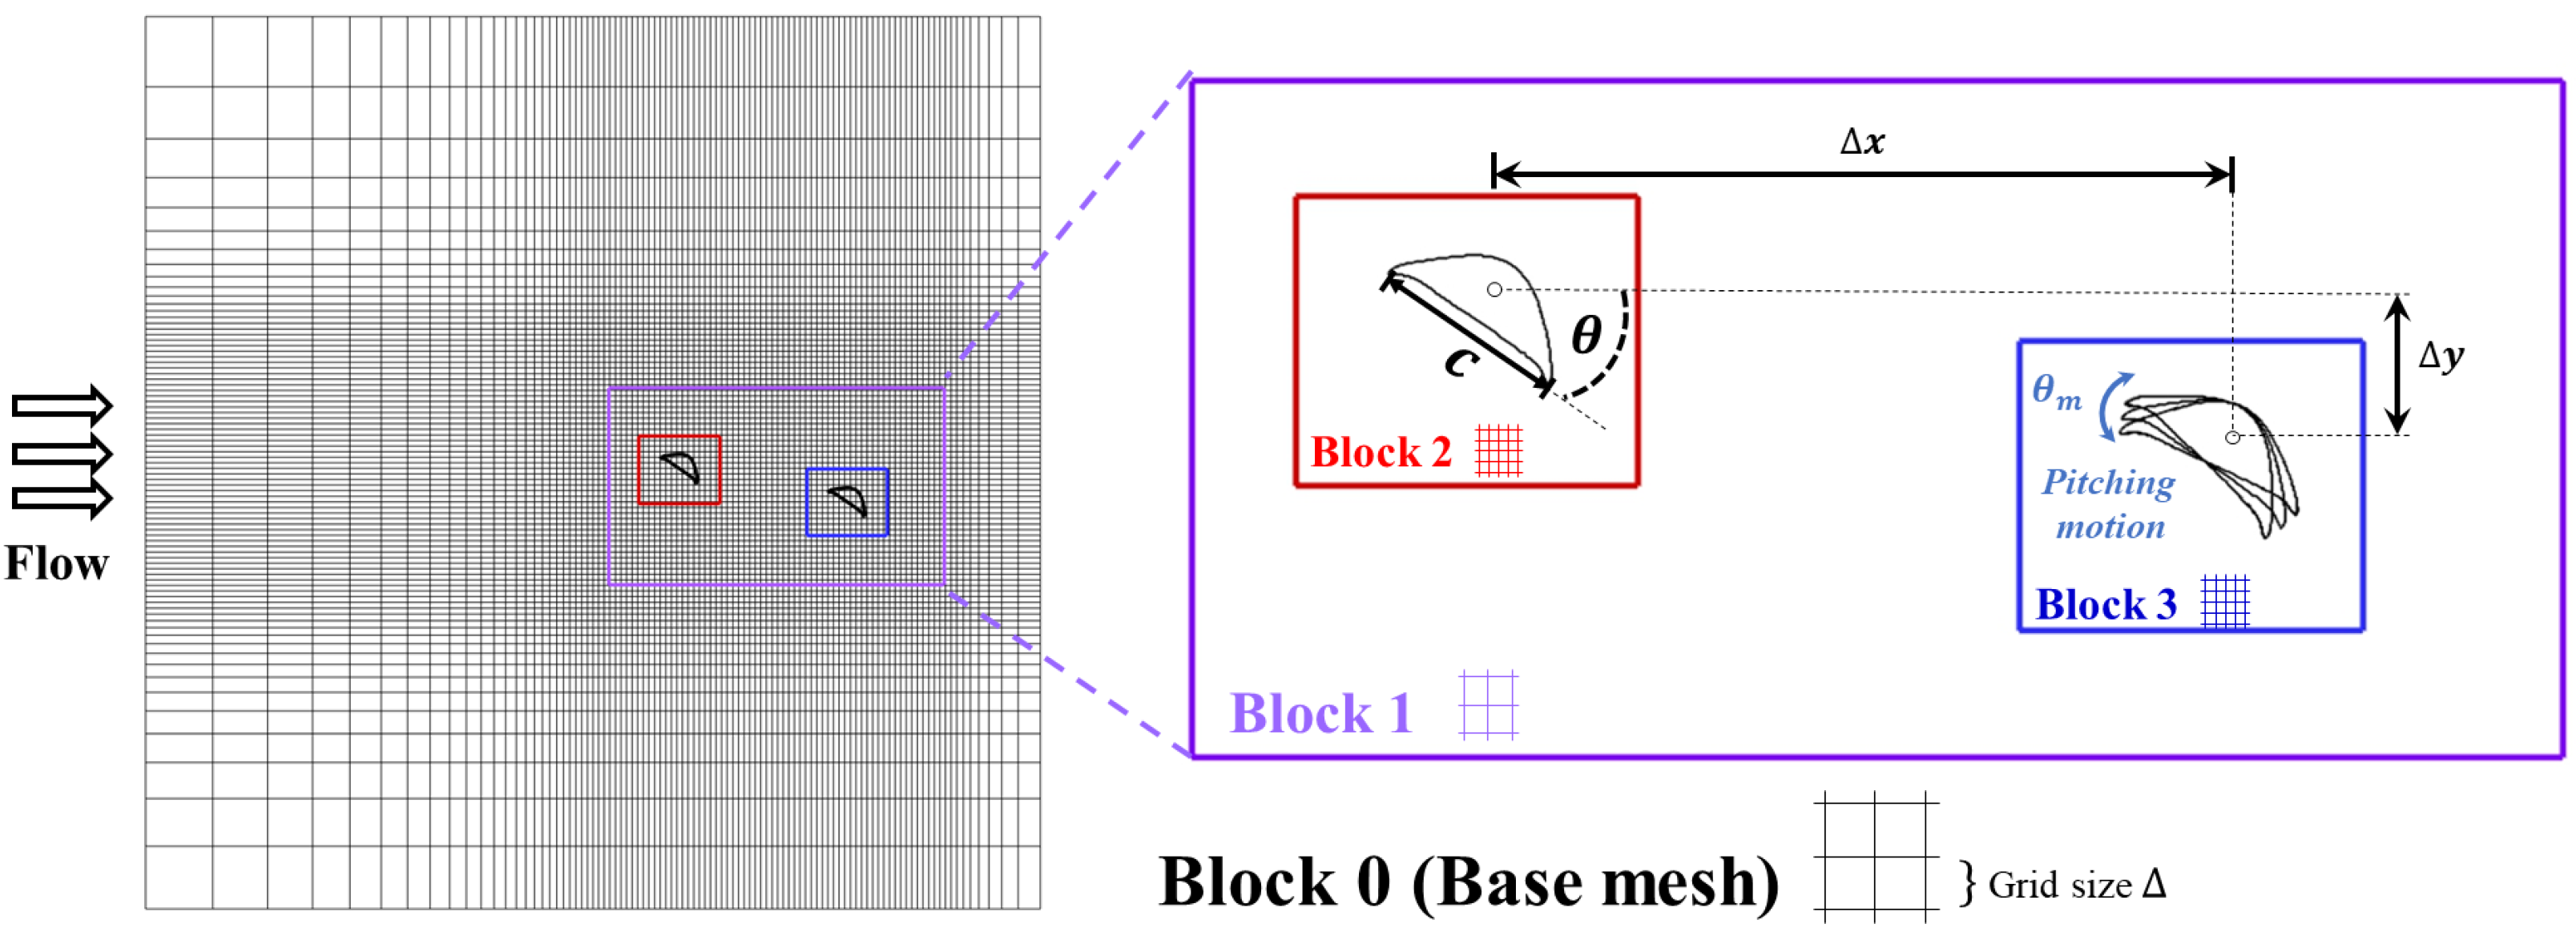
The objective of this study is to analyze the aerodynamic interactions between upstream and downstream body segments, covering a wide range of spatial arrangements and accounting for dynamic motions. We used an in-house immersed boundary method (IBM) flow solver with a tree topological local mesh refinement (TLMR) technique to simulate a two-dimensional (2D) two-foil system, which effectively represents the anterior and posterior sections of a flying snake’s body. We quantified the aerodynamic performances of the foils, including lift and drag coefficients, as well as the lift-to-drag ratio. A detailed analysis of the wake structure and the vortex interactions between the upstream and downstream foils was performed. We also performed a parametric study on various combinations of relative distances. Additionally, we investigated the effects of different pitching motions, including various pitching frequencies and pitching angles. Lastly, the effects of the Reynolds number on the foil wake are examined. The remaining sections of this paper are organized in the following way.
Section 2 details the simulation setup, including the snake-inspired foil shapes and the motion of the trailing foil in the computational domain (
Section 2.1), and relevant information about the direct numerical simulation (DNS) method (
Section 2.2).
Section 3 focuses on the simulation results and our analysis. It is further broken into subsections describing the aerodynamics and performance of a solitary snake foil (
Section 3.1), the static two-foil interaction at varying spacings (
Section 3.2), the effect of changing Reynolds number (
Section 3.3), and the effect of the pitching motion of the posterior foil (
Section 3.4).
Figure 1.
(
a) The snake applies undulating motion and forms an “S” shape in the aerial gliding [
15]. During gliding, their anterior and posterior body create the tandem configuration [
25]. (
b) Perspective view of the 3D flying snake model with several slice cuts showing different tandem snake airfoil configurations. (
c) Side view of the flying snake motion during gliding, indicating the pitching angle change in the posterior body.
3. Results and Discussion
In this section, we first examine the aerodynamic performance of a solitary foil at varying
AOAs (
Section 3.1) and cross-validate our result with that of Krishnan et al. [
21]. The
AOA that produces the best lift performance is used in the subsequent two-foil setup. As the wake produced by the upstream foil strongly affects the aerodynamics of the downstream foil, the vortex shedding and wake momentum are analyzed for the
AOA = 35° case. Then, the aerodynamic performance and interactions in the two-foil system are analyzed in
Section 3.2 with the configuration range of
and
. In
Section 3.3, the effect of the Reynolds number is investigated by examining the same set of spatial arrangements at
and then focusing on one spatial arrangement of particular interest and varying its Reynolds number in a wider range. Finally, the effects of the pitching amplitudes and frequencies of the posterior foil are discussed in
Section 3.4.
3.1. Solitary Foil: Aerodynamic Performance and Wake Dynamics
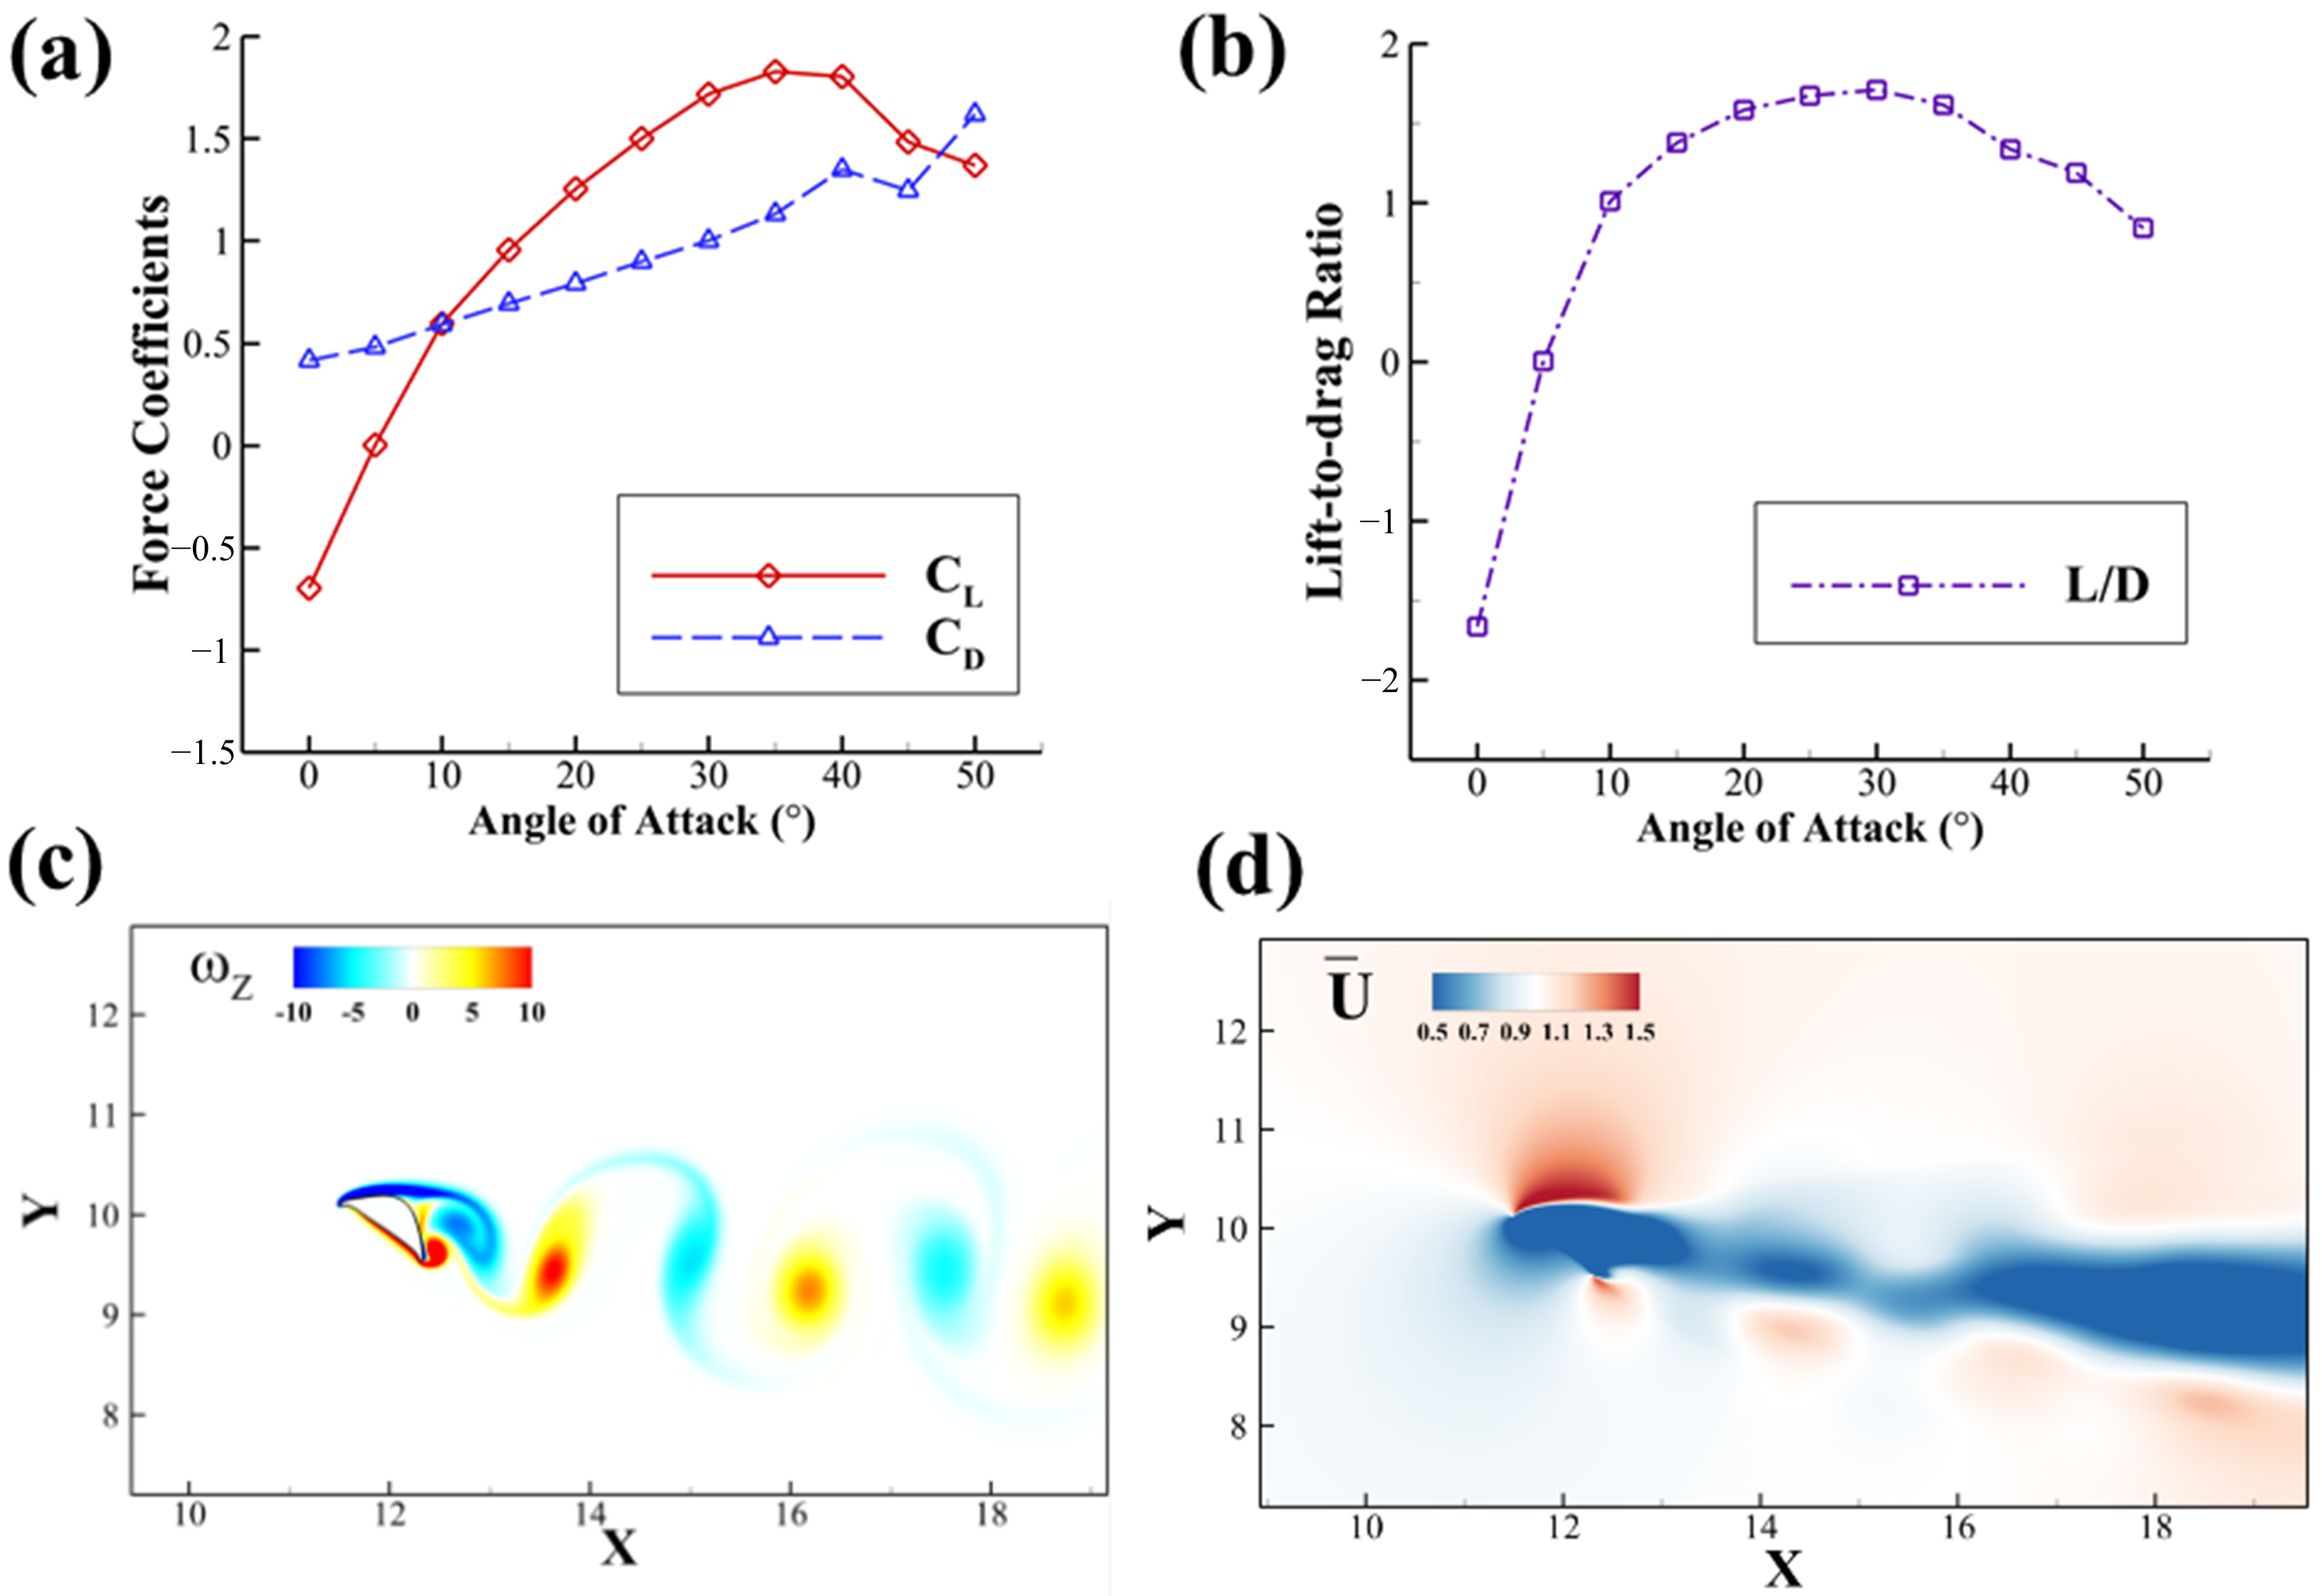
Our current study presents the aerodynamic performance of a solitary flying snake airfoil at different
AOAs at
Re = 1000 (
Figure 4). This simulation is comparable with the 2D simulation conducted by Krishnan et al. [
21]. The
AOA ranges from 10° to 45° with an increment of 5°. The lift coefficient (
) increases vastly before 30° and reaches a peak value of 1.998 at 35°, which is the
AOA we choose for further tandem foil study. Stall happens right after this critical
AOA, where the
decreases. On the other hand, the drag coefficient (
) increases linearly for nearly the whole
AOA range. The lift-to-drag ratio
follows a similar convex trend that is observed in the
trend and reaches a maximum at
AOA = 30° with the value of
= 1.674.
As shown in
Figure 4c, when the lift force is maximized at
AOA = 35°, the foil produces a von Kármán vortex street with positive and negative vortices shed at the trailing edge of the snake airfoil. In
Figure 4d, corresponding to the von Kármán vortex street, the average stream-wise velocity in the wake of the foil is reduced from the freestream, constituting a drag-type wake. The wake’s downward deviation shows the direction of vortex propagation and corresponds to vertical force production. The reverse flow in the blue region and the vortex wake can both influence the downstream airfoil’s aerodynamic performance.
3.2. Two Tandem Foil System: Aerodynamic Performance and Wake Dynamics
In this section, two flying snake airfoils are placed in tandem configuration. We investigate the aerodynamic performance and vortex structures based on different stream-wise and vertical distances between the foils. We start with the Reynolds number 1000 and AOA = 35°.
3.2.1. Aerodynamic Performance
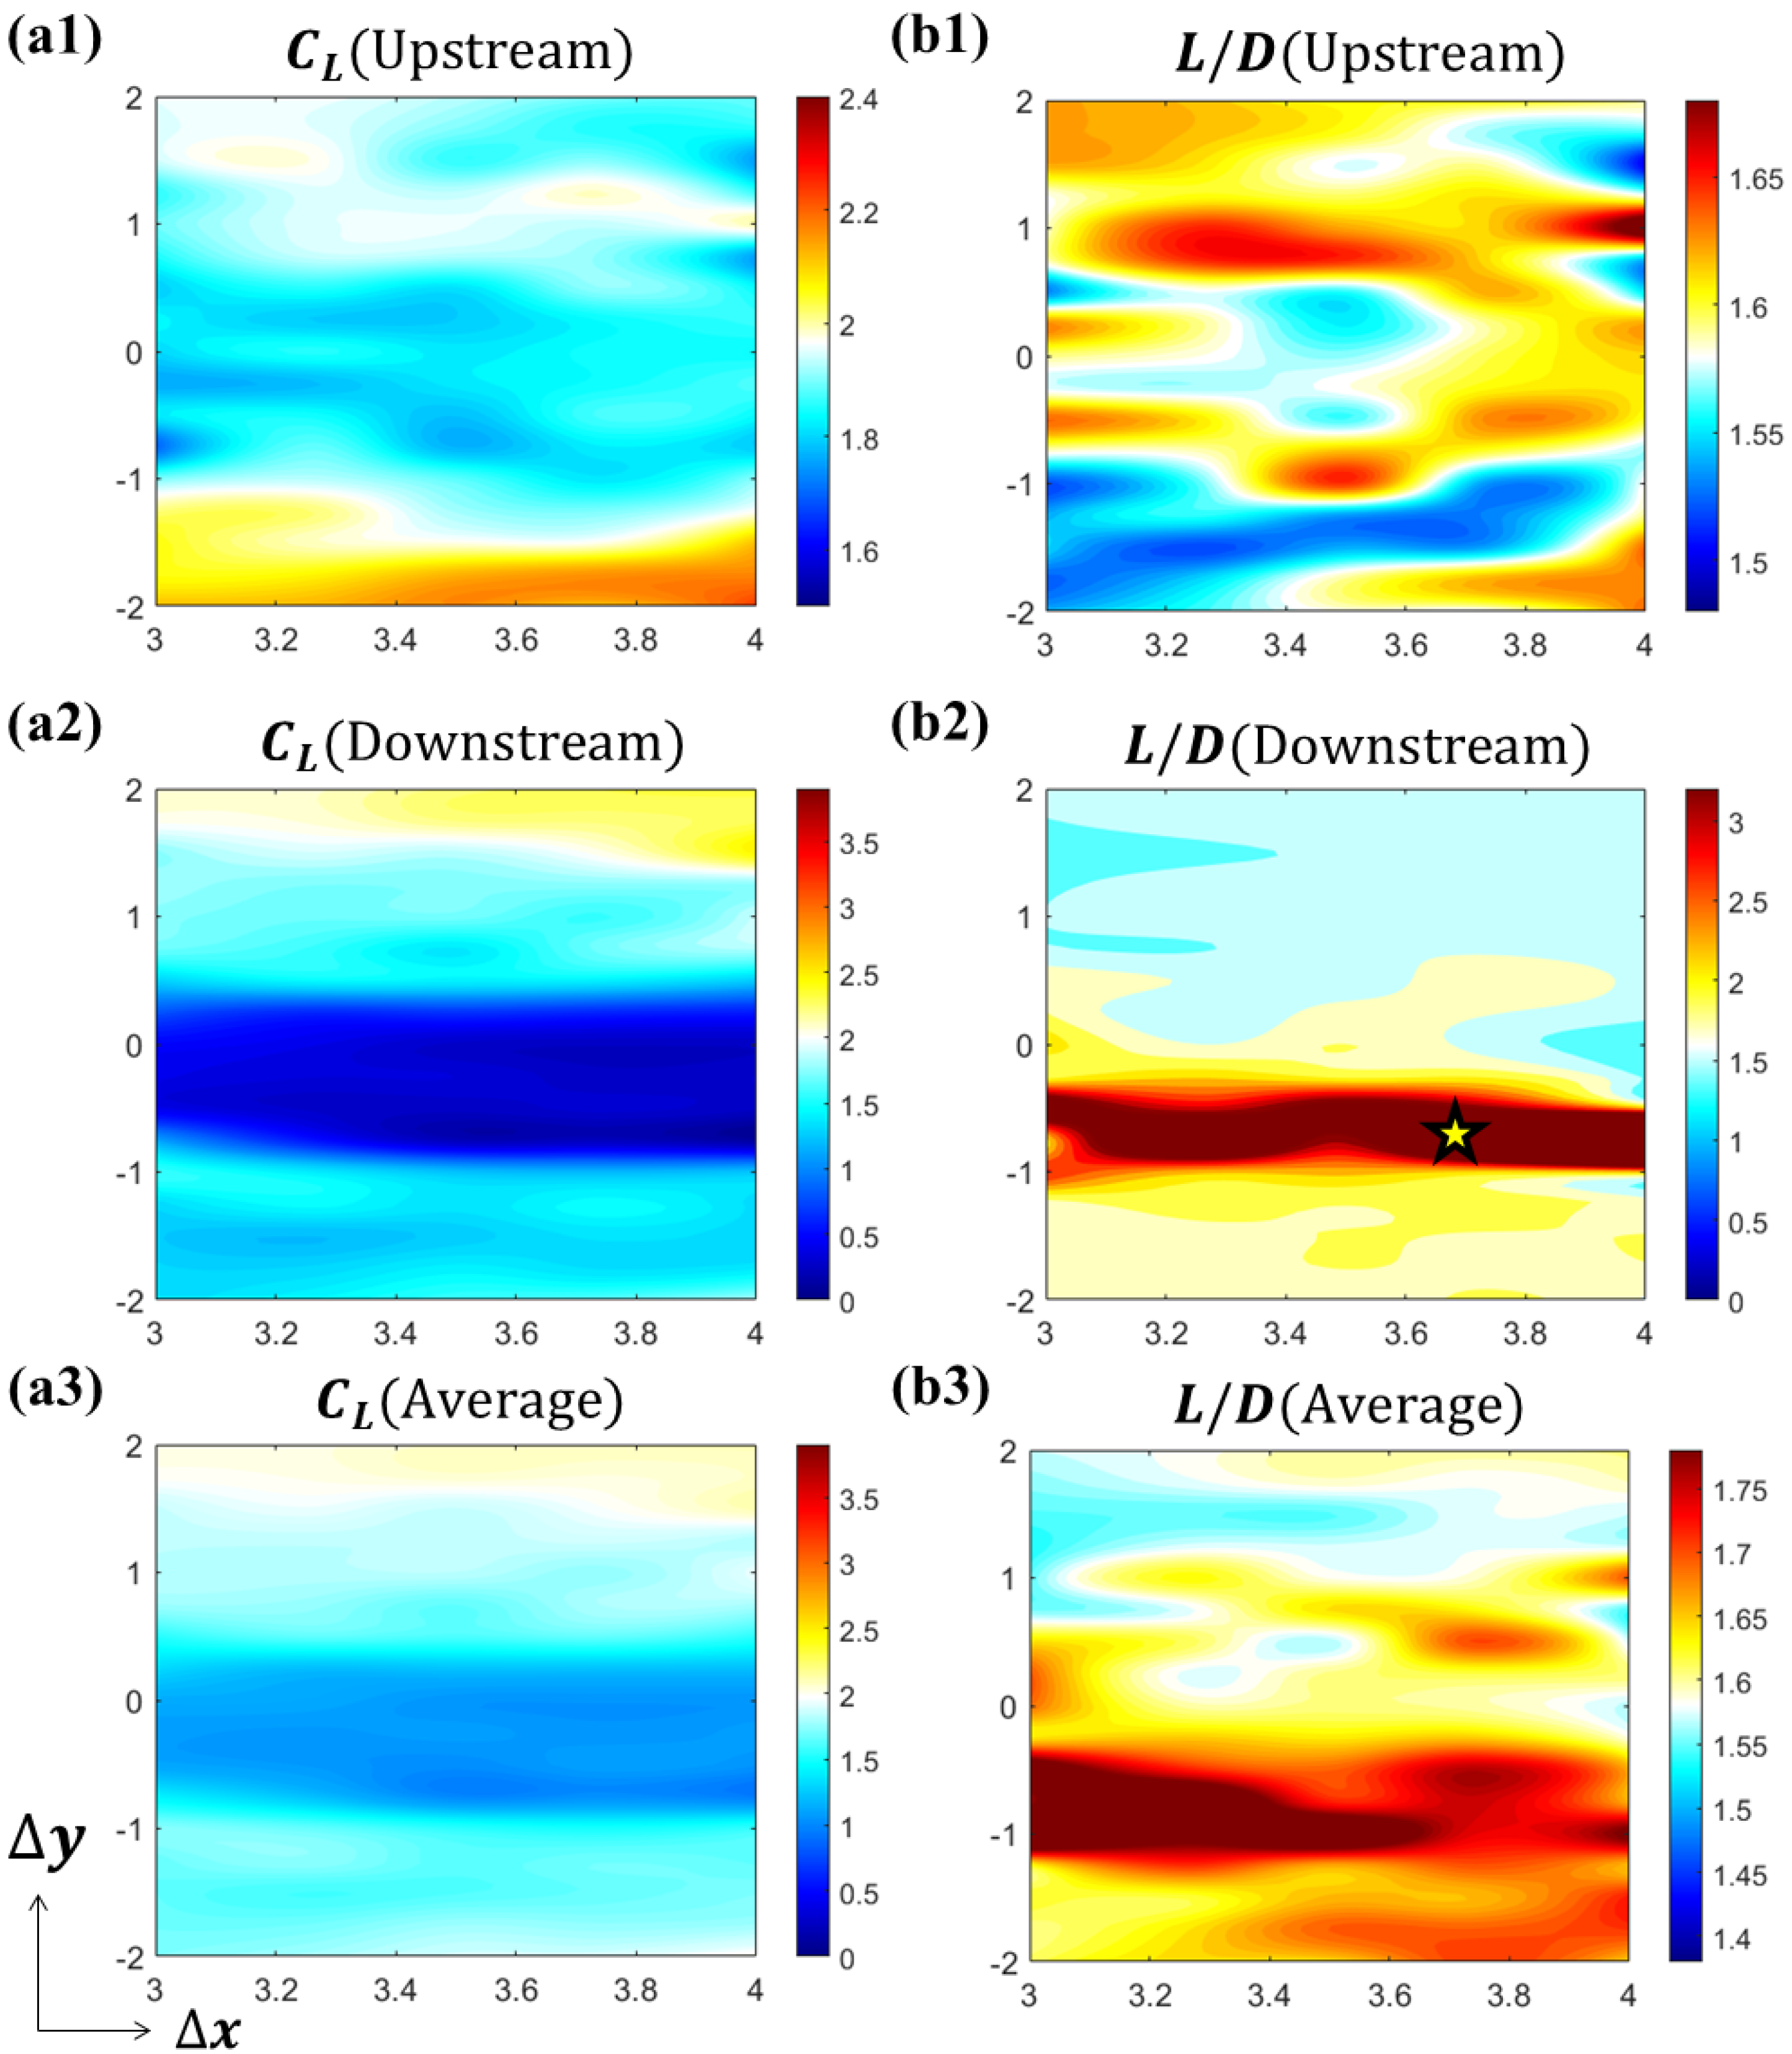
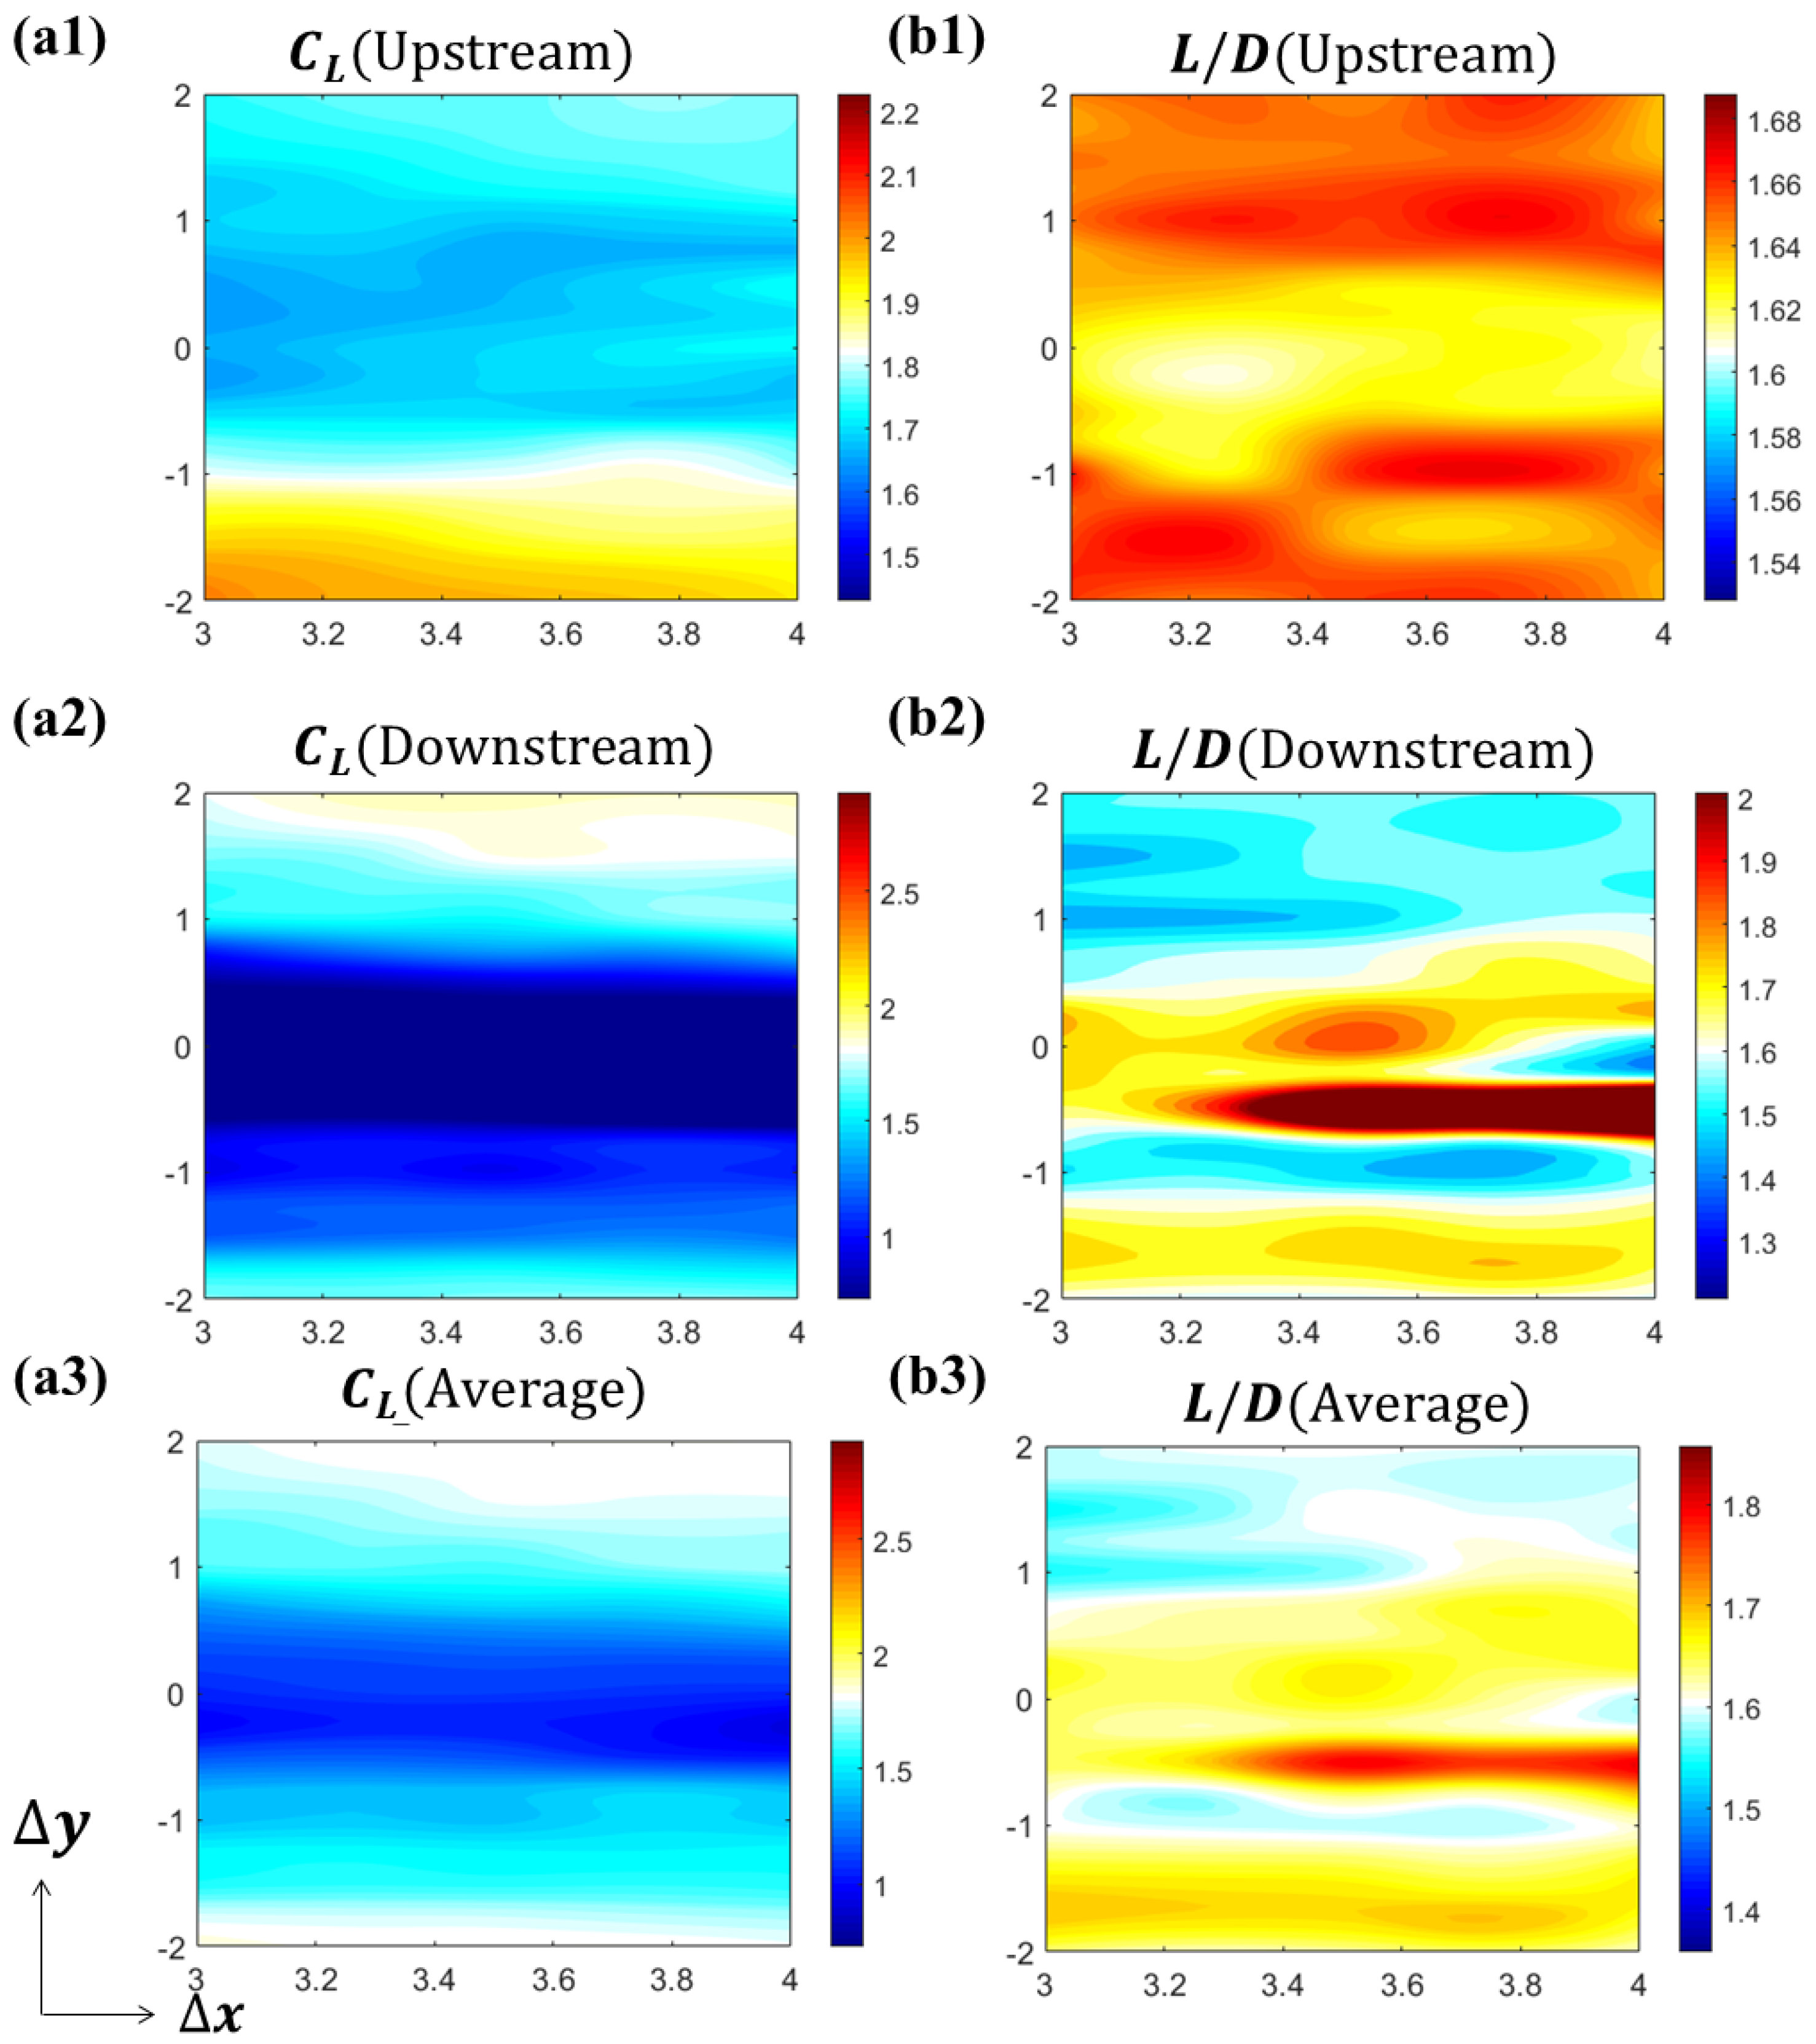
The aerodynamic performances of the two foils are summarized in
Figure 5. The intermediate white region of the colormap is set to be the average value of the solitary foil (
= 1.9502,
= 1.5800). The hot region (red and yellow) represents performance enhancement, while the cold region (cyan and blue) represents performance reduction. From
Figure 5a1–a3, it is shown that the interaction between the two foils reduces lift production in most cases. The lift production of upstream foil will be increased when the downstream foil is in the lower vertical position (
[
= 4.00c,
= −2.00c] = 2.2453), while the lift production of the downstream foil will be increased when itself is in upper vertical position (
[
= 4.00c,
= 2.00c] = 2.3542).
Figure 5a2 shows that the lift production of the downstream foil experiences a decrease when it is in the upstream foil’s wake, within the range of
. However, in
Figure 5b2, it is shown that the high
region for the downstream foil is also located in the upstream foil’s downstream, yet with a smaller range of
. This trend is also affecting the average system performance. We calculate the system average with the following:
Since the
performance is higher in downstream foil, the overall performance increases for the system average. A high
region shown in
Figure 5b3 appears in a similar region as the downstream foil. The performance results show that although the two-foil system experiences a reduction in average lift, the lift-to-drag ratio generally benefits from the interaction between the foils within a wide range of relative positions. The performance (
) of the downstream foil especially benefits from the interaction with the upstream foil’s wake, especially within a band of
.
In the snake foil–foil interaction, the relative positioning and phase synchronization of the airfoils influence the aerodynamic performance, with wake capture mechanisms playing an important role. Similarly, the study by Tuncer and Platzer [
34] demonstrates that in a tandem airfoil configuration, the presence of a stationary trailing airfoil in the wake of a flapping leading airfoil significantly enhances thrust and propulsive efficiency due to favorable wake interactions. While the tandem airfoil system in the study primarily emphasizes thrust augmentation, in the flying snake, the interaction between foils likely affects both lift and drag forces, impacting stability and maneuverability in gliding flight.
Numerous flying or gliding animals have been found to adjust their body shapes to enhance efficiency or to maneuver. The ancient feathered dinosaur
(Microraptor) may have laid its legs flat to achieve a better
ratio for a longer horizontal gliding capability [
35]. It is reported that flying fish would expand their pelvic fins when flying close to the surface of the sea to decrease the drag force and elevate the
[
36]. Ornithologists have determined that birds can adjust their wing camber and aspect ratio through the practice of functional morphology, leading to a greater
[
37]. The lift-to-drag ratio can be adversely influenced by factors such as alteration in the wing transmissivity and aeroelasticity, which influence the production of lift and drag [
38], or the molting of feathers, which lowers the
ratio to 7 from 10.5 when the feathers are full [
39]. Some birds are able to modify their lift-to-drag ratios with each wingbeat, allowing them to utilize aerodynamic force vectoring and maneuver up to an angle of approximately 100° relative to the horizontal plane [
40]. In the current study, we may explore different parameters and find the effects on the
performance.
3.2.2. Wake Structure
In
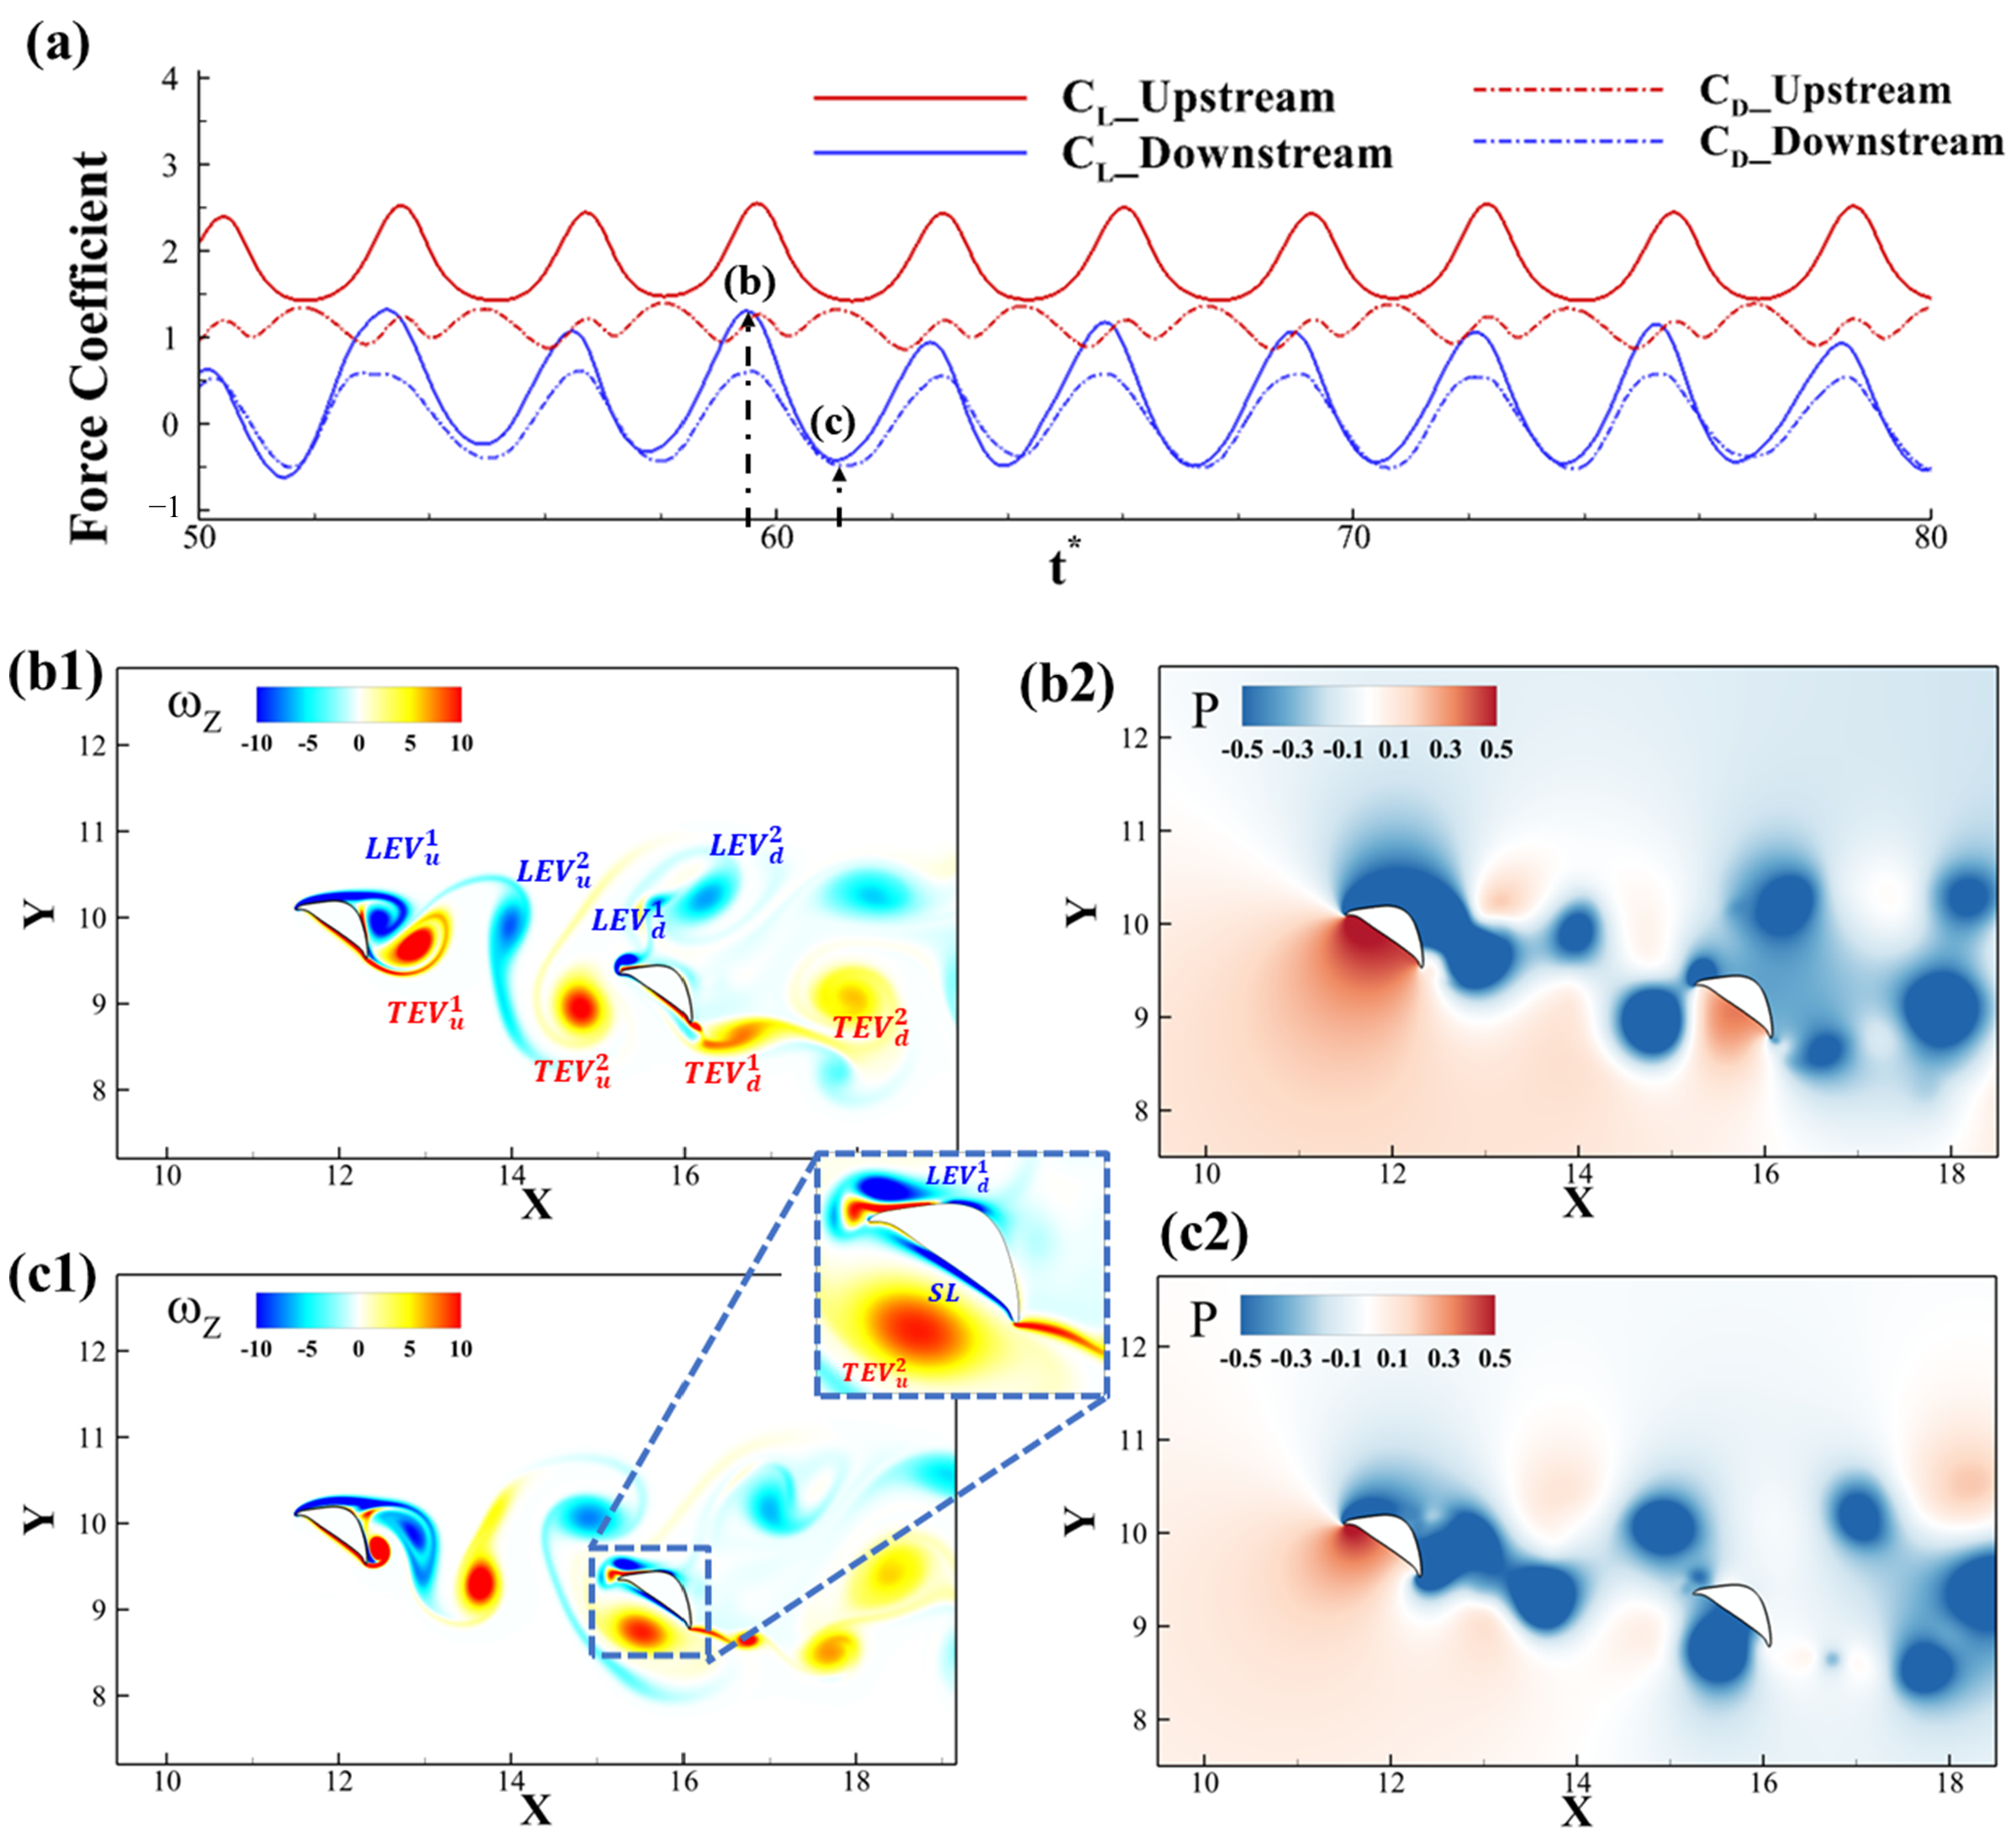
Figure 6, the force history for two foils as well as the flow information for the best-performing configuration (
= 3.75c,
= −0.75c) is presented. This configuration is shown in
Figure 6 with a star as it has the best
for downstream foil. Compared with solitary foil, it is clearly observed that the force production is reduced for the downstream foil, as shown in
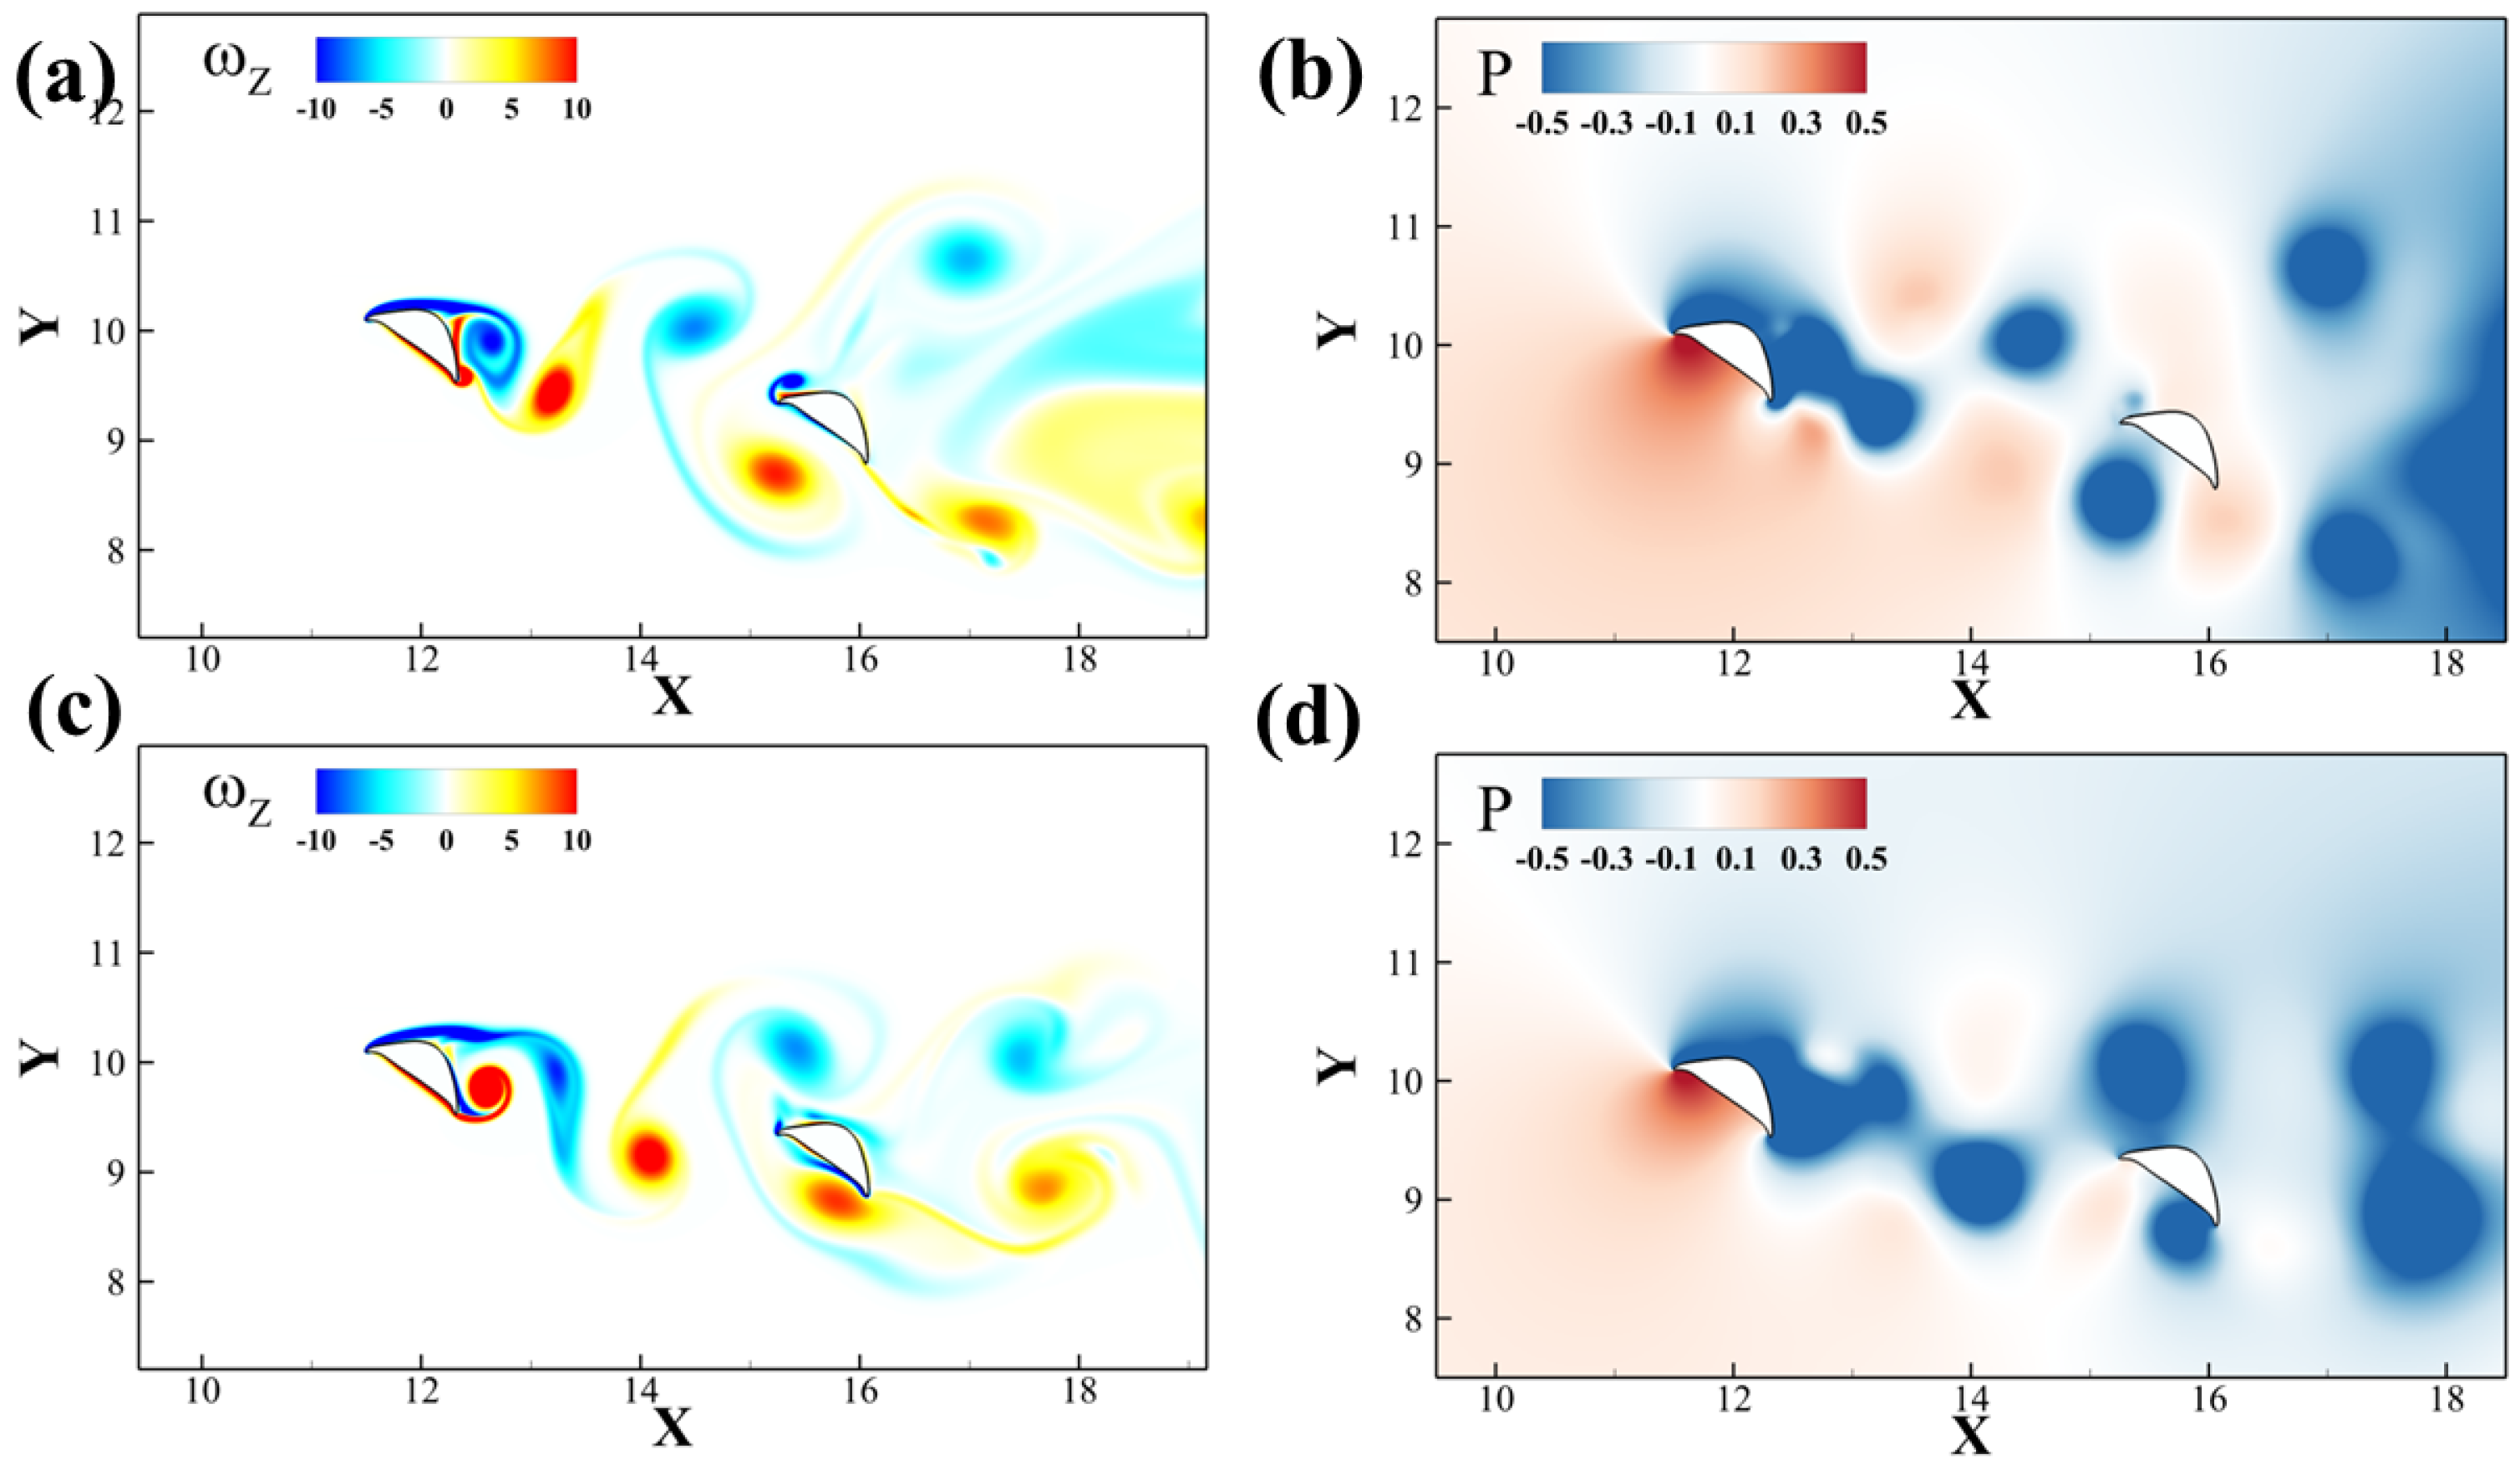
Figure 6a. We will pick the peak and trough lift production frame for further explanation about the vortex formation. As shown in
Figure 6b1, the upstream foil sheds
from the trailing edge and it propagates downstream. Meanwhile, the
and
formed on the edges provide two low-pressure regions, which are shown in
Figure 6b2. With the vortex
traveling downstream, it will reach the ventral surface of the downstream foil, inducing a negative shear layer, as shown in
Figure 6c1(inset). As shown in
Figure 6c2, the strong rotation of the shed
from the upstream foil creates a strong negative pressure region on the ventral surface of the downstream foil, explaining the low lift production at this instant. The low lift production does not necessarily mean a low lift-to-drag ratio performance since its drag is also small due to the forward-facing ventral surface of the downstream foil.
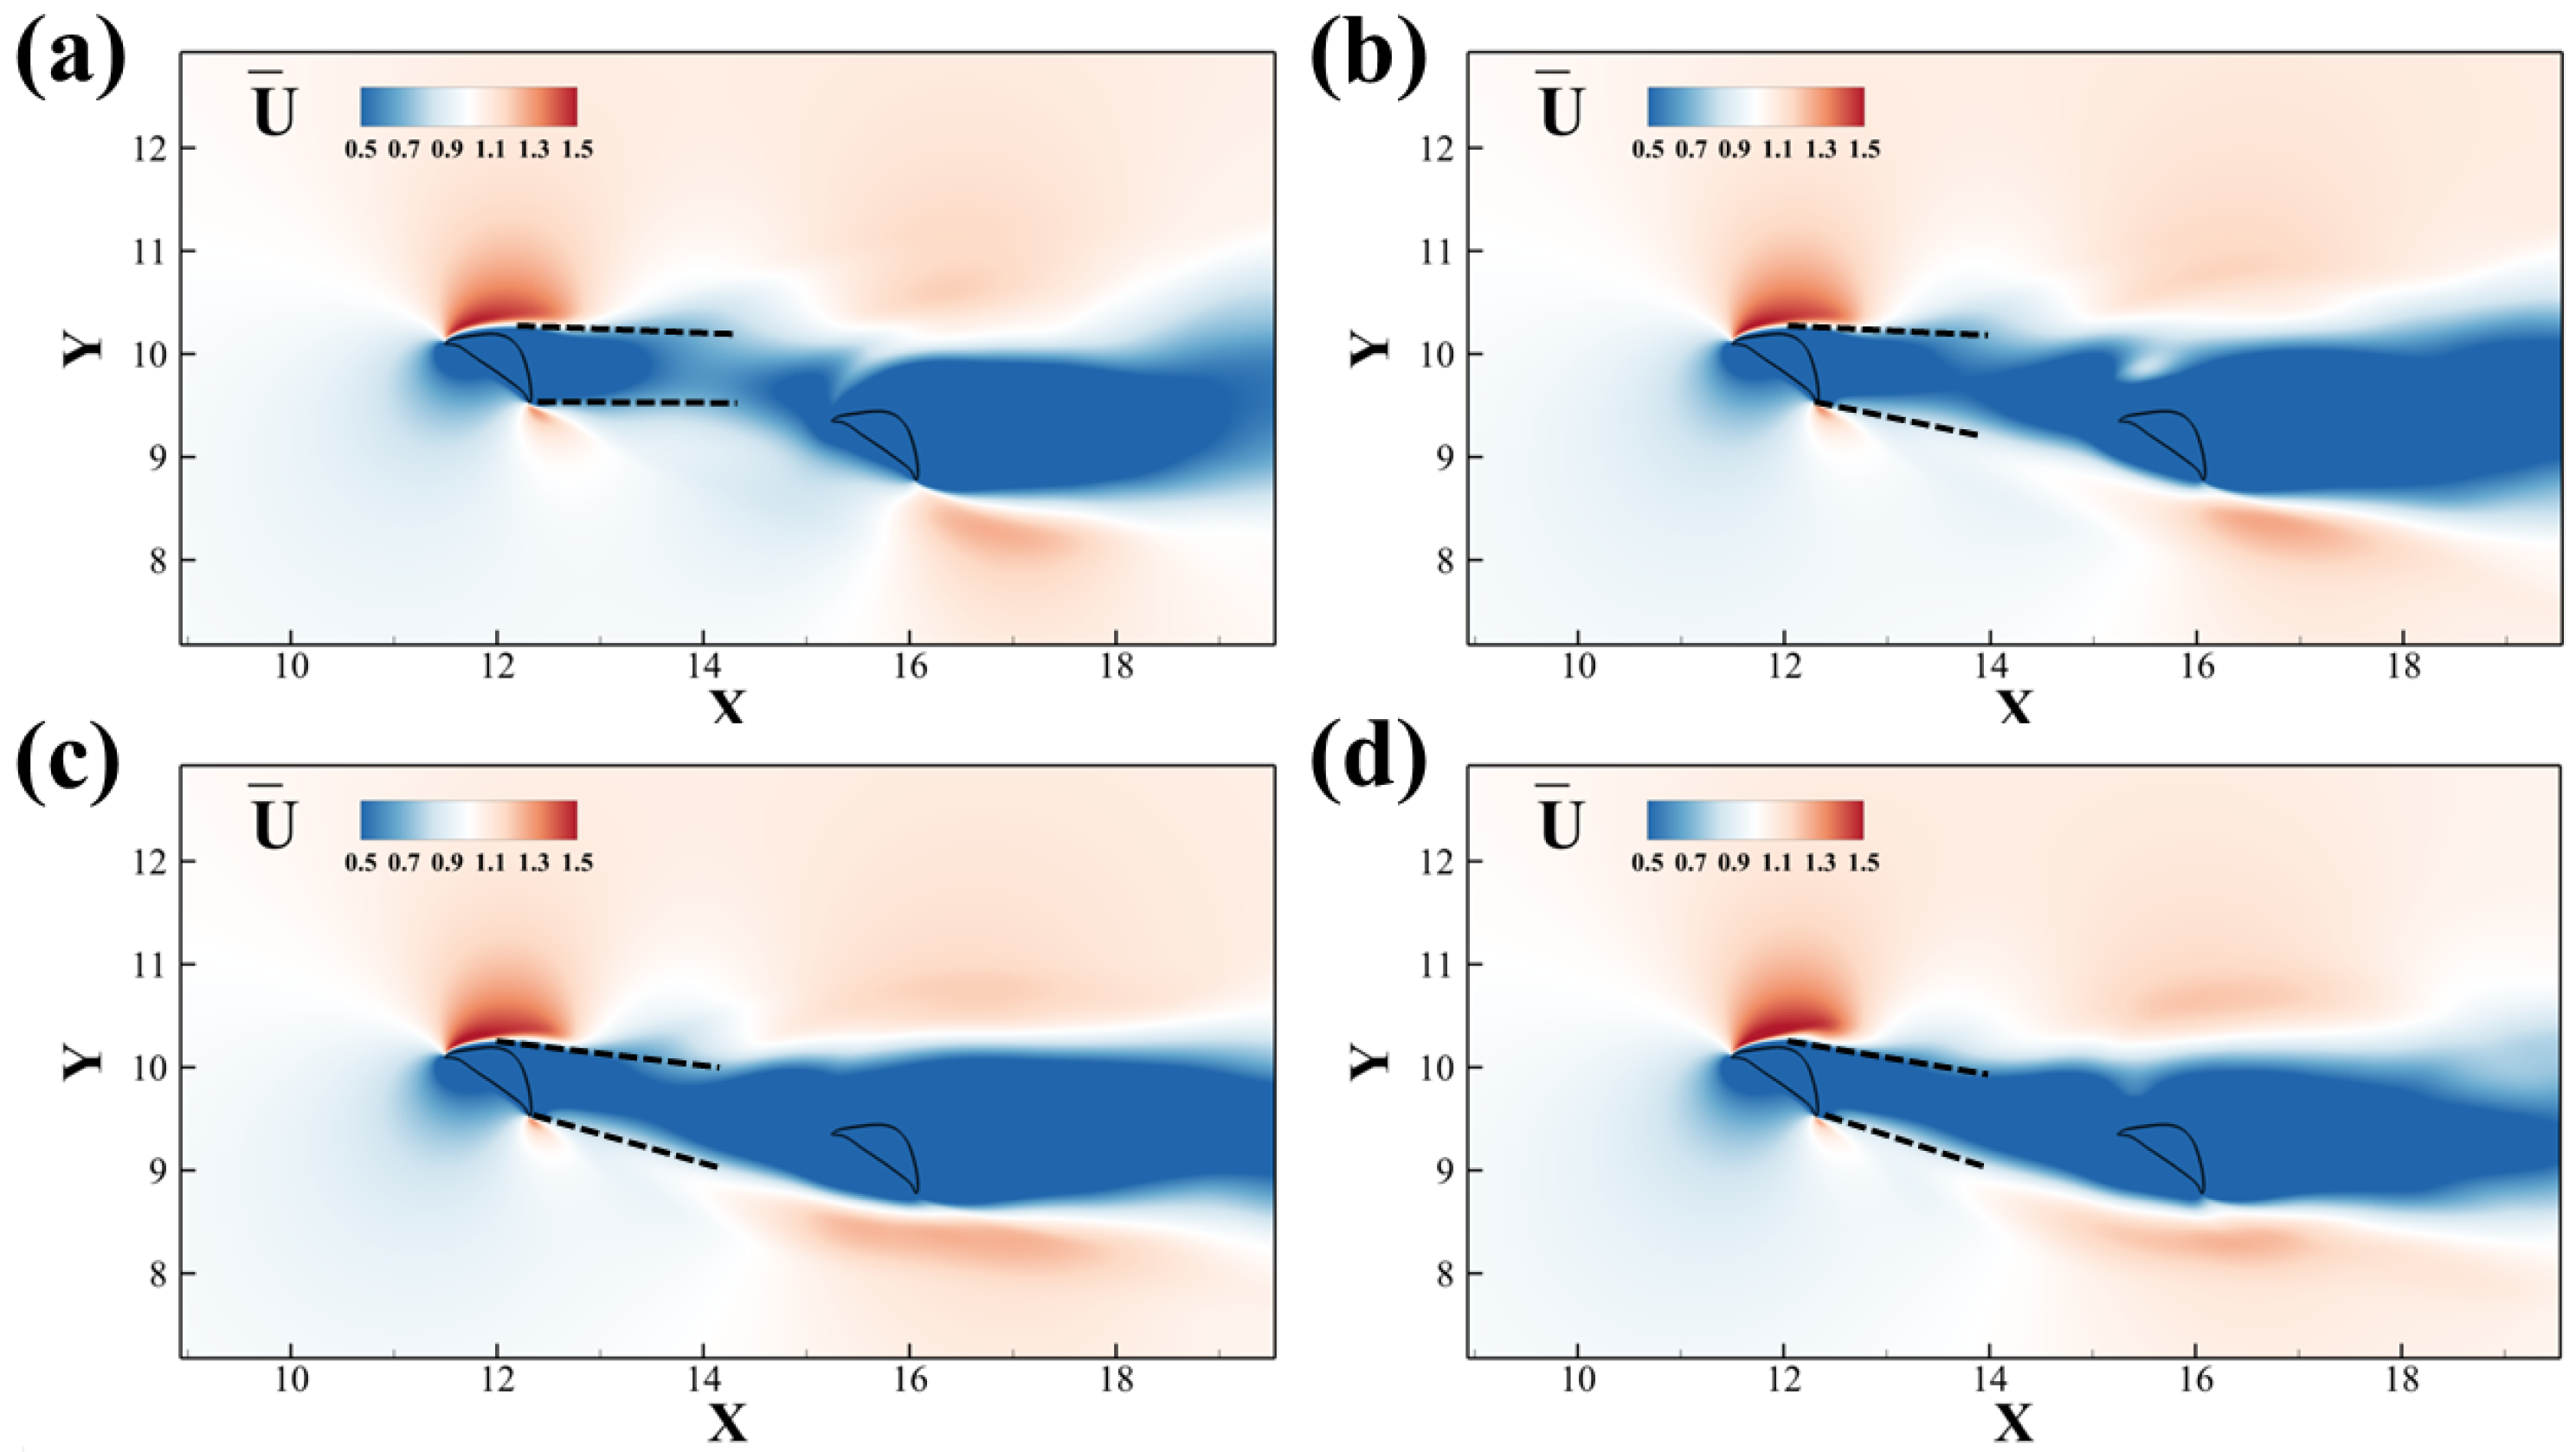
The time-averaged stream-wise velocity contour is presented in
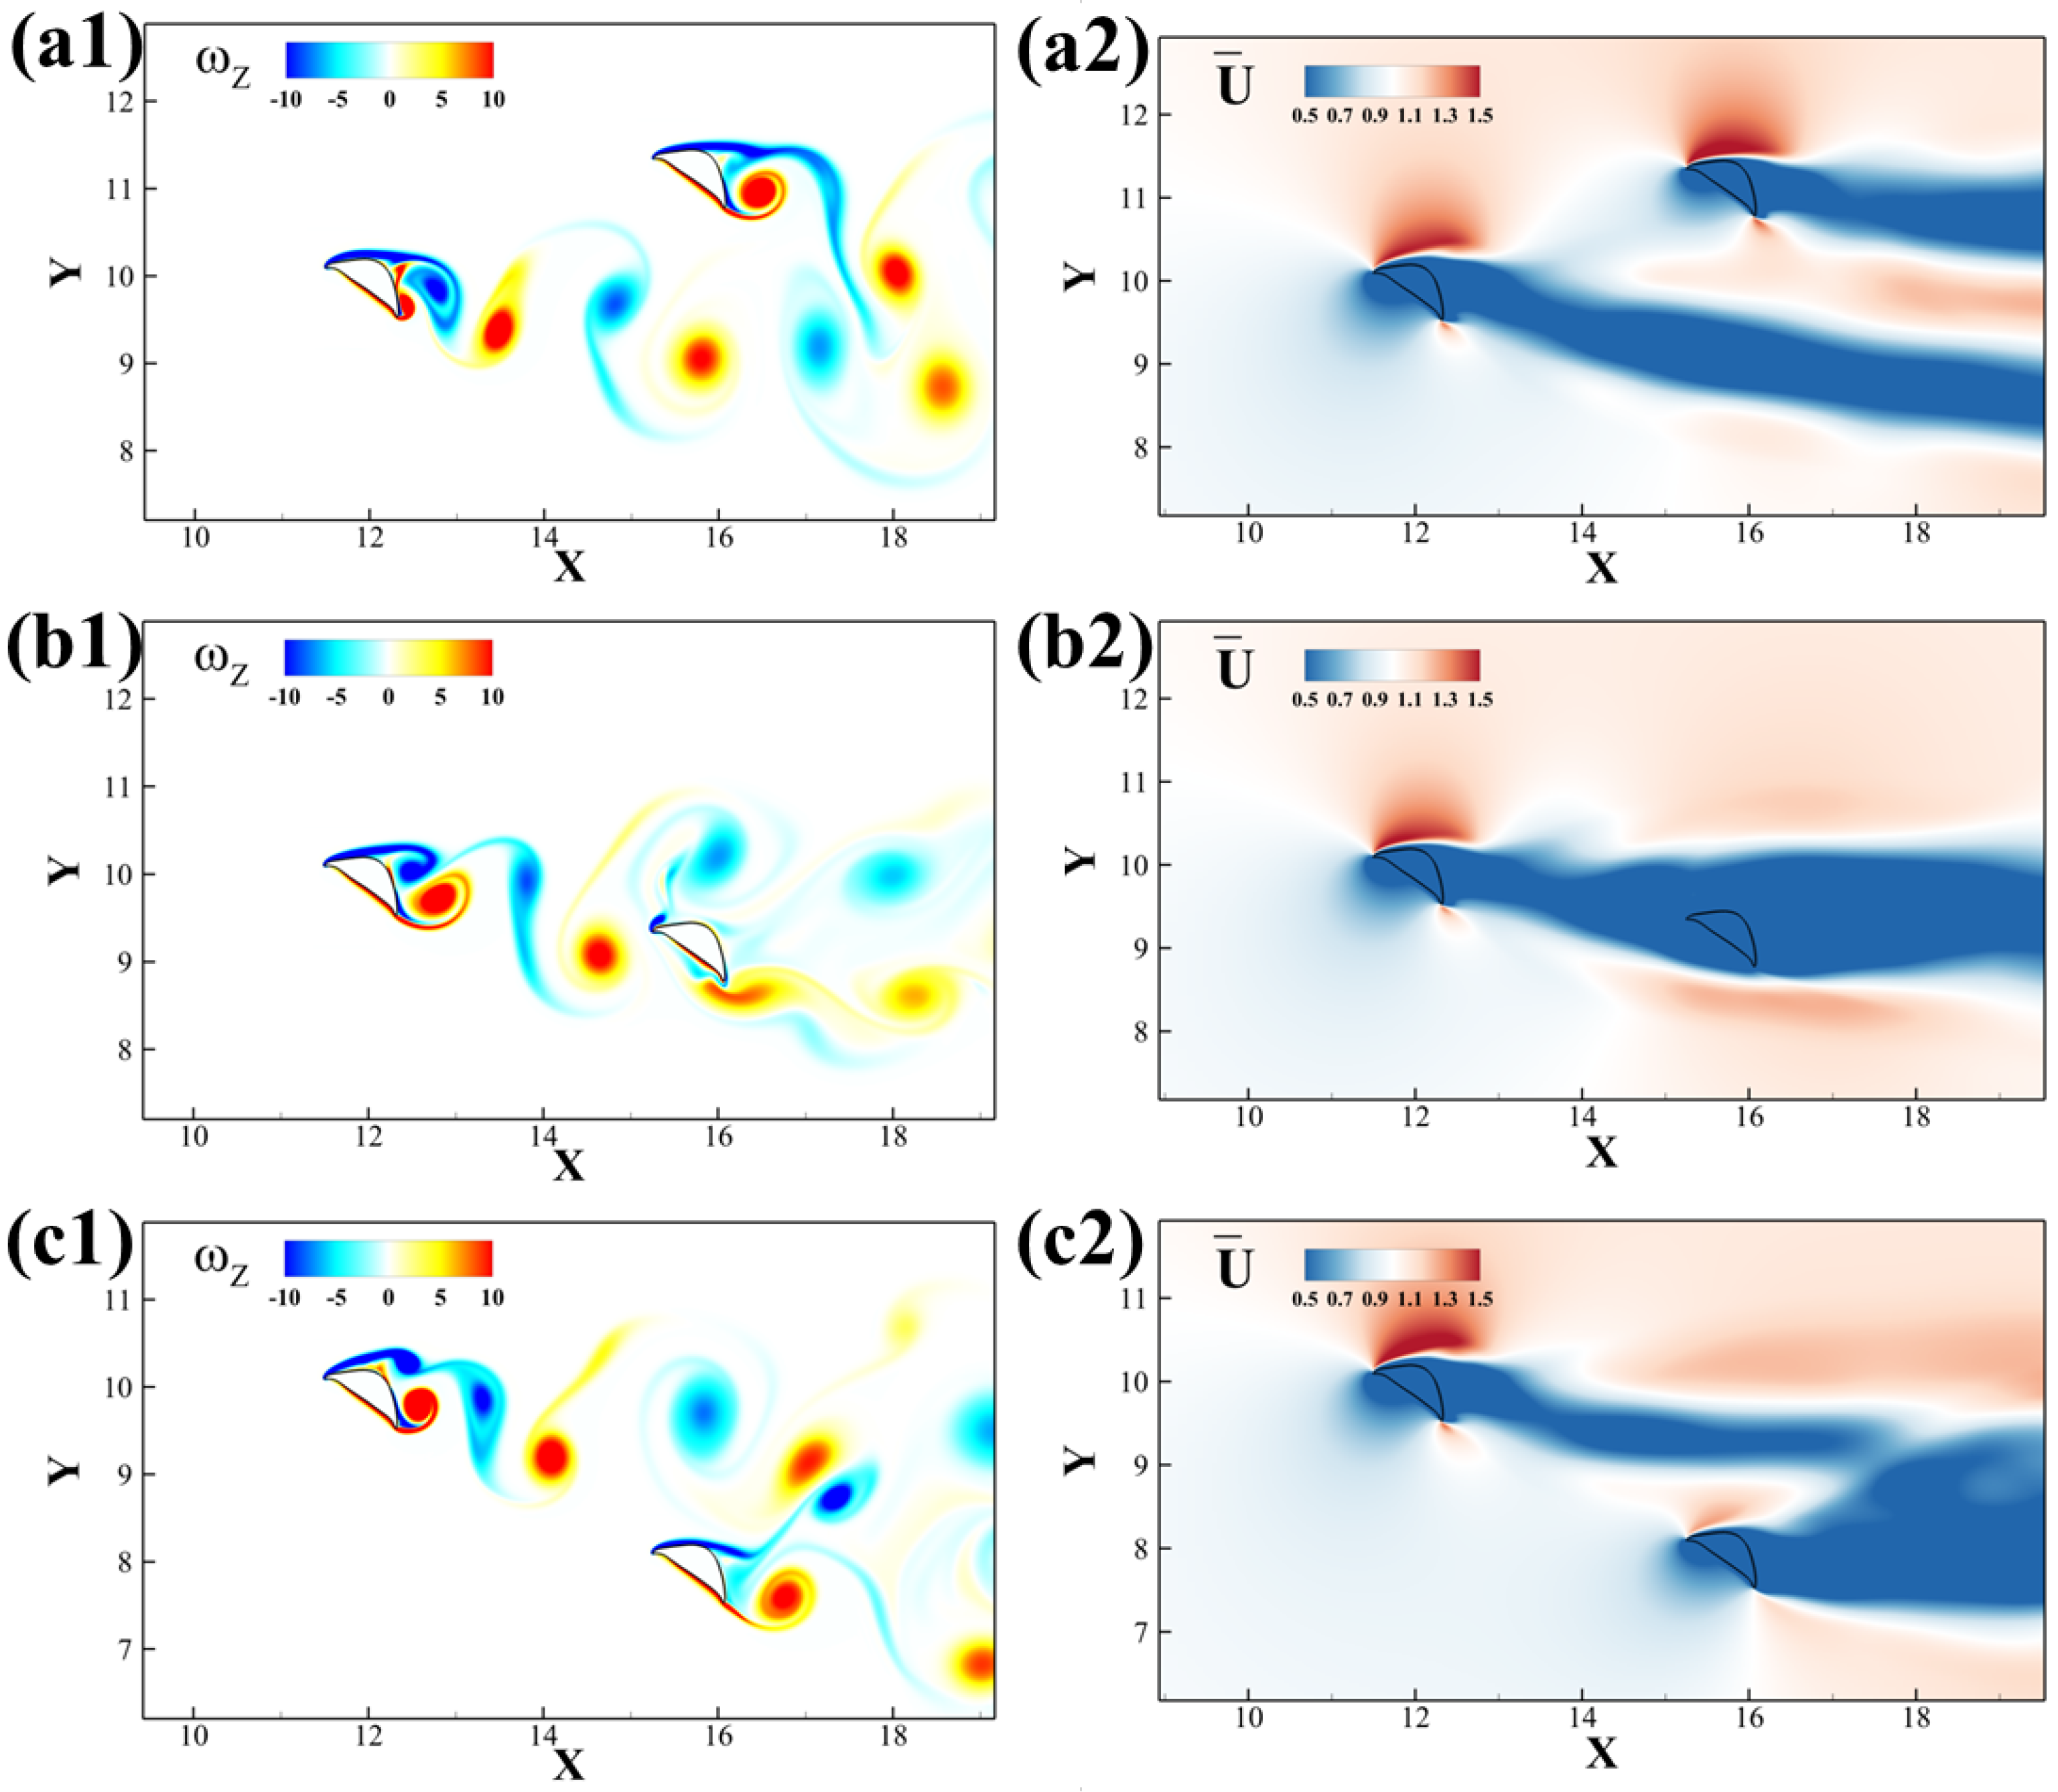
Figure 7 to investigate the relationship between different configurations. The upstream foil produces a drag-type von Kármán vortex wake, as shown in
Figure 7a1,b1,c1, and correspondingly, the streamwise momentum in the wake of the upstream foil is much less than that of the free stream, as shown in
Figure 7a2,b2,c2. As a result of the lift force production on the anterior foil, its wake exhibits a slight downward deflection. The cases with
ratios better than a solitary foil generally have the posterior foil inside the wake of the upstream airfoil. By taking advantage of the oncoming vortex wake, the downstream foil almost reaches zero drag, leading to a high
performance, as demonstrated in
Figure 7b1,b2. Cases with
less than that of a solitary foil, such as shown in
Figure 7a1,a2, have the posterior foil outside of the drag wake of the upstream foil, so not only is it encountering the full momentum of the free stream, but its lift production is also interrupted by the incoming vortex flow and the oscillating flow pressure.
Figure 8 summarizes the primary vortex structure for different configurations of the foils. As previously mentioned, the upstream wake is a typical von Kármán vortex street. When the downstream foil is positioned in the center of the wake, both the leading-edge vortex (
LEV) and trailing-edge vortex (
TEV) combine with vortices generated by the upstream foil. If the downstream foil is placed below the wake, the
LEV on its upper surface merges with the
TEV from upstream. Conversely, when the downstream foil is situated above the wake, the
TEV on its lower surface interacts with the upstream
LEV.
The wake information also explains the lift production in
Figure 5. The high lift production for upstream and downstream foils are found in
and
, respectively. Those are the positions where the wakes are separated. When the upstream foil is higher, it will experience the interaction and the force lifting it while the downstream foil’s lift reduces. The upper foil experiences a slightly higher lift while the lower foil experiences the counter force and reduces the lift. The same explanation holds when the upstream foil is lower and the downstream foil has a better overall performance. Nevertheless, when the wake merges into one, the downstream foil takes advantage of the wake and brings a higher performance in the lift-to-drag ratio, leading to higher gliding efficiency.
3.3. Effects of Reynolds Number
In this section, we focus on the effects of the Reynolds number on aerodynamic performance and vortex dynamics.
3.3.1. Aerodynamic Performance
The two-foil study is conducted at varying Reynolds number values.
Figure 9 shows the aerodynamic performance of the two foils in varying spatial arrangements given
.
Generally speaking,
Re = 500 and
Re = 1000 share a similar pattern in aerodynamic performance. When downstream foil is located in
, the lift production for upstream foil outperforms the solitary foil. But, the lift improvement for the downstream foil occurs for
, and the lift production for downstream foil is better than the solitary foil. The high
region for the downstream foil is still located in the wake of the upstream foil. By calculating the cycle average, it is shown in
Figure 9a3 that the lift production of the system is reduced due to the interaction. The lift-to-drag ratio, on the other hand, is raised when the downstream foil is located in the wake of the upstream foil. However, there are some differences that need to be noted. First, the average value of solitary foil is now
= 1.8276,
= 1.6078, which shows a similar trend as previous Reynolds number effect studies [
20,
21]. Second, the high
region’s width reduces, indicating that the strength of the wake fades. Also, the hot region shifts upward compared with the higher Reynolds number case, indicating a deviation in the wake due to changes in the Reynolds number, which will be addressed in the upcoming section.
3.3.2. Vortex Dynamics
In this section, we made a comparison between different Reynolds number cases to provide a better understanding of vortex dynamics and its relation to aerodynamic performance. We kept the exact configuration of = 3.75c, = −0.75c and altered the Reynolds number.
From the performance contour presented in
Figure 5 and
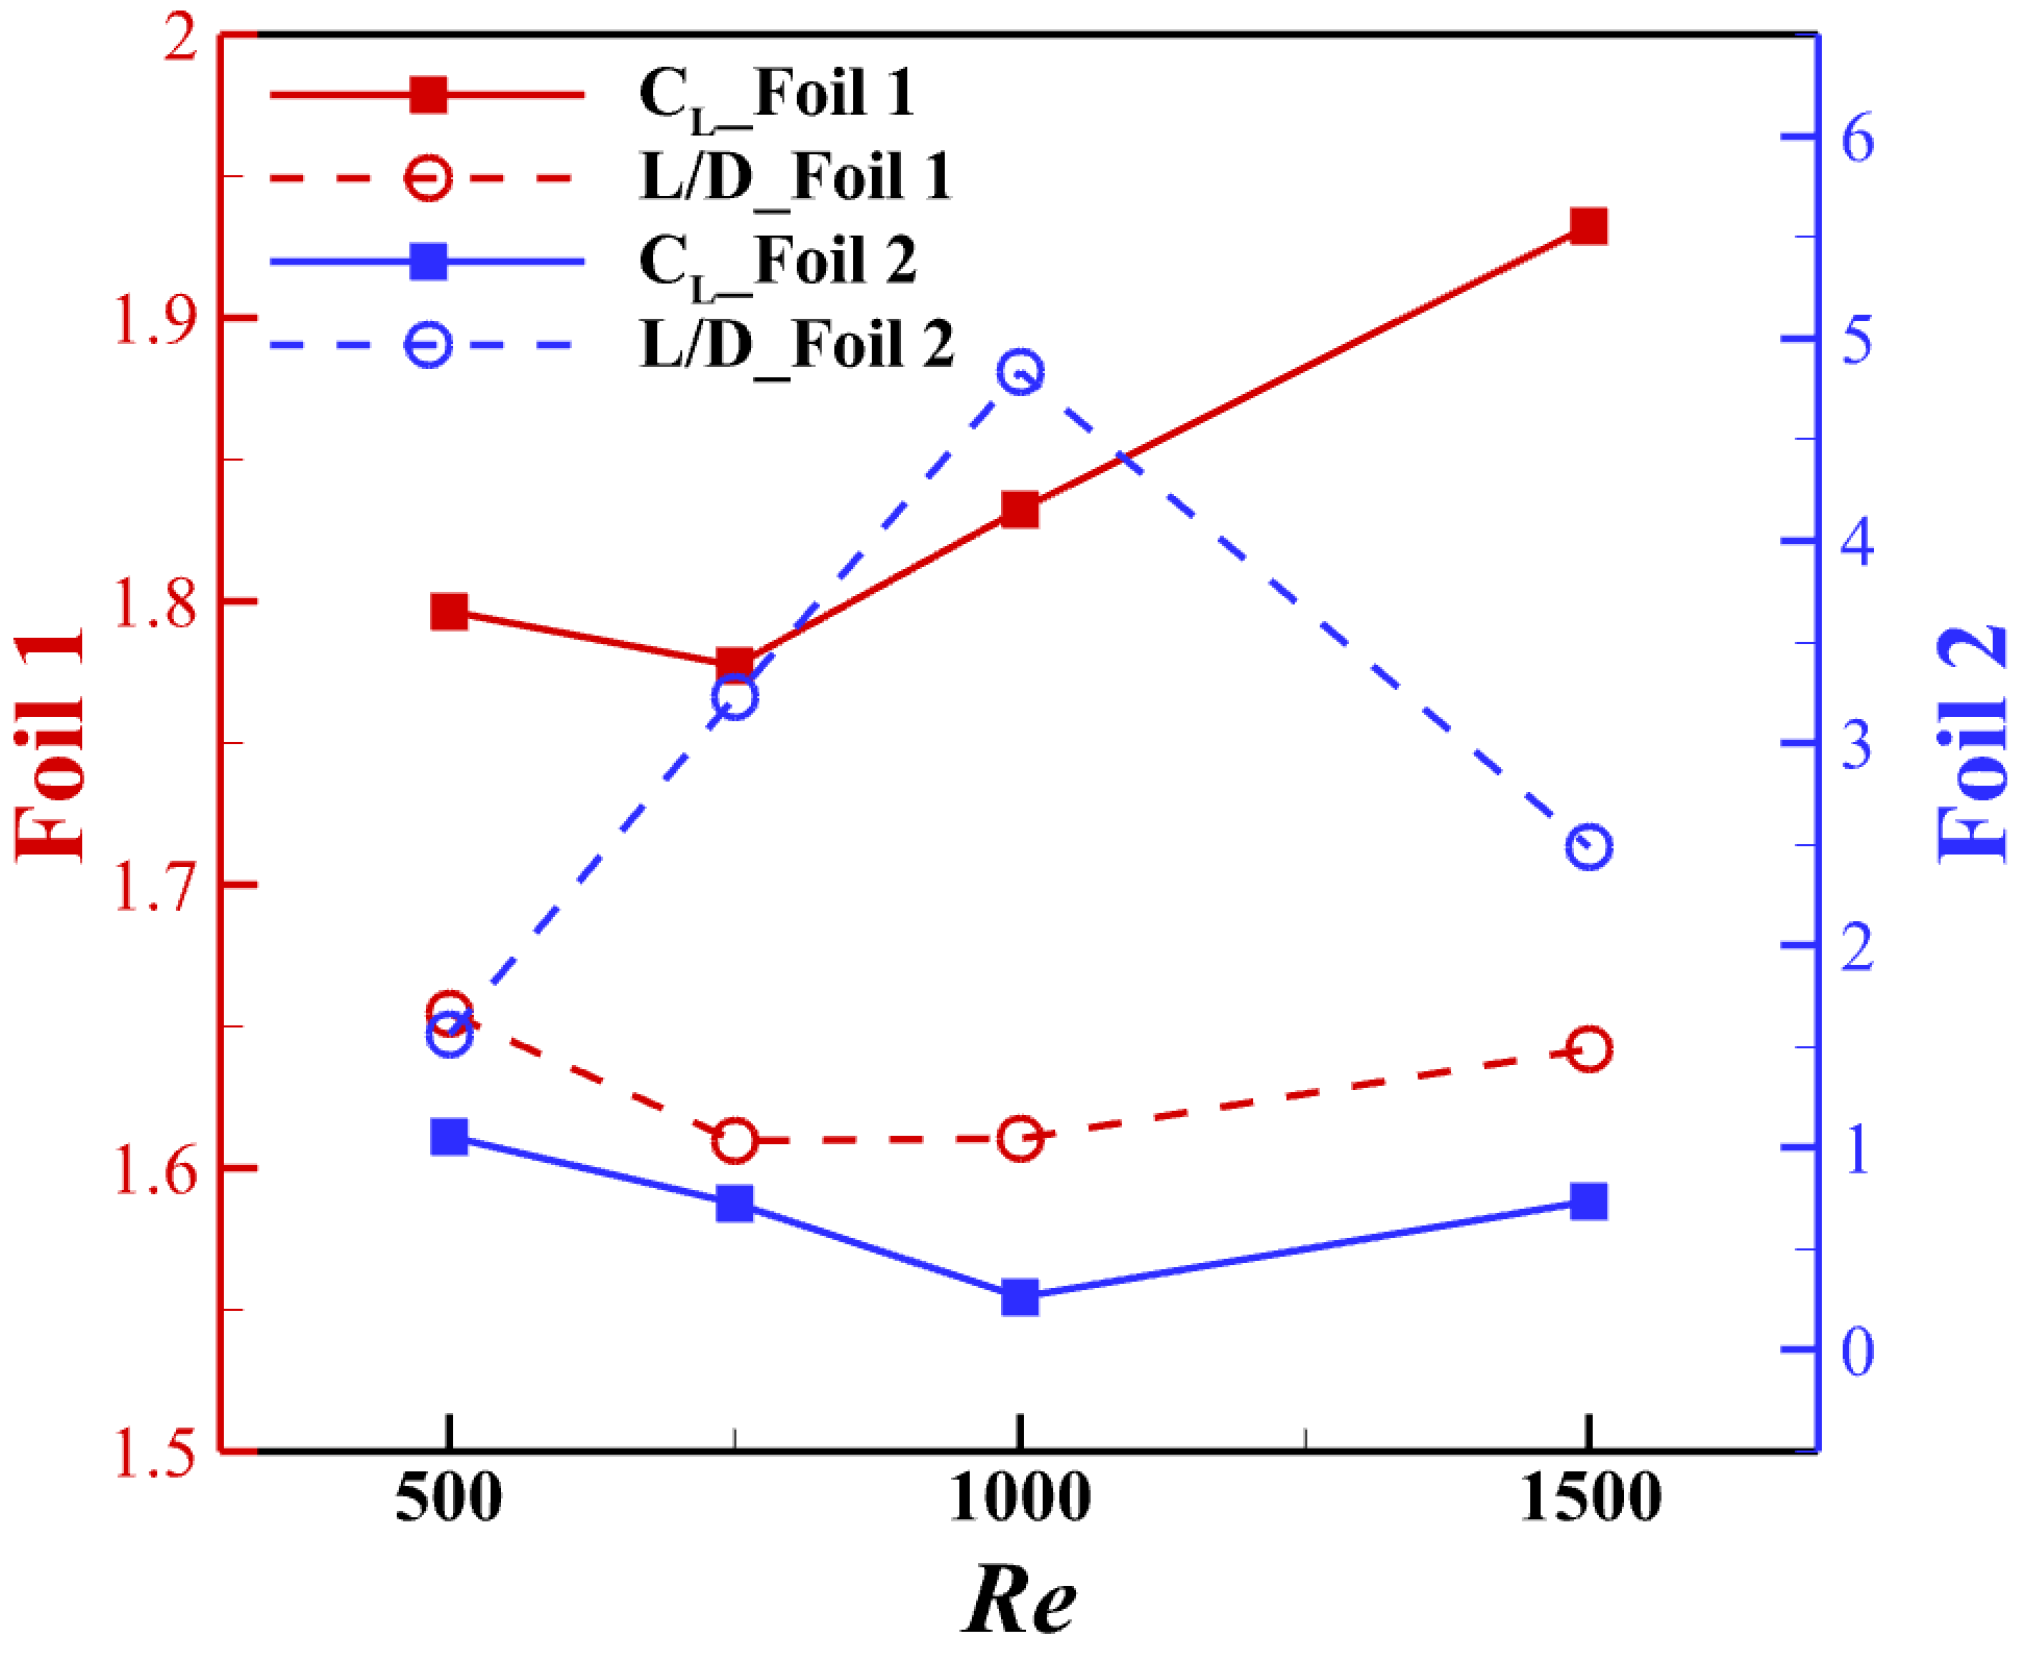
Figure 9, it can be predicted that with the Reynolds number increase, the lift production reduces in the wake region, yet the lift-to-drag ratio increases. Also, the wake region will shift slightly with the Reynolds number increase. The aerodynamic performance variation due to changes in the Reynolds number in this spatial configuration is presented in
Figure 10. From the results, it can be seen that for the best lift-to-drag ratio configuration at
Re = 1000, either increasing or decreasing the Reynolds number will affect the performance of the downstream snake foil, and the lift-to-drag ratio is affected more than the lift force. In summary, by adjusting the Reynolds number, the high efficiency (high
) region will shift downward when the Reynolds number increases. This further suggests that the vortex shedding direction may change and that a slight wake deviation occurs. We examine the reason behind this by analyzing the wake and vortex dynamics.
We present the time-averaged velocity fields in
Figure 11. The deviation angles of the wake from the upstream foil increase with the Reynolds number, which is indicated by the dashed line. A higher deviation angle corresponds with the lift production increase for upstream foil. The performance of the downstream airfoil is also highly related to the wake and vortex interaction, yet less explicit.
To further investigate the formation and interaction of the vortices near the downstream snake foil, the instantaneous vorticity contours at maximum lift production for different Reynolds number cases are presented in
Figure 12. In
Figure 12a1,b1,c1, the
meets the leading edge of the downstream airfoil. Different Reynolds numbers have slightly different angles of incidence and initial position, leading to different vortex–wedge interaction patterns. In
Figure 12a2, the
collides with the wedge (leading edge) of the downstream foil, inducing the shedding of the
LEV of the downstream foil, and then travels with it as a vortex pair over the dorsal surface. Tucker et al.’s work [
41] provided similar vortex–wedge interaction profiles. By shifting the initial position of the vortex downward with the increasing Reynolds number, the vortex breakdown switches from the dorsal surface to the ventral surface, which happens in
Figure 12b2 at
Re = 750. As a result, the
distorts and merges with the shear layer on the ventral surface. At a higher Reynolds number
Re = 1500, the
advects downstream without breaking down at the wedge.
Figure 12c2 shows that it maintains its shape before merging and interacting with the
generated at the trailing edge of the downstream foil. Similar trends of position shift along with vortex breakdown have been summarized in Refs. [
42,
43].
3.4. Effects of the Dynamic Motion
In this section, the effects of the dynamic motion of the downstream snake airfoil on the system’s hydrodynamic performance and wake evolution are investigated. As described in the methodology section, dynamic pitching is applied to the downstream foil according to Equation (
1). Here, we investigate the effect of varying pitching amplitude and pitching frequency.
3.4.1. Effect of Pitching Amplitude
The pitching amplitude determines the angle of attack range of the trailing foil. As shown in Equation (
1), the
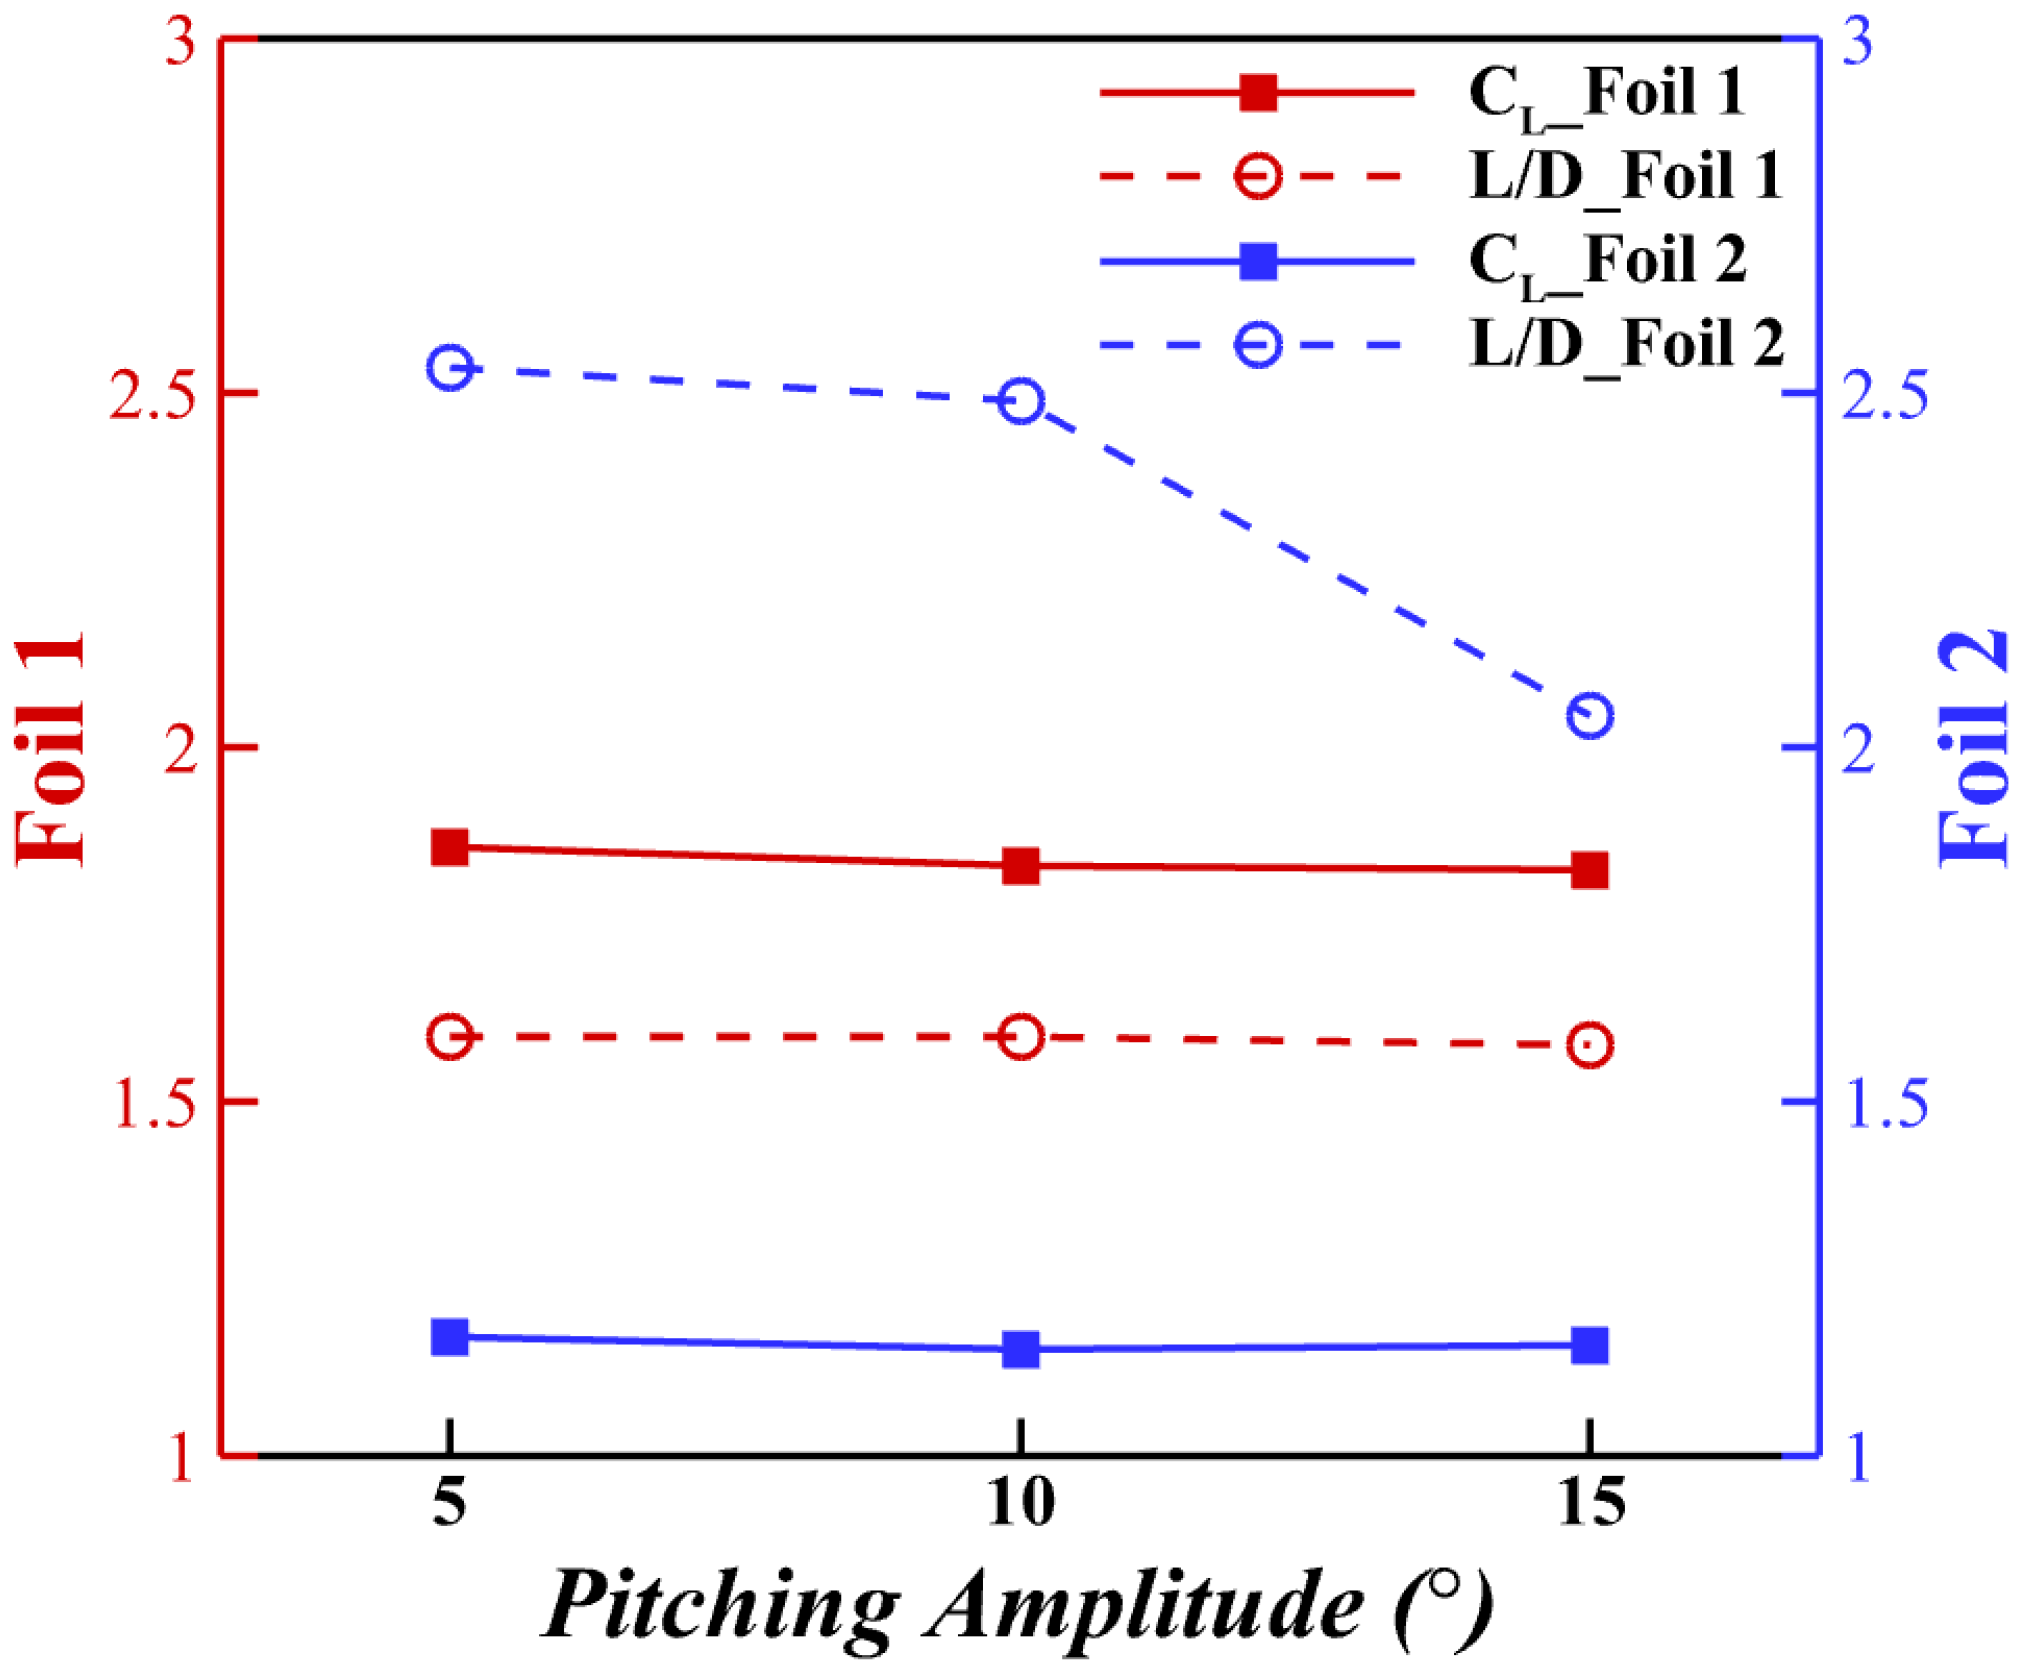
AOA for posterior airfoil can vary cyclically. The lift and drag force coefficients of varying pitching amplitudes are presented in
Figure 13. As the pitching amplitude increased, the lift production on both foils decreased due to the onset of stall. This holds for the optimal
; either increasing (pitch up) or decreasing (pitch down) the
AOA will worsen the lift production.
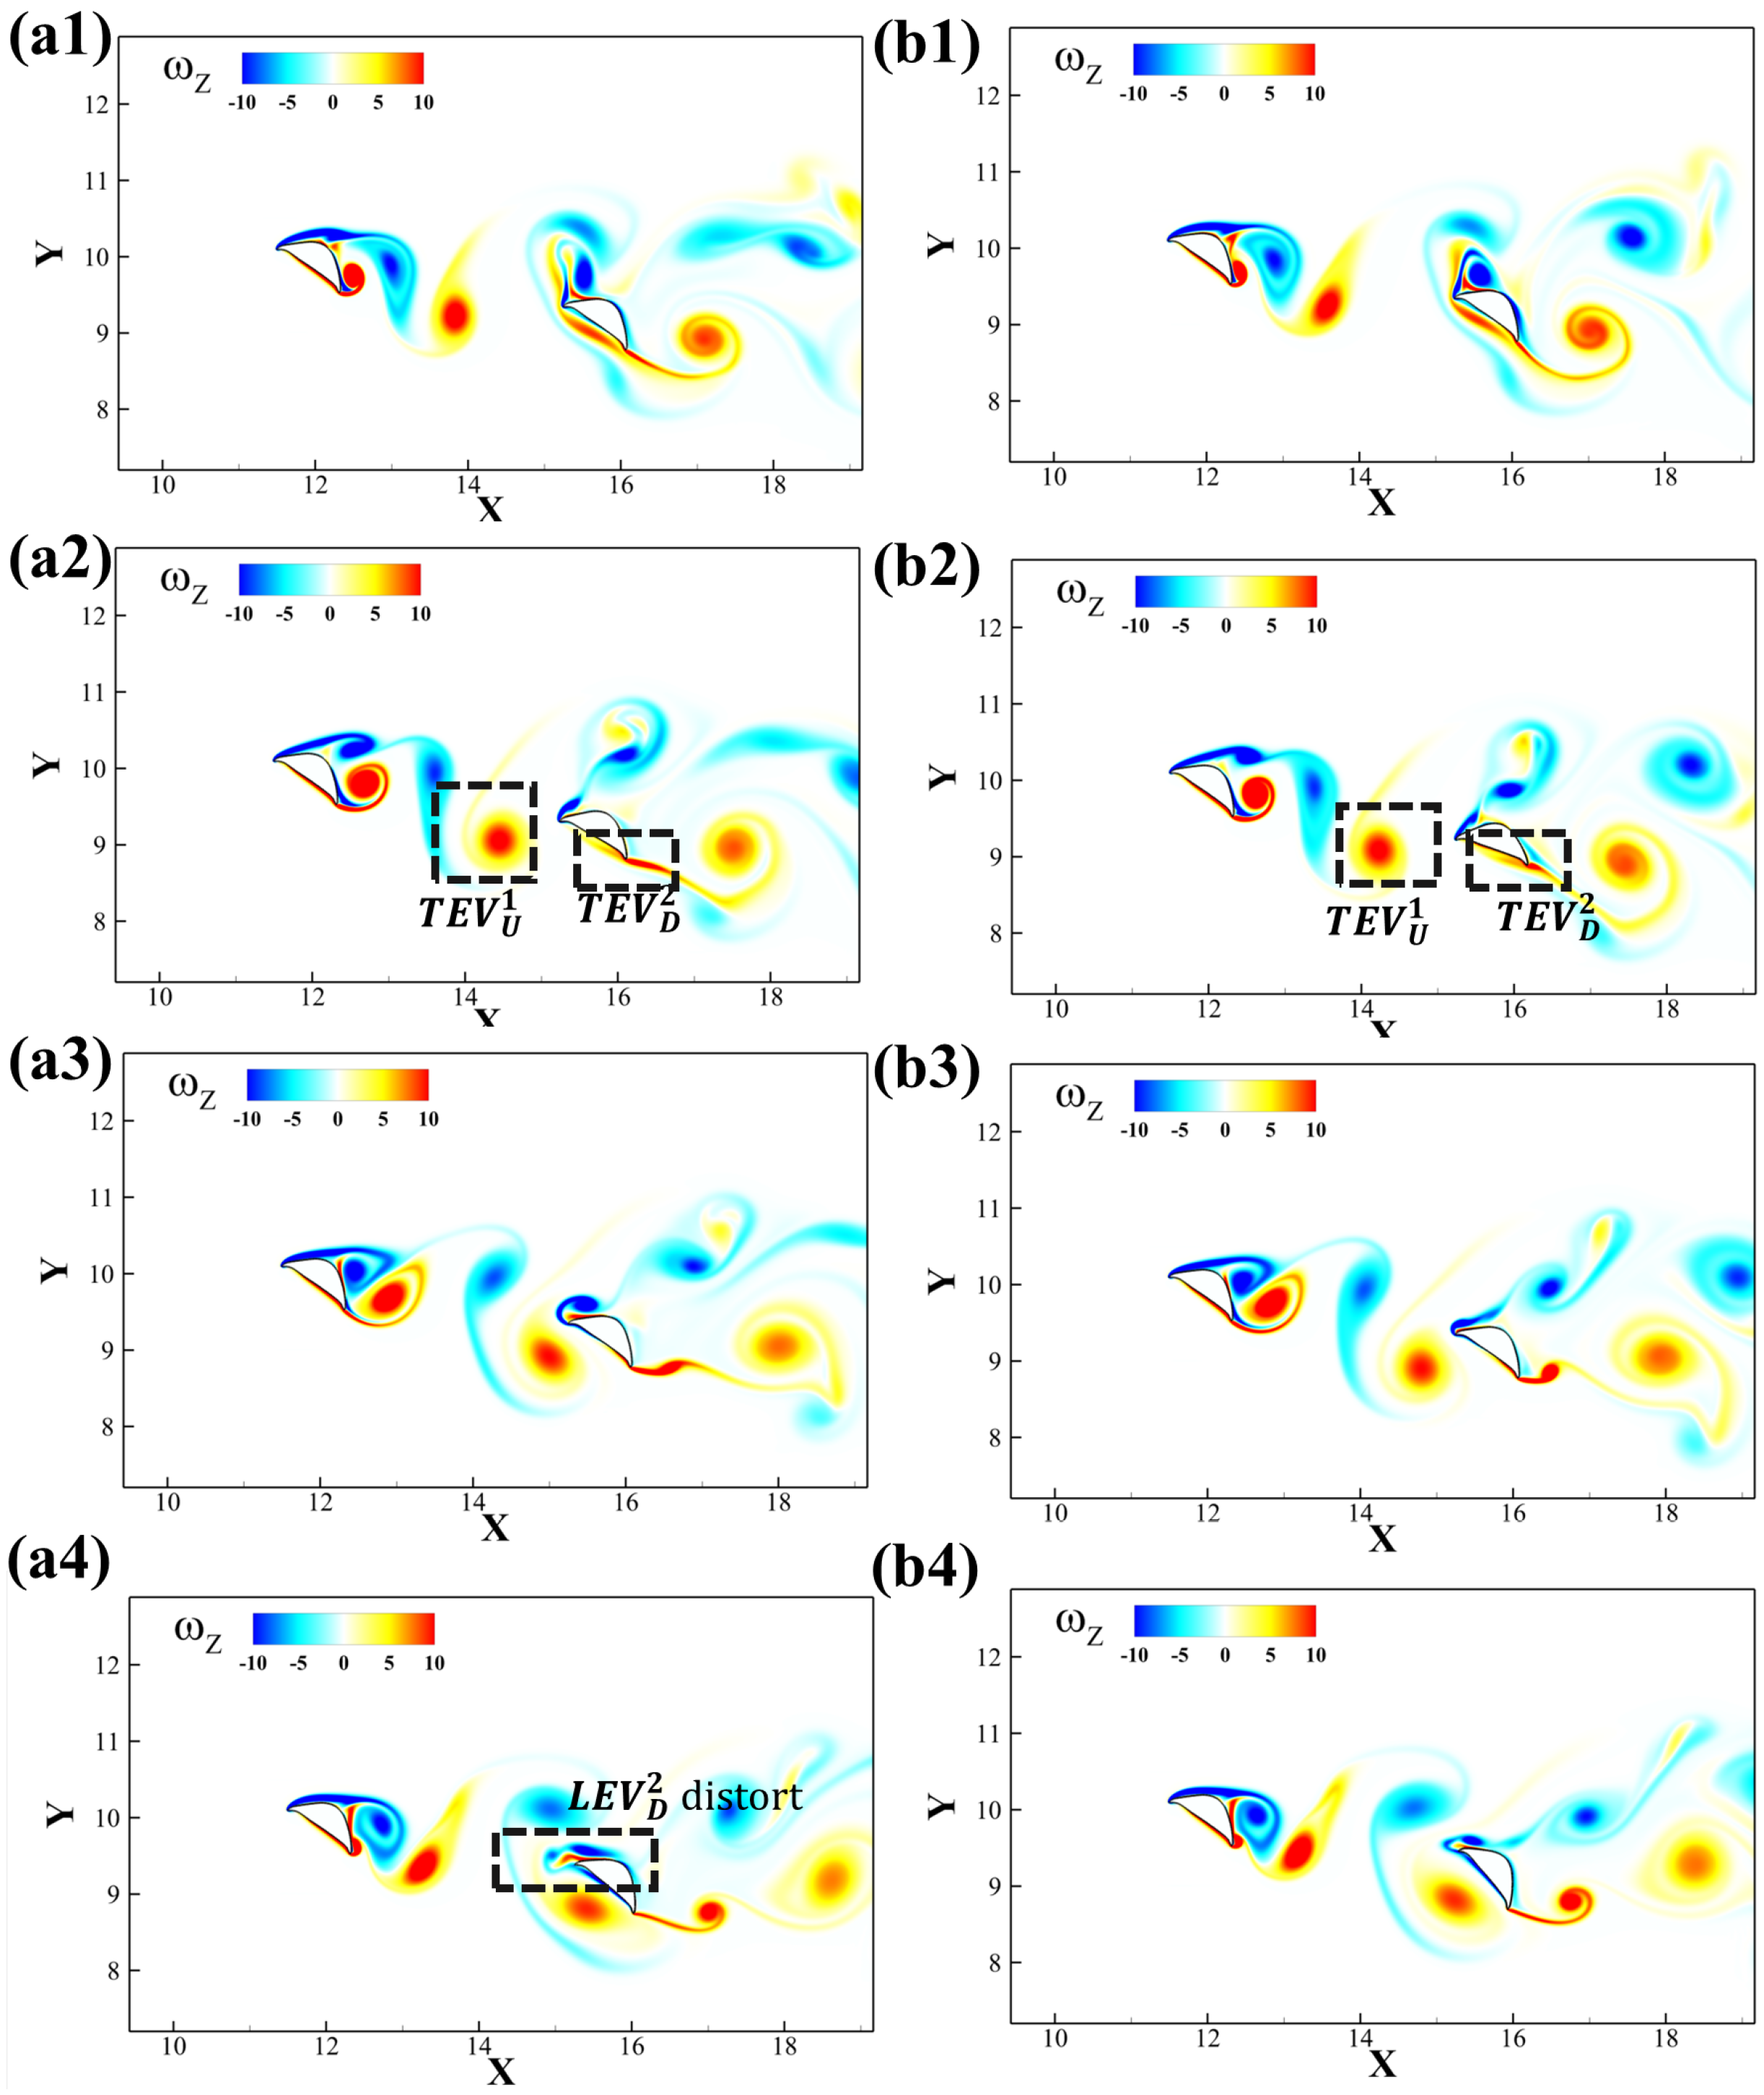
The vortex interaction becomes more complicated due to the introduction of the posterior foil’s pitching motion. A time sequence of the vortex shedding and capture is shown in
Figure 14. The introduction of the dynamic pitching leads to the dynamic variation in the
AOA on the downstream foil. The mean
AOA = 35° provides maximum lift as well as the transition of the vortex generation [
21]. As the geometric angle of attack of the downstream foil continues changing, so does the incident angle of the foil wedge relative to the upstream wake.
Figure 15 presents the vortex formation process at different amplitudes 5° and 15°. When the amplitude is small, the leading edge of the downstream foil collides with the upstream
TEV while when the amplitude is large, as its leading edge would collide with the upstream
LEV.
In
Figure 14a2,b2, the
advects downstream to the ventral surface of the downstream foil. Due to different amplitudes,
at a low amplitude breaks down into a thin layer, yet a high amplitude forms a compact vortex. Also, in
Figure 14a4,b4, the
merges with
, yet the
distorts and stretches in a low-amplitude case.
3.4.2. Effect of Pitching Frequency
In this section, the pitching frequency of the downstream foil is changed. According to the following definition:
we conducted the simulation using
T = 1 ∼ 6. The time period also corresponds with the simulation time. The force history shown in
Figure 3 shows that the solitary foil vortex shedding period is
T = 3.2 using FFT. However, with the introduction of downstream foil, the period rises to
T = 4 for the upstream foil. According to previous studies [
24], phase change affects the interaction between tandem foils. Therefore, the frequency variation will affect the vortex formation and interaction accordingly.
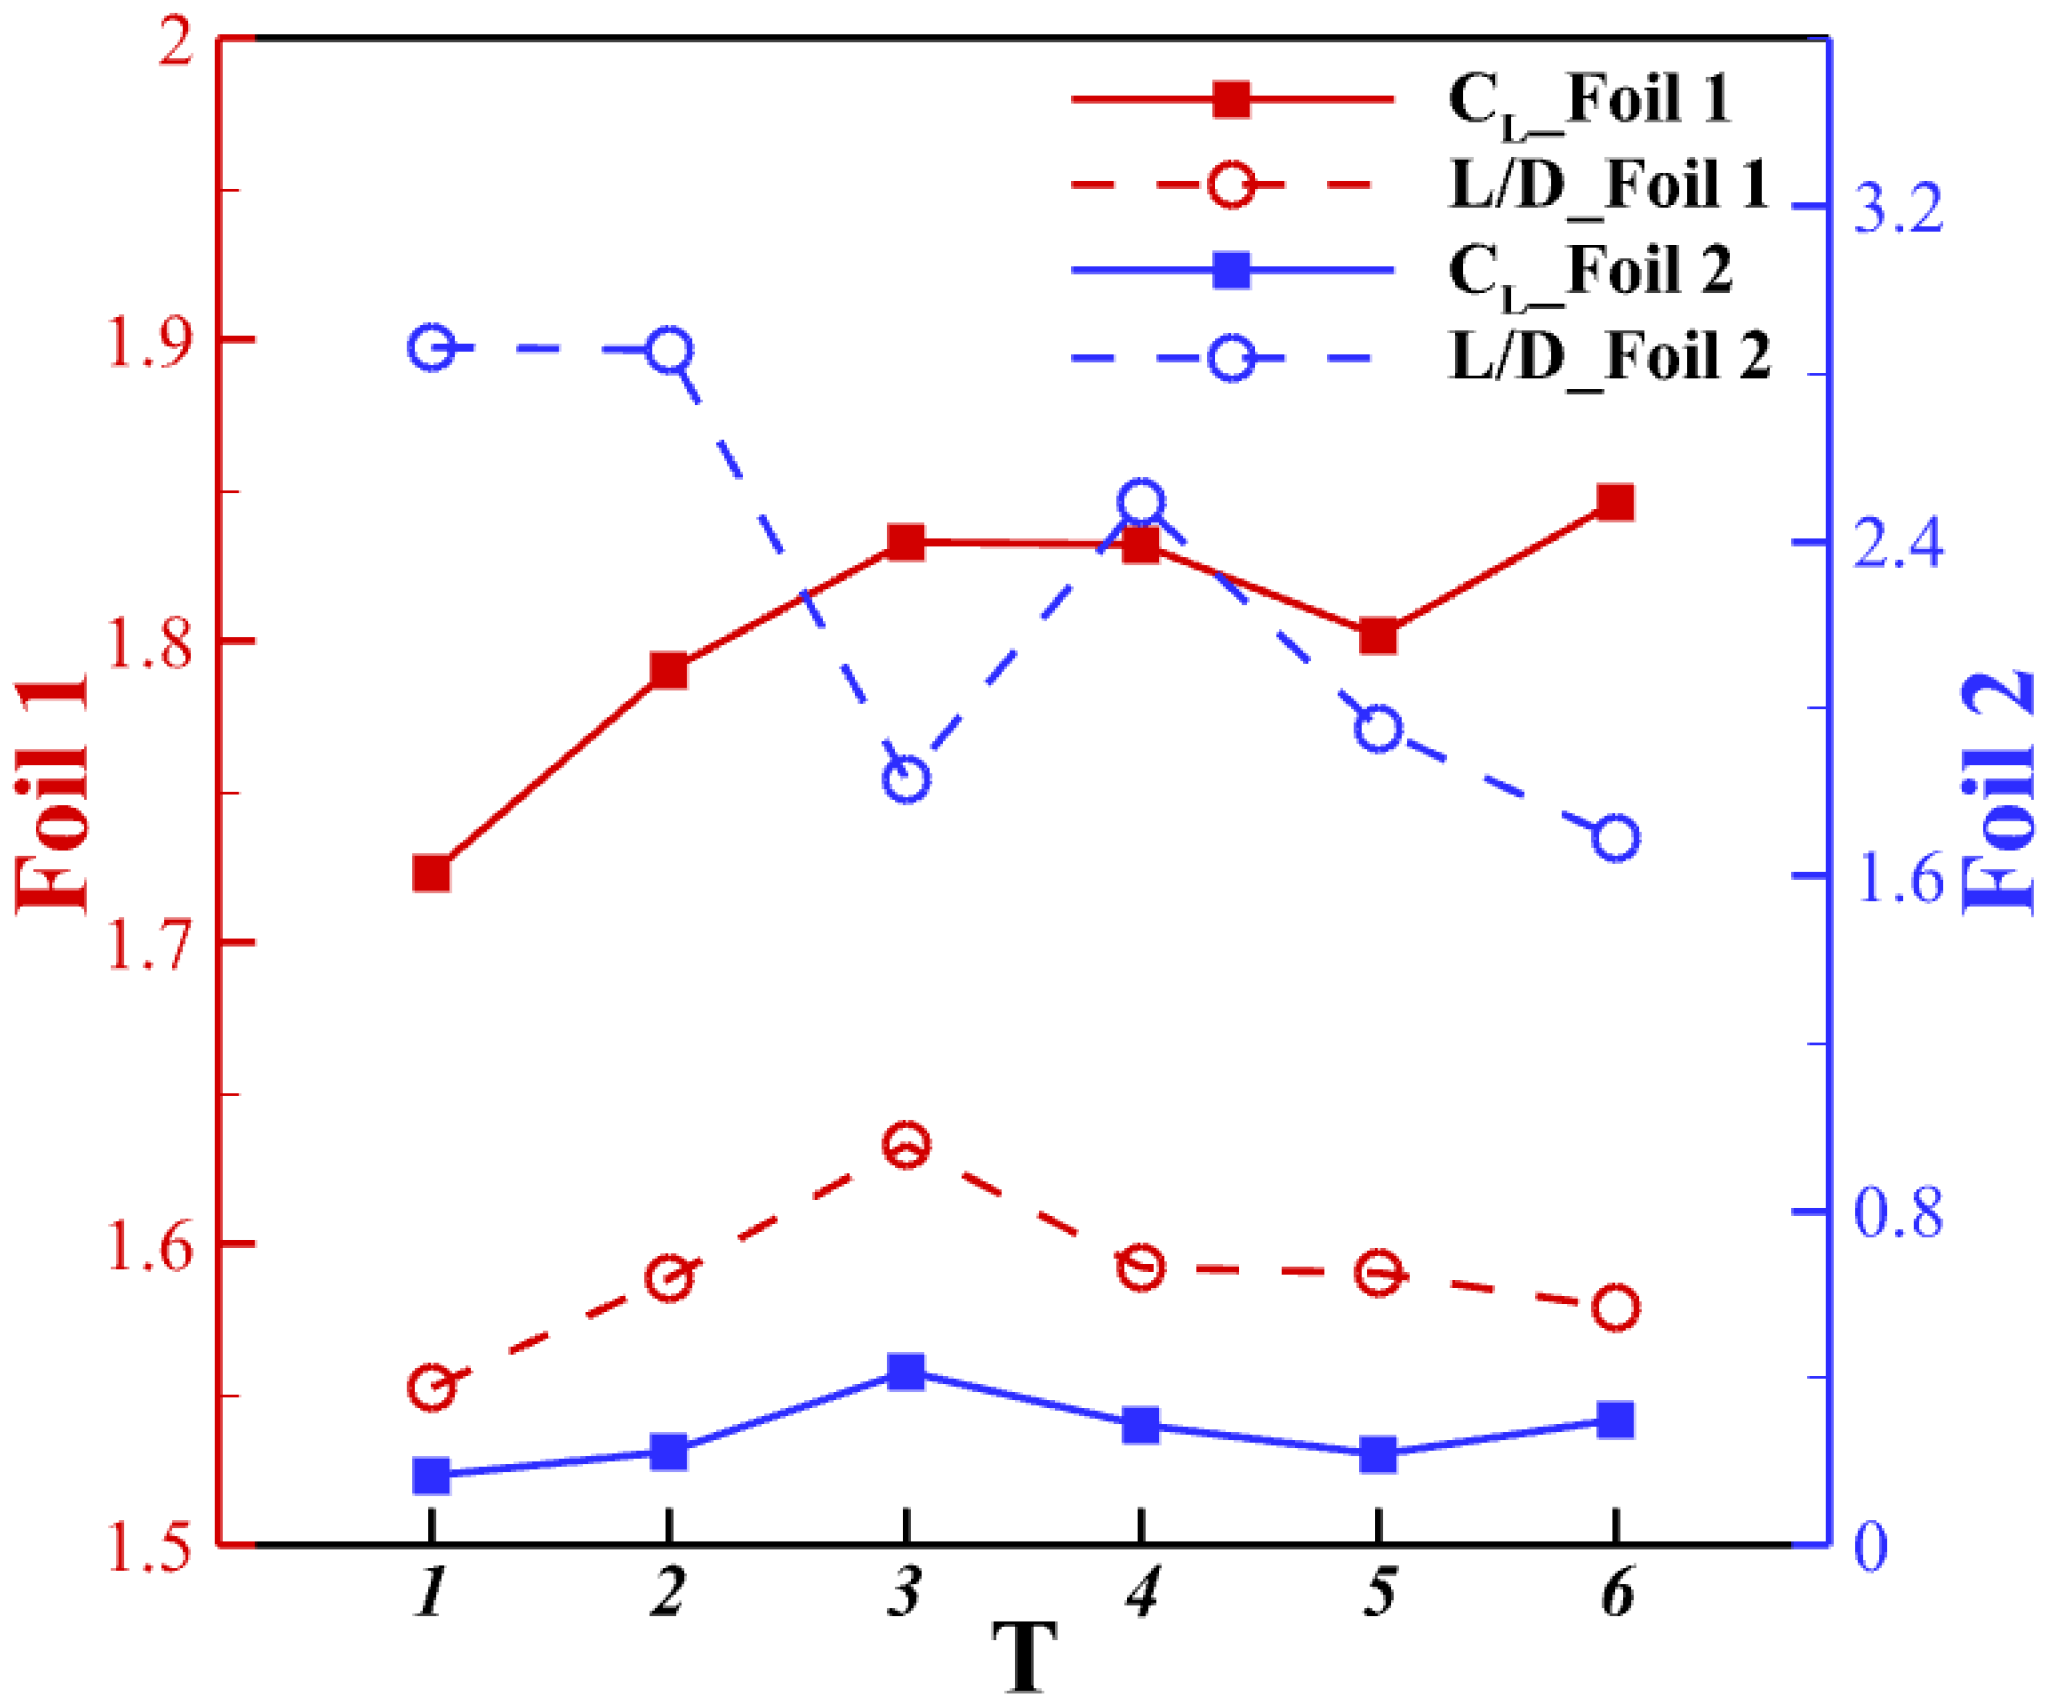
The time-averaged aerodynamic performance is presented in
Figure 16. It is observed that for the upstream foils, the lift production and the lift-to-drag ratio will be affected by the interaction with the downstream airfoil, but only within 5 %. The downstream airfoil’s performance changes significantly with the pitching frequency. At
T = 3, when the pitching motion is synchronized with vortex shedding from the upstream wake, it will provide a high lift production.
Figure 17a shows the differences in vortex patterns for different frequencies, at their respective instants of peak lift production.
Figure 17c shows a different pattern by comparing the same time frame of peak lift for downstream foil. In
Figure 17b,d, the pressure contour near the upstream foil shows a similar pattern of strong negative pressure on the dorsal surface in both pitching frequencies, yet the pressure difference is higher at
T = 3 since the upper surface does not have a low-pressure region. For the downstream foil, the pressure difference of the
T = 3 is more considerable, thus leading to the 93% increase in lift production compared with
T = 5.
The vortex interaction contributes not only to lift production but also to the lift-to-drag ratio. At T = 1, 2, and 4, the ratio of the downstream foil reaches a higher level than others. The picked-out cases show integer multiples of pitching frequency, where the vortex interaction is synchronized with each other.
4. Conclusions
This paper presents a numerical simulation of a tandem airfoil model inspired by the body cross-section of a flying snake. A comprehensive investigation was conducted on the aerodynamic performance of both the upstream and downstream airfoils. We examined various parameters, including the relative position configuration, Reynolds number, and the effects of dynamic motion. Our detailed analysis revealed the structure of the vortices, which consists of the leading-edge vortex (LEV) and trailing-edge vortex (TEV). Additionally, we studied the interaction between the wakes of the tandem airfoils.
Compared to a solitary snake airfoil, the performance of a two-foil system is significantly influenced by the relative positions of the foils under all conditions considered. For the upstream foil, the changes in performance are relatively minor; it can either outperform the solitary foil in terms of lift production when the downstream foil is lower than the wake of the upstream foil, and the of the upstream foil varies very little. In contrast, the downstream foil experienced a substantial decrease in lift when positioned in the wake of the upstream foil. However, this configuration leads to a big increase in the lift-to-drag ratio corresponding to greater gliding efficiency. Specifically, the downstream foil experiences a lift reduction of 86.5% and a drag reduction of 96.3%, resulting in a 377% increase in the lift-to-drag ratio compared to a single foil. Overall, the performance of the entire system reflects a similar trend to that of the downstream foil, as it exhibits much greater variation than the upstream foil.
The results from a flow field analysis indicated that the lift-to-drag ratio of the downstream foil is maximized when it is positioned in the wake of the upstream foil. The interaction between the vortices leads to a reduction in both lift and drag production, as the pressure difference between the upper and lower surfaces decreases significantly when the captured vortex breaks down and merges with the ventral surface. As a result, the posterior body of the snake sacrifices lift production in order to achieve greater efficiency while gliding.
Further research on the Reynolds number effects revealed that the flow structure remains similar as the Reynolds number increases. However, this change primarily affects the strength of the vortices and causes a deviation in the wake. As the Reynold number increases, the best-performing parametric region shifts downward (resulting in a decrease in ), necessitating a corresponding adjustment of the downstream foil to optimize its performance.
The performance of the two-foil system was enhanced with a downstream foil that undergoes dynamic pitching. This study also examines both the aerodynamic performance and vortex dynamics of such a system. The aerodynamic performance and the corresponding vortex wakes change with the change in the foil pitching amplitude and frequency due to the phase modification of vortex capture. As the shed vortex moves downstream toward the posterior foil, the motion of the foil leading edge alters the interaction pattern between the vortex and the wedge (the foil leading edge), which depends on the phase of the motion. When the vortex shedding aligns with the dynamic pitching motion, lift production increases through the introduction of movement at the appropriate amplitude and frequency. However, the efficiency decreases at the cost of overall performance.
The two-dimensional model simplifies the complex three-dimensional motion of snake gliding and neglects critical effects such as lateral undulations, body torsion, and vortex structures, which may influence aerodynamic forces and stability. However, despite this limitation, this study provides valuable insights into the tandem airfoil gliding mechanisms of flying snakes, laying a foundation for optimizing gliding postures. Moreover, the simplified framework allows for the incorporation of posterior body dynamics observed in real snake gliding, making it a more canonical problem and enhancing our understanding of the two-foil system. This balance between simplification and insight contributes to both fundamental aerodynamics and the design of bio-inspired flying robots.
