1. Introduction
The execution of construction activities, corrective and preventative repair initiatives, as well as rehabilitation efforts within work zones play a pivotal role in the maintenance and enhancement of road infrastructure on a global scale. The escalating need for the refurbishment and rebuilding of deteriorating infrastructure for transportation in the United States has led to the initiation of numerous roadway construction projects across the nation. Over recent years, there has been a notable rise in the quantity of work zones, primarily attributed to the expansion of highway renovations within the State of New Jersey. Despite the potential disruption to traffic and increased risk of crashes, this occurrence is an inescapable reality that cannot be disregarded. Work zones are susceptible to a higher likelihood of crashes due to the presence of fluctuating traffic patterns, decreased right-of-way, and ongoing roadwork [
1]. The Federal Highway Administration (FHWA) reported that a total of 27,037 individuals, with an annual average of 773 fatalities, lost their lives in work zone accidents in the United States between the years 1982 and 2017. The likelihood of crashes occurring in work zones is a matter of grave concern for drivers, traffic enforcement agencies, as well as road traffic safety experts [
2]. A precise prediction of the severity of crashes related to work zones and the evaluation of factors that contribute to these crashes are of considerable significance. Machine Learning (ML) techniques demonstrate a notable level of adaptability and superior performance. Presently, there is a growing interest in the utilization of ML models. Despite the high accuracy of prediction in various models based on machine learning (ML), a notable limitation is their inherent transparency, commonly referred to as the “black-box” nature. Consequently, the utilization of post hoc explanation techniques becomes necessary to facilitate further interpretation. Therefore, in contrast to black-box models, our aim is to develop a “glass-box” model that can effectively predict work zone-related crashes while also providing interpretation of the various contributing factors.
2. Literature Review
Researchers have analyzed various crash risk factors in work zones by studying work zone crash records. The vulnerability of severe injury in work zones is influenced by various factors, including the characteristics of individual vehicles and workers, as well as the behavior of drivers within work zones. These factors include the preferred speed of drivers, their braking actions, the paths they choose to navigate through the work zone, etc. In a study conducted by Morgan et al. [
3], driving simulator tests were utilized to examine the relationship between work zone crashes and taper lengths. The findings indicated that crashes were more likely to occur in work zones with shorter taper lengths, particularly when drivers’ ability to anticipate hazards was hindered by reduced viewing distances. Weng et al. [
4] examined the influence of different variables on the risks of injury and fatality for drivers in work zones, considering both short-term and long-term scenarios. They established that various factors, including light conditions, day of the week, gender, age, airbag availability, restraint use, and vehicle age, played a significant role in contributing to fatalities in both types of work zones. Concerns have been raised about how exceeding speed limits and driving swiftly in work zones may jeopardize safety. Debnath et al. [
5] formulated a model with the objective of evaluating the probability and magnitude of nonadherence to speed limits in various work zone settings. The findings indicated that during the late afternoon and early morning periods, characterized by increased traffic volumes and a greater proportion of noncompliant vehicles in the vicinity, leaders of platoons with larger front gaps exhibit a greater propensity for speeding, both in terms of likelihood and magnitude. Light vehicles and their adherents demonstrated a greater inclination towards exceeding speed limits in comparison to other types of vehicles.
Numerous investigations have been undertaken by researchers to investigate the impact of truck accidents within work zones. Research has indicated that there is a notable propensity for work zone crashes involving trucks to exhibit a considerably higher degree of severity [
6,
7] The study conducted by Osman et al. [
8] examined the correlation between the severity of injuries and different risk factors associated with significant truck accidents that took place in Minnesota between 2003 and 2012. Significant variations in the severity of injuries in truck-related crashes were observed, contingent upon the functional road classes of rural and urban areas. Bai et al. [
9] utilized portable changeable message signs (PCMSs) in work zones to investigate the optimal placement of a PCMS within a work zone. They measured the alterations in the speed profiles of trucks and passenger cars to determine the effectiveness of different PCMS locations. The disparity in speed fluctuations between trucks and passenger cars has been identified as a significant contributing factor to work zone crashes that involve trucks.
The majority of these studies have employed statistical methods. Statistical models possess well-defined functional forms, albeit contingent upon several assumptions. Assumptions that underlie statistical models can lead to inaccurate or biased estimates. In addition, the complex and multifaceted characteristics of modern datasets pose challenges when applying traditional statistical methods for modeling. In contrast, machine learning (ML) models exhibit a high degree of flexibility and require minimal reliance on assumptions. Currently, there is a growing interest in the application of ML across various fields [
10,
11,
12,
13,
14,
15]. Regardless of their high precision in forecasting, a significant drawback of numerous models based on ML is their inherent “black-box” nature, necessitating the use of post hoc explanation techniques for further interpretation. Multiple approaches exist for the interpretation of ML models, including partial dependency plot (PDP), Shapley additive explanations (SHAP), local interpretable model agnostic explanations (LIME), and permutation feature importance (PFI) [
16,
17,
18]. The aforementioned approach offers valuable insights into model interpretations, yet it is crucial to exercise caution in its application to avoid drawing erroneous conclusions. Several potential pitfalls can arise when employing these interpretation techniques. These include misapplying the techniques in inappropriate contexts, interpreting models that lack generalization, disregarding feature dependencies and interactions, neglecting uncertainty estimates, and failing to address issues that arise in high-dimensional settings. Additionally, making unjustified causal interpretations is another common pitfall associated with these techniques.
In contrast, ML models known as “glass-box” models have been specifically built to hold inherent interpretability, thereby indicating that the explanations they produce are both reliable and readily comprehensible to users [
19]. The explainable boosting machine (EBM) is a glass-box ML model that falls under the category of tree-based, cyclic gradient-boosting, general additive models. It allows for simple comprehension and interpretation of its internal mechanisms. The utilization of automatic interaction detection is implemented in accordance with the approach described by Nori et al. [
20]. With regard to its reliability, EBM has demonstrated outcomes comparable to advanced ML models such as gradient boosting, support vector machine (SVM), extreme gradient boosting (XGBoost), light gradient boosting machine (LightGBM), artificial neural networks (ANNs), k-nearest neighbor (KNN), and random forest (RF) [
21,
22]. The utilization of factor-specific shape functions in this method holds promise for yielding results that are inherently interpretable. The potential benefits of EBM over complex black-box ML models are apparent in their capacity to offer interpretable decision-making processes and final estimates, which can be perceived in both local and global contexts without requiring additional interpretation methods. EBM is being successfully applied in various fields, including health sciences, computer and communications security, the education sector, and advanced manufacturing technology [
23,
24,
25]. However, the application of the EBM model to the evaluation of the severity of road traffic accidents has not yet been investigated.
3. Data and Methods
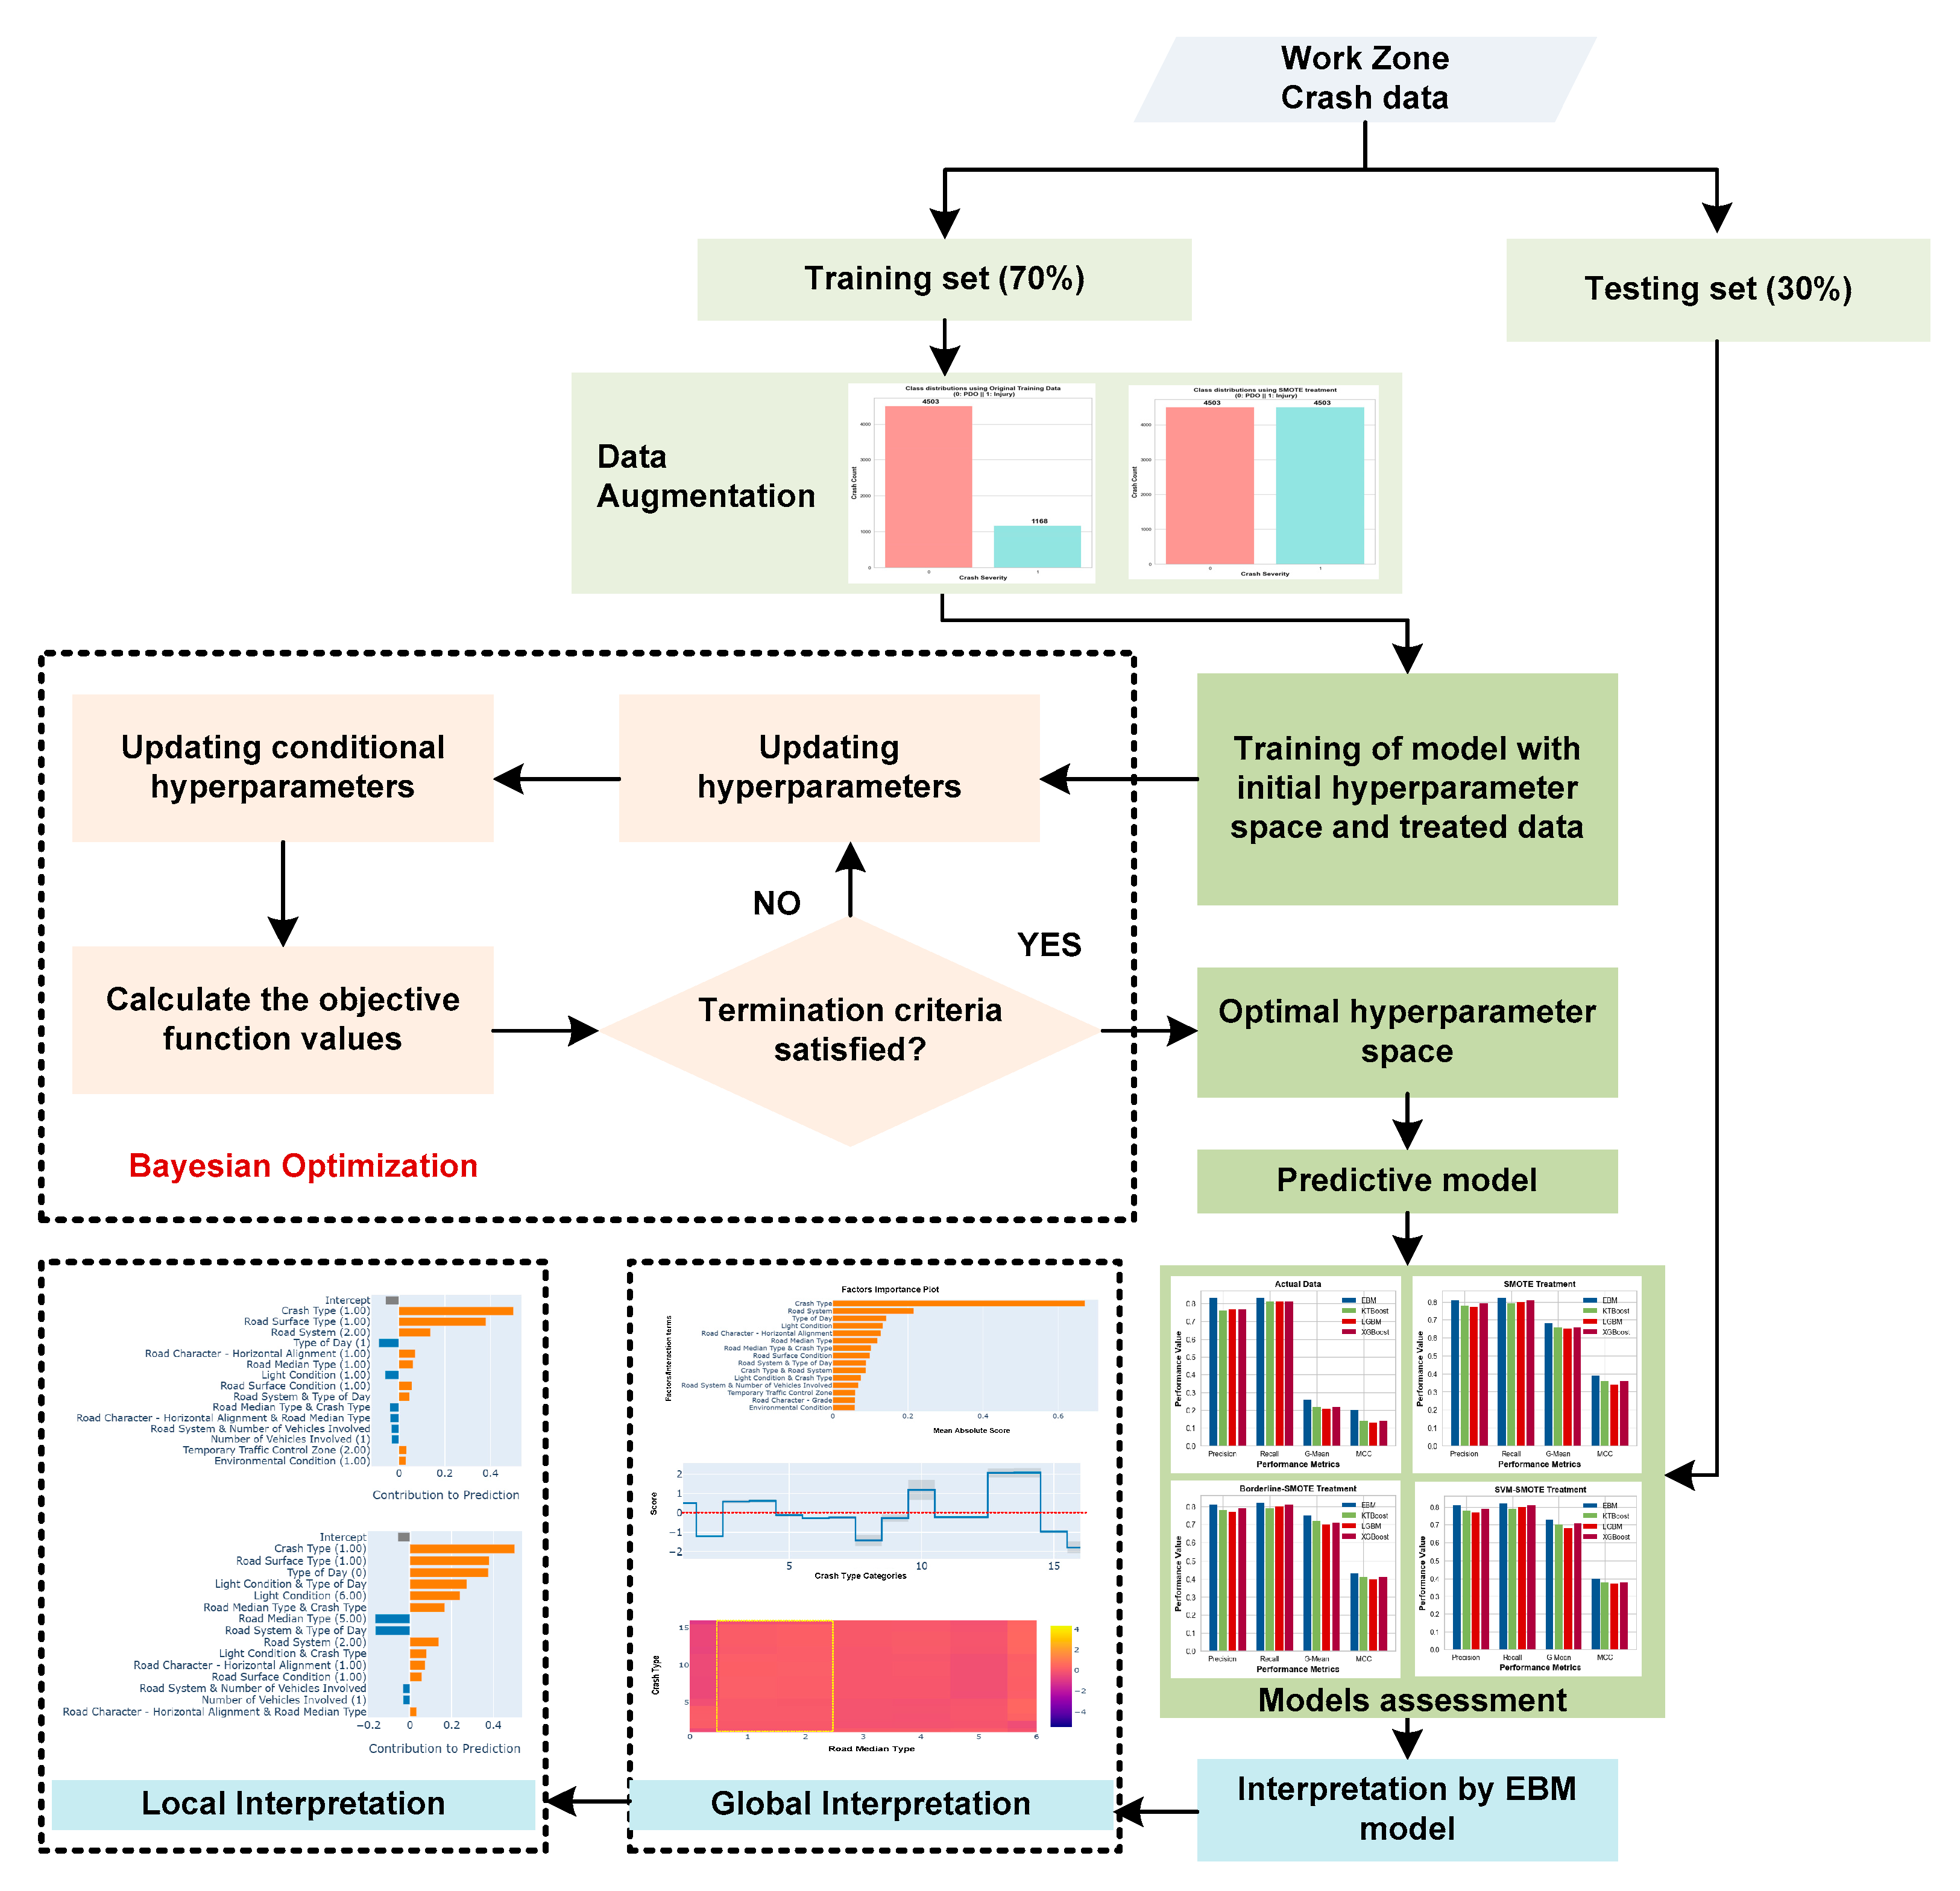
In this study, we simultaneously address the issues of data imbalance and interpretability in ML models by employing different data augmentation techniques and utilizing the EBM model. The objective of our study is to predict the severity of crashes occurring in work zones and assess the influence of different risk factors. The hyperparameters of the EBM were optimized through the implementation of a Bayesian optimization strategy [
26]. This approach facilitated the automated adaptation of the hyperparameters, obviating the necessity for manual intervention. To assess the efficacy of the proposed EBM model, a comparative analysis was conducted between its predictive outcomes and those generated by a black-box ML model such as combined kernel and boosting tree (KTBoost) [
27], light gradient boosting machine (LightGBM) [
28], and extreme gradient boosting (XGBoost) [
29]. Furthermore, the EBM model was employed to analyze the factors within the global and local context. The complete research framework is illustrated in
Figure 1.
3.1. Data Description
The data utilized in this study were sourced from the publicly accessible crash records database of the New Jersey Department of Transportation (NJDOT), which can be accessed through the NJDOT website. The dataset comprised a total of 8102 recorded incidents of vehicular crashes occurring within work zones in the state of New Jersey during the time frame stretching from 2017 to 2018. The crashes were categorized into two distinct classifications, specifically PDO (property damage only) and injury, according to the severity of the crashes. The injury class consisted of fatalities, severe injuries (or injuries causing debilitation), and minor injuries.
Table 1 contains a listing of the crash risk factors utilized in this investigation, accompanied by their respective codes and relative frequencies.
3.2. Data Augmentation Strategies
In scenarios of work zone-related crashes, there exists an imbalance in the crash records, whereby the number of instances for each class (property damage only and injury) is not equitably represented. The aforementioned disparity poses a significant detriment to both ML and statistical classification algorithms, resulting in a substantial decline in accuracy. There are several primary factors contributing to this phenomenon. (1) In case of imbalanced data, ML and statistical classification algorithms disregard minority class instances as extraneous data points and produce a rudimentary classifier that estimates all samples as belonging to the majority class. (2) They often exhibit bias towards a class that is numerically dominant due to their optimization objective of maximizing classification accuracy. This approach treats classification errors for all classes equally, which is not suitable for imbalanced datasets.
In this study, various oversampling-based data augmentation techniques were utilized to address the issue of class imbalance in work zone crashes. These techniques included SMOTE (synthetic minority over-sampling technique) [
30], borderline-SMOTE [
31], and SVM-SMOTE [
32]. Those with a keen interest in obtaining comprehensive information regarding these strategies are suggested to refer to the corresponding reference for further details.
3.3. Explainable Boosting Machine: A Glass-Box ML Model
The EBM model is built upon generalized additive models (GAMs), which are widely recognized as the benchmark to demonstrate a high level of comprehensibility. Given that
is a training dataset with a length of
, the input vectors that
with ‘
’ attributes, and
is the target factor, then the GAMs takes the form as shown in Equation (1).
where
represents the
factor within the attribute set, while
denotes the link function that aligns the generalized additive model (GAM) with either regression (e.g.,
= identity) or classification (e.g.,
= logistic), and
refers to the attribute function.
When compared to conventional GAMs, EBM, which employs bagging and gradient boosting, offers a number of important improvements. The training process involves focusing on individual attributes sequentially, utilizing a significantly small learning rate. Round-robin boosting is employed to disregard the order of the attributes. In order to mitigate the effects of collinearity, EBM iterates through the attributes, aiming to identify the most influential attribute function
for each attribute. Subsequently, it incorporates the information from each attribute into the prediction process. Specifically, each function
is utilized as a lookup table in which the term contribution is added and transmitted via the link function
to generate individual predictions. The feasibility of determining the attribute with the greatest influence on an individual prediction can be attributed to the concepts of additivity and modularity. This allows for the ordering and visualization of contributions. One additional benefit of the EBM is its capacity to enhance precision through the integration of pairwise interactions into conventional GAMs, resulting in the formation of GA2Ms, as represented by Equation (2).
Here, the representation of the 2D interactions can be visualized as a heatmap on the 2D plane, maintaining a notably high level of comprehensibility. The GA2M algorithm first constructs an optimal GAM, and then examines the residuals in order to identify and rank all potential interaction combinations based on their significance.
3.4. Hyperparameter Tuning of ML Models
The optimization of hyperparameters is a crucial step that must be undertaken prior to the learning of ML models in order to minimize over-fitting and reduce the model’s complexity. Various approaches to hyperparameter tuning have been extensively examined that encompass grid search cross-validation (GS-CV), random search cross-validation (RS-CV), and the Bayesian optimization approach [
33,
34]. However, it has been observed that GS-CV and RS-CV are methods that systematically investigate the complete spectrum of potential hyperparameter values without considering previous outcomes, which enhances the computation time to reach the optimal values. In contrast, Bayesian optimization, in the choice of subsequent hyperparameters, takes into account previous evaluations. This approach enables the determination of the most suitable hyperparameter values while minimizing the number of iterations required [
33]. Therefore, we employed Bayesian optimization for hyperparameter tuning of EBM and other models in our research. We employed the G-mean performance metric to facilitate hyperparameter adjustment.
3.5. Performance Evaluation of ML Models
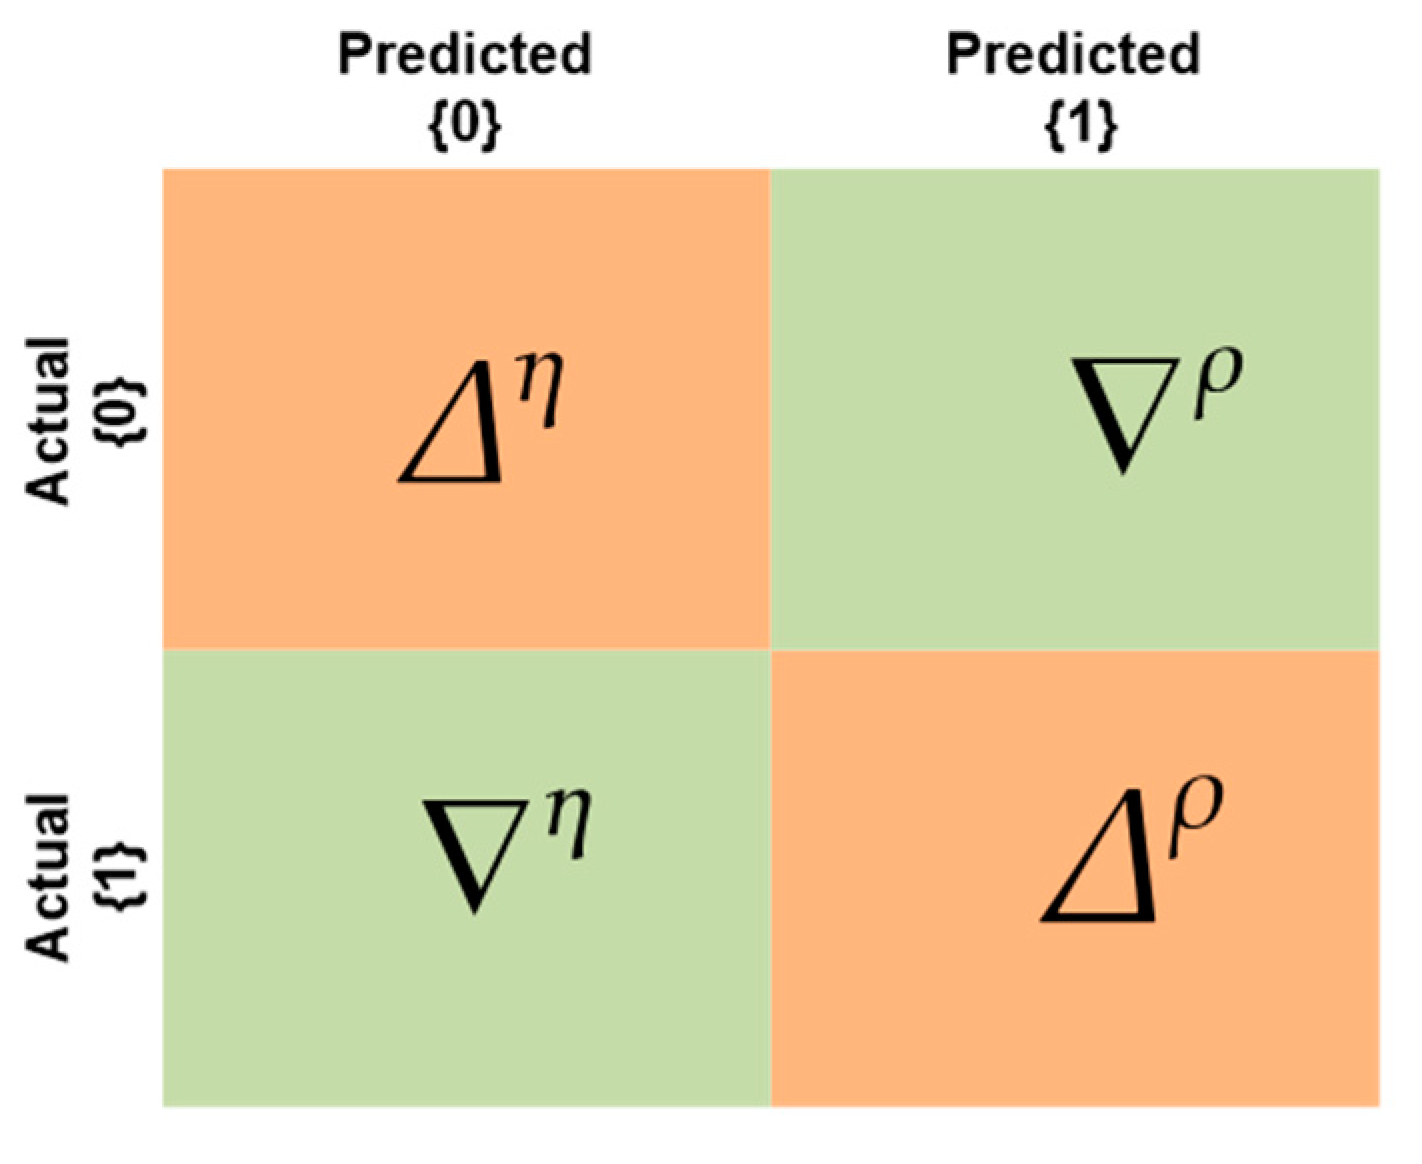
The evaluation of the proposed EBM and other black-box ML models can be conducted using various metrics that are typically derived from the contingency or confusion matrix of the model, as illustrated in
Figure 2. In the confusion matrix, the true positives are defined as the instances in which a classifier correctly forecasts the positive class for a given set of outcomes. Similarly, true negatives refer to the outcomes in which the classifier accurately predicts the absence of a specific class. When a predictive model erroneously classifies an instance as belonging to the positive class when it actually does not, it is referred to as a false positive
. Similarly, false negatives refer to the instances in which the classification model produces an erroneous prediction concerning the negative class. In order to calculate the classification accuracy (CA), a commonly employed metric to assess the performance of ML models, we divide the overall count of accurate predictions by the total count of estimations produced. The utilization of this metric may result in inaccurate findings when applied to imbalanced datasets, as it assigns greater weight to the class that is more prevalent. In the given circumstances, the utilization of classification accuracy as an efficiency metric would not be feasible. In order to address this issue, several performance metrics are employed alongside accuracy, such as precision (P), recall (R), Matthews’ correlation coefficient (MCC), and geometric mean (G-mean). The calculations for each metric can be found in Equations (3) through (7). The G-mean is a metric used to evaluate the efficiency of ML models. The evaluation measures the balance between the accuracy of classifying minority and majority instances. The utilization of the MCC can provide valuable insights into the effectiveness of a classification algorithm that has been trained on imbalanced data. Its value should ideally lie within the interval of −1 to 1. Values that approach +1 indicate an elevated degree of performance, while values that deviate from +1 indicate a lower level of performance.
4. Results and Discussion
The NJDOT work zone crash records utilized in this research comprise a total of 8102 work zone crashes that occurred within the time frame of 1 January 2017 to 31 December 2018. The dataset consisted of various outcomes, which encompassed 10 instances of fatalities, constituting approximately 0.1% of the overall count. Additionally, there were 1609 incidents of crashes resulting in nonfatal injuries, accounting for approximately 20% of the total count. The remaining 6473 crashes were categorized as property damage only (PDO) events. The low number of observations for fatal, major, and minor crashes necessitated the combination of fatal, major, and minor crashes with injury crashes for the estimation of the model. The idea of binary classification into injury and PDO classes has been taken from similar studies [
35,
36,
37].
The complete dataset, consisting of 8102 work zone crash records, was divided into two subsets in order to facilitate model training and validation, as well as for the purpose of evaluation. The training–validation set comprises 70% of the complete dataset, consisting of 5671 reports. This set includes 4503 cases of PDO (property damage only) and 1168 cases of injuries, with a balancing ratio of 0.25. The remaining 30% of the data, containing 2433 crash records, was set aside for testing purposes.
4.1. Data Treatment and Hyperparameter Tuning
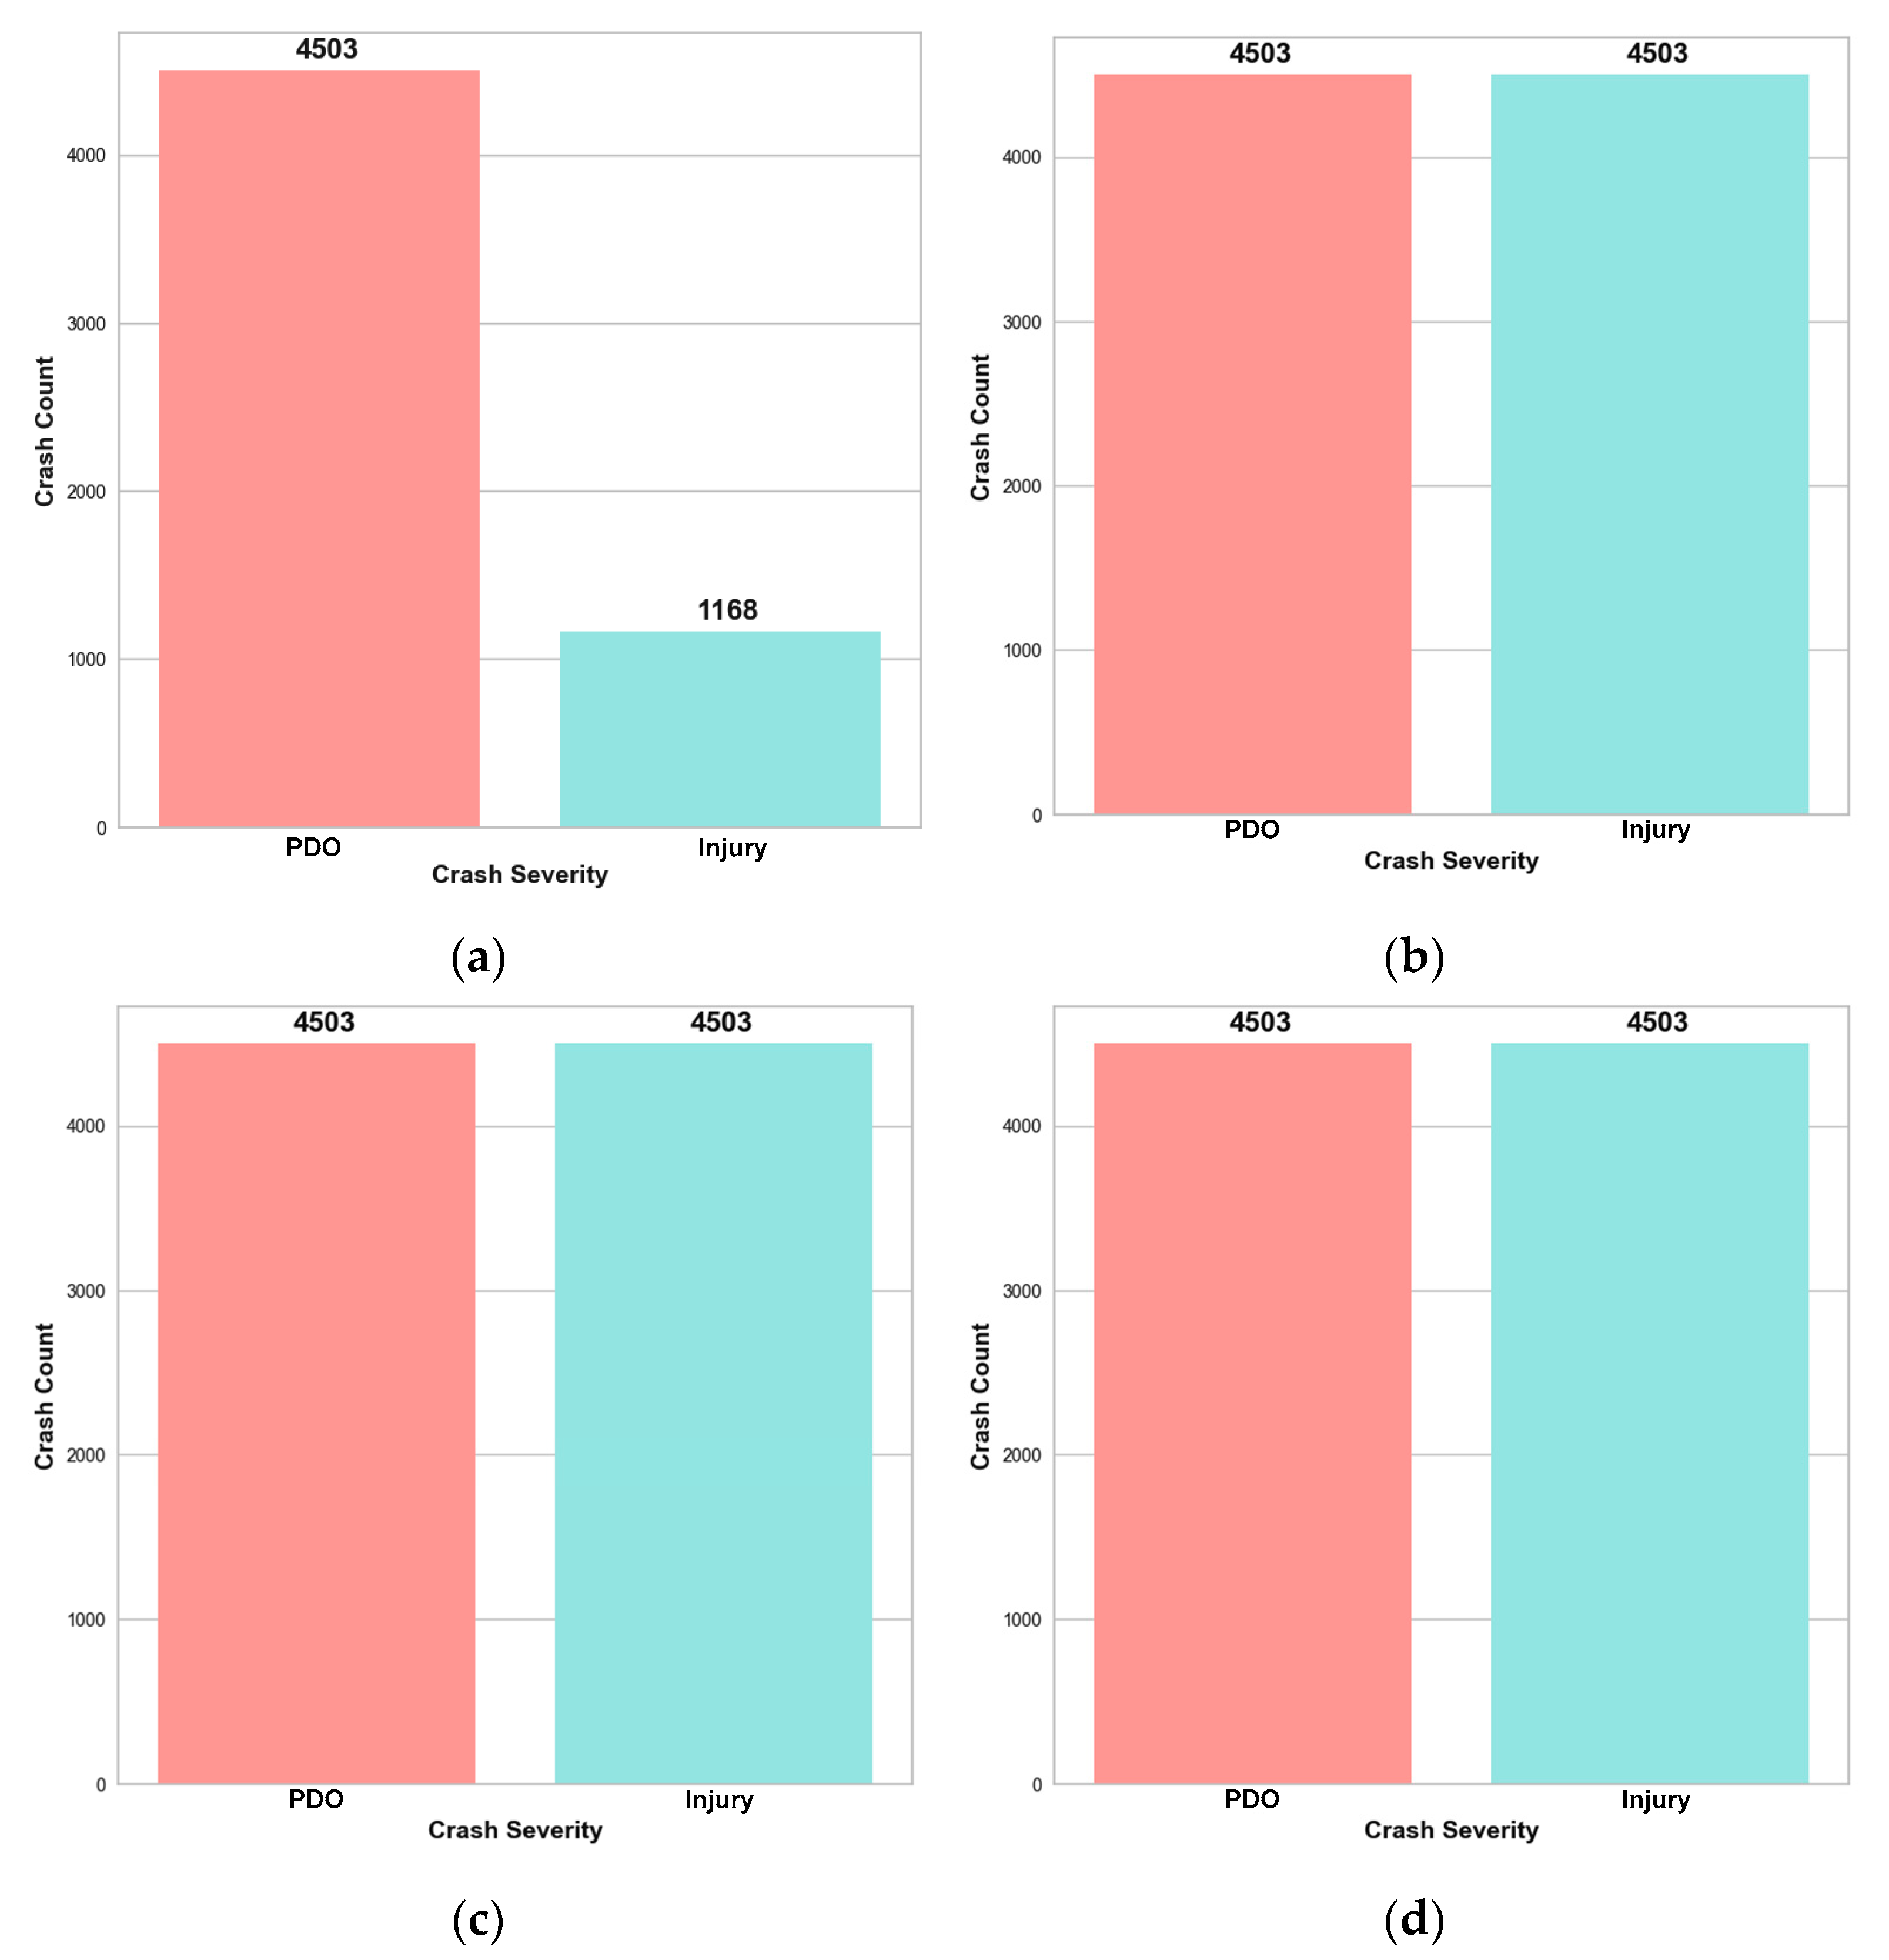
Data-level augmentation techniques were implemented on the training data before applying the EBM model and conducting hyperparameter tuning. After implementing multiple data augmentation techniques, the training datasets that have undergone resampling are depicted in
Figure 3. Subsequently, Bayesian optimization is employed to ascertain the optimal values for the hyperparameters of ML models. Utilizing both the original and the augmented data, the goal was to maximize the G-mean metric. The optimal hyperparameters for EBM and other competitive glass-box and black-box ML models with different data augmentation strategies are demonstrated in
Table A1 in
Appendix A.
4.2. Performance Comparison of ML Models
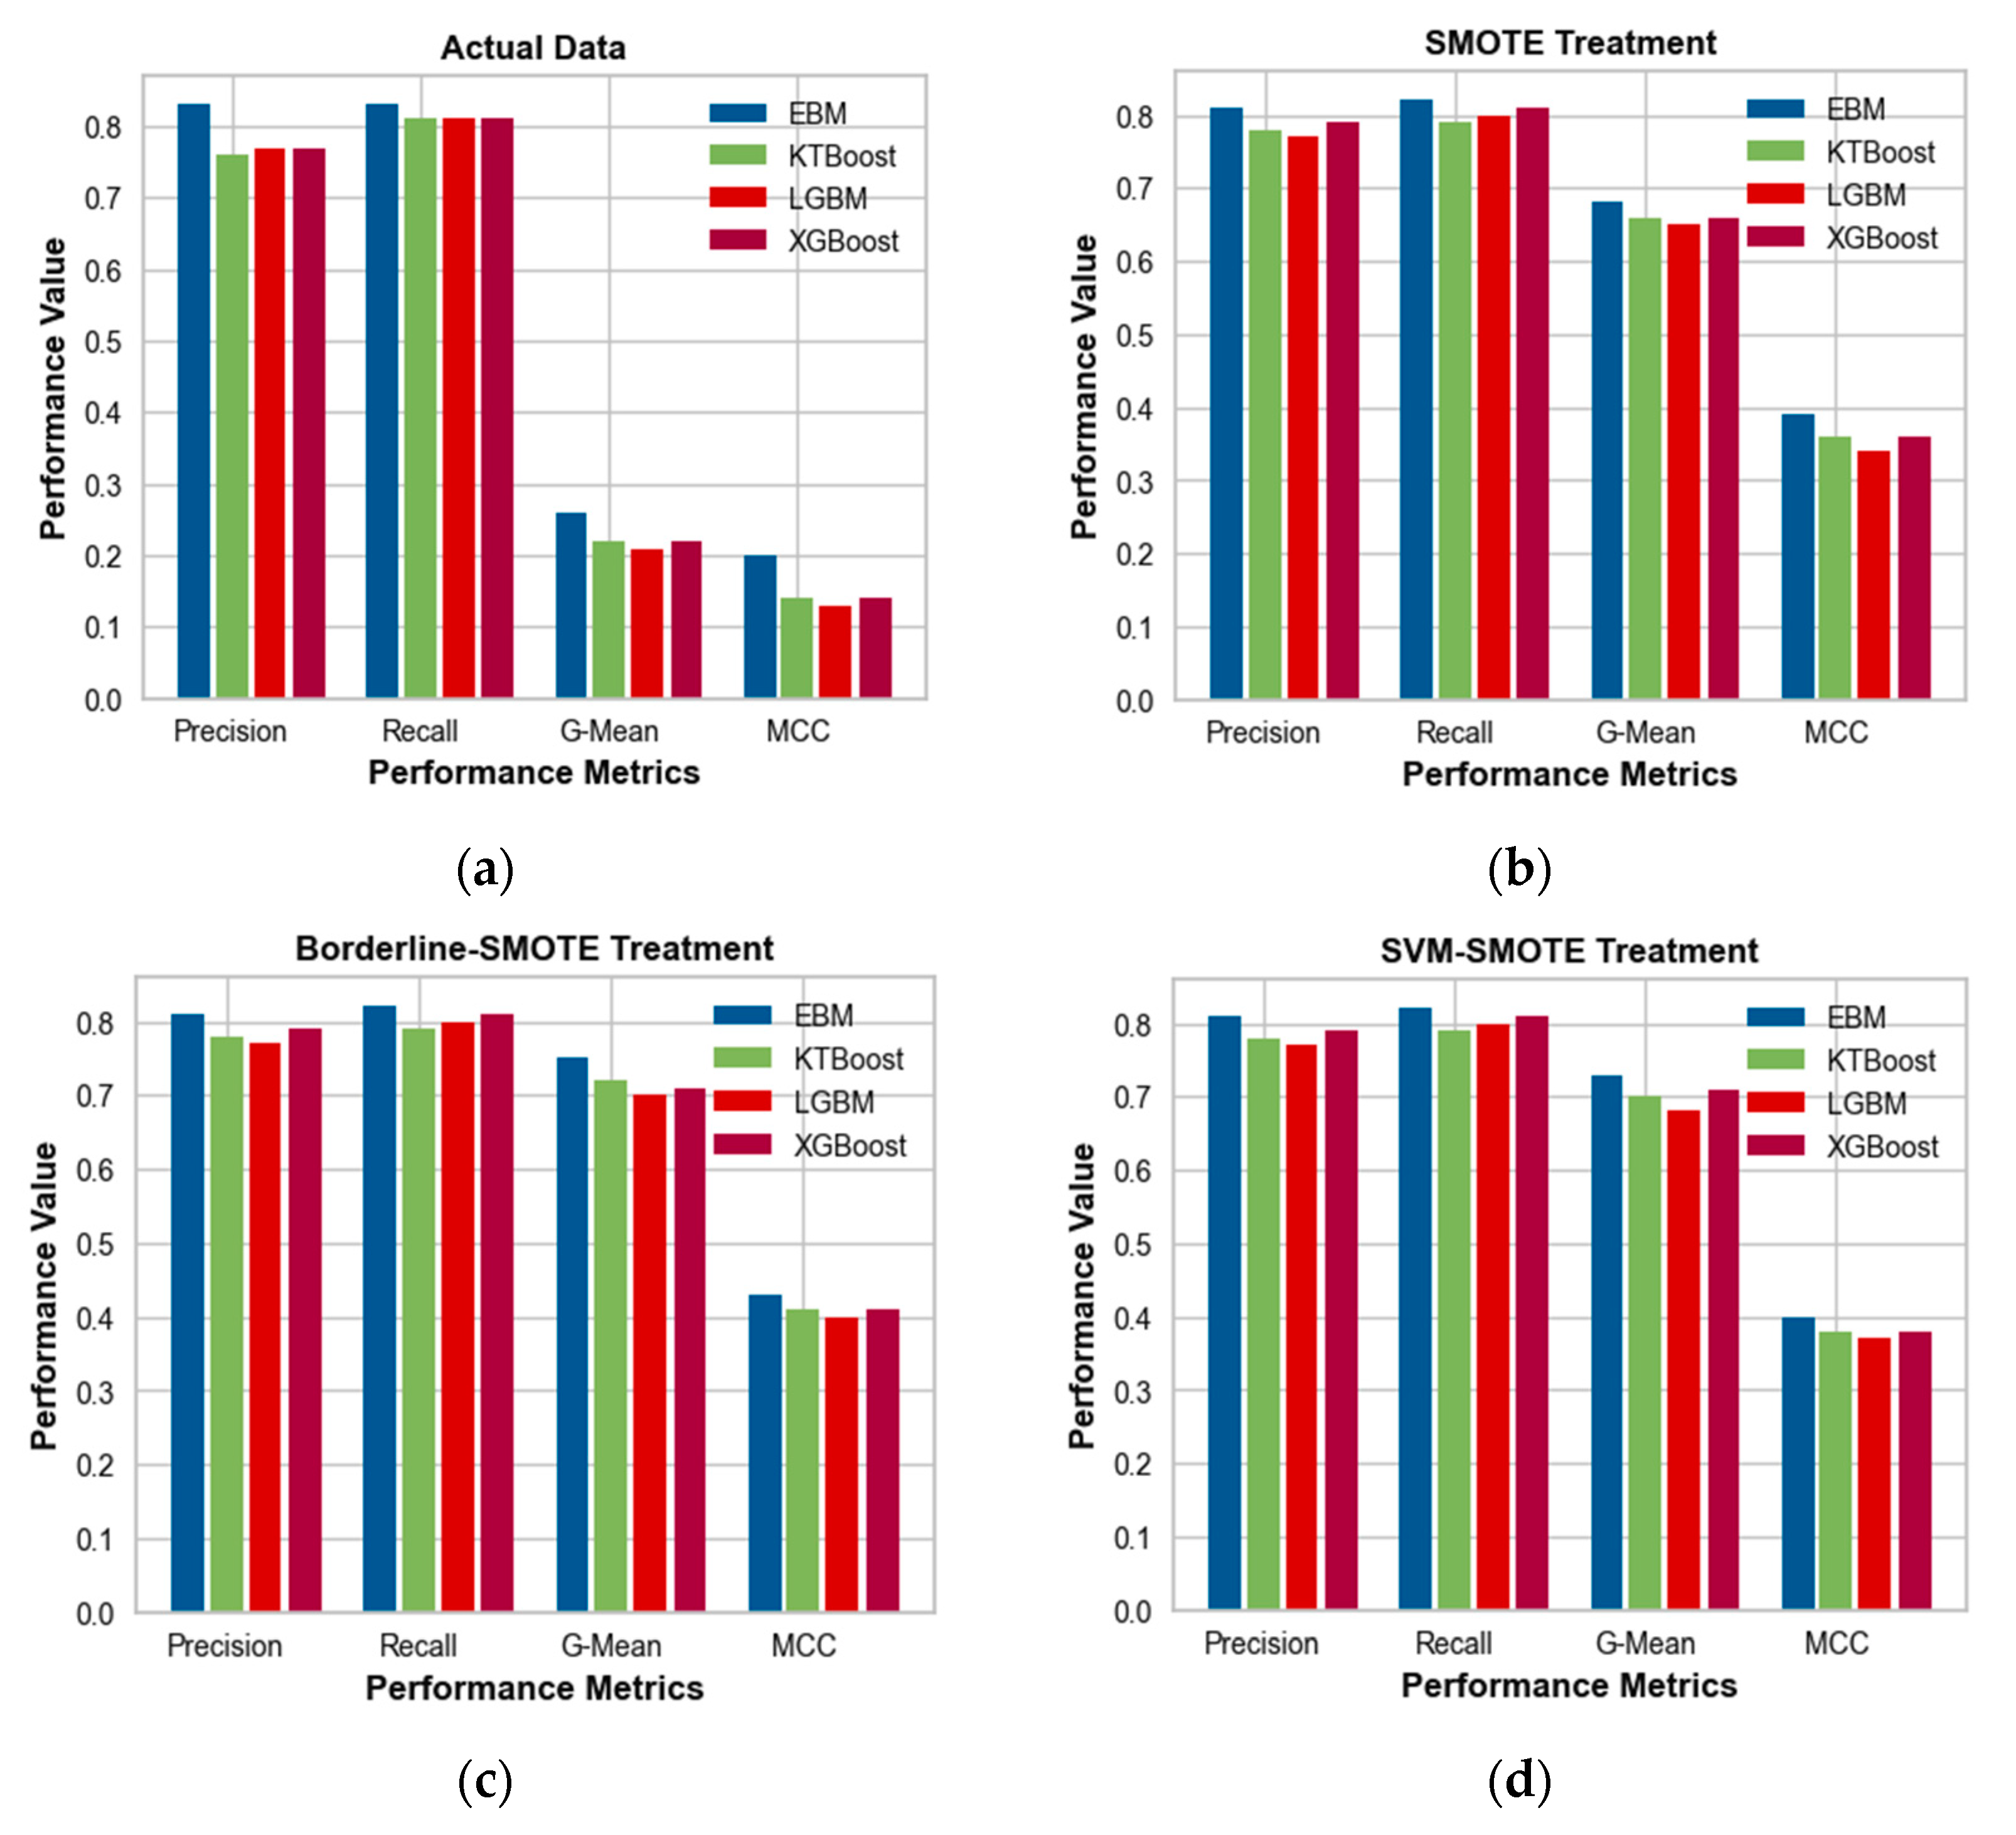
In this study, injury and PDO were designated as the positive and negative classes, respectively, for the purpose of developing models and assessments. The efficiency of ML models was assessed by analyzing various performance metrics, including recall value, precision value, G-mean, and MCC. In the initial analysis of the untreated data (
Figure 4a), it was observed that the EBM model exhibited a G-mean of 0.26 and an MCC of 0.20. These values were found to be slightly higher compared to the other black-box ML models. However, the values of these indicators are quite low due to the imbalanced nature of the crash data. Consequently, we are compelled to utilize a balanced dataset. Following the implementation of various data augmentation techniques, it has been observed that the G-mean and MCC values have exhibited an increase across all models. The application of the SMOTE to the data led to improved performance metrics in the EBM model, specifically a higher G-mean of 0.68 and a higher MCC of 0.39. The KTBoost and XGBoost models also demonstrated improved performance, albeit to a lesser extent, with a G-mean of 0.66 and an MCC of 0.36 (
Figure 4b). When considering data that have been treated with borderline-SMOTE, the EBM demonstrated superior performance in terms of G-mean (0.75) and MCC (0.43). Subsequently, the KTBoost yielded a G-mean value of 0.72 and an MCC value of 0.41 (
Figure 4c). In the data that underwent the SVM-SMOTE treatment, EBM exhibited improved performance in terms of G-mean (0.73) and MCC (0.40), followed by XGBoost with G-mean (0.71) and MCC (0.38) (
Figure 4d). Based on these outcomes, the EBM model with borderline-SMOTE-treated data can be used for further interpretation of factors from both global and local perspectives.
4.3. EBM-Based Factor Importance and Pairwise Interaction
In addition to prediction performance, this study also provides a comprehensive analysis of the EBM model, incorporating borderline-SMOTE-treated data. This strategy facilitates an in-depth investigation of the impact of factors and combinations of factors on the severity of work zone-related crashes.
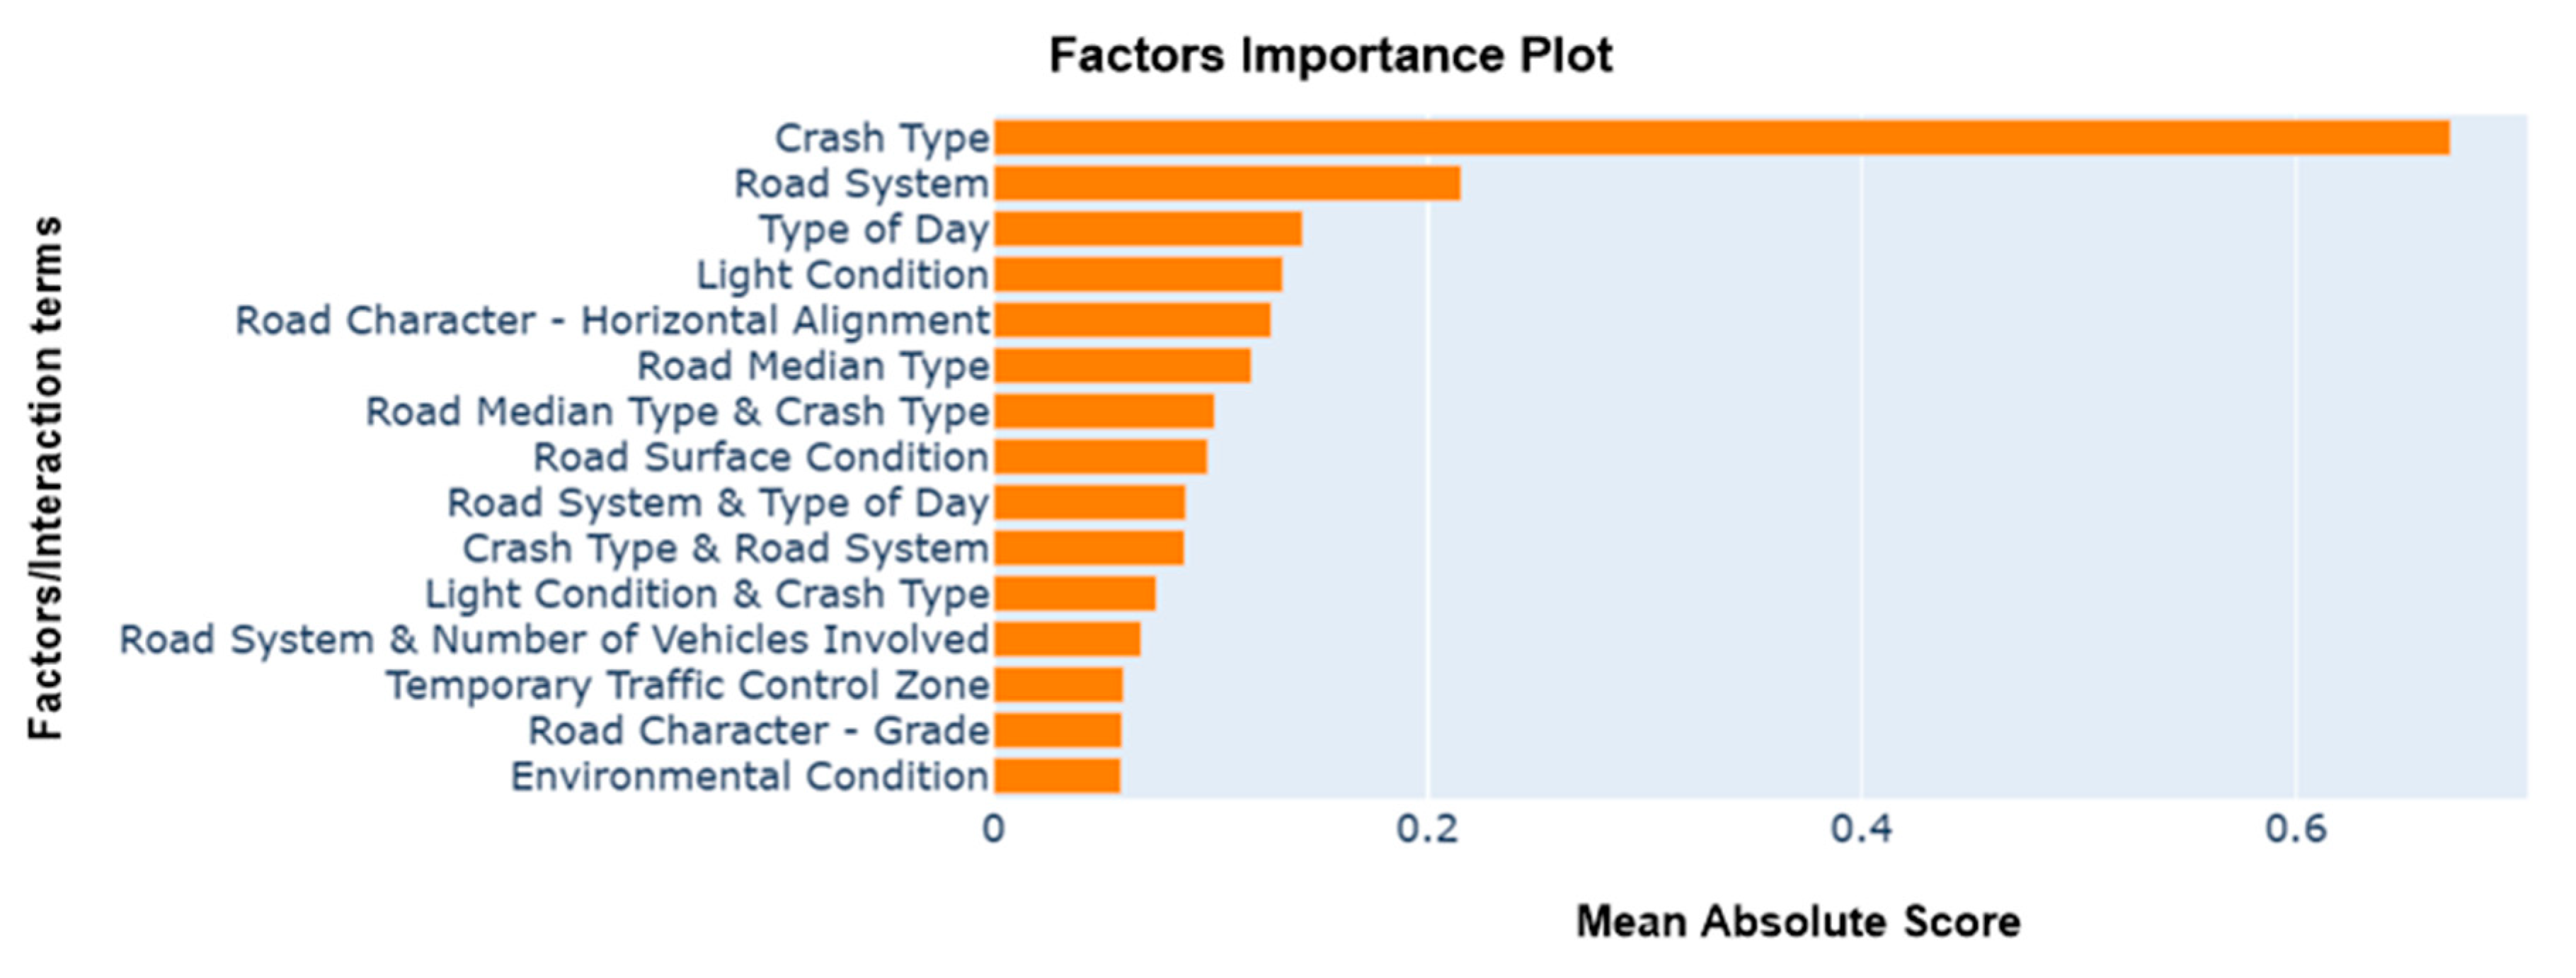
Figure 5 presents a comprehensive overview of the importance of each individual factor, as well as their interactions in pairs. When considering individual factors, it becomes evident that both the crash type and the road system play crucial roles in influencing the probability of injuries in work zone crashes. However, in terms of pairwise interaction, the combined effect of road median type and crash type significantly increased the probability of injuries occurring in work zone-related crashes, followed by the combination of road system and day of the week.
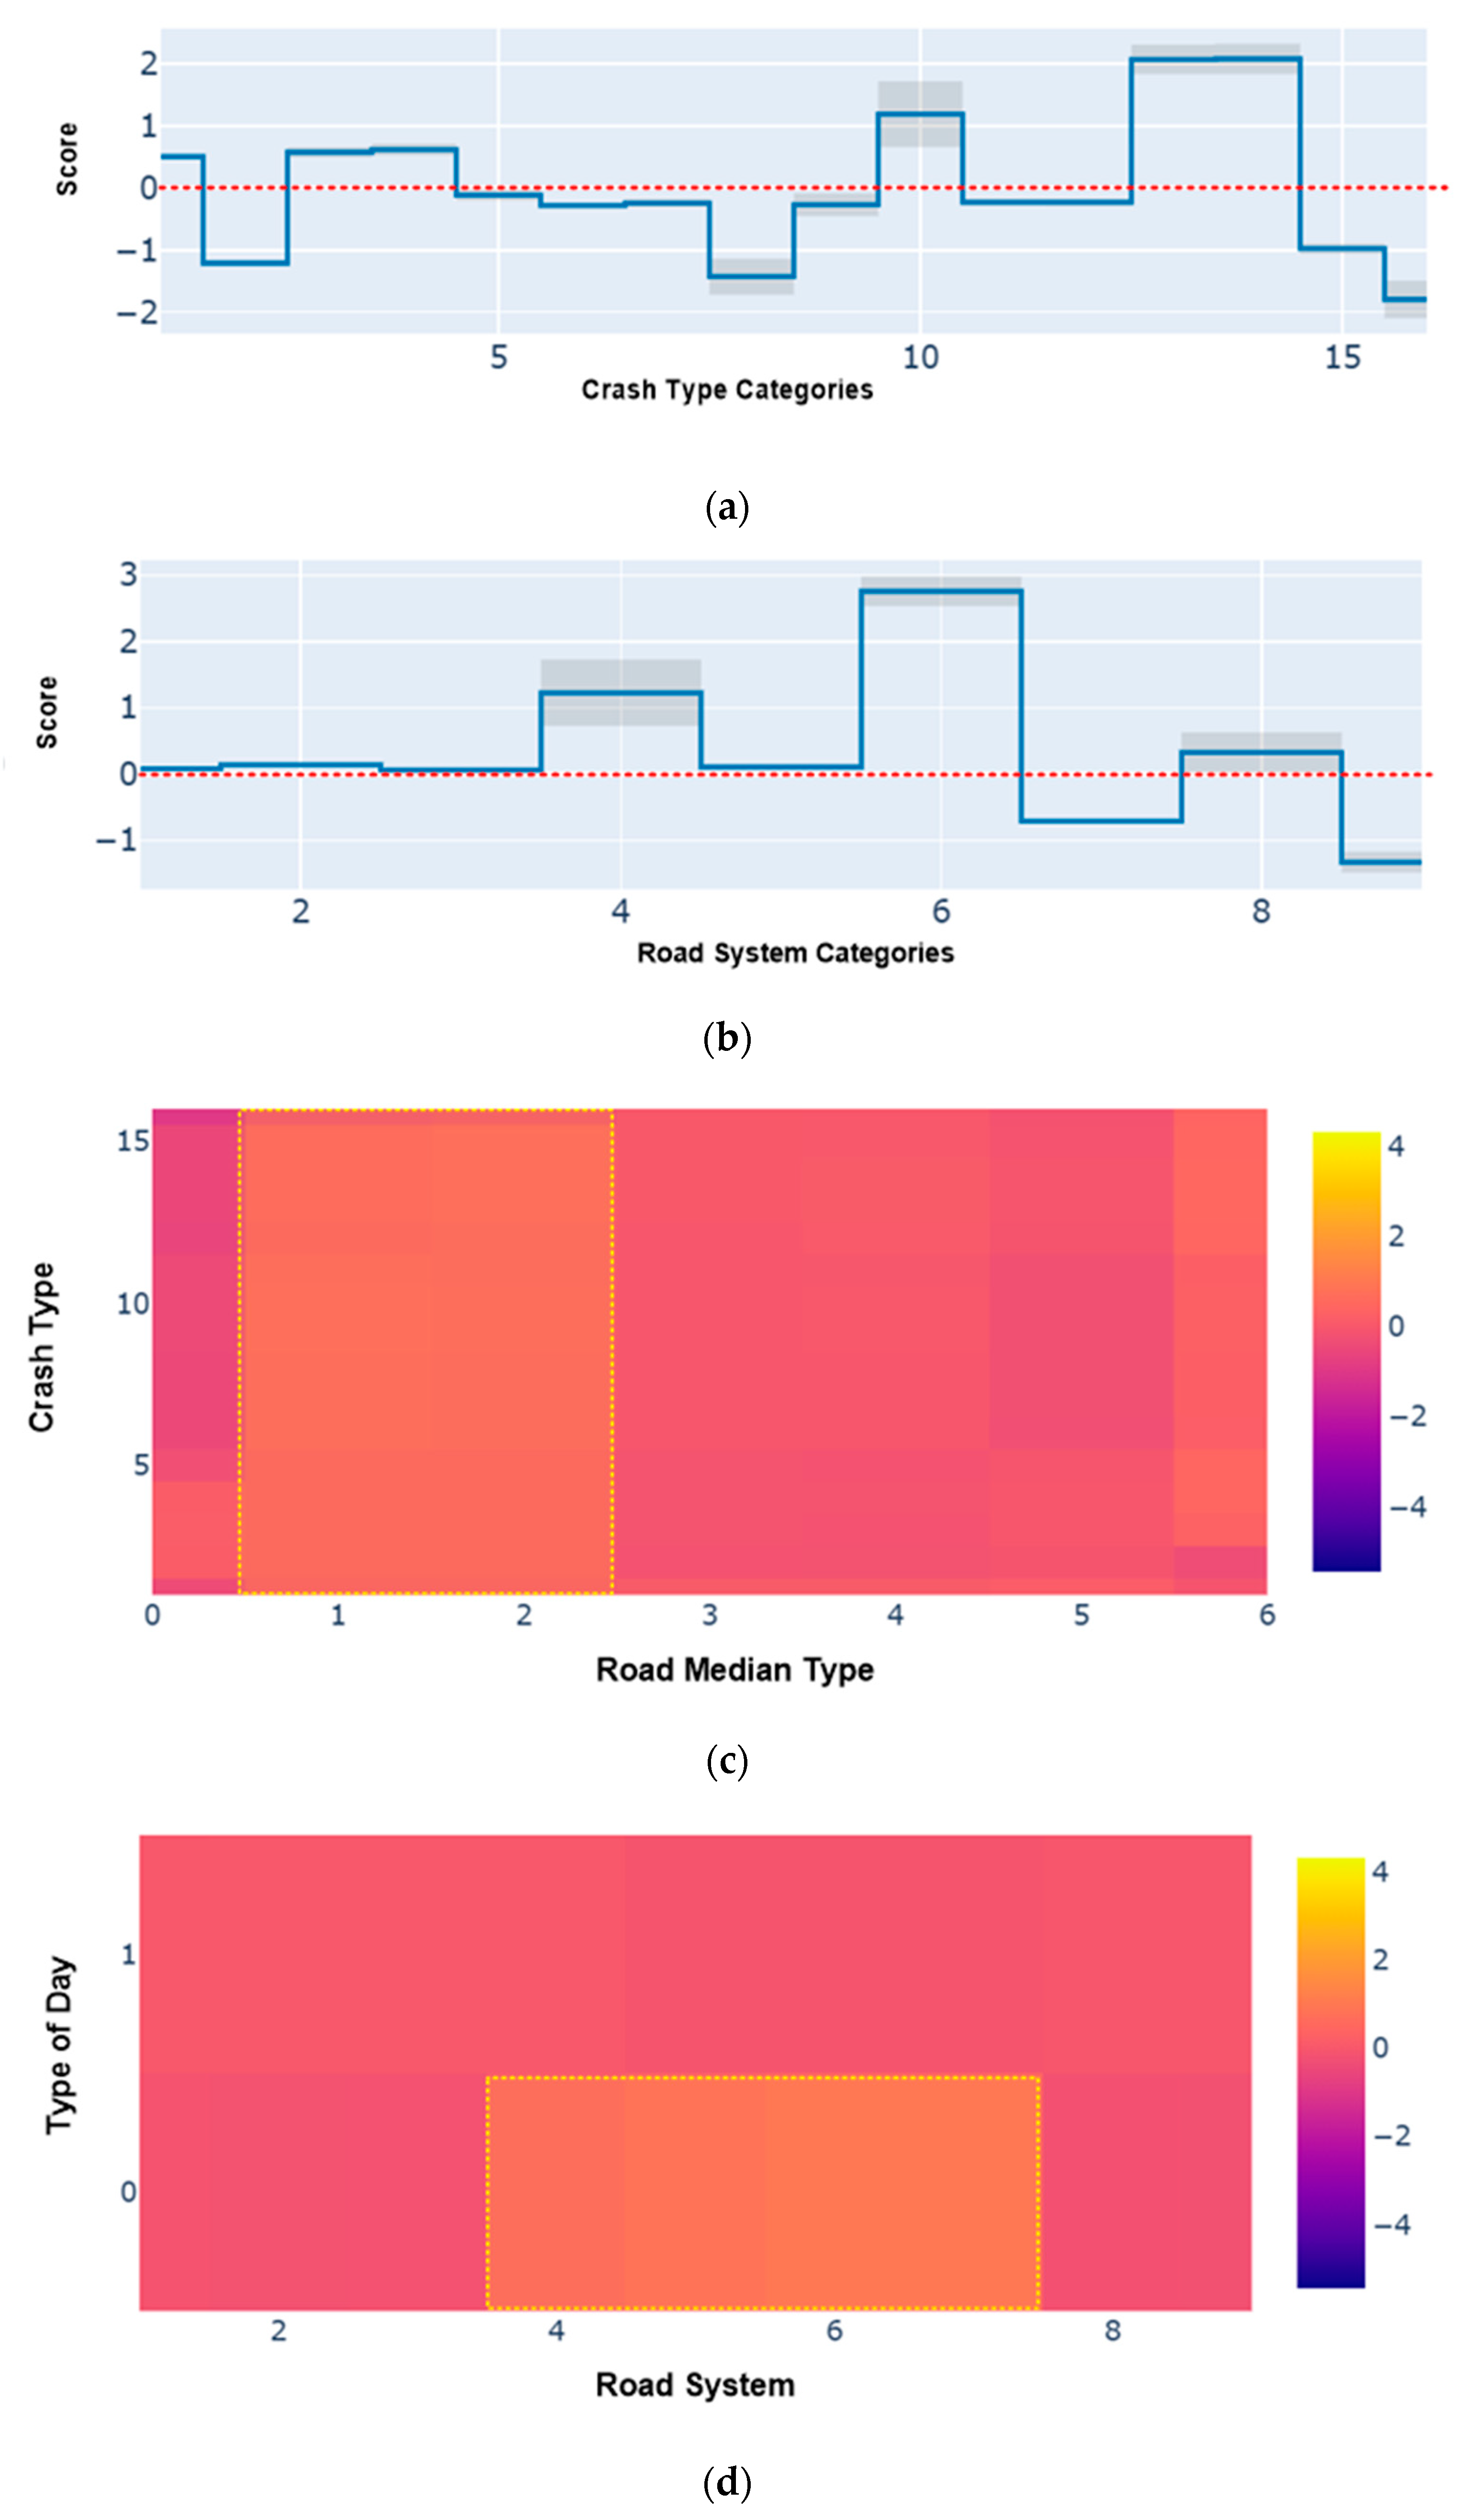
Additional outputs generated by the proposed EBM model using borderline-SMOTE-treated data for comprehension of the global outcomes regarding the severity of work zone-related crashes are illustrated in
Figure 6, encompassed EBM shape functions and heatmaps. The shape function of the EBM is a unidimensional function that represents the relationship between predictor factor values and the corresponding scores. The predictor factor values are plotted along the horizontal axis, while the scores, which indicate the influence of the independent factors on the predicted logits, are plotted along the vertical axis. A score greater than zero signifies a statistically significant relationship between the independent factors and the response factor.
Figure 6a,b presents the shape functions derived from the EBM approach for the two prominent factors, namely crash type and road system. The crash types, coded as 3 (Right Angle), 4 (Head On Opposite Direction), 10 (Overturn), 13 (Pedestrian), and 14 (Pedal cyclist), exhibited score values exceeding zero, indicating a higher propensity for causing injuries in work zone crashes. Similarly, the road systems coded as 2 (State Highway), 4 (State Park or Institution), 6 (Co Auth, Park or Inst) and 8 (Mun Aith, Park or Inst) were more likely to cause injuries.
Figure 6c,d depicts the heatmaps of pairwise interaction of importance pairs of factors. The area in yellow shows the higher score value, which means likelihood of injuries. It has been observed that in all types of crashes, the median type coded as 1 (Barrier Median) and 2 (Curbed Median) contributed more towards the injuries in work zone crashes. Similarly, on weekends, the road system type coded as 4 (State Park or Institution), 5 (County), 6 (Co Auth, Park or Inst), and 7 (‘Municipal’) were highly prone to the occurrence of injuries in work zones.
4.4. EBM-Based Local Factor Interpretation
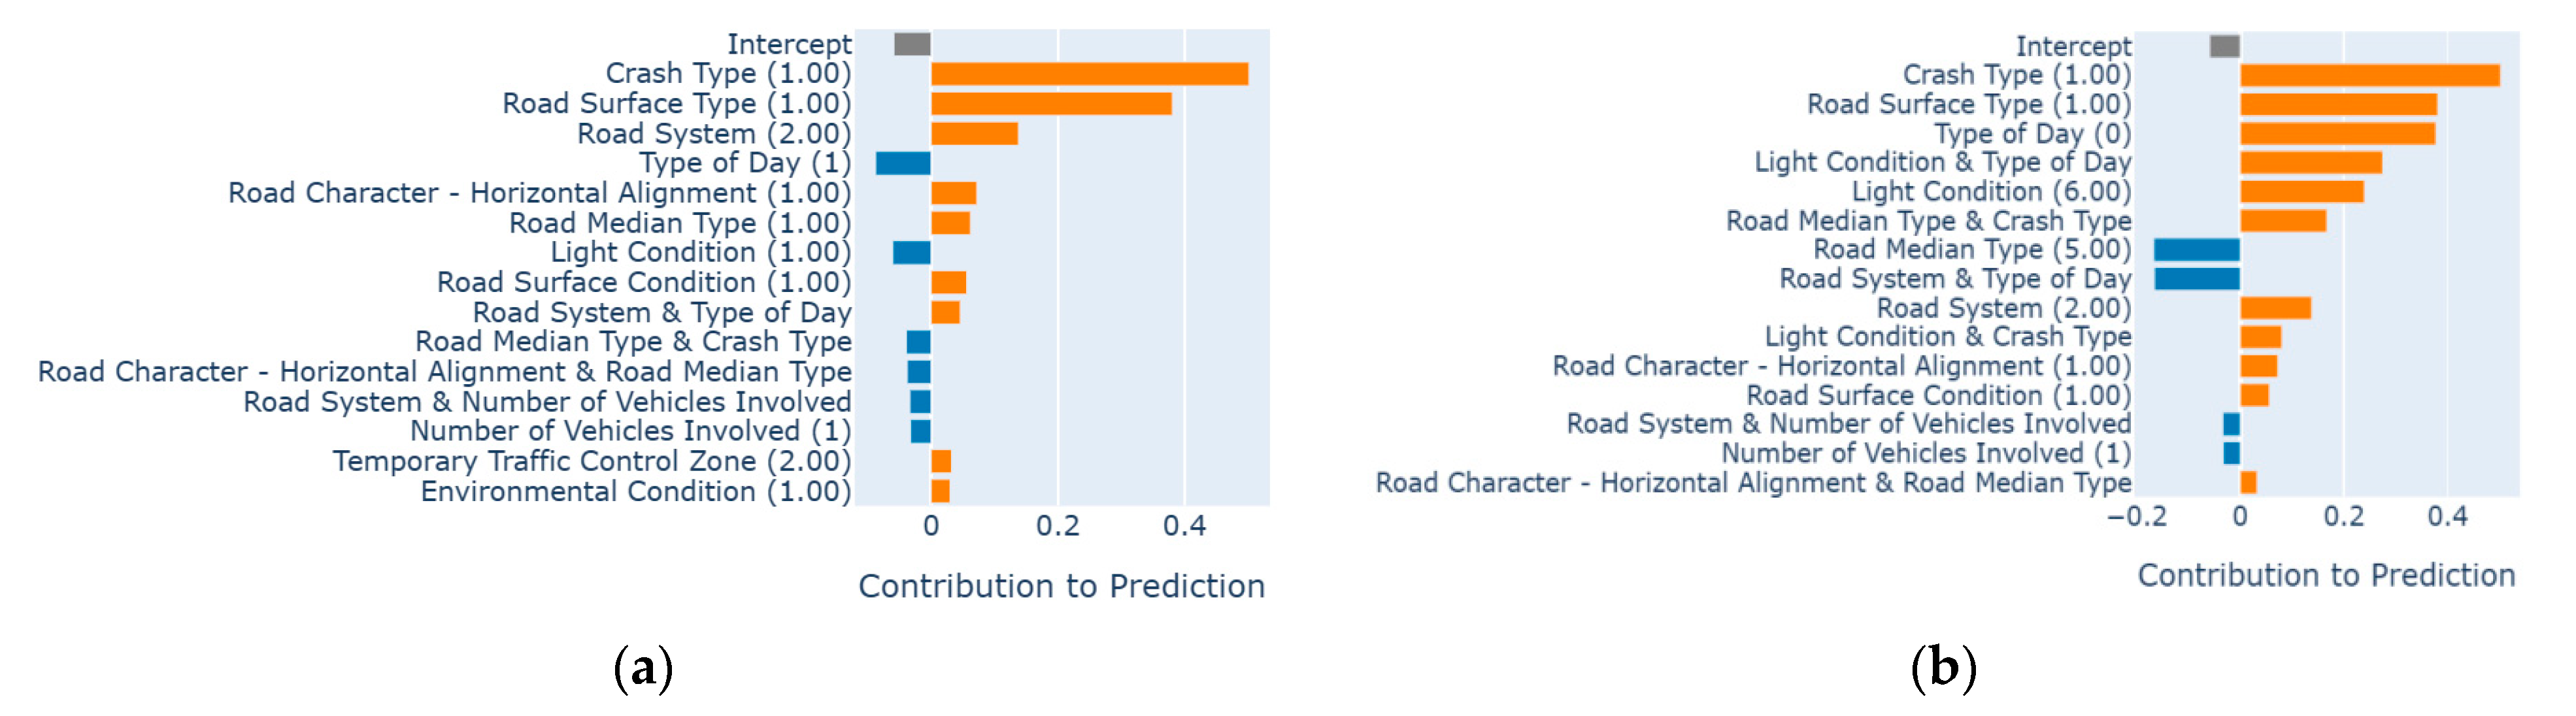
The EBM-based local explanation comprises explanations that pertain to specific estimations for particular instances. A bar graph can be generated for each occurrence, visually representing a consistent intercept term in gray color; additive terms that contribute positively are displayed in orange, while additive terms that have a negative impact are represented in blue. It is important to note that the strength of factors in local interpretation may differ from that of global interpretation. Global interpretation encompasses the overall impact of instances, while local interpretation focuses on specific instances within the data.
Here, we examine a pair of randomly selected instances that have been accurately predicted and classified as work zone crash injuries. In the initial instance, a case is accurately categorized as “injury” with a probability of 0.87 (refer to
Figure 7a). In this specific instance, the first three factors, namely crash type (1: Rear End Same Direction), road surface type (1: Concrete), and road system (2: State Highway), displayed a positive influence. Conversely, the type of day (1: Weekday) had a negative impact, which resulted in PDO.
Figure 7b illustrates another scenario wherein an event is correctly classified as “injury” with a probability of 0.91. In this particular case, the crash type (1: Rear End, Same Direction), road surface type (1: Concrete), and type of day (0: Weekend) exhibited a significant positive impact, indicating an increased probability of causing injuries. On the other hand, the road median type (5: None or Absence of Median) and the interaction between the road system and the type of day had a negative influence, with an increase in the probability of PDO.
5. Conclusions and Recommendations
This research introduces a glass-box ML model known as EBM, which is utilized for predicting the severity of crashes occurring in work zones. It demonstrates a level of reliability that is comparable to that of other black-box ML models, while still maintaining the ability to be explained and understood in an intuitive manner. The present study employed a dataset comprising work zone crashes occurring on highways under the jurisdiction of the state of New Jersey between the years 2017 and 2018. The problem of imbalanced crash data was also mitigated by employing data augmentation techniques, including SMOTE, borderline-SMOTE, and SVM-SMOTE, with the objective of addressing the issue of imbalance. The EBM model was trained with Bayesian optimization using the processed data. The evaluation of the EBM model’s performance was conducted by utilizing holdout data, and subsequently comparing it to black-box ML models including KTBoost, LightGBM, and XGBoost. The performance of the EBM model and other black-box ML models differed slightly, but was comparable. The finely tuned EBM model using borderline-SMOTE-treated data outperformed other black-box ML models on the testing dataset, achieving higher precision (81.37%), recall (82.53%), G-mean (75.39%), and MCC (0.43).
Subsequently, the EBM model exhibited effectiveness in the interpretation of data from both a global and local standpoint. The factor of crash type was found to be of utmost importance in determining the injuries sustained in work zone-related crashes, with road system type ranking second in significance. In the context of pairwise interaction, it was observed that the combination of road median type and crash type had the greatest impact on work zone-related crashes. The findings of this study revealed that a significant proportion of injuries in work zone-related accidents can be ascribed to distinct categories of crashes, including rear-end collisions in the same direction, right-angle collisions, head-on collisions in the opposite direction, vehicle overturning, and incidents involving pedestrians and bicyclists. Likewise, there is a higher likelihood of work zones on New Jersey state highways with concrete surfaces leading to injuries. The EBM model facilitates users in understanding the categorization of novel cases and the methodology involved in generating predictions. This fosters a greater sense of confidence in the transparent nature of the glass-box model in contrast to the black-box model.
The outcomes of this research will yield significant perspectives for the analysis of crashes associated with work zones and policymakers within the realm of traffic safety. Further research could be conducted by employing alternative sophisticated glass-box ML models. In the same way, future research efforts could be expanded by incorporating additional data augmentation techniques to address the issue of imbalanced work zone crash data. This study utilizes a dataset encompassing a two-year period from 2017 to 2018. Future studies will incorporate additional work zone crash data from the State of New Jersey and other regions.


 ,
, 