Article

How to Keep Drivers Attentive during Level 2 Automation? Development and Evaluation of an HMI Concept Using Affective Elements and Message Framing

Chair of Ergonomics, School of Engineering and Design, Technical University of Munich, 85748 Garching, Germany
*
Author to whom correspondence should be addressed.
Safety 2022, 8(3), 47; https://doi.org/10.3390/safety8030047
Submission received: 24 May 2022 / Revised: 23 June 2022 / Accepted: 24 June 2022 / Published: 28 June 2022
(This article belongs to the Special Issue Adaptive Human-Machine Interface)

Abstract

:
With Level 3 and 4 automated driving activated, users will be allowed to engage in a wide range of non-driving related activities (NDRAs). Although Level 2 automation can appear very similar to L3 and L4, drivers are required to always monitor the system. However, past research has found drivers neglect this obligation at least partly and instead engage in NDRAs. Since this behavior can have negative impacts on traffic safety, the goal of this work was to develop a human–machine interface (HMI) concept to motivate users to continue their supervision task. This work’s concept used message framing in connection with affective elements. Every three minutes, messages were displayed on the head-up display. To evaluate the affective message concept’s (AMC) effectiveness, we conducted a between-subject driving simulator study (baseline vs. advanced HMI) with 32 participants and 45 min of driving time with both L2 and L4 phases and a silent system malfunction. Results show the road attention ratio decreases and the NDRA engagement ratio increases over time only for baseline participants. Participants supported by the AMC did not show a change over time in monitoring behavior and NDRA engagement. However, no effect on the drivers’ reaction to the system failure became apparent. No effects on subjective workload and user experience were found. Additional research is needed to further investigate the safety implications and long-term effectiveness of the concept, as well as a driver-state-dependent design.

1. Introduction

With the ongoing development of automated driving functions, new human factor issues arise. The possibility of legally engaging in many activities unrelated to the driving task, so-called non-driving related activities (NDRAs), changes the use of travel time. Level 3 automation, which takes over longitudinal and lateral control and does not need supervision by the driver, is similar to L4, which is additionally capable of performing minimal risk maneuvers [1]. Although a reliable Level 2 automation can appear very similar to L3 and L4, drivers need to always supervise the system to be ready to take over vehicle control immediately, e.g., in the event of a system malfunction or a request to intervene (RtI). Thus, engaging in visually and manually distracting NDRAs will only be allowed during L3 or higher. Previous research already found cases of misuse of reliable but imperfect automation systems. The goal of this work was thus to develop a human–machine interface (HMI) concept that motivates users to continue their supervision task during L2 automated driving.
Research in aviation on human behavior in highly reliable automated systems found time on task increases trust and worsens monitoring behavior [2]. For L2 driving systems, which can already be found on the market (e.g., Tesla Autopilot, Cadillac Super Cruise), a variety of driving simulator and on-road studies investigating drivers’ monitoring behavior and NDRA engagement have been conducted. Drivers were found to disengage from their monitoring task easily and rather engage in NDRAs [3,4,5,6,7]. These findings are consistent with recent research on mode awareness (general knowledge of levels and currently engaged level [8]) in vehicles with both L2 and L3 automation: In studies by [9,10], participants increased their NDRA engagement with exposure duration. In turn, visual attention deteriorated during L2 driving with exposure duration and frequency. Low visual attention to the road ahead during L2 automated driving can lead to an increased crash probability since the likelihood of appropriate intervention in the event of a system malfunction is significantly reduced [10,11,12]. No impact of drivers’ hand position (on vs. off the steering wheel) was found on driver performance in critical scenarios [13,14]. Ref. [15] predicts a high rate of unsafe outcomes in plausible automation failure scenarios, Ref. [16] reports that more distractive NDRAs result in impaired take-over capabilities, and past accidents with Tesla Autopilot [3] or the Uber car [17] are examples of these risks that have the potential to counteract the expected positive effects of automation on traffic safety and may thus negatively shape the image of this technology. Furthermore, the perception of a lack of safety creates reluctance towards the use of automated driving functions and the behavioral intention to use [18]. Ref. [10] assessed the reasons for drivers’ neglect of the monitoring task and reported over-reliance, physical tiredness, and higher attractiveness of NDRAs compared to the monitoring task. Lack of mode awareness, however, was not the main cause of the violations.
Potential countermeasures can be found in [19]: a positive mood or emotion can help the driver regain the capability of effective self-regulation. Additionally, self-exhaustion or excessive mental workload might be counteracted when drivers have a positive affective state [19]. Thus, enhancing the users’ ability to self-regulate can potentially improve their ability to refrain from seemingly more attractive NDRAs. Different approaches to regulating drivers’ emotions have already been developed, e.g., ambient light, empathic speech, relaxation techniques, and biofeedback aimed at angry or fatigued drivers [20]. Furthermore, a common approach used to implement emotion regulation is to deliver information via facial expressions, e.g., by using smiley faces on road speed signs. In a naturalistic driving study, this concept has proven to be effective in reducing average speeds and decreasing the number of speed violations [21]. Facial expressions have also been used in embodied robots for in-vehicle infotainment systems such as the NIO NOMI [22] and the Affective Intelligent Driving Agent (AIDA) [23]. The latter was previously found to induce more enjoyment during driving as its empathetic communication style resembles social dialogue and can significantly increase user satisfaction [23]. Another often-used approach to address information about driving safety is message framing. Studies have shown that different strategies of message formulation influence behavior adoption rates and their efficiency [24]. This concerns multiple dimensions of a message, including gain and loss framing. The protection motivation theory (PMT), a social cognitive model with the main components threat appraisal (negative results of maladaptive behavior) and coping appraisal (positive aspects of the alternative behavior), can be used to explain and predict behavior: one’s intention to engage in an activity is influenced by the cognitive response to maladaptation (e.g., speeding) and alternative behaviors (e.g., driving at reasonable speeds) [25]. The results of a study by [26] indicate that anti-speeding messages based on PMT have a higher effectiveness than previously used messages in France. In general, [27] found different anti-speeding messages presented on signs along a highway in France to reduce speeds. This was more effective when drivers encountered gain-framed rather than loss-framed messages. In line with this, greater persuasiveness of negative appeals was found only immediately after exposure; positive appeals resulted in greater improvements over time [24].
Based on the issues of L2 automation described above (i.e., increasing tendency to engage in NDRAs, decreasing quality of monitoring behavior with exposure duration, and insufficient reaction in system malfunction scenario), the goal of this study was to dissuade users from engaging in NDRAs while driving in L2, thereby improving monitoring behavior, and subsequently ensuring a reliable response to system malfunctions. Therefore, an appropriate HMI concept with both affective elements and message framing was developed. The following research questions were pursued:
  • Does a time-based affective message concept improve drivers’ monitoring behavior (and NDRA engagement rate) compared to a baseline without affective messages?
  • Does an affective message concept improve drivers’ reaction to a silent system malfunction compared to a baseline without affective messages?
Due to the study results described above, we expect our HMI concept to stabilize the road attention ratio over different L2 driving phases at a high level. In line with this, we anticipate participants to refrain from NDRA engagement during L2 phases and to have a better reaction to a silent system failure. Furthermore, we expect the concept to achieve a higher hedonic quality in the user experience rating due to positive emotional aspects. The subjective workload is expected to stay constant, as messages were designed to be very short and easily understandable, or even drop compared to a baseline due to the positive emotion induced.
This study’s results prove the potential of the developed affective message concept to stabilize monitoring behavior over time. However, no positive effect on drivers’ reactions in the researched system malfunction scenario were observed. Future studies need to look into the long-term effectiveness of the concept, further assess the impact on driver reaction in different take-over and malfunction scenarios, and design and research the potential of a driver-state-based approach.

2. Materials and Methods

2.1. HMI Design

The goal of this study was to assess the impact of an affective message concept (AMC) on driver behavior during L2 automation. Thus, this concept was developed based on the literature and an expert study and compared to a baseline concept in an experimental drive with both L2 and L4. Drivers were not required to have their hands on the steering wheel during L2. Thus, the automation levels only differed in the respective HMI.

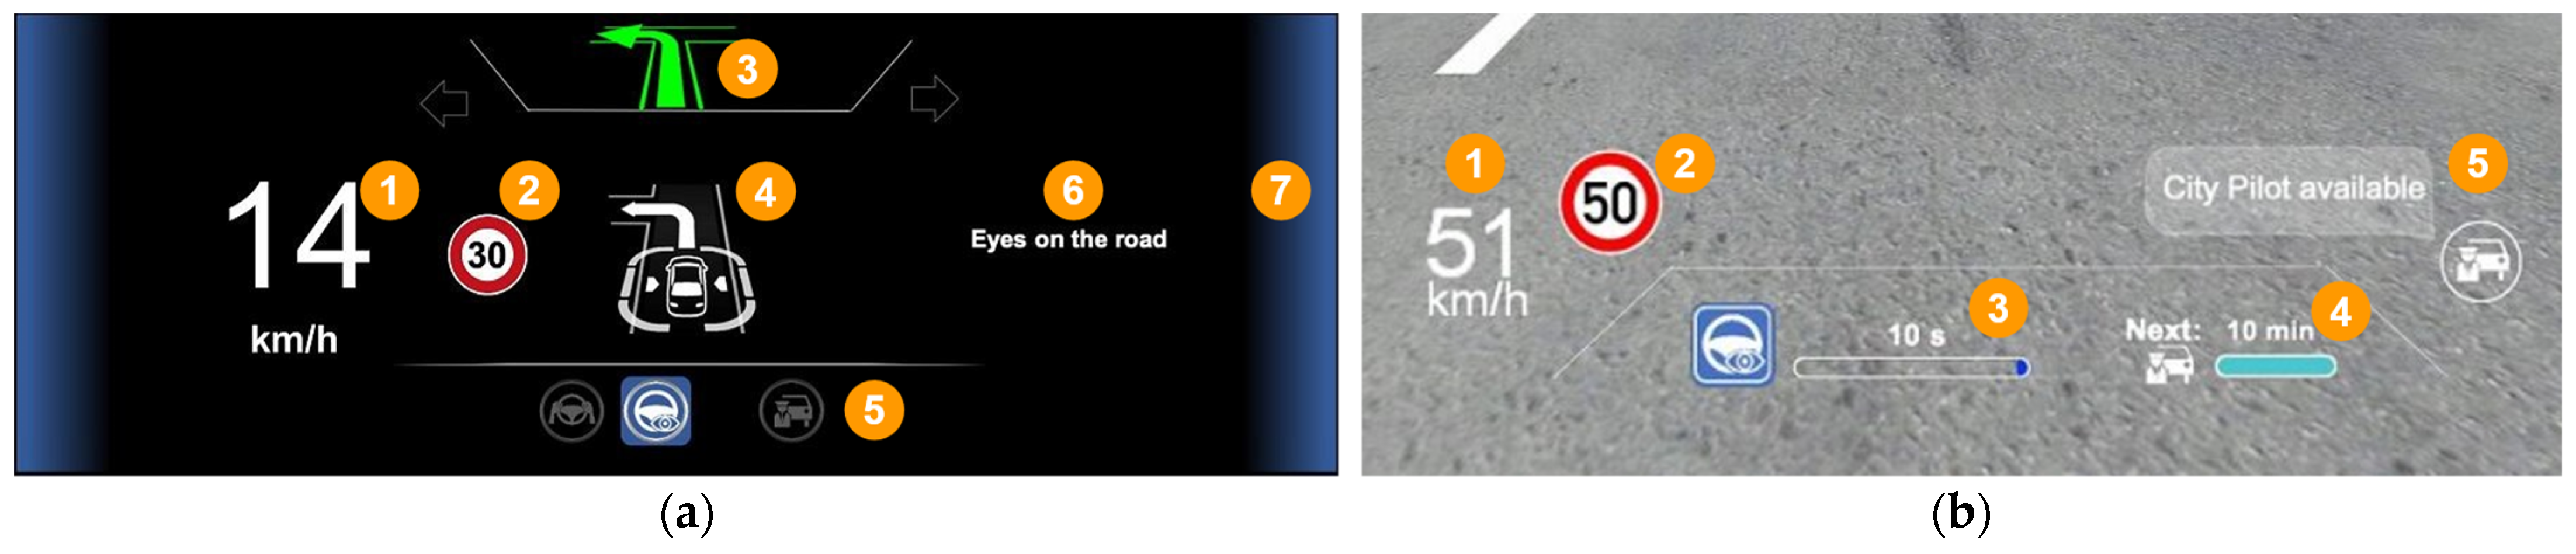
2.1.1. Baseline Concept

The baseline concept consisted of an adaptive instrument cluster (IC) based on [28], an ambient light display (ALD), and a head-up display (HUD). The IC contained the current speed, maneuvers, traffic and speed limit signs, navigation information, and system status (see Figure 1). Inactive system status icons appeared transparent. The current level was highlighted using cyan for L4 and blue for L2 [10]. The colors were replicated not only in the edges of the IC (see Figure 1), but also in the HUD, and by using the ALD. The latter was implemented by installing an LED stripe on the dashboard with good peripheral visibility [29].
The availability of an automated driving function was indicated by a white ALD, an auditory notification, and pop-up messages in the IC and HUD. Successful activation of the automation by pressing a green button on the steering wheel was reflected in the IC and ALD. To upgrade the system from L2 to L4 (if available), subjects had to press a black button on the steering wheel. While this toggle logic might not be the most convenient solution, it was supposed to enhance the participants’ mode awareness. Direct activation of L4 from manual driving was also possible but no direct transitions from L4 to L2. The latter was again considered helpful for mode awareness [10]. Engaged automation could be disengaged by pressing the green button, steering, braking, or accelerating. In the event of a recognized system limit during L2, the driver was prompted to take over manual control by a single beep and a text message in the IC, supported by a red ALD. Furthermore, predictive elements for both current and upcoming sections were implemented in the HUD alongside speed, speed limits, and system status (in accordance with their appearance in the IC; see Figure 1). When a predictable system limit was reached with L4 engaged, a visual and auditory take-over cascade was initiated. The first RtI was issued 28 s prior to the predicted system limit via an auditory signal, a text message, and an icon in the IC. Additionally, the ALD turned orange and the driver was informed about the type of system limit (e.g., construction site, bottleneck situation, etc.). Further RtIs were issued fourteen and seven seconds before reaching the limit. The ALD and the frames in the IC turned from orange to red after the second, more salient beep tone, and started to flash red seven seconds before the limit. In the event of non-interventions by the driver at the system limit, the system decelerated to a standstill.

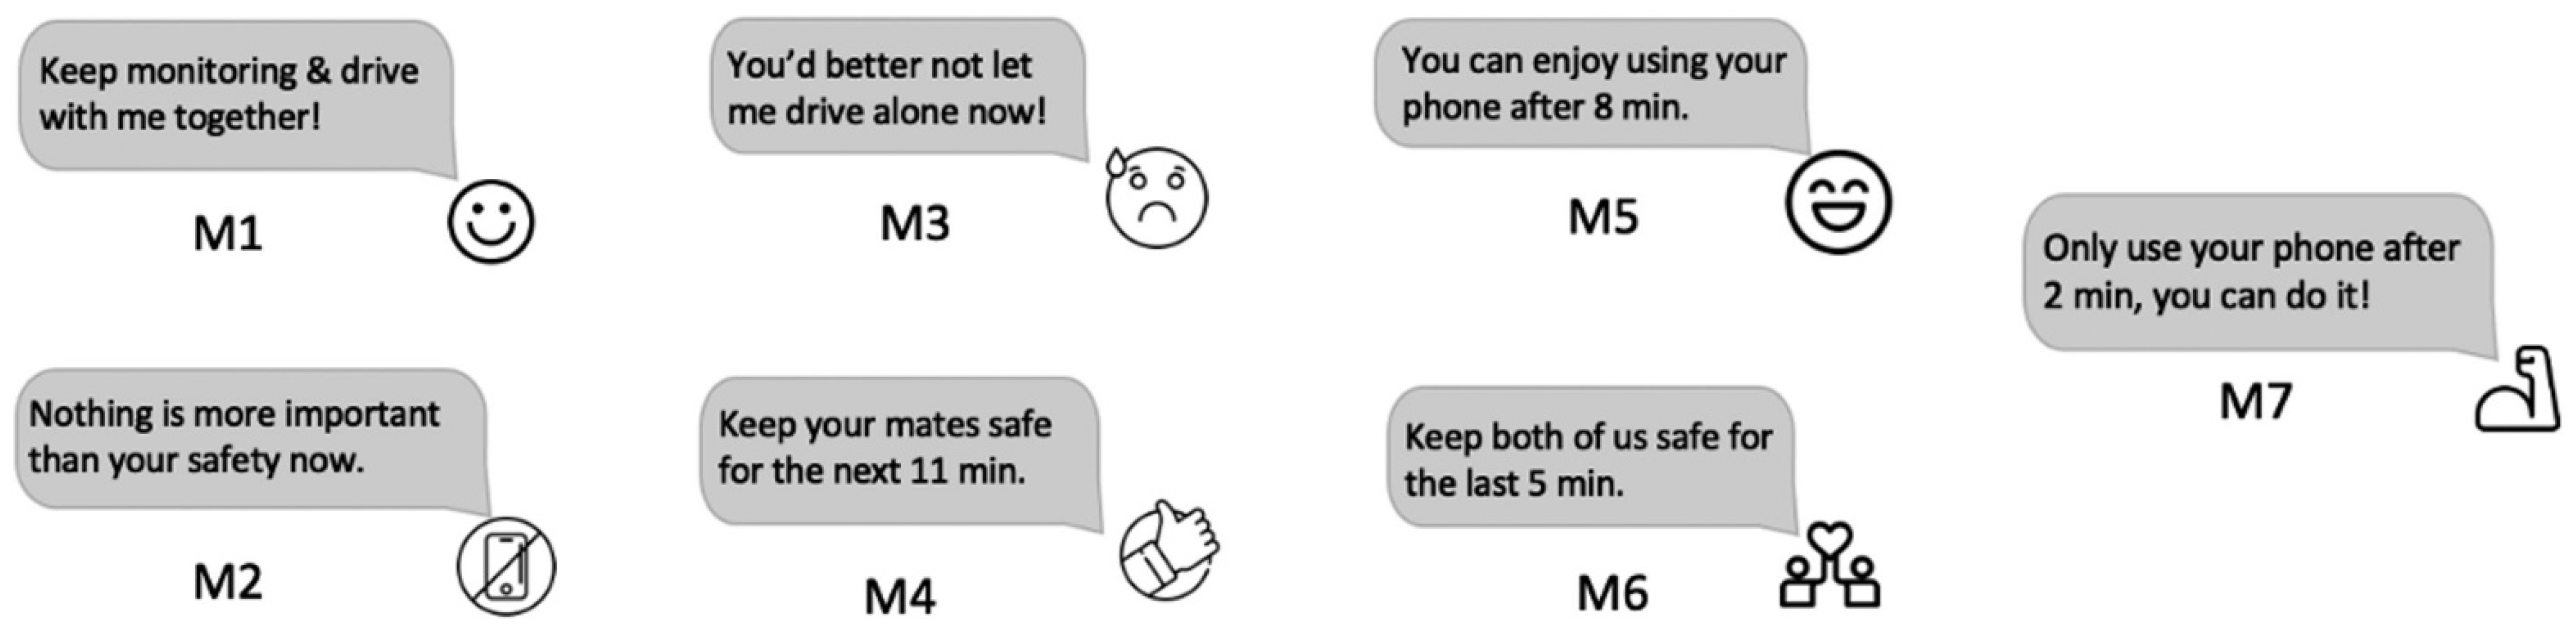
2.1.2. Affective Message Concept (AMC)

To positively influence the drivers’ monitoring behavior, several messages were written based on PMT and connected with suitable emoticons. Two ways of communicating the affective messages were designed. Concept 1 used short pop-up messages along with emoticons displayed in the IC and additionally communicated the messages via auditory speech output. Concept 2 displayed the messages and emoticons in the HUD instead of the IC and omitted the speech output. An expert interview was conducted to identify the most suitable concept and evaluate the different messages and emoticons.
Four usability experts (three male, one female) with an average age of 27 years (SD = 2.16) were interviewed online. Three experts preferred messages in the HUD, as drivers do not need to divert their visual attention to perceive the messages. One expert had concerns regarding the HUD being overloaded and thus favored speech output. Based on the experts’ assessment, the final concept was designed to be displayed in the HUD. Seven messages were chosen complemented by an emoticon (see Figure 2). The messages appeared on the right side of the HUD and marked the only difference between the baseline and AMC. The messages popped up for one minute every three minutes during L2 driving. Their appearance was supported by a neutral notification sound.
Messages and emoticons were designed to induce a positive mood and a coping appraisal. The concept followed a simple time-based approach rather than a driver-state-based one. With M1 appearing directly after the activation of L2, the cooperative aspect of L2 automation was highlighted. M3 also emphasized the cooperativeness, but with a negative spin. M2, M4, and M6 were worded according to perceived response efficacy and emphasized the importance of safety in driving. While M2 puts focus on the driver, M4 and M6 were formulated based on the aspect of the so-called third-person effect which suggests that individuals tend to perceive a message as more relevant when formulated about others rather than themselves [30]. In M5 and M7, the possibility of engaging in NDRAs after the current L2 section was highlighted, conforming to the definition of perceived response cost. Emoticons were selected based on sentence meanings. The order of appearance can be found in Figure 3.

2.2. Method

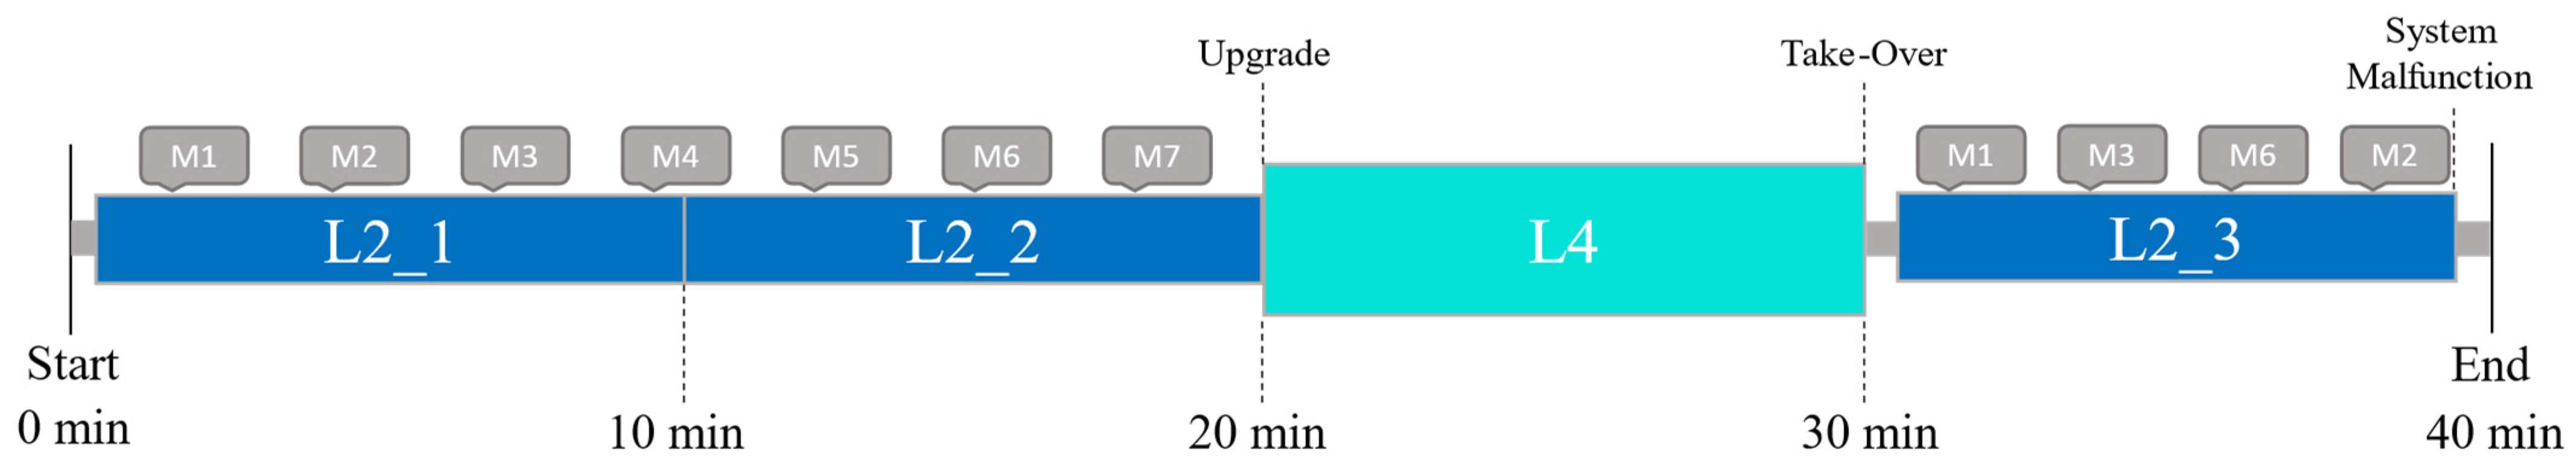
2.2.1. Experimental Design

A 2 × 3 mixed factorial design was used with participants randomly assigned to the between-subject factor HMI (Baseline vs. AMC). Both HMI concepts included the same IC and ALD design. The only difference was the absence of the affective message assistant in the HUD of the baseline group. The driving phase was specified as the within-subject factor. Three 10-min phases of L2 driving were defined and used for the gaze data analysis (see Figure 3). To ensure ecological validity, participants were allowed to use their own items such as smartphones or a provided tablet with preinstalled games and videos. Furthermore, we expected the possibility of engaging in NDRAs during the 10-min L4 segment to counteract fatigue [31].

2.2.2. Dependent Variables
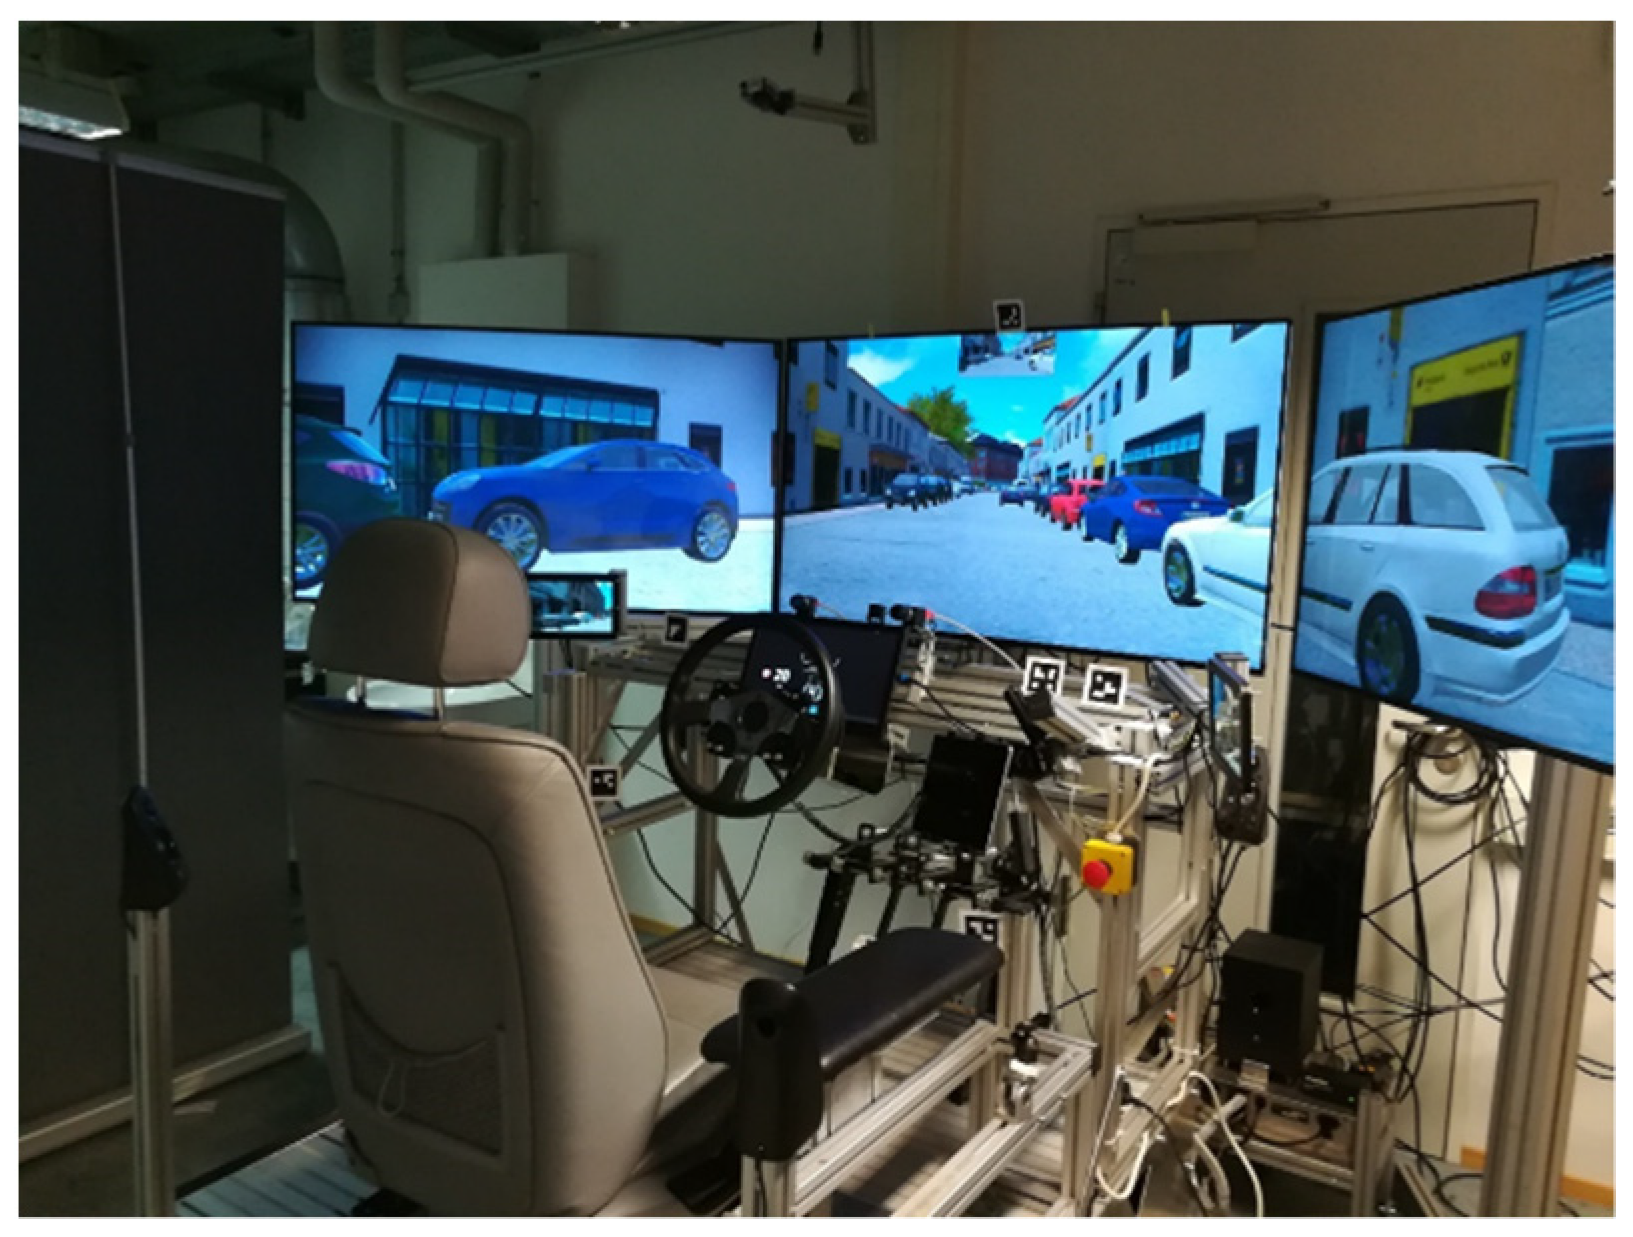
Both subjective and objective data were gathered (see Table 1) to answer the research questions. Gaze data were recorded using Dikablis glasses (head-mounted eye-tracking system). To answer the question on driver monitoring behavior, attention ratios were calculated for the area of interest (AOI) road ahead, defined as the central screen (see Table 1). The attention ratio is the total duration of all gazes in a defined AOI divided by the duration of the selected time interval. The AOI road ahead is known as the most robust measure and was also used for the 100-car study [11]. It was decided not to include gazes towards the IC in the road attention ratio as the authors of [11] suggest that checking mirrors or other driving-related instruments only enhanced safety as long as the driver’s glance returns to the road within two seconds. The criterion for valid eye-tracking data was an availability of more than 70% [32].
The number of participants engaging in NDRAs (smartphone/tablet) per driving interval was counted using GoPro videos of the experimental drive. In the second step, the participants’ attentiveness during and prior to 11 critical driving scenarios (i.e., road intersections) was classified based on a scheme by [33] (see Table 2). This was done because an intersection imposes additional demands on the cognitive abilities of drivers, and drivers had to assess numerous traffic participants and moving objects properly.
Driving data from SILAB were used to quantify take-over times in the malfunction scenario (see [34] for a similar approach). The NASA raw TLX (rTLX) questionnaire with its six items each rated from 0 to 20 was administered to assess subjective workload (total score ranging from 0 to 100) [35]. The AttrakDiff questionnaire with its 28 bipolar items on 7-point Likert scales resulting in four dimensions was used to assess user experience [36]. Further questions were asked to evaluate system understanding (retrospective interview for mode awareness based on [10]) and the AMC. Participants were also asked to rate the malfunction scenario regarding the time budget (1 = not sufficient at all to 5 = completely sufficient), criticality (1 = very critical to 5 = very uncritical), complexity (1 = very complex to 5 = very simple), and predictability (1 = very unpredictable to 5 = very predictable). This was based on the factors classifying take-over scenarios [37]. The study was conducted in English.

2.2.3. Apparatus

The experiment was conducted in a dynamic seat box located at the Chair of Ergonomics at the Technical University of Munich (see Figure 4). A motion platform from D-Box was implemented to induce pitch and roll motions. The mock-up was further equipped with pedals and a steering wheel from SensoDrive. Three 55″ ultra-HD (4096 × 2160 px) monitors created a 120° field of view. Furthermore, the mock-up featured two small displays for the side mirrors and a 13″ monitor behind the wheel to display the instrument cluster. A sound system emitted engine and environmental sounds. The driving simulator software SILAB 6.0 from the Würzburg Institute of Traffic Sciences was used to create a realistic urban driving environment. Furthermore, an ALD was installed using an LED stripe with 144 RGB LEDs per meter (Adafruit NeoPixel). It was positioned on the dashboard and connected to the driving simulator software using an Arduino Uno Rev3 microcontroller.
In both L2 and L4, the implemented driving automation carried out longitudinal and lateral control, was able to turn left or right at intersections, and was able to detect traffic signals and signs. The system drove according to speed limits and respected the traffic rules. No overtaking maneuvers were executed.

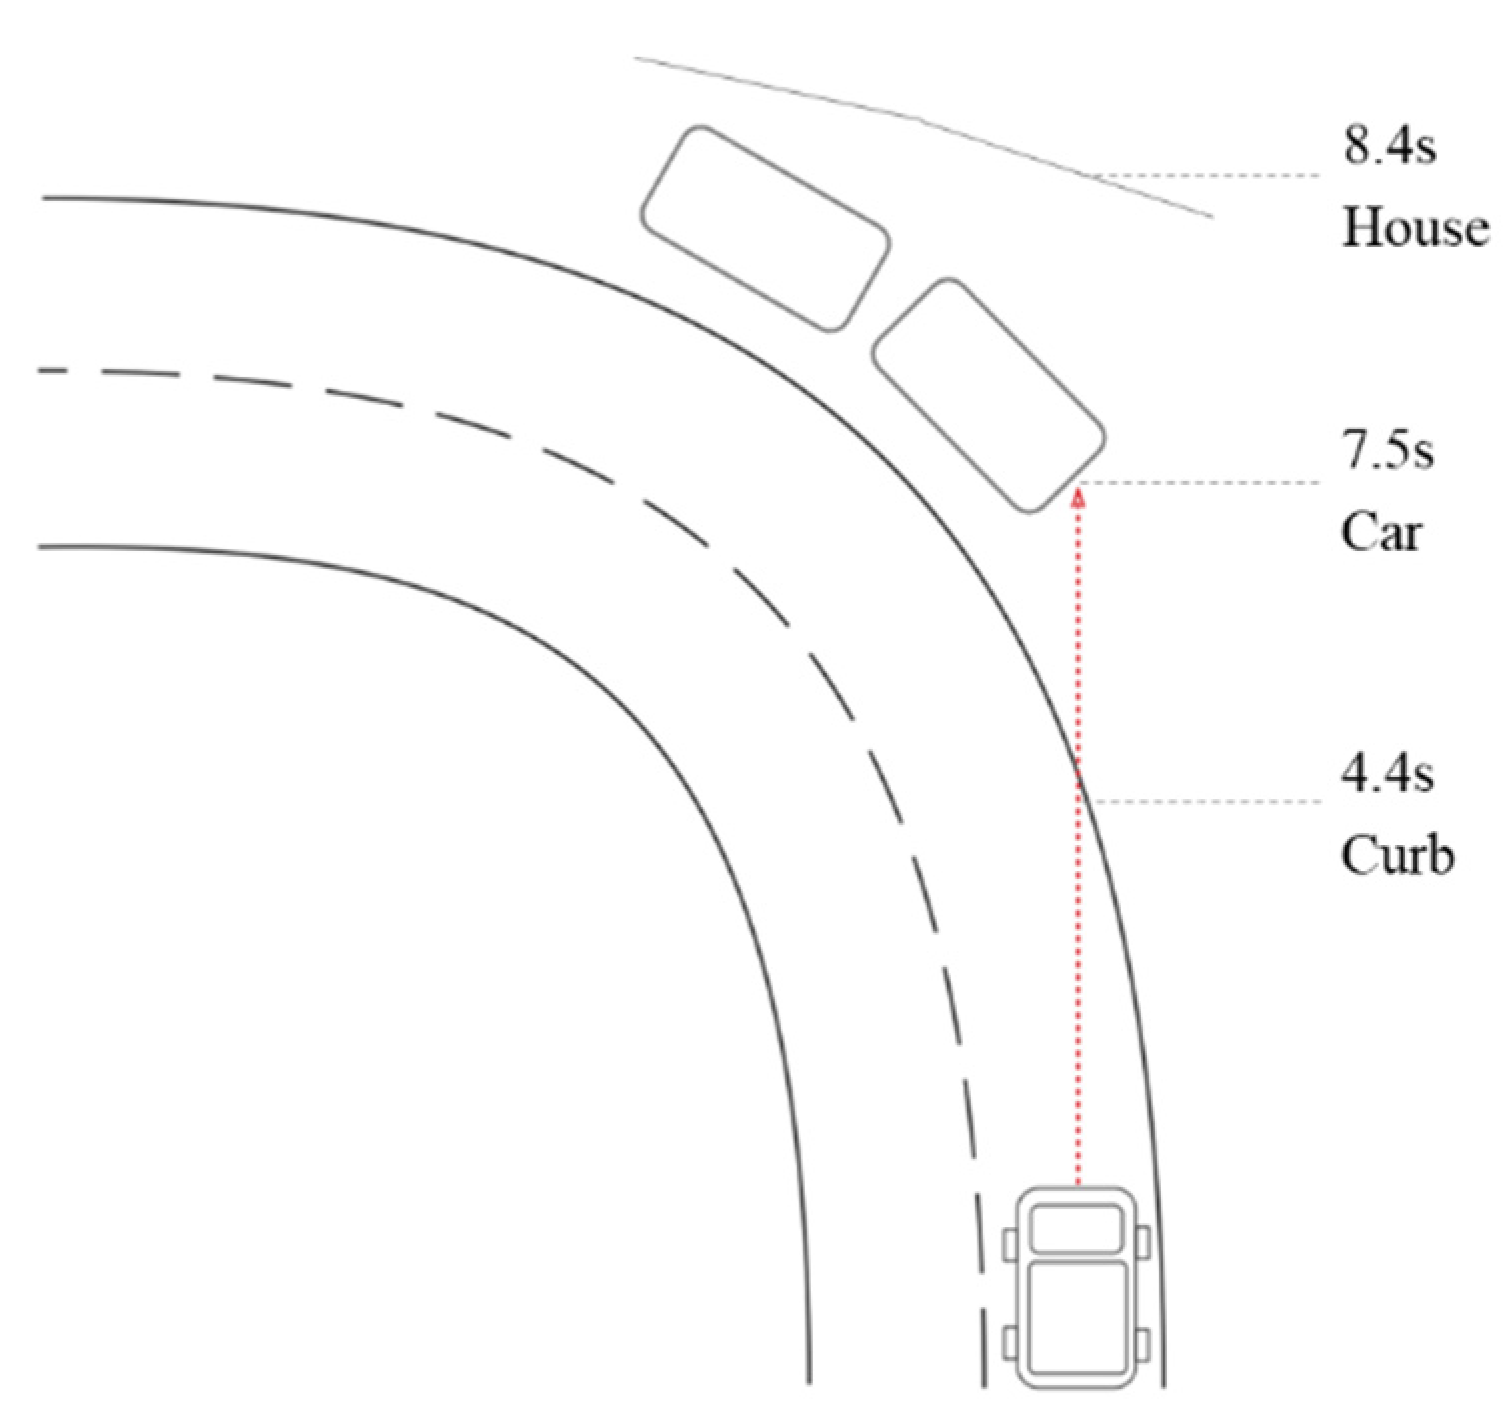
2.2.4. Experimental Track

A likely future scenario involves the availability of multiple levels of automation (LoAs) on a given route [38], and thus the experimental drive included manual driving as well as L2 and L4 automation (see Figure 3). Participants experienced infrastructure elements of different urban areas like neighborhoods with small lanes and main roads with four lanes. L2 automation became available shortly after the start. After 20 min of driving, it could be upgraded to L4. Ten minutes of L4 were followed by a predictable RtI due to a construction site and a short manual driving segment. Then, during the last ten minutes of the experimental drive, L2 was available again. This was ended by a system malfunction the participants were not prepared for. The predictive HMI bar indicated a longer remaining time budget.
The system malfunction situation resembled the situation in [10] and was adapted to a city scenario (see Figure 5): While driving at a speed of 50 km/h on a road with one lane per direction, the ego vehicle started to deviate from the correct trajectory on a long bend. The deviation was justified by a structural tar line on the road the system was following instead of regular lane markings. About four seconds after the deviation began, the vehicle hit a curb, causing the seat box’ moving system to react. Three seconds later, resulting in a total time budget of about seven seconds, the vehicle crashed a parked car. If no intervention took place until then, the vehicle crashed into a house approximately one second later. About one second prior to the crash with the parked car, the automation disengaged, causing the ALD to change to white. According to [37], the situation can be characterized as having high urgency, low predictability, high criticality, and a high complexity of driver response.

2.2.5. Procedure and Instructions

After having read the safety instructions and having signed the consent form, participants filled out a demographic questionnaire. Then, they were given basic information on the study procedure. Next, sitting in the driving simulator, they received instructions including information on L2 and L4 automation, the HMI concept, the need to supervise during L2, and the possibility of engaging in NDRAs during L4. Both groups received the same instructions. The AMC was not explained. For better mode awareness, the L2 function was named City Assistant, while the L4 automation was named City Pilot. Participants were informed in the written instructions that system malfunctions could occur at any time when City Assistant was active. City Assistant and City Pilot should be used as much as possible. During the subsequent familiarization drive, participants experienced manual driving, L2 and L4 automation, and the respective activation and deactivation processes. Furthermore, predictable system limits in both LoAs were experienced. However, a system malfunction scenario was not included in the familiarization drive to mitigate learning effects. Prior to the experimental drive, the Dikablis eye-tracking system was calibrated. Participants were again instructed regarding the differences between the LoAs, thus verbally repeating written guidance. After the drive, participants were asked to complete a post-drive questionnaire followed by a semi-structured interview on the system malfunction scenario, reasons to engage in NDRAs (if observed), and comments on the concept in general.

2.2.6. Statistical Analysis

Statistical analysis was performed using IBM SPSS 24. To test the hypothesis on monitoring behavior, an analysis of variance (ANOVA) was conducted. As the ANOVA was found to be sufficiently robust to withstand any violation of normal distribution, it was calculated even in the event of normality violation [39]. Levene’s test was used to assess variance homogeneity. The results were interpreted despite the violation of error variances, as the ANOVA was found reasonably robust to violations of this assumption if the size of the groups is similar [40] (p. 249). Furthermore, t-tests for independent samples or relevant non-parametric tests were calculated to test further hypotheses. Likert scales that are used for calculating total scores were considered suitable for parametric testing, whereas single-item responses were considered to be ordinal and thus required non-parametric testing [41]. In the case of multiple comparisons for subjective ratings, the alpha level was adjusted using the Bonferroni–Holm method [42]. The alpha level initially tested was α = 0.05. Effect sizes were interpreted based on Cohen’s benchmark [43].

2.2.7. Sample

A total of 34 participants took part in the study. They were recruited via postings at the Technical University of Munich and were required to possess a valid driver’s license. Due to technical problems with the simulator, two of them had to be excluded. The remaining sample thus contained 32 valid data sets, 16 per HMI condition. Eighty-one percent of the participants were students of various majors, the remaining six subjects had jobs in different fields. The baseline group’s participants (8 male, 8 female) had an average age of M = 26.44 years (SD = 2.61), and the mean age of the AMC group (6 male, 10 female) was M = 25.94 (SD = 1.57). Furthermore, 13 participants (81.25%) of the AMC and 12 (75%) of the baseline group had taken part in driving simulator studies before. Reported median knowledge of automated driving was Mdn = 3.5 for the baseline and Mdn = 4 for the advanced group, rated on a 5-point Likert scale from 1 = very low to 5 = very high. Average driver’s license possession was M = 6.63 years (SD = 3.34). Eighteen participants answered that they drove less than 5000 km/year, ten between 5000 and 9999 km/year, three between 10,000 and 19,999 km/year, and one more than 20,000 km/year. Two reported using a car daily, nine several times per week, eleven several times per month, eight less than once per month, and two even less. Furthermore, driving-related-risk taking was assessed using an unpublished questionnaire for driving-related risk-taking previously also used in [10]. Both groups reported similar risk-taking values (BL: M = 29.63, SD = 2.73; AMC: M = 30.69, SD = 2.36). In both groups, 13 subjects reported that they liked emoticons and often use them, while three per group answered that they liked emoticons but only use them occasionally. No participants reported disliking emoticons.

3. Results

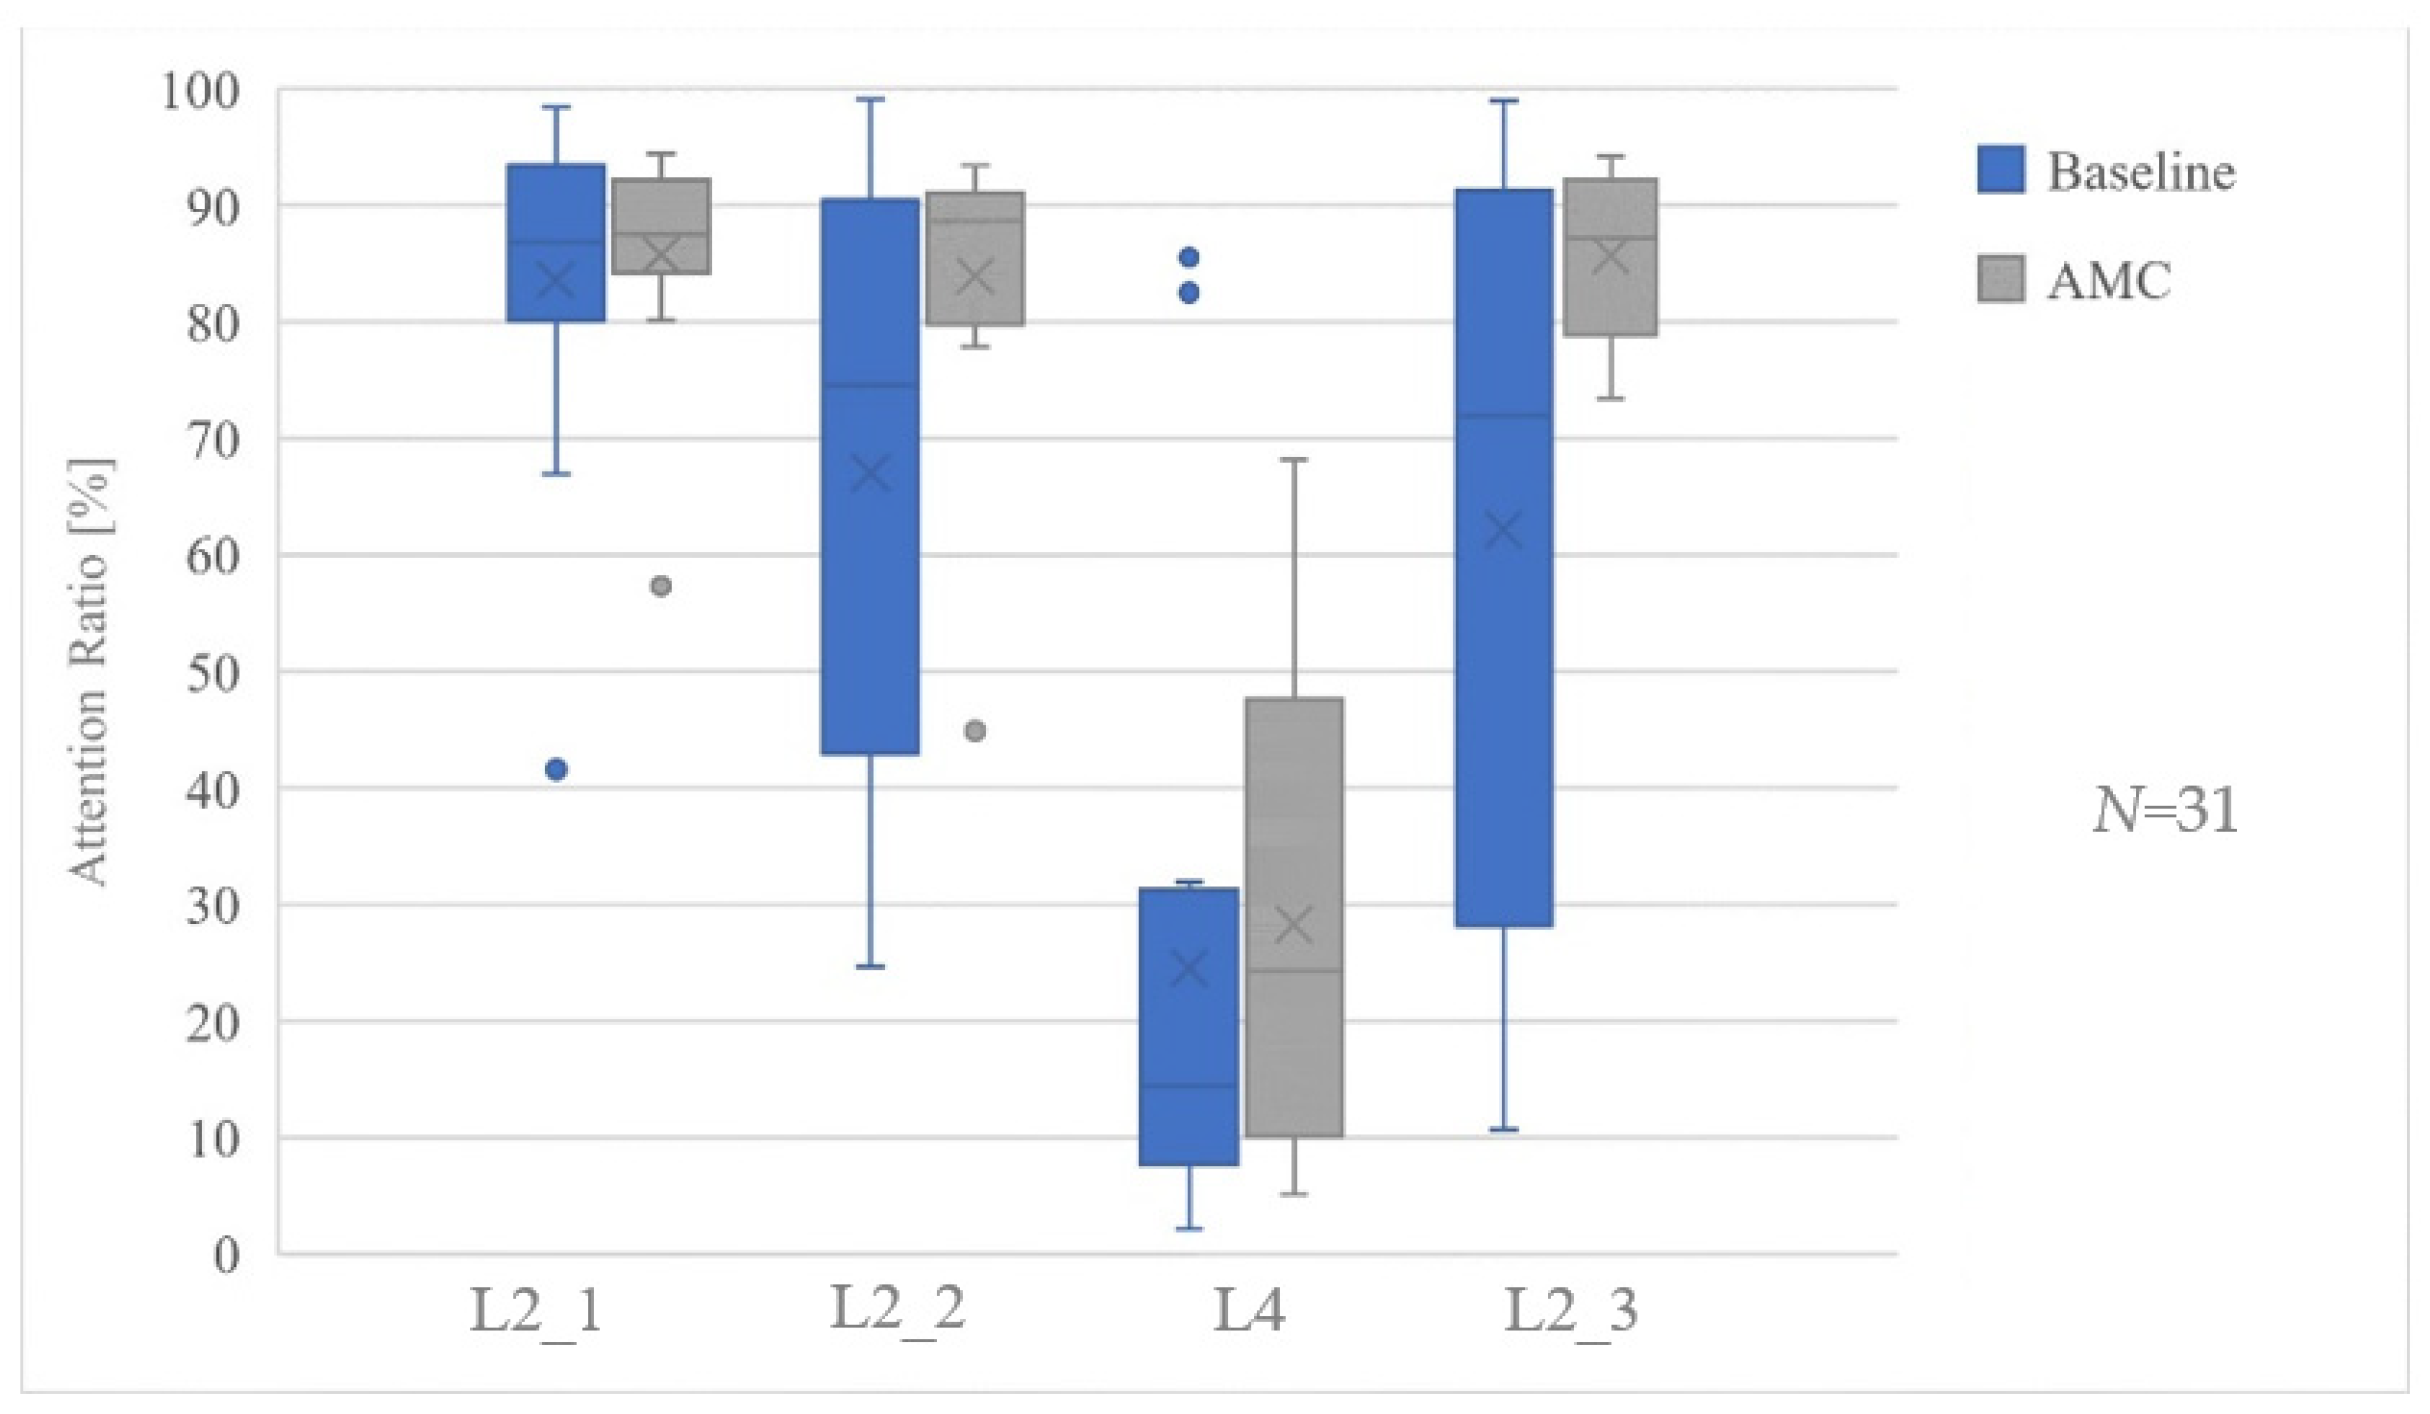
3.1. Monitoring Behavior

The eye-tracking data of one subject (AMC group) were excluded due to a malfunction of the eye-tracking system. All remaining 31 data sets showed a high availability (>70%) with an overall mean data availability of 89.28%.
While in both groups the attention ratio for the road ahead was high during the first ten minutes of L2 (BL: M = 83.61, SD = 13.82; AMC: M = 85.74, SD = 8.98), mean values clearly decreased during L2_2 for baseline participants (M = 67.05, SD = 26.02), but not for the AMC group (M = 83.96, SD = 12.05). Participants of both groups restricted their road monitoring during the L4 phase (BL: M = 24.52, SD = 25.16; AMC: M = 28.27, SD = 19.82). While the AMC group’s attention ratio went back to high rates (M = 85.72, SD = 6.85), it dropped further for the AMC group (M = 62.14, SD = 32.34; see Figure 6).
To assess the effects of both Level 2 driving duration and the HMI concept on participants’ monitoring behavior (road ahead AR), a 3 × 2 ANOVA was calculated. The analysis did not include the L4 phase. Normality assumption was violated in all except the L2_3 AMC group, as assessed by the Shapiro–Wilk test. Levene’s test shows heterogenous error variances for L2_2 and L2_3.
The calculated ANOVA reveals a statistically significant interaction between time and the HMI group (F(2, 58) = 5.153, p = 0.009, partial η2 = 0.151). Therefore, the simple main effects for the between-subject factor were calculated, showing that, starting from L2_2, attention ratios differed significantly. Analyzing the simple main effect of the within-subject factor L2 exposure duration shows a statistically significant and large effect of time on AR values for the baseline group (F(2, 30) = 6.282, p = 0.005, partial η2 = 0.295) and no such effect for the AMC group (Greenhouse-Geisser F(1.119, 15.671) = 0.531, p = 0.497).
Overall, more males in both groups violated the monitoring obligation (BL: 6 male, 4 female; AMC: 2 male, 0 female).

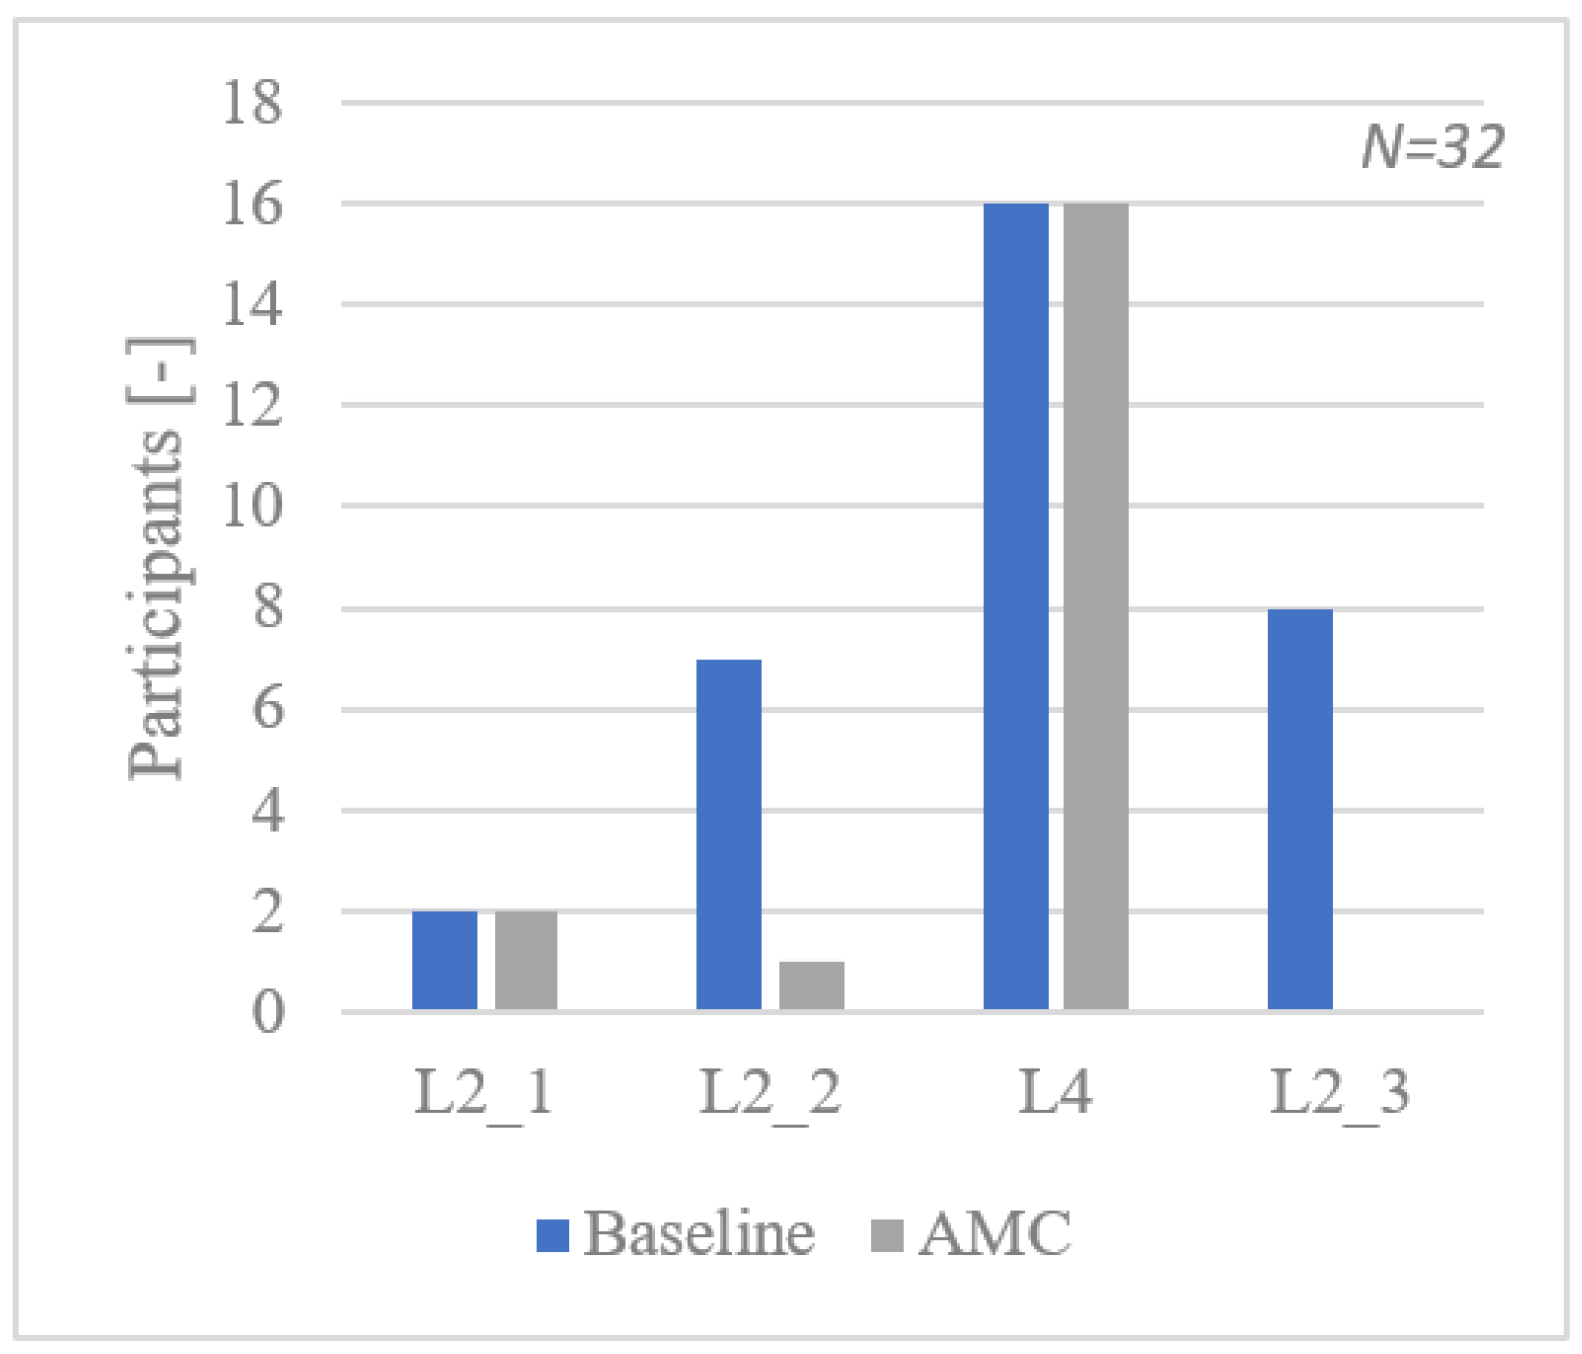
3.2. NDRA Engagement

In the L2_1 phase, two participants per group engaged in NDRAs. This increased to seven baseline participants in L2_2 and decreased to only one advanced group subject. During Level 4 driving, all participants engaged in NDRAs. While this number went down to zero during the L2_3 phase in the advanced group, half of the baseline group’s subjects (8) chose to seek NDRA engagement (see Figure 7).
In line with monitoring behavior and overall NDRA engagement, baseline participants’ engagement increased over time (max: 50% engaged), while not more than one advanced group subject engaged per intersection (see Figure 8).
According to the subjects, the main reason for doing so was over-reliance, followed by boredom, and fatigue (see Table 3). One baseline participant explained that he identified no differences between L2 and L4 in the automation’s driving behavior and thus decided to engage in NDRAs; he was consequently rated as mode confused. One participant from the advanced group reported curiosity as the reason for the NDRA engagement: he wanted to see what would happen.

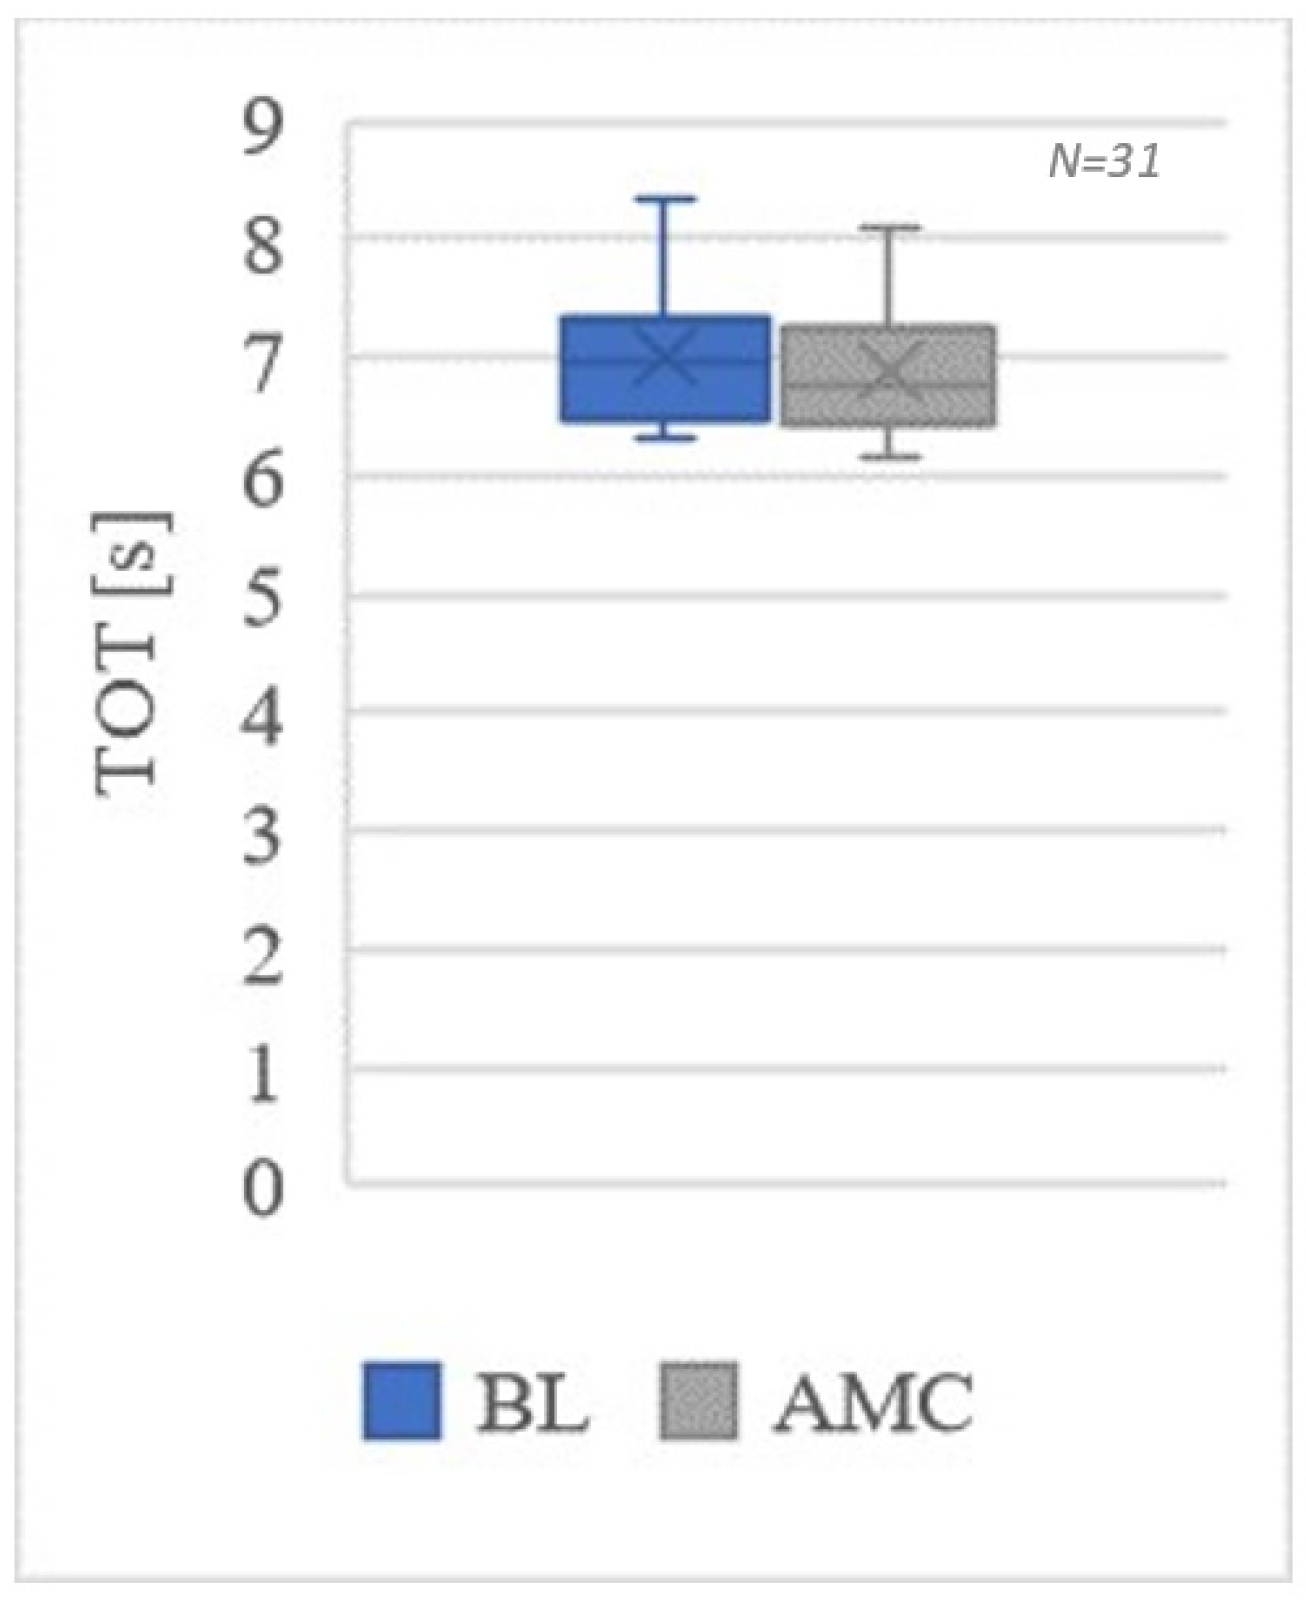
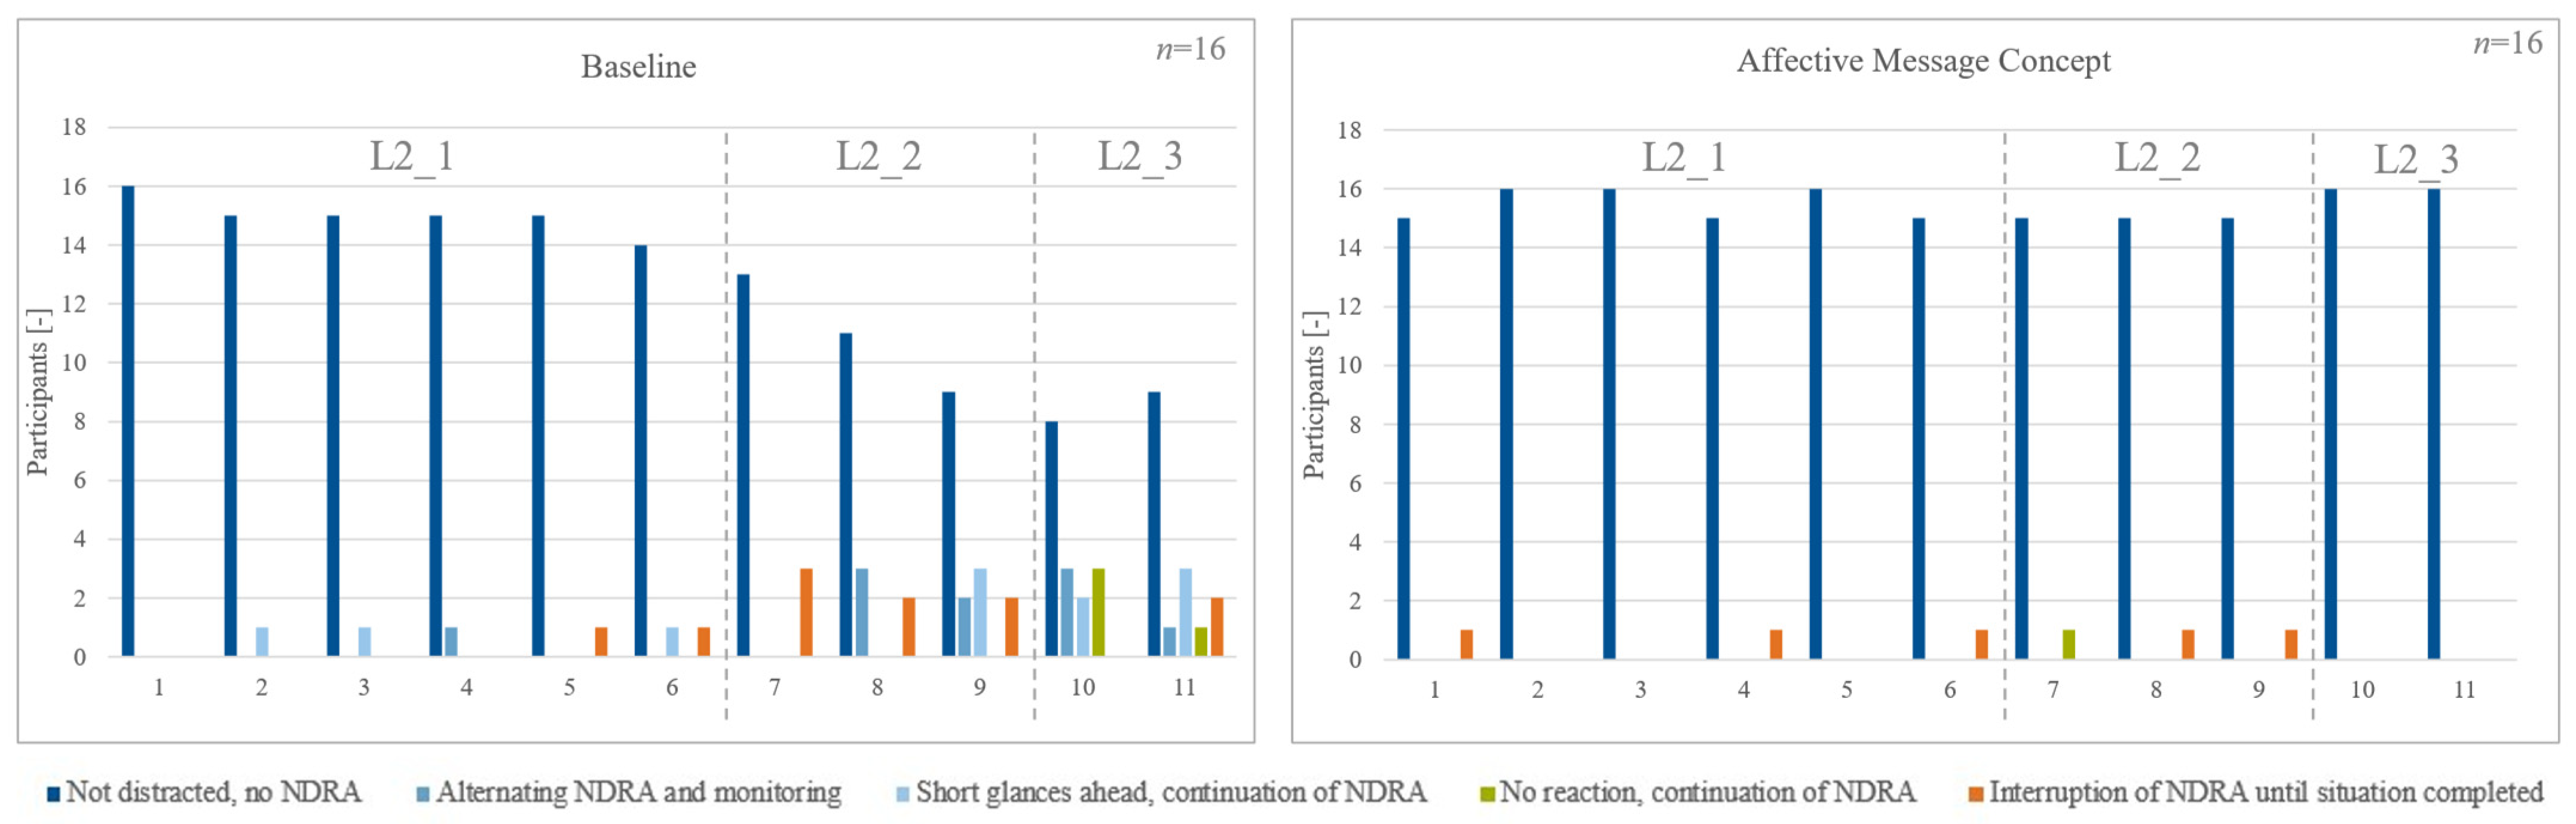
3.3. System Malfunction Scenario

The coding of participants’ attentiveness in the malfunction scenario revealed a similar pattern as in intersections: In the AMC group, no participant engaged in NDRAs, while two in the baseline group were rated alternating NDRA and looking ahead and three participants showed no reaction and continued their NDRA.
In total, 14 participants per group did not manage to avoid crashing into the parked cars. Thus, only 12.5% of the participants managed to regain control safely (i.e., without crashing). One participant only reacted after he was told to take over by the experimenter (after having hit the row of houses) and was thus excluded from the analysis of take-over time. Average take-over times show similar values for both groups with slightly shorter values for the AMC group (see Figure 9). Both groups were normally distributed as assessed by the Shapiro Wilk test; the Levene test shows homogeneity of error variances (p = 0.687). Mean take-over times appear similar (BL: M = 7.01 s, SD = 0.63 s; AMC: M = 6.88 s, SD = 0.54 s). Consequently, the calculated t-test for independent samples shows no significant differences (t(29) = 0.647, p = 0.523).

3.4. Subjective Data

Descriptively, the AMC scores better in all categories of the AttrakDiff (see Table 4), especially in both hedonic quality aspects (identity and attractiveness). Shapiro–Wilk tests show significant results in HQ-I for the baseline group (W = 0.792, p = 0.002) and ATT for the advanced group (W = 0.870, p = 0.027). Thus, Mann–Whitney U Tests were used alternatively as non-parametric methods for HQ-I and ATT. For PQ and HQ-S, independent sample t-tests were calculated. Results show no significant differences for all measures.
The subjective workload, measured using the NASA rTLX questionnaire, shows a slightly higher workload for the advanced group (M = 42.03, SD = 13.59) than for the baseline (M = 39.53, SD = 14.26). The conducted Shapiro–Wilk test was not significant, thus both groups were normally distributed. There was no significant difference between the workload scores of the two groups (t(30) = 0.508, p = 0.615).
On four 5-point Likert scales, participants rated the time budget in the system malfunction scenario as rather insufficient (1 = not sufficient at all, 5 = fully sufficient), and as medium complex (1 = very complex, 5 = very easy). In line with the driving data, it was assessed as critical (1 = very critical, 5 = not critical at all), and unpredictable (1 = very unpredictable, 5 = predictable). No differences between the HMI conditions became apparent (see Table 5).
Participants’ mode awareness was assessed with two different measures. First, completing the sentence “The automation level which I was driving at was …” on a 5-point Likert Scale from 1 = totally clear to 5 = not clear at all). In total, 93.75% rated “totally clear” or “clear”. Second, there were three control questions:
  • I have to monitor the system continuously while driving with City Assistant. (correct answers: 30)
  • When City Assistant is activated, the system is responsible for ensuring driving safety. (correct answers: 28)
  • I may perform non-driving related activities while driving with City Assistant. (correct answers: 30)
In total, 90.63% answered all control questions correctly. Two participants answered all control questions wrong, which may suggest a confused scale interpretation.
Furthermore, participants of the advanced group (n = 16) were asked to rate the effectiveness of the message concept (see Table 6). Therefore, six statements were presented and rated on a 5-point Likert scale from 1 = strongly disagree to 5 = strongly agree. Participants rated the messages as helpful for concentration on the system monitoring task and to disengage from NDRAs (only two participants engaged). Moreover, boredom can be lowered. Most participants did not feel distracted by the messages. On a scale from −2 = very low/short to +2 = very high/long, the frequency of the messages was rated well (Mdn = 0), as was the length (Mdn = 0) and the duration for which the messages were displayed (Mdn = 0). The message sound was rated with a median of 3.5 on a scale from 1 = very unpleasant to 5 = very pleasant. Moreover, participants were asked to choose the most effective message. Four participants (24%) preferred the NDRA-related messages (M4/M7), three subjects preferred the cooperation aspect (M3), and another three chose the straightforward message M1. The remaining participants highlighted messages containing safety (M2, M4, M6) or motivational aspects (M7). Three baseline participants proposed reminders for them to monitor the system in the semi-structured interview. Additionally, in the interview, the message “You’d better not let me driver alone now” was found confusing by four participants, as they perceived the system already drove alone and did not connect the monitoring to being part of the driving task.
All subjects rated the time budget elements from 1 = not helpful at all to 5 = very helpful. Both current and upcoming predictive elements were rated as helpful (Mdn = 4) across the groups. Eighty-one percent rated the current section as “helpful” or “very helpful” while 63% said so for the upcoming section.

4. Discussion and Conclusions

The longer users drive with reliable L2 automation, the more they tend to neglect their obligation to monitor the system [7,10,14]. Thus, this work investigated a concept to encourage drivers to continue the supervision task during L2 automated driving. Consequently, improved performance in a system malfunction scenario was expected. The concept was based on short framing messages in combination with suitable emoticons as part of the HUD. Unlike error-prone driver-state-based approaches, it represents an easy-to-implement time-based concept. The concept was then evaluated in a driving simulator study with 34 participants and two L2 (30 min total) and one L4 driving (10 min) segments.
We found the developed concept to have a significantly positive effect on the subjects’ monitoring behavior. When supported by the AMC, the attention ratio for the road ahead remained stable during all L2 automated driving phases and did not deteriorate as it did in the baseline group. This negative effect of exposure duration on the baseline participants’ monitoring behavior confirms previous results of reliable L2 systems with no attention or hands-on warning [6,7,10,14]. In this study, it can be explained by the engagement in NDRAs: during all L2 phases, only three engagements were counted in the AMC concept, but 17 were counted in the baseline group. Moreover, baseline participants even engaged during critical parts of the drive (i.e., intersections). In line with previous research [10], participants mostly explained their engagement with over-reliance, boredom, and fatigue. Mode confusion, however, was only a minor source of the rule breaches observed. Some participants originated their engagement in L2_2 with the flawless first ten minutes and the upcoming upgrade to L4 from which they derived a low risk of failure. Overall, more males in both groups violated the monitoring obligation, although no difference in the risk-taking rating was found. This gender effect was also identified by [24,26].
Despite the positive impact on the subjects’ monitoring behavior, no significant effects of the AMC were found for the malfunction scenario in terms of crash rate and take-over time. Although AMC group participants were rated less distracted prior to the malfunction, only 12.5% of both HMI conditions managed to avoid a crash. A similar crash rate can be found in a comparable urban lateral malfunction scenario (83.3%) [34] and with 81.8% crashers in a lateral construction site scenario in [44] (p 238). Additionally, in [10], high rates of unsafe actions in a highway malfunction scenario were observed. These high crash rates in driving simulator studies are contrasted with lower (but still high) rates of 20% to 33% in a test track study by [14]. The reasons for the high crash rate in the present study could be the low predictability of the malfunction scenario; short response times were indicated by participants. Furthermore, over-reliance was mentioned by participants and was already highlighted as a possible reason in [14]). Other explanation approaches are the general automation behavior which some participants blamed for making it difficult to recognize the malfunction, change blindness (operators miss salient events, due to blinks, saccades, or other interruptions in vision), and mind wandering (classified attentive but failed to cognitively assess the situation—indicated by two participants in the post-drive interview).
In line with the presented study, [14] found driver-state-dependent attention and hands-on reminders in the instrument cluster effectively helped keep drivers’ eyes on the road and hands on the wheel when driving with a highly reliable but supervised automation. However, 28% of the participants crashed with their eyes on the conflict objects. All crashers reported high trust in the vehicle. Thus, a possible countermeasure might be an appropriate trust calibration, e.g., via instructions or specific messages, or—if feasible—an online trust assessment with direct countermeasures. Another potential countermeasure to high crash rates could be an AR HUD featuring a boomerang chain to visualize the planned trajectory. In a driving simulator study, the authors of [34] were able to show a reduced crash rate (37.5% vs. 83.8%) when participants were supported by the concept. Thus, future studies should include trajectory information in the AR HUD, feature several system malfunction scenarios (over a long course to simulate highly reliable L2 and to further investigate the first-failure effect), and customize the AMC according to the current driver state. Additionally, a combination with speech output could be a feasible approach.
Overall, the AMC was well-rated by the subjects. According to their comments, it not only served as a regular reminder to stay alert but also facilitated empathy through its personal speech and facial expressions. NDRA-related messages were preferred by the participants, as they curbed their tendency to violate the safety instructions. In some cases, however, they had the opposite effect: the message initiated the wish to engage. For future studies, shorter sentence length might further improve the effect [26]. An improved message design also based on other social cognitive models may help by targeting different groups of users (based on personality and personal preferences). Further improvement, especially with regard to the long-term effectiveness of the messages, might be generated using nudging (see [45] for an overview). Furthermore, a learning system in combination with an eye-tracking-based driver monitoring system has the potential to assess the effectiveness of messages and adjust them accordingly. Moreover, no significant increase in workload was observed (despite the cognitive effort to process the messages). This can probably be explained by the positive emotional impact (as highlighted in the post-drive interview) and relieved fatigue. Regarding user experience, we expected the concept to improve the hedonic quality due to the positive emotion induced. However, no significant impact was found, although a non-significant tendency towards improved hedonic quality could be observed.
For the interpretation of this study, one must keep the relatively small and young sample with a high technology affinity and expertise in automated driving in mind as a limitation. Thus, future studies should investigate the issue of driver monitoring during L2 automated driving with a larger and more representative sample to generate more generalizable insights. Furthermore, the use of a driving simulator with no risks associated might have impaired the generalizability of the results. However, a study by [12] showed high NDRA engagement rates even in on-road settings. Another limitation might be the single malfunction scenario. However, [14] did not find a “first failure” effect: Two critical events with 15 min of reliable L2 automation in-between yielded comparable crash rates. For future studies, the emotional impact of the concept could be assessed better by using affective self-report tools [46] or physiological measurement methods (galvanic skin response, EEF, etc.). As visual attention alone was shown to be insufficient for safe reactions to system malfunctions, a mind wandering questionnaire could allow further insights into the reasons for crashes [47]. In general, future studies need to investigate the long-term effectiveness of the concept, which was also highlighted by two participants of the present study, for example by driving for a longer amount of time or by implementing repeated drives over the course of several days or weeks. Thereby, the long-term impact of the concept on monitoring behavior, trust, and perceived safety can be examined, potentially with participants with different L2 experience and intention to use.
While the impact of the developed AMC was positive for monitoring behavior, no positive effect was found for the reaction to a silent system malfunction, thus—and in line with previous studies—highlighting the importance of avoiding critical malfunction scenarios by design.

Author Contributions

Conceptualization, T.H. and W.Z.; methodology, T.H. and W.Z.; software, W.Z.; validation, T.H. and W.Z.; formal analysis, T.H. and W.Z.; investigation, T.H. and W.Z.; resources, K.B.; data curation, T.H. and W.Z.; writing—original draft preparation, T.H.; writing—review and editing, T.H., W.Z. and K.B.; visualization, T.H.; supervision, K.B.; project administration, T.H. and K.B.; funding acquisition, K.B. All authors have read and agreed to the published version of the manuscript.

Funding

This research was funded by research project @CITY-AF, carried out at the request of the Federal Ministry of Economic Affairs and Climate Action (Bundesministerium für Wirtschaft und Klimaschutz), under research project No. 19A18003N.

Institutional Review Board Statement

The Ethics Board of the Technical University of Munich provided ethical approval for this study. The corresponding approval code is 542/20 S-EB; Date of approval: 28 September 2020.

Informed Consent Statement

Informed consent was obtained from all subjects involved in the study.

Data Availability Statement

The data presented in this study are available on request from the corresponding author. The data are not publicly available due to ethical considerations.

Conflicts of Interest

The authors declare no conflict of interest. The funders had no role in the design of the study; in the collection, analyses, or interpretation of data; in the writing of the manuscript, or in the decision to publish the results.

References

  1. SAE International. J3016: Taxonomy and Definitions for Terms Related to Driving Automation Systems for On-Road Motor Vehicles. 2021. Available online: https://www.sae.org/standards/content/j3016_202104 (accessed on 27 June 2022).
  2. Bailey, N.R.; Scerbo, M.W. Automation-induced complacency for monitoring highly reliable systems: The role of task complexity, system experience, and operator trust. Theor. Issues Ergon. Sci. 2007, 8, 321–348. [Google Scholar] [CrossRef]
  3. Banks, V.A.; Plant, K.L.; Stanton, N.A. Driver error or designer error: Using the Perceptual Cycle Model to explore the circumstances surrounding the fatal Tesla crash on 7th May 2016. Saf. Sci. 2018, 108, 278–285. [Google Scholar] [CrossRef]
  4. Yang, S.; Kuo, J.; Lenné, M.G. Patterns of Sequential Off-Road Glances Indicate Levels of Distraction in Automated Driving. Proc. Hum. Factors Ergon. Soc. Annu. Meet. 2019, 63, 2056–2060. [Google Scholar] [CrossRef]
  5. Russell, S.M.; Blanco, M.; Atwood, J.; Schaudt, W.A.; Fitchett, V.; Tidwell, S. Naturalistic Study of Level 2 Driving Automation Functions. 2018. Available online: https://rosap.ntl.bts.gov/view/dot/41939 (accessed on 27 June 2022).
  6. Llaneras, R.E.; Salinger, J.; Green, C.A. Human Factors Issues Associated with Limited Ability Autonomous Driving Systems: Drivers’ Allocation of Visual Attention to the Forward Roadway. In Proceedings of the 7th International Driving Symposium on Human Factors in Driver Assessment, Training, and Vehicle Design, Bolton Landing, NY, USA, 17–20 June 2013; University of Iowa: Iowa City, IA, USA, 2013; pp. 92–98. [Google Scholar]
  7. Reagan, I.J.; Teoh, E.R.; Cicchino, J.B.; Gershon, P.; Reimer, B.; Mehler, B.; Seppelt, B. Disengagement from driving when using automation during a 4-week field trial. Transp. Res. Part F Traff. Psychol. Behav. 2021, 82, 400–411. [Google Scholar] [CrossRef]
  8. Monk, A. Mode errors: A user-centred analysis and some preventative measures using keying-contingent sound. Int. J. Man-Mach. Stud. 1986, 24, 313–327. [Google Scholar] [CrossRef]
  9. Feldhütter, A.; Härtwig, N.; Kurpiers, C.; Hernandez, J.M.; Bengler, K. Effect on Mode Awareness When Changing from Conditionally to Partially Automated Driving. In Proceedings of the 20th Congress of the International Ergonomics Association (IEA 2018), Florence, Italy, 26–28 August 2018; Bagnara, S., Tartaglia, R., Albolino, S., Alexander, T., Fujita, Y., Eds.; Springer International Publishing: Cham, Switzerland, 2019; pp. 314–324, ISBN 978-3-319-96074-6. [Google Scholar]
  10. Boos, A.; Feldhütter, A.; Schwiebacher, J.; Bengler, K. Mode Errors and Intentional Violations in Visual Monitoring of Level 2. In IEEE ITSC 2020 Virtual Conference, Proceedings of the 23rd IEEE International Conference on Intelligent Transportation Systems, Virtual Conference, 20–23 September 2020; IEEE: Piscataway Township, NJ, USA, 2020. [Google Scholar]
  11. Klauer, S.G.; Dingus, T.A.; Neale, V.L.; Sudweeks, J.D.; Ramsey, D.J. The Impact of Driver Inattention on Near-Crash/Crash Risk: An Analysis Using the 100-Car Naturalistic Driving Study Data; Virginia Polytechnic Institute and State University: Blacksburg, VA, USA, 2006. [Google Scholar]
  12. Louw, T.; Kuo, J.; Romano, R.; Radhakrishnan, V.; Lenné, M.G.; Merat, N. Engaging in NDRTs affects drivers’ responses and glance patterns after silent automation failures. Transp. Res. Part F Traff. Psychol. Behav. 2019, 62, 870–882. [Google Scholar] [CrossRef]
  13. Naujoks, F.; Purucker, C.; Neukum, A. Secondary task engagement and vehicle automation—Comparing the effects of different automation levels in an on-road experiment. Transp. Res. Part F Traff. Psychol. Behav. 2016, 38, 67–82. [Google Scholar] [CrossRef]
  14. Victor, T.W.; Tivesten, E.; Gustavsson, P.; Johansson, J.; Sangberg, F.; Ljung Aust, M. Automation Expectation Mismatch: Incorrect Prediction Despite Eyes on Threat and Hands on Wheel. Hum. Factors 2018, 60, 1095–1116. [Google Scholar] [CrossRef]
  15. Mole, C.; Pekkanen, J.; Sheppard, W.; Louw, T.; Romano, R.; Merat, N.; Markkula, G.; Wilkie, R. Predicting takeover response to silent automated vehicle failures. PLoS ONE 2020, 15, e0242825. [Google Scholar] [CrossRef]
  16. Hollander, C.; Rauh, N.; Naujoks, F.; Hergeth, S.; Krems, J.F.; Keinath, A. Methodological Approach towards Evaluating the Effects of Non-Driving Related Tasks during Partially Automated Driving. Information 2020, 11, 340. [Google Scholar] [CrossRef]
  17. Stanton, N.A.; Salmon, P.M. Actor Map and AcciMap: Analysis of the Uber Collision with a Pedestrian in Arizona, USA. Contemp. Ergon. Hum. Factors. 2020. Available online: https://publications.ergonomics.org.uk/uploads/Actor-Map-and-AcciMap-Analysis-of-the-Uber-collision-with-a-pedestrian-in-Arizona-USA.pdf (accessed on 27 June 2022).
  18. Meyer-Waarden, L.; Cloarec, J. “Baby, you can drive my car”: Psychological antecedents that drive consumers’ adoption of AI-powered autonomous vehicles. Technovation 2022, 109, 102348. [Google Scholar] [CrossRef]
  19. Tice, D.M.; Baumeister, R.F.; Shmueli, D.; Muraven, M. Restoring the self: Positive affect helps improve self-regulation following ego depletion. J. Exp. Soc. Psychol. 2007, 43, 379–384. [Google Scholar] [CrossRef]
  20. Braun, M.; Weber, F.; Alt, F. Affective Automotive User Interfaces—Reviewing the State of Emotion Regulation in the Car. 2020. Available online: https://arxiv.org/pdf/2003.13731 (accessed on 27 June 2022).
  21. Rattenbury, S. Smiley Faces Encourage Drivers to Slow Down. Available online: https://www.cmtedd.act.gov.au/open_government/inform/act_government_media_releases/rattenbury/2020/smiley-faces-encourage-drivers-to-slow-down (accessed on 20 April 2022).
  22. NIO. NOMI—World’s First in-Vehicle Artificial Intelligence. Available online: https://www.nio.com/blog/nomi-worlds-first-vehicle-artificial-intelligence (accessed on 20 April 2022).
  23. Williams, K.; Flores, J.A.; Peters, J. Affective Robot Influence on Driver Adherence to Safety, Cognitive Load Reduction and Sociability. In Proceedings of the 6th International Conference on Automotive User Interfaces and Interactive Vehicular Applications, Seattle, WA, USA, 17–19 September 2014; Boyle, L.N., Fröhlich, P., Iqbal, S., Burnett, G., Miller, E., Wu, Y., Eds.; ACM: New York, NY, USA, 2014; pp. 1–8, ISBN 9781450332125. [Google Scholar]
  24. Lewis, I.; Watson, B.; White, K.M. An examination of message-relevant affect in road safety messages: Should road safety advertisements aim to make us feel good or bad? Transp. Res. Part F Traff. Psychol. Behav. 2008, 11, 403–417. [Google Scholar] [CrossRef]
  25. Maddux, J.E.; Rogers, R.W. Protection motivation and self-efficacy: A revised theory of fear appeals and attitude change. J. Exp. Soc. Psychol. 1983, 19, 469–479. [Google Scholar] [CrossRef]
  26. Glendon, A.I.; Walker, B.L. Can anti-speeding messages based on protection motivation theory influence reported speeding intentions? Accid. Anal. Prev. 2013, 57, 67–79. [Google Scholar] [CrossRef]
  27. Chaurand, N.; Bossart, F.; Delhomme, P. A naturalistic study of the impact of message framing on highway speeding. Transp. Res. Part F Traff. Psychol. Behav. 2015, 35, 37–44. [Google Scholar] [CrossRef]
  28. Feierle, A.; Bücherl, F.; Hecht, T.; Bengler, K. Evaluation of Display Concepts for the Instrument Cluster in Urban Automated Driving. In Proceedings of the 2nd International Conference on Human Systems Engineering and Design II (IHSED 2019): Future Trends and Applications, Munich, Germany, 16–18 September 2019; Ahram, T., Karwowski, W., Pickl, S., Taiar, R., Eds.; Springer International Publishing: Cham, Switzerland, 2020; pp. 209–215, ISBN 978-3-030-27928-8. [Google Scholar]
  29. Bengler, K.; Rettenmaier, M.; Fritz, N.; Feierle, A. From HMI to HMIs: Towards an HMI Framework for Automated Driving. Information 2020, 11, 61. [Google Scholar] [CrossRef]
  30. Davison, W.P. The Third-Person Effect in Communication. Public Opin. Q. 1983, 47, 1–15. [Google Scholar] [CrossRef]
  31. Feldhütter, A.; Hecht, T.; Kalb, L.; Bengler, K. Effect of prolonged periods of conditionally automated driving on the development of fatigue: With and without non-driving-related activities. Cogn. Technol. Work. 2018, 21, 33–40. [Google Scholar] [CrossRef]
  32. EN ISO. 15007: Road Vehicles—Measurement of Driver Visual Behaviour with Respect to Transport Information And Control Systems: Part 1: Definitions and Parameters; Beuth Verlag GmbH: Berlin, Germany, 2015. [Google Scholar]
  33. Naujoks, F.; Forster, Y.; Wiedemann, K.; Neukum, A. Improving Usefulness of Automated Driving by Lowering Primary Task Interference through HMI Design. J. Adv. Transp. 2017, 2017, 6105087. [Google Scholar] [CrossRef]
  34. Feierle, A.; Schlichtherle, F.; Bengler, K. Augmented Reality Head-Up Display: A Visual Support During Malfunctions in Partially Automated Driving? IEEE Trans. Intell. Transport. Syst. 2021, 23, 4853–4865. [Google Scholar] [CrossRef]
  35. Hart, S.G.; Staveland, L.E. Development of NASA-TLX (Task Load Index): Results of Empirical and Theoretical Research. In Human Mental Workload; Meshkati, N., Hancock, P.A., Eds.; Elsevier: Amsterdam, The Netherlands, 1988; pp. 139–183. ISBN 9780444703880. [Google Scholar]
  36. Hassenzahl, M.; Burmester, M.; Koller, F. AttrakDiff: Ein Fragebogen zur Messung wahrgenommener hedonischer und pragmatischer Qualität. In Mensch & Computer 2003: Berichte des German Chapter of the ACM; Szwillus, G., Ziegler, J., Eds.; Vieweg+Teubner: Berlin, Germany, 2003; pp. 187–196. ISBN 978-3-519-00441-7. [Google Scholar]
  37. Gold, C.; Naujoks, F.; Radlmayr, J.; Bellem, H.; Jarosch, O. Testing Scenarios for Human Factors Research in Level 3 Automated Vehicles. In Advances in Human Aspects of Transportation; Stanton, N.A., Ed.; Springer International Publishing: Cham, Switzerland, 2018; pp. 551–559. ISBN 978-3-319-60441-1. [Google Scholar]
  38. ERTRAC. Connected Automated Driving Roadmap; ERTRAC Working Group “Connectivity and Automated Driving” No. 8; ERTRAC: Brussels, Belgium, 2019. [Google Scholar]
  39. Blanca, M.J.; Alarcón, R.; Arnau, J.; Bono, R.; Bendayan, R. Non-normal data: Is ANOVA still a valid option? Psicothema 2017, 29, 552–557. [Google Scholar] [CrossRef]
  40. Stevens, J. Applied Multivariate Statistics for the Social Sciences, 3rd ed.; Erlbaum: Mahwah, NJ, USA, 1996; ISBN 0805816704. [Google Scholar]
  41. Carifio, J.; Perla, R. Resolving the 50-year debate around using and misusing Likert scales. Med. Educ. 2008, 42, 1150–1152. [Google Scholar] [CrossRef]
  42. Holm, S. A simple sequentially rejective multiple test procedure. Scand. J. Stat. 1979, 6, 65–70. [Google Scholar]
  43. Cohen, J. Statistical Power Analysis for the Behavioral Sciences, 2nd ed.; Erlbaum: Hillsdale, NJ, USA, 1988; ISBN 9781134742707. [Google Scholar]
  44. Othersen, I. Vom Fahrer zum Denker und Teilzeitlenker: Einflussfaktoren und Gestaltungsmerkmale Nutzerorientierter Interaktionskonzepte für die Überwachungsaufgabe des Fahrers im Teilautomatisierten Modus; Technische Universität Braunschweig: Braunschweig, Germany, 2016. [Google Scholar]
  45. Thaler, R.H.; Sunstein, C.R. Nudge: Improving Decisions about Health, Wealth and Happiness, Revised ed.; New International Edition; Penguin Books: London, UK, 2009; ISBN 0141040017. [Google Scholar]
  46. Toet, A.; van Erp, J.B. The EmojiGrid as a Tool to Assess Experienced and Perceived Emotions. Psych 2019, 1, 469–481. [Google Scholar] [CrossRef]
  47. Mrazek, M.; Phillips, D.; Franklin, M.; Broadway, J.; Schooler, J. Young and restless: Validation of the Mind-Wandering Questionnaire (MWQ) reveals disruptive impact of mind-wandering for youth. Front. Psychol. 2013, 4, 560. [Google Scholar] [CrossRef] [PubMed]
Figure 1. (a) IC with current speed (1), speed limit (2), navigation (3), maneuver (4), automation scale (5), L2-specific driver task (6), and level of automation color in the frame (7); (b) HUD with current speed (1), speed limit (2), predictive element for current (3) and upcoming segment (4), and availability pop-up message for City Pilot (5).
Safety 08 00047 g001
Figure 2. Affective messages M1 to M7 as displayed in the HUD when driving with the AMC. Messages are displayed in position 5 (Figure 1b).
Safety 08 00047 g002
Figure 3. Different segments of the experimental drive, including the order of affective messages and levels of automation. Manual driving durations (grey) can be disregarded.
Safety 08 00047 g003
Figure 4. Mock-up with three 55″ ultra-HD monitors creating a 120° field of view, 13″ monitor for the IC, and tablet.
Safety 08 00047 g004
Figure 5. System malfunction scenario with approximate TTC with surrounding elements at the beginning of the lane drift.
Safety 08 00047 g005
Figure 6. Boxplots for the road ahead attention ratio for different segments and divided by HMI condition. The L4 phase is displayed but not included in the statistical evaluation. The x represents the mean value.
Safety 08 00047 g006
Figure 7. Overview of NDRA engagement divided by driving segment and HMI concept.
Safety 08 00047 g007
Figure 8. Coding of driver attentiveness during critical driving scenarios.
Safety 08 00047 g008
Figure 9. Boxplot for take-over time (TOT). The x represents the mean value.
Safety 08 00047 g009
Table 1. Dependent variables and description.
Dependent VariableDescription
Driving Data
Take-Over Time [s]Time between start of malfunction and deactivation of ADS
Crash Rate [-]Proportion of crashes during the malfunction
Eye-Tracking/Video Data
Attention Ratio Road Ahead [%]Central TV screen, including HUD but without IC
Attentiveness [1,2,3,4,5]Coding scheme (see Table 2)
NDRA Engagement Ratio [%]Share of participants with NDRA
Subjective Data
Workload [-]NASA raw TLX questionnaire
User Experience [-]AttrakDiff questionnaire
Mode Awareness [-]Retrospective interview
Scenario Characteristics [-]Four single items on a 5-point Likert scale
Table 2. Coding scheme for participants’ attentiveness during critical driving and malfunction scenarios.
CodeTitle 3
1Not distracted, driver does not perform an NDRA
2Alternating NDRA and system monitoring
3Short glances ahead, continuation of NDRA
4No reaction, continuation of NDRA
5Interruption of NDRA until situation is completed
Table 3. Reasons for drivers’ engagement in the given visual-manual NDRAs when driving with L2 automation engaged divided by HMI condition.
ReasonAdvancedBaselineTotal
Over-reliance189
Boredom-33
Fatigue-22
Mode Confusion-11
Curiosity1-1
Table 4. Mean (and SD) values and statistics comparing subcategories of the AttrakDiff questionnaire.
MeasureBaseline
M (SD)
AMC
M (SD)
Statisticsp-ValueαHolm
PQ: Pragmatic Quality1.21 (0.75)1.43 (0.68)t(30) = 0.842p = 0.407αHolm = 0.050
HQ-I: Hedonic Quality—identity0.86 (0.68)1.26 (0.54)Z = −2.282p = 0.022αHolm = 0.013
HQ-S: Hedonic Quality—stimulation0.33 (0.80)0.85 (0.57)t(30) = 2.108p = 0.044αHolm = 0.017
ATT: Attractiveness1.36 (0.72)1.73 (0.55)Z = −1.967p = 0.049αHolm = 0.025
Table 5. Median values and statistics comparing subjects’ ratings of the malfunction scenario.
MeasureBaseline
Median
AMC
Median
Statisticsp-ValueαHolm
Time Budget2.01.5Z = −0.529p = 0.597αHolm = 0.013
Criticality2.02.0Z = −0.377p = 0.706αHolm = 0.025
Complexity3.53.0Z = −0.332p = 0.740αHolm = 0.050
Predictability1.01.5Z = −0.420p = 0.674αHolm = 0.017
Table 6. Median and mean values of the AMC evaluation.
StatementMedianMean (SD)
I have adapted my system monitoring behavior when driving with the City Assistant because of the pop-up messages with emoticons.43.75 (0.93)
I think the messages are effective to help me to concentrate on system monitoring when driving with City Assistant.43.69 (1.30)
I think the messages are helpful for me to disengage from non-driving-related tasks when driving with City Assistant.43.69 (1.08)
I felt less bored when I saw the pop-up messages when driving with City Assistant.43.31 (1.30)
I felt less bored when I saw the emoticons when driving with City Assistant.43.44 (1.03)
I was distracted because of the messages when driving with City Assistant.22.56 (1.03)
Publisher’s Note: MDPI stays neutral with regard to jurisdictional claims in published maps and institutional affiliations.

