
Temporal Stability Analysis of Lighting Conditions in Traffic Accidents


Abstract
:1. Introduction
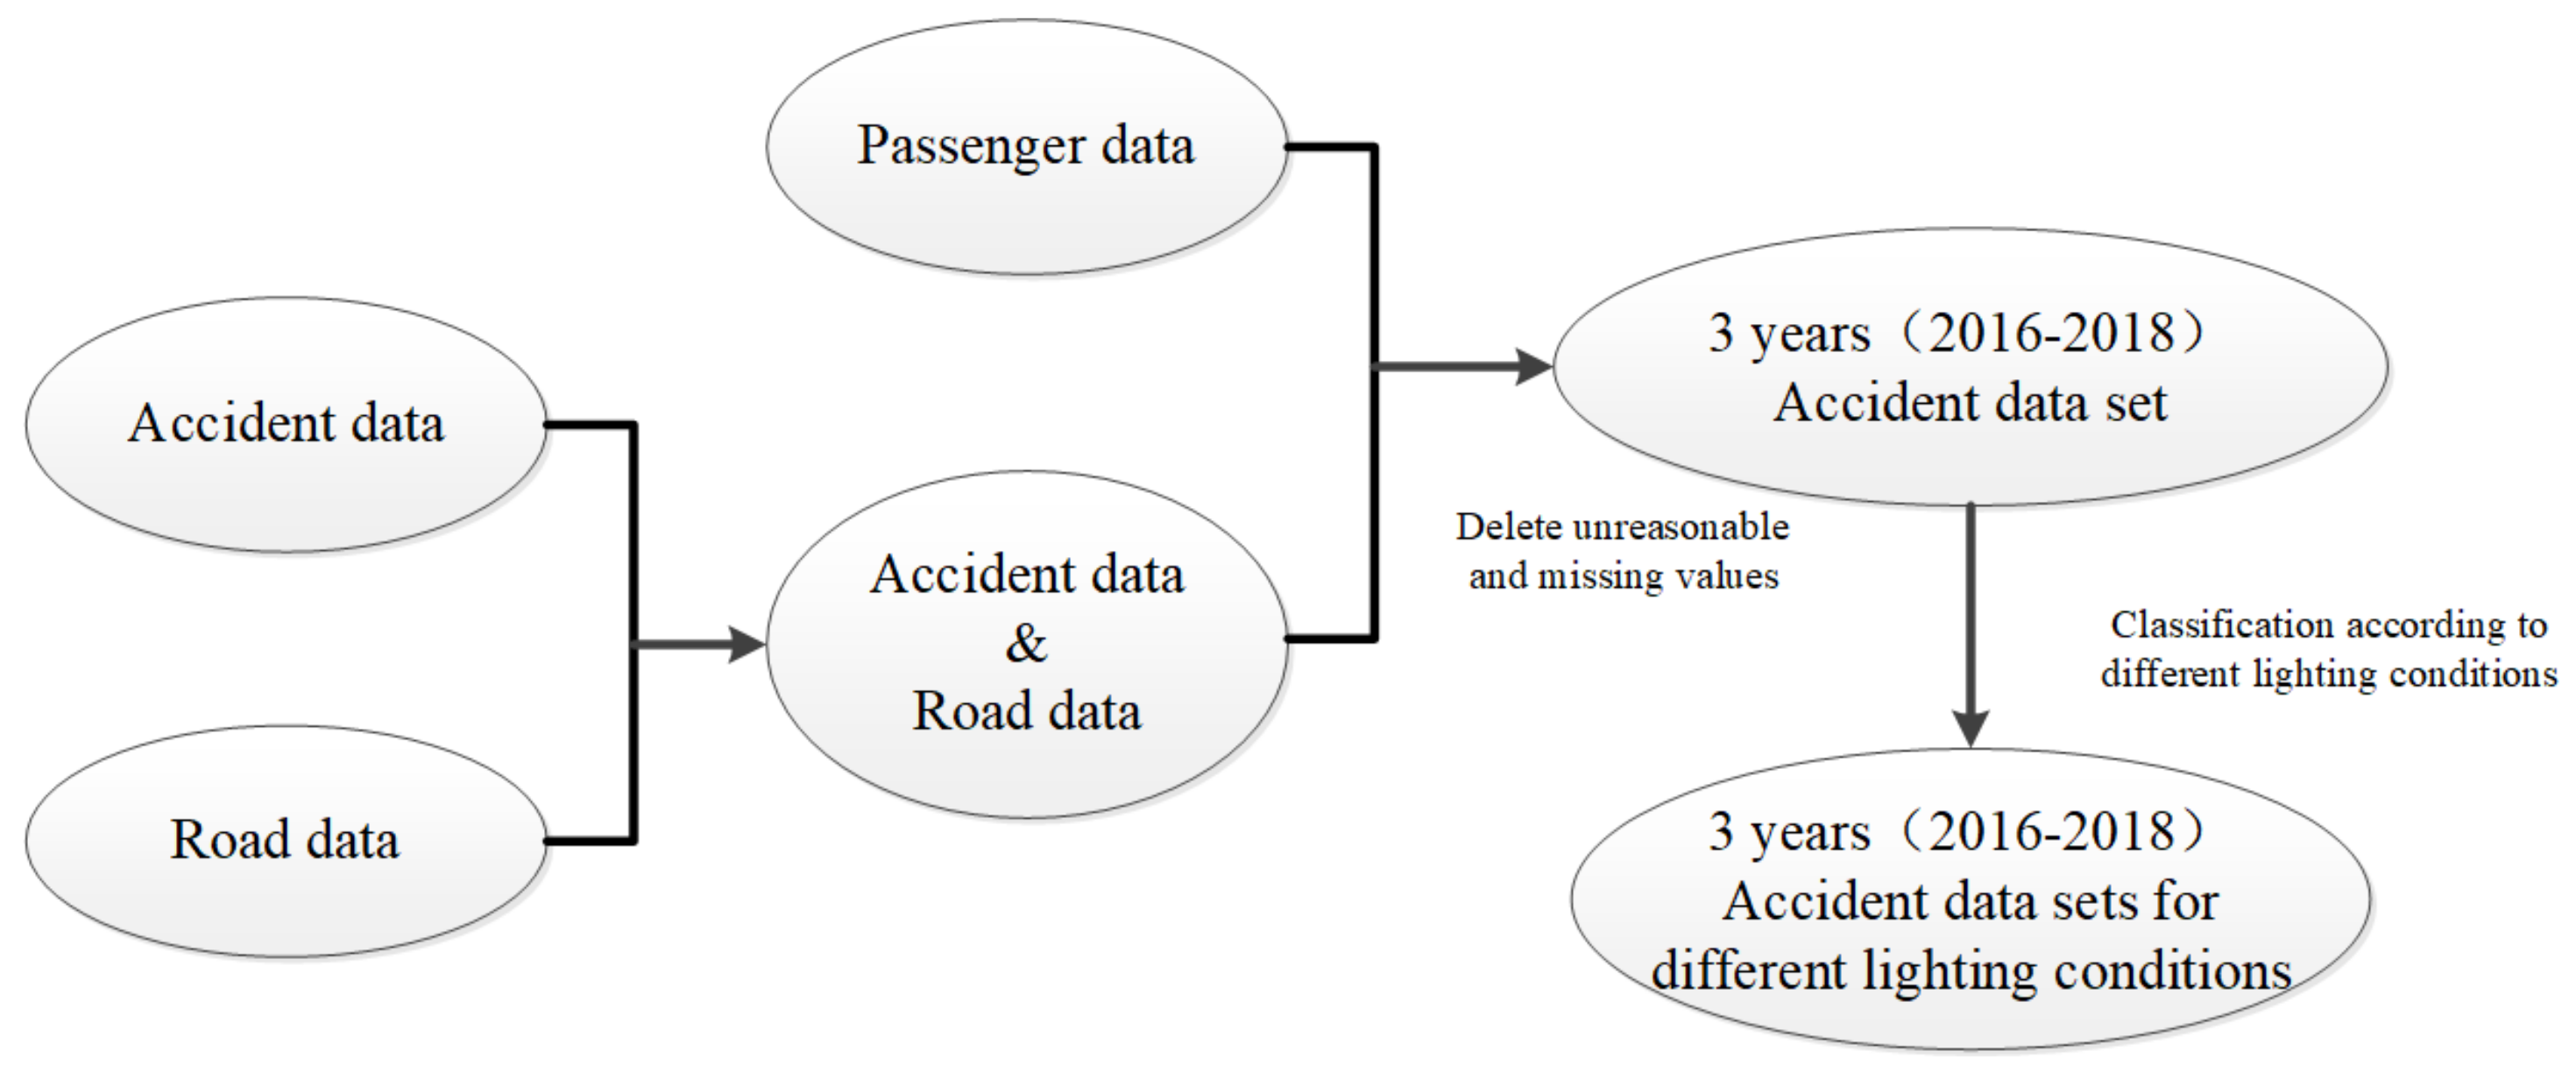
2. Overview of Research Data
3. Research Method
4. Likelihood Ratio Test
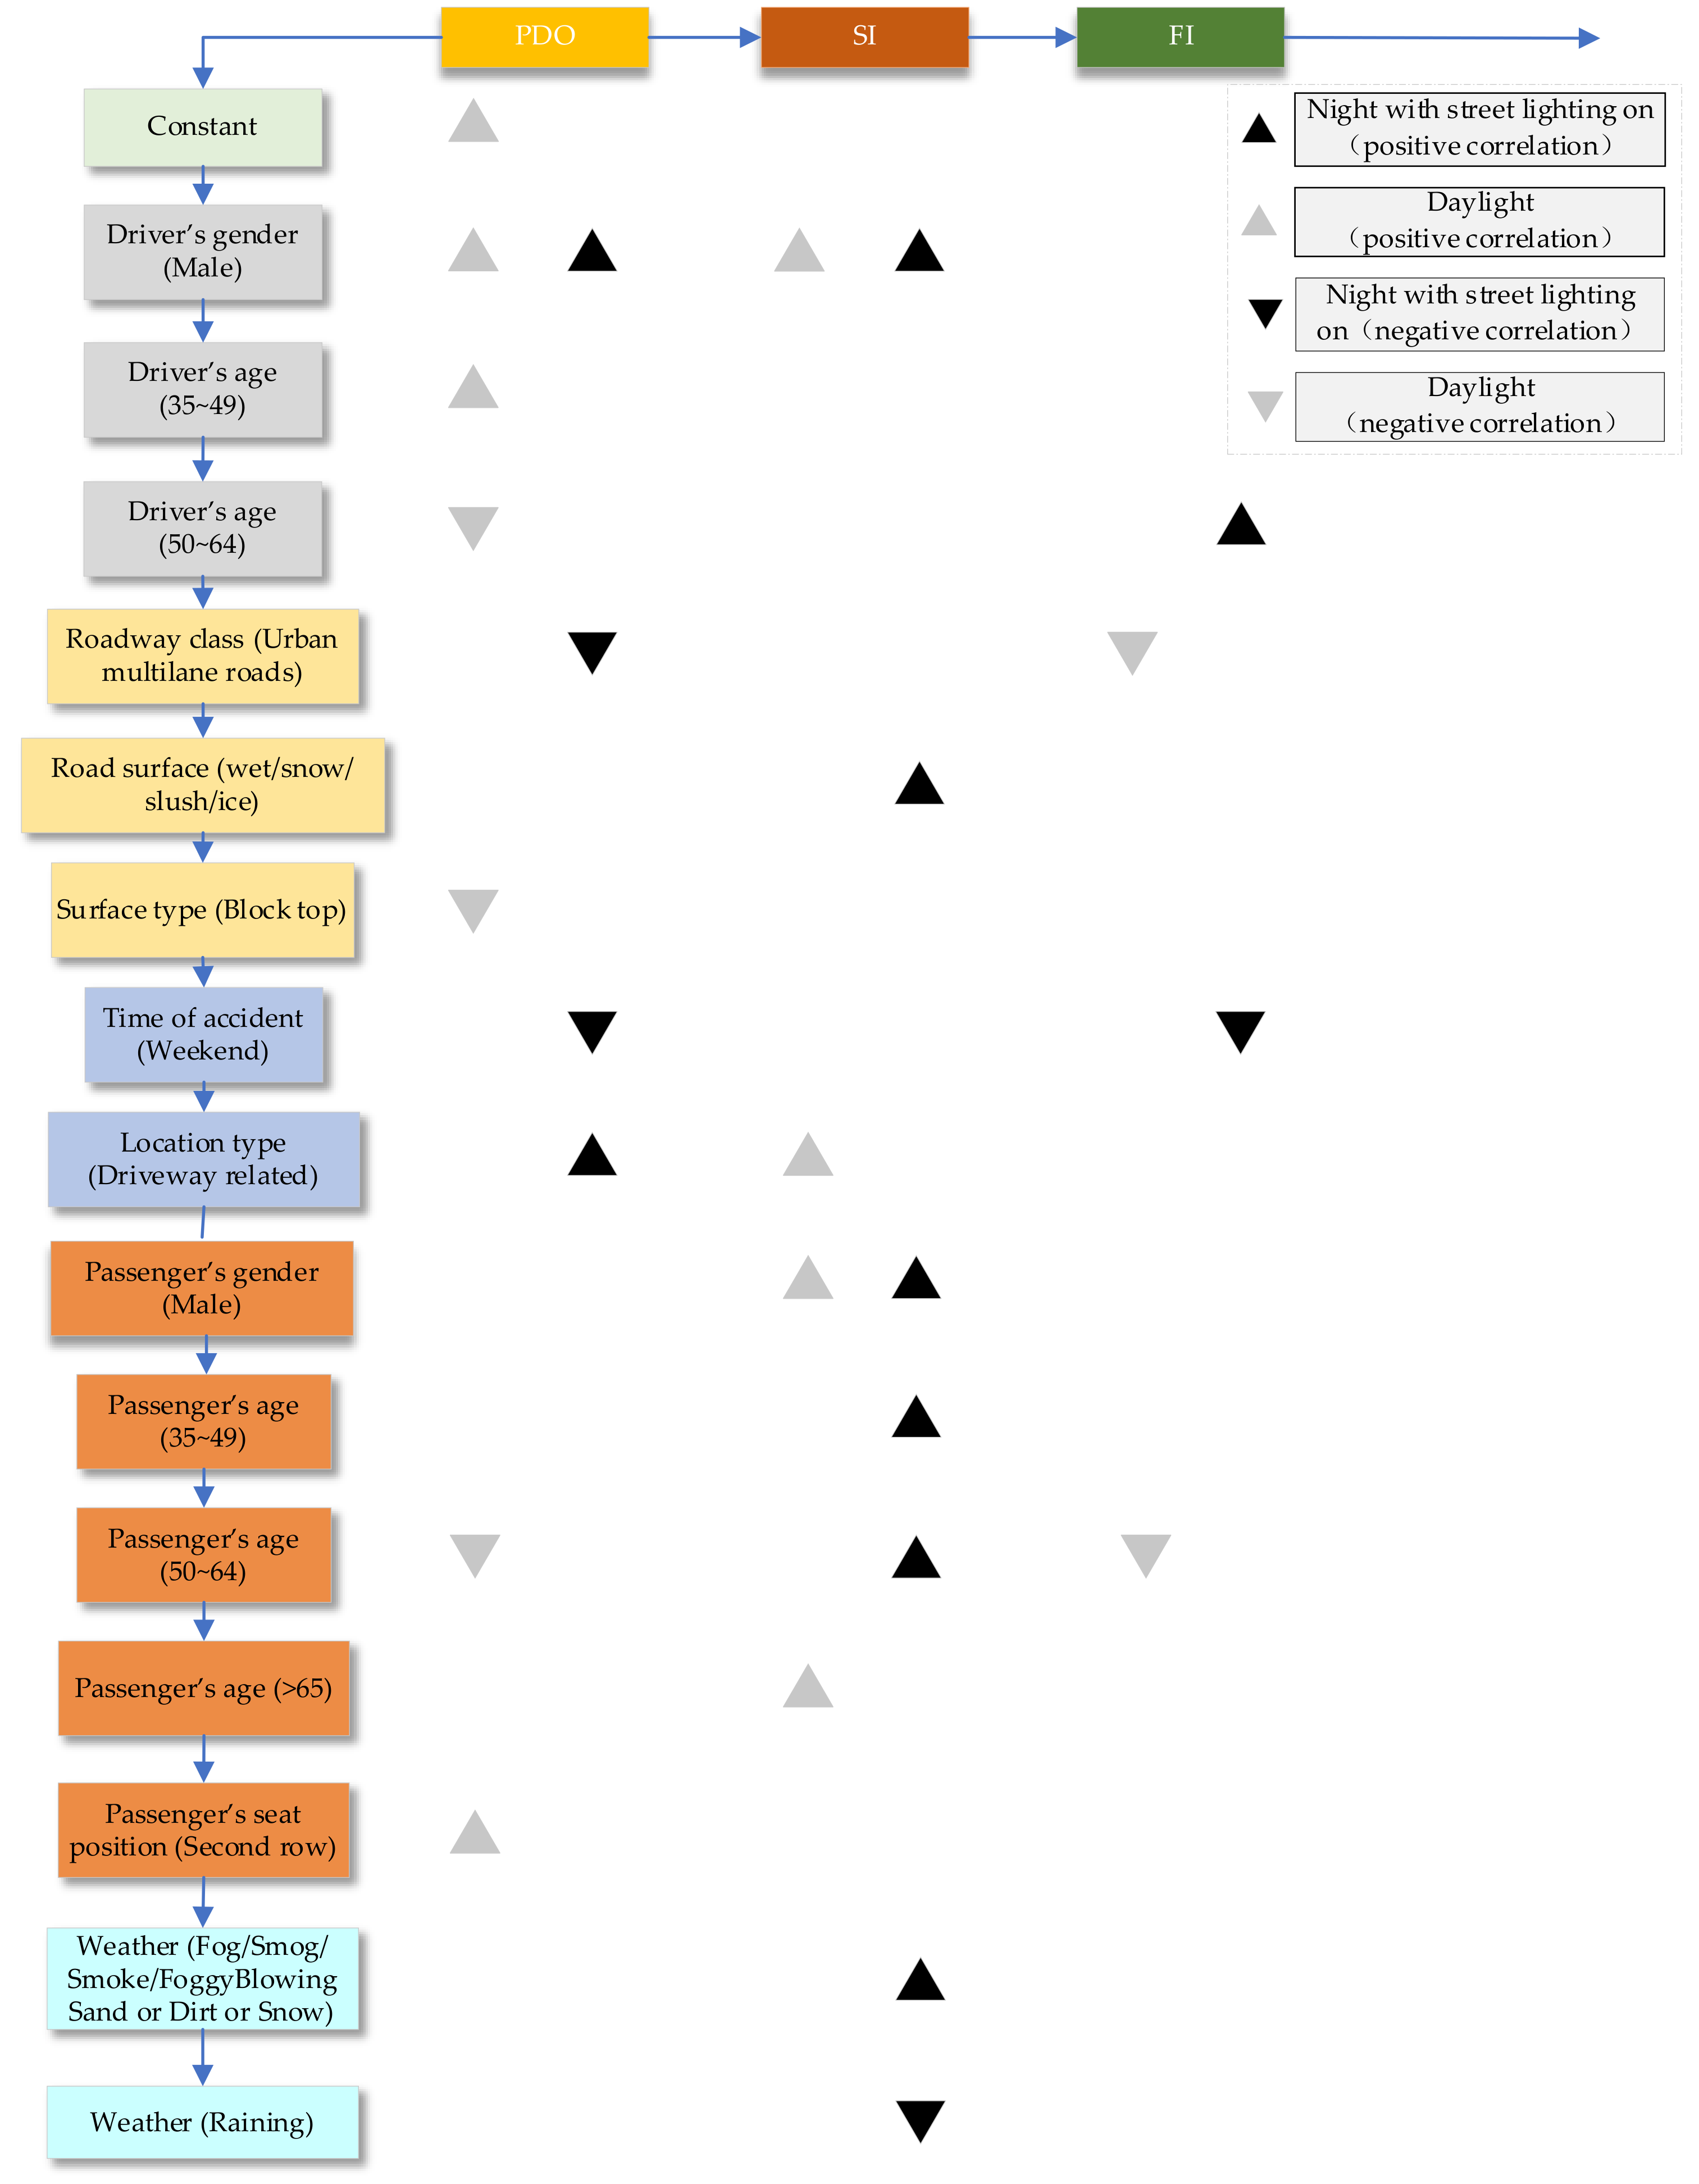
5. Results Analysis and Discussion

| 2016 | 2017 | 2018 | |
|---|---|---|---|
| 2016 | 106.26 (16) (>99.99%) | 76.32 (17) (>99.99%) | |
| 2017 | 76.74 (14) (>99.99%) | 46.46 (17) (>99.99%) | |
| 2018 | 132.4 (14) (>99.99%) | 120.82 (16) (>99.99%) |
6. Conclusions
Author Contributions
Funding
Institutional Review Board Statement
Informed Consent Statement
Data Availability Statement
Acknowledgments
Conflicts of Interest
Appendix A
| Variable | 2016 | 2017 | 2018 | |||||||
| Variable | Variable Name | PDO | SI | FI | PDO | SI | FI | PDO | SI | FI |
| The driver’s gender | Male * | 4407 (39.3) | 1756 (15.66) | 6 (0.05) | 4580 (42.57) | 1601 (14.88) | 10 (0.09) | 4437 (42.73) | 1431 (13.78) | 5 (0.05) |
| Female | 3581 (31.93) | 1459 (13.01) | 5 (0.04) | 3190 (29.65) | 1373 (12.76) | 6 (0.06) | 3210 (30.91) | 1296 (12.48) | 6 (0.06) | |
| The driver’s age | 18~34 | 3681 (30.35) | 1943 (16.02) | 4 (0.03) | 3924 (33.07) | 1652 (13.92) | 9 (0.07) | 3726 (31.81) | 2065 (17.63) | 5 (0.04) |
| 35~49 | 2359 (19.45) | 1320 (10.88) | 2 (0.016) | 2163 (18.23) | 1604 (13.52) | 4 (0.03) | 2219 (18.94) | 1157 (9.88) | 3 (0.025) | |
| 50~64 | 1597 (13.16) | 785 (6.47) | 3 (0.02) | 1287 (10.85) | 694 (5.85) | 2 (0.02) | 1384 (11.82) | 713 (6.08) | 2 (0.017) | |
| >65 | 326 (2.68) | 106 (0.87) | 2 (0.016) | 389 (3.28) | 135 (1.14) | 1 (0.008) | 302 (2.58) | 136 (1.16) | 1 (0.008) | |
| The driver’s protection measures | Not restrained | 34 (0.3) | 30 (0.27) | 1 (0.01) | 17 (0.16) | 17 (0.16) | 3 (0.03) | 20 (0.19) | 17 (0.16) | 1 (0.01) |
| Lap/shoulder/child restrained | 7954 (70.93) | 3185 (28.4) | 10 (0.09) | 7753 (72.05) | 2957 (27.48) | 13 (0.12) | 7627 (73.44) | 2710 (26.1) | 10 (0.1) | |
| The roadway class | Urban freeways * | 3657 (32.61) | 1349 (12.03) | 3 (0.03) | 3827 (35.57) | 1386 (12.88) | 5 (0.05) | 3861 (37.18) | 1188 (11.44) | 5 (0.05) |
| Urban multilane roads | 2940 (26.22) | 1258 (11.22) | 2 (0.02) | 2648 (24.61) | 1045 (9.71) | 2 (0.02) | 2454 (37.18) | 1051 (10.12) | 1 (0.01) | |
| Rural freeways | 643 (5.73) | 229 (2.04) | 3 (0.03) | 643 (5.98) | 222 (2.06) | 4 (0.04) | 619 (5.96) | 181 (1.74) | 5 (0.05) | |
| Rural multilane road | 748 (6.67) | 379 (3.38) | 3 (0.03) | 652 (6.06) | 321 (2.98) | 5 (0.05) | 713 (6.87) | 307 (2.96) | 0 (0) | |
| The road characteristics | Straight * | 7281 (64.93) | 2865 (25.55) | 6 (0.05) | 7061 (65.62) | 2712 (25.2) | 10 (0.09) | 6960 (67.02) | 2437 (23.47) | 10 (0.1) |
| Curve | 707 (6.3) | 350 (3.12) | 5 (0.04) | 709 (6.59) | 262 (2.43) | 6 (0.06) | 687 (6.62) | 290 (2.79) | 1 (0.01) | |
| The function class | Rural * | 1393 (12.42) | 609 (5.43) | 6 (0.05) | 1298 (12.06) | 544 (5.06) | 9 (0.08) | 1336 (12.86) | 491 (4.73) | 5 (0.05) |
| Urban | 6595 (58.81) | 2606 (23.24) | 5 (0.04) | 6472 (60.15) | 2430 (22.58) | 7 (0.07) | 6311 (60.77) | 2236 (21.53) | 6 (0.06) | |
| The surface type | Concrete * | 1939 (17.29) | 699 (6.23) | 2 (0.02) | 5836 (54.24) | 2270 (21.1) | 8 (0.07) | 1762 (16.97) | 520 (5.01) | 4 (0.04) |
| Block top | 6044 (53.9) | 2514 (22.42) | 9 (0.08) | 1905 (17.7) | 698 (6.49) | 8 (0.07) | 5880 (56.62) | 2205 (21.23) | 7 (0.07) | |
| Brick/block/gravel/dirt | 5 (0.04) | 2 (0.02) | 0 (0) | 29 (0.27) | 6 (0.06) | 0 (0) | 5 (0.05) | 2 (0.02) | 0 (0) | |
| The time of the accident | Not weekend * | 5304 (47.3) | 2126 (18.96) | 4 (0.04) | 5018 (46.64) | 1992 (18.51) | 10 (0.09) | 4846 (46.66) | 1738 (16.74) | 7 (0.07) |
| Weekend | 2684 (23.93) | 1089 (9.71) | 7 (0.06) | 2752 (25.58) | 982 (9.13) | 6 (0.06) | 2801 (26.97) | 989 (9.52) | 4 (0.04) | |
| The location type | Intersection-related * | 2833 (25.26) | 1230 (10.97) | 2 (0.02) | 2378 (22.1) | 1011 (9.4) | 5 (0.05) | 2296 (22.11) | 1019 (9.81) | 4 (0.04) |
| Driveway-related | 565 (5.04) | 238 (2.12) | 1 (0.01) | 478 (4.44) | 199 (1.85) | 1 (0.01) | 403 (3.88) | 189 (1.82) | 0 (0) | |
| Not at intersection driveway | 4590 (40.93) | 1747 (15.58) | 8 (0.07) | 4914 (45.67) | 1764 (16.39) | 10 (0.09) | 4948 (47.65) | 1519 (14.63) | 7 (0.07) | |
| The weather | Clear/partly Cloudy/overcast * | 6714 (59.87) | 2628 (23.43) | 11 (0.1) | 6396 (59.44) | 2464 (22.9) | 8 (0.07) | 6471 (62.31) | 2355 (22.68) | 10 (0.1) |
| Raining/sleet/hail/freezing rain | 1122 (10.01) | 529 (4.72) | 0 (0) | 1119 (10.4) | 414 (3.85) | 6 (0.06) | 984 (9.48) | 320 (3.08) | 0 (0) | |
| Fog/smog/smoke/foggy/windy/sand, dirt, or snow | 131 (1.17) | 42 (0.37) | 0 (0) | 186 (1.73) | 81 (0.75) | 1 (0.01) | 109 (1.05) | 30 (0.29) | 1 (0.01) | |
| Severe crosswind | 21 (0.19) | 16 (0.14) | 0 (0) | 69 (0.65) | 15 (0.14) | 1 (0.01) | 8 3(0.8) | 22 (0.21) | 0 (0) | |
| The road surface | Dry * | 1939 (17.29) | 698 (6.23) | 2 (0.02) | 1812 (0.64) | 667 (6.2) | 1 (0.01) | 6029 (58.05) | 2166 (20.86) | 10 (0.1) |
| Wet/snow/slush/ice | 6044 (53.9) | 2514 (22.42) | 9 (0.08) | 5954 (55.33) | 2306 (21.43) | 15 (0.14) | 1595 (15.36) | 552 (5.32) | 1 (0.01) | |
| Other | 5 (0.04) | 2 (0.02) | 0 (0) | 4 (0.04) | 1 (0.01) | 0 (0) | 23 (0.22) | 9 (0.09) | 0 (0) | |
| The passenger’s age | 18~34 | 6081 (50.62) | 2490 (20.72) | 5 (0.04) | 5972 (56.11) | 2046 (19.22) | 12 (0.11) | 6027 (53.18) | 1897 (16.74) | 6 (0.05) |
| 35~49 | 1269 (10.56) | 619 (5.15) | 3 (0.02) | 1067 (10.02) | 469 (4.41) | 2 (0.018) | 1359 (11.99) | 641 (5.66) | 1 (0.009) | |
| 50~64 | 752 (6.26) | 349 (2.90) | 2 (0.016) | 691 (6.49) | 51 (0.48) | 2 (0.018) | 625 (5.51) | 368 (3.25) | 3 (0.026) | |
| >65 | 349 (2.90) | 94 (0.78) | 1 (0.008) | 308 (2.89) | 23 (0.22) | 0 (0.00) | 296 (2.61) | 107 (0.94) | 2 (0.017) | |
| The passenger’s gender | Male * | 3612 (32.21) | 1272 (11.34) | 5 (0.04) | 3525 (32.76) | 1132 (10.52) | 6 (0.06) | 3441 (33.13) | 1031 (9.93) | 2 (0.02) |
| Female | 4376 (39.02) | 1943 (17.33) | 6 (0.05) | 4245 (39.45) | 1842 (17.12) | 10 (0.09) | 4206 (40.5) | 1696 (16.33) | 9 (0.09) | |
| The passenger’s seat position | First row * | 3941 (35.14) | 1790 (15.96) | 9 (0.08) | 3661 (34.02) | 1683 (15.64) | 4 (0.04) | 3579 (34.46) | 1512 (14.56) | 5 (0.05) |
| Second row | 1244 (11.09) | 432 (3.85) | 1 (0.01) | 1206 (11.21) | 366 (3.4) | 5 (0.05) | 1182 (11.38) | 335 (3.23) | 1 (0.01) | |
| Third row | 2803 (25) | 993 (8.86) | 1 (0.01) | 2903 (26.98) | 925 (8.6) | 7 (0.07) | 2886 (27.79) | 880 (8.47) | 5 (0.05) | |
| Ejection | Not ejected * | 7981 (71.17) | 3208 (28.61) | 10 (0.09) | 7766 (72.17) | 2971 (27.61) | 12 (0.11) | 7642 (73.59) | 2725 (26.24) | 9 (0.09) |
| Ejected | 7 (0.06) | 7 (0.06) | 1 (0.01) | 4 (0.04) | 3 (0.03) | 4 (0.04) | 5 (0.05) | 2 (0.02) | 2 (0.02) | |
| The passenger’s protection measures | Not restrained * | 64 (0.57) | 58 (0.52) | 1 (0.01) | 49 (0.46) | 45 (0.42) | 4 (0.04) | 56 (0.54) | 34 (0.33) | 3 (0.03) |
| Lap/shoulder/child restrained | 7924 (70.66) | 3157 (28.15) | 10 (0.09) | 7721 (71.76) | 2929 (27.22) | 12 (0.11) | 7591 (73.1) | 2693 (25.93) | 8 (0.08) | |
Appendix B
| Variable | 2016 | 2017 | 2018 | |||||||
| Variable Type | Variable Type | PDO | SI | FI | PDO | SI | FI | PDO | SI | FI |
| The Driver Characteristics | ||||||||||
| The driver’s gender | Male | 1865 (44.44) | 673 (16.04) | 7 (0.17) | 1795 (44.36) | 665 (16.44) | 10 (0.25) | 1711 (44.74) | 581 (15.19) | 15 (0.39) |
| Female | 1115 (26.57) | 537 (12.79) | 0 (0.00) | 1097 (27.11) | 477 (11.79) | 2 (0.05) | 1056 (27.62) | 458 (11.98) | 3 (0.08) | |
| The driver’s age | 18~34 | 1794 (42.96) | 749 (17.93) | 4 (0.09) | 1709 (42.15) | 734 (18.10) | 6 (0.15) | 1683 (42.75) | 709 (18.01) | 13 (0.33) |
| 35~49 | 983 (23.54) | 271 (6.49) | 1 (0.02) | 943 (23.26) | 326 (8.04) | 4 (0.10) | 993 (25.22) | 197 (5.00) | 5 (0.127) | |
| 50~64 | 139 (3.33) | 57 (1.36) | 1 (0.02) | 105 (2.59) | 61 (1.50) | 1 (0.02) | 91 (2.31) | 64 (1.63) | 0 (0.00) | |
| >65 | 109 (2.61) | 67 (1.60) | 1 (0.02) | 113 (2.79) | 51 (1.26) | 1 (0.02) | 109 (2.77) | 73 (1.85) | 0 (0.00) | |
| The driver’s protection measures | Not restrained * | 4 (0.13) | 16 (0.38) | 1 (0.02) | 9 (0.22) | 9 (0.22) | 3 (0.07) | 5 (0.13) | 6 (0.16) | 10 (0.26) |
| Lap/shoulder/child restrained | 2976 (70.91) | 1194 (28.45) | 6 (0.14) | 2883 (71.26) | 1133 (28.00) | 9 (0.22) | 2762 (72.23) | 1033 (27.01) | 8 (0.21) | |
| The Road Characteristics | ||||||||||
| The roadway class | Urban freeways * | 1408 (33.55) | 540 (12.87) | 2 (0.05) | 1368 (33.81) | 461 (11.39) | 1 (0.02) | 1364 (35.67) | 449 (11.74) | 8 (0.21) |
| Urban multilane roads | 1008 (24.02) | 464 (11.06) | 1 (0.02) | 949 (23.46) | 451 (11.15) | 1 (0.02) | 877 (22.93) | 398 (10.41) | 2 (0.05) | |
| Rural freeways | 281 (6.70) | 89 (2.12) | 1 (0.02) | 307 (7.59) | 122 (3.02) | 7 (0.17) | 619 (5.96) | 181 (1.74) | 5 (0.05) | |
| Rural multilane roads | 283 (6.74) | 117 (2.79) | 3 (0.07) | 268 (6.62) | 108 (2.67) | 3 (0.07) | 264 (6.90) | 108 (2.82) | 4 (0.10) | |
| The road characteristics | Straight * | 2650 (63.14) | 1038 (24.73) | 5 (0.12) | 2532 (62.58) | 1014 (25.06) | 11 (0.27) | 2409 (63.00) | 932 (24.37) | 12 (0.31) |
| Curve | 330 (7.86) | 172 (4.10) | 2 (0.05) | 360 (8.90) | 128 (3.16) | 1 (0.02) | 358 (9.36) | 107 (2.80) | 6 (0.16) | |
| The function class | Rural * | 565 (13.46) | 209 (4.98) | 4 (0.10) | 575 (14.21) | 231 (5.71) | 10 (0.25) | 358 (9.36) | 107 (2.80) | 6 (0.16) |
| Urban | 2415 (57.54) | 1001 (23.85) | 3 (0.07) | 2317 (57.27) | 911 (22.52) | 2 (0.05) | 6311 (60.77) | 2236 (21.53) | 6 (0.06) | |
| The surface type | Concrete * | 1542 (36.74) | 36.74 (15.20) | 3 (0.07) | 1498 (37.02) | 669 (16.53) | 6 (0.15) | 558 (14.59) | 193 (5.05) | 6 (0.16) |
| Block top | 1409 (33.57) | 541 (12.89) | 4 (0.10) | 1370 (33.86) | 457 (11.30) | 6 (0.15) | 2209 (57.77) | 846 (22.12) | 12 (0.31) | |
| Brick/block/gravel/dirt | 29 (0.69) | 31 (0.74) | 0 (0.00) | 24 (0.59) | 16 (0.40) | 0 (0.00) | 22 (0.58) | 11 (0.29) | 3 (0.08) | |
| The Crash Characteristics | * | |||||||||
| The time of the accident | Not weekend | 1840 (48.12) | 697 (18.23) | 7 (0.18) | 1932 (47.75) | 745 (18.41) | 8 (0.20) | 1840 (48.12) | 697 (18.23) | 7 (0.18) |
| Weekend | 927 (24.24) | 342 (8.94) | 11 (0.29) | 960 (23.73) | 397 (9.81) | 4 (0.10) | 927 (24.24) | 342 (8.94) | 11 (0.29) | |
| The roadway class | Intersection-related * | 987 (23.52) | 477 (11.37) | 2 (0.05) | 845 (20.88) | 418 (10.33) | 1 (0.02) | 772 (20.19) | 370 (9.68) | 1 (0.03) |
| Driveway-related | 175 (4.17) | 71 (1.69) | 0 (0.00) | 128 (3.16) | 76 (1.88) | 0 (0.00) | 146 (3.82) | 46 (1.20) | 0 (0.00) | |
| Not at intersection driveway | 1818 (43.32) | 662 (15.77) | 5 (0.12) | 1919 (47.43) | 648 (16.02) | 11 (0.27) | 1849 (48.35) | 623 (16.29) | 17 (0.44) | |
| The weather | Clear/partly cloudy/overcast * | 1883 (44.87) | 820 (19.54) | 5 (0.12) | 1811 (44.76) | 796 (19.67) | 9 (0.22) | 1909 (49.92) | 712 (18.62) | 12 (0.31) |
| Raining/sleet/hail/freezing rain | 965 (22.99) | 347 (8.27) | 2 (0.05) | 855 (21.13) | 267 (6.60) | 1 (0.02) | 729 (19.06) | 282 (7.37) | 3 (0.08) | |
| Fog/smog/smoke/foggy/windy/sand, dirt, or snow | 96 (2.29) | 34 (0.81) | 0 (0.00) | 181 (4.47) | 50 (1.24) | 1 (0.02) | 103 (2.69) | 27 (0.71) | 0 (0.00) | |
| Severe crosswind | 36 (0.86) | 9 (0.21) | 0 (0.00) | 45 (1.11) | 29 (0.72) | 1 (0.02) | 26 (0.68) | 18 (0.47) | 3 (0.08) | |
| The road surface | Dry * | 712 (16.96) | 193 (5.05) | 6 (0.16) | 618 (15.27) | 227 (5.61) | 1 (0.02) | 1587 (41.50) | 579 (15.14) | 11 (0.29) |
| Wet/snow/slush/ice | 2209 (57.77) | 846 (22.12) | 12 (0.31) | 2272 (56.15) | 913 (22.57) | 11 (0.27) | 1158 (30.28) | 449 (11.74) | 4 (0.10) | |
| Other | 22 (0.58) | 11 (0.29) | 3 (0.08) | 2 (0.05) | 2 (0.05) | 0 (0.00) | 22 (0.58) | 11 (0.29) | 3 (0.08) | |
| The Passenger Characteristics | 18~34 | |||||||||
| The passenger’s age | 18~34 | 2274 (54.41) | 917 (21.94) | 5 (0.12) | 2361 (53.42) | 981 (22.19) | 8 (0.18) | 2091 (55.21) | 815 (21.52) | 14 (0.37) |
| 35~49 | 481 (11.51) | 152 (3.64) | 1 (0.02) | 593 (13.42) | 163 (3.69) | 3 (0.08) | 413 (10.90) | 107 (2.82) | 3 (0.08) | |
| 50~64 | 91 (2.18) | 79 (1.89) | 1 (0.02) | 83 (1.88) | 79 (1.79) | 1 (0.02) | 87 (2.30) | 76 (2.01) | 1 (0.026) | |
| >65 | 109 (2.61) | 68 (1.63) | 1 (0.02) | 91 (2.06) | 57 (1.29) | 0 (0.00) | 113 (2.98) | 67 (1.77) | 0 (0.00) | |
| The passenger’s gender | Male * | 1326 (31.59) | 512 (12.20) | 2 (0.05) | 1351 (33.39) | 465 (11.49) | 9 (0.22) | 1282 (33.53) | 413 (10.80) | 10 (0.26) |
| Female | 1654 (39.41) | 698 (16.63) | 5 (0.12) | 1541 (38.09) | 677 (16.73) | 3 (0.07) | 1485 (38.83) | 626 (16.37) | 8 (0.21) | |
| The passenger’s seat position | First row * | 1448 (34.50) | 658 (15.68) | 4 (0.10) | 1351 (33.39) | 636 (15.72) | 6 (0.15) | 1314 (34.36) | 602 (15.74) | 8 (0.21) |
| Second row | 449 (10.70) | 171 (4.07) | 1 (0.02) | 394 (9.74) | 147 (3.63) | 1 (0.02) | 338 (8.84) | 95 (2.48) | 4 (0.10) | |
| Third row | 1083 (25.80) | 381 (9.08) | 2 (0.05) | 1147 (28.35) | 359 (8.87) | 5 (0.12) | 1115 (29.16) | 342 (8.47) | 6 (0.16) | |
| Ejection | Not ejected * | 2978 (70.96) | 1205 (28.71) | 6 (0.14) | 2892 (71.48) | 1134 (28.03) | 7 (0.17) | 2764 (72.28) | 1032 (26.99) | 14 (0.37) |
| Ejected | 2 (0.05) | 5 (0.12) | 1 (0.02) | 0 (0.00) | 8 (0.20) | 5 (0.12) | 3 (0.08) | 7 (0.18) | 4 (0.10) | |
| The passenger’s protection measures | Not restrained * | |||||||||
| Lap/shoulder/child restrained | ||||||||||
| The road characteristics | Straight * | 14 (0.33) | 39 (0.93) | 0 (0.00) | 10 (0.25) | 31 (0.77) | 6 (0.15) | 24 (0.63) | 19 (0.50) | 10 (0.26) |
| Curve | 2966 (70.67) | 1171 (27.90) | 7 (0.17) | 2882 (71.23) | 1111 (27.46) | 6 (0.15) | 2743 (71.73) | 1020 (26.67) | 8 (0.21) | |
References
- WHO. Global Status Report on Road Safety 2018; World Health Organization: Geneva, Switzerland, 2018. [Google Scholar]
- Hong, J.; Tamakloe, R.; Park, D. A Comprehensive Analysis of Multi-Vehicle Accidents on Expressways: A Double Hurdle Approach. Sustainability 2019, 11, 2782. [Google Scholar] [CrossRef] [Green Version]
- Bougna, T.; Hundal, G.; Taniform, P. Quantitative analysis of the social costs of road traffic crashes literature. Accid. Anal. Prev. 2021, 165, 106282. [Google Scholar] [CrossRef] [PubMed]
- Hobbs, M.; Mayou, R.; Harrison, B.; Worlock, P. A randomised controlled trial of psychological debriefing for victims of road traffic accidents. Bmj 1996, 313, 1438–1439. [Google Scholar] [CrossRef] [PubMed] [Green Version]
- Zhao, G.; Li, S.; Jiang, Y. Safety and Cost Performance of Intersection Lighting; Indiana Department of Transportation: : Indianapolis, IN, USA; Purdue University: West Lafayette, IN, USA, 2016. [Google Scholar]
- CIE. Recommendations for the Lighting of Roads for Motor and Pedestrian Traffic; CIE: Vienna, Austria, 1995. [Google Scholar]
- Anarkooli, A.J.; Hosseinlou, M.H. Analysis of the injury severity of Accidents by considering different lighting conditions on two-lane rural roads. J. Saf. Res. 2016, 56, 57–65. [Google Scholar] [CrossRef]
- Uddin, M.; Huynh, N. Truck-involved Accidents injury severity analysis for different lighting conditions on rural and urban roadways. Accid. Anal. Prev. 2017, 108, 44–55. [Google Scholar] [CrossRef]
- Islam, S.; Burton, B. A comparative injury severity analysis of rural intersection Accidents under different lighting conditions in Alabama. J. Transp. Saf. Secur. 2020, 12, 1106–1127. [Google Scholar]
- Zhang, K.; Yao, L. Study on the influence of road lighting on traffic safety in UK. Ergonomics 2014, 20, 65–67. [Google Scholar]
- Mannering, F.; Bhat, C.R.; Shankar, V.; Abdel-Aty, M. Big data, traditional data and the tradeoffs between prediction and causality in highway-safety analysis. Anal. Methods Accid. Res. 2020, 25, 100113. [Google Scholar] [CrossRef]
- Azimi, G.; Rahimi, A.; Asgari, H.; Jin, X. Severity analysis for large truck rollover Accidents using a random parameter ordered logit model. Accid. Anal. Prev. 2020, 135, 105355. [Google Scholar] [CrossRef]
- Vajari, M.A.; Aghabayk, K.; Sadeghian, M.; Shiwakoti, N. A multinomial logit model of motorcycle accident injury severity at Australian intersections. J. Saf. Res. 2020, 73, 17–24. [Google Scholar] [CrossRef]
- Wu, Q.; Zhang, G.; Zhu, X.; Liu, X.C.; Tarefder, R. Analysis of driver injury severity in single-vehicle Accidents on rural and urban roadways. Accid. Anal. Prev. 2016, 94, 35–45. [Google Scholar] [CrossRef]
- Yu, M.; Zheng, C.; Ma, C. Analysis of injury severity of rear-end Accidents in work zones: A random parameters approach with heterogeneity in means and variances. Anal. Methods Accid. Res. 2020, 27, 14. [Google Scholar]
- Yu, M.; Ma, C.; Shen, J. Temporal stability of driver injury severity in single-vehicle roadway departure Accidents: A random thresholds random parameters hierarchical ordered probit approach. Anal. Methods Accid. Res. 2021, 29, 100144. [Google Scholar]
- Yan, X.; He, J.; Zhang, C.; Liu, Z.; Wang, C.; Qiao, B. Temporal analysis of accident severities involving male and female drivers: A random parameters approach with heterogeneity in means and variances. Anal. Methods Accid. Res. 2021, 30, 100161. [Google Scholar]
- Waseem, M.; Ahmed, A.; Saeed, T.U. Factors affecting motorcyclists’ injury severities: An empirical assessment using random parameters logit model with heterogeneity in means and variances. Accid. Anal. Prev. 2019, 123, 12–19. [Google Scholar] [CrossRef]
- Liu, J.; Hao, X. Evaluation of the Metro’s In-vehicle Congestion Parameters Based on Random Parameters Logit Model. J. South China Univ. Technol. (Nat. Sci. Ed.) 2019, 47, 62–75. [Google Scholar]
- Mannering, F. Temporal instability and the analysis of highway accident data. Anal. Methods Accid. Res. 2018, 17, 1–13. [Google Scholar] [CrossRef]
- Zhou, H.; Yuan, C.; Dong, N.; Wong, S.C.; Xu, P. Severity of passenger injuries on public buses, a comparative analysis of collision injuries and non-collision injuries. J. Saf. Res. 2020, 74, 55–69. [Google Scholar] [CrossRef]
- McFadden, D.; Train, K. Mixed MNL models for discrete response. J. Appl. Econom. 2000, 15, 447–470. [Google Scholar] [CrossRef]
- Seraneeprakarn, P.; Huang, S.; Shankar, V.; Mannering, F.; Venkataraman, N.; Milton, J. Occupant injury severities in hybrid-vehicle involved Accidents: A random parameters approach with heterogeneity in means and variances. Anal. Methods Accid. Res. 2017, 15, 41–55. [Google Scholar]
- Xu, P.; Zhou, H.; Wong, S.C. On random-parameter count models for out-of-sample crash prediction: Accounting for the variances of random-parameter distributions. Accid. Anal. Prev. 2021, 159, 106237. [Google Scholar] [CrossRef] [PubMed]
- Hou, Q.; Huo, X.; Leng, J.; Mannering, F. A note on out-of-sample prediction, marginal effects computations, and temporal testing with random parameters crash-injury severity models. Anal. Methods Accid. Res. 2022, 33, 100191. [Google Scholar] [CrossRef]
- Al-Bdairi NS, S.; Behnood, A.; Hernandez, S. Temporal stability of driver injury severities in animal-vehicle collisions: A random parameters with heterogeneity in means (and variances) approach. Anal. Methods Accid. Res. 2020, 26, 100120. [Google Scholar] [CrossRef]
- Behnood, A.; Mannering, F. Time-of-day variations and temporal instability of factors affecting injury severities in large-truck Accidents. Anal. Methods Accid. Res. 2019, 23, 100102. [Google Scholar]
- Islam, M.; Alnawmasi, N.; Mannering, F. Unobserved heterogeneity and temporal instability in the analysis of work-zone accident-injury severities. Anal. Methods Accid. Res. 2020, 28, 100130. [Google Scholar]
- Washington, S.P.; Karlaftis, M.G.; Mannering, F.L. Statistical and Econometric Methods for Transportation Data Analysis; CRC: Boca Raton, FL, USA, 2003. [Google Scholar]
| 2016 | 2017 | 2018 | |
|---|---|---|---|
| 2016 | 106.54 (18) (>99.99%) | 119.9 (18) (>99.99%) | |
| 2017 | 76.74 (14) (>99.99%) | 46.46 (17) (>99.99%) | |
| 2018 | 132.4 (14) (>99.99%) | 120.82 (16) (>99.99%) |
| Variable | 2016 | 2017 | 2018 | |||
|---|---|---|---|---|---|---|
| Daylight | Night with Street Lighting on | Daylight | Night with Street Lighting on | Daylight | Night with Street Lighting on | |
| Constant (PDO) | 1.10393 (3.11) | 2.10997 (3.36) | ||||
| The Driver Characteristics | ||||||
| The driver’s gender (male) (PDO) | −2.97810 (−6.34) | 1.79458 (2.01) | 1.92202 (2.10) | |||
| The driver’s gender (male) (SI) | 0.45190 (2.46) | 3.48534 (4.92) | 2.50026 (2.77) | |||
| The driver’s age (35~49) (PDO) | 11.1814 (1.87) | 1.83062 (1.73) | 1.33615 (1.60) | |||
| The driver’s age (35~49) (SI) | 2.23468 (2.15) | |||||
| The driver’s age (50~64) (PDO) | 7.10159 (1.26) | −0.60327 (−2.74) | −0.72549 (−2.20) | |||
| The driver’s protection measures (lap/shoulder/child restrained) (PDO) | 5.18176 (7.66) | |||||
| The Road Characteristics | ||||||
| The roadway class (urban multilane roads) (PDO) | 4.48056 (4.47) | 5.55274 (1.58) | −0.57238 (−2.87) | |||
| The roadway class (urban multilane roads) (SI) | 4.83507 (4.80) | 1.53095 (7.90) | ||||
| The roadway class (urban multilane roads) (FI) | −4.10707 (−3.18) | |||||
| The roadway class (rural freeways) (PDO) | 1.61881 (3.17) | |||||
| The roadway class (rural freeways) (SI) | 1.42909 (2.25) | |||||
| The roadway class (rural multilane road) (PDO) | −0.28257 (−3.05) | −3.48427 (−4.26) | ||||
| The roadway class (rural multilane road) (SI) | 26.1210 (1.18) | 1.87895 (3.16) | ||||
| The road surface (wet/snow/slush/ice) (SI) | 2.81733 (3.21) | |||||
| The road surface (other) (PDO) | 15.3909 (2.03) | −1.60026 (−2.42) | ||||
| The road characteristics (curve) (SI) | 0.71989 (4.28) | |||||
| The surface type (block top) (PDO) | −0.75222 (−2.39) | |||||
| The surface type (block top) (SI) | −5.24325 (−1.39) | |||||
| The function class (urban)(SI) | 24.3518 (2.45) | |||||
| The Accident Characteristics | ||||||
| The time of the accident (weekend) (PDO) | −0.62965 (−2.45) | |||||
| The time of the accident (weekend) (SI) | 4.29064 (1.39) | 0.37871 (2.19) | ||||
| The time of the accident (weekend) (FI) | −4.37860 (−0.90) | −1.09466 (−1.90) | ||||
| The location type (driveway-related) (PDO) | 1.56690 (2.43) | |||||
| The location type (driveway-related) (SI) | 0.833710 (2.29) | 1.88133 (2.64) | ||||
| The location type (not at the intersection driveway) (PDO) | −0.67171 (−3.28) | |||||
| The location type (not at intersection driveway) (SI) | 0.73066 (6.71) | 2.33325 (6.83) | ||||
| The location type (not at intersection driveway) (FI) | −1.39721 (−4.36) | |||||
| The Passenger Characteristics | ||||||
| The passenger’s gender (male) (PDO) | −0.54586 (−9.50) | −0.53325 (−2.91) | ||||
| The passenger’s gender (male) (SI) | −2.10243 (−0.71) | 3.05953 (7.25) | 3.85269 (5.29) | 3.45171 (4.39) | ||
| The passenger’s gender (male) (FI) | −4.16682 (0.50) | |||||
| The passenger’s age (35~49) (PDO) | −0.34096 (−5.05) | |||||
| The passenger’s age (35~49) (SI) | 1.26454 (2.09) | 1.88962 (1.81) | 0.35854 (1.12) | |||
| The passenger’s age (35~49) (FI) | −3.06436 (−3.72) | −2.83685 (−2.23) | ||||
| The passenger’s age (50~64) (PDO) | 2.35087 (4.03) | 4.36610 (0.58) | −1.28568 (−2.94) | |||
| The passenger’s age (50~64) (SI) | 1.37234 (2.14) | 0.60771 (2.36) | ||||
| The passenger’s age (50~64) (FI) | −2.44132 (−1.92) | −2.94197 (−3.26) | ||||
| The passenger’s age (>65) (PDO) | 80.8185 (0.67) | 6.90602 (3.93) | ||||
| The passenger’s age (>65) (SI) | 2.73030(3.35) | 1.36715 (3.26) | ||||
| The passenger’s protection measures (lap/shoulder/child restrained) (PDO) | 0.96335 (4.16) | 2.746863 (11.07) | ||||
| The passenger’s seat position (second row) (PDO) | 3.09089 (0.53) | 1.39664 (2.28) | ||||
| The passenger’s seat position (second row) (SI) | 1.88740 (1.83) | |||||
| The passenger’s seat position (third row) (PDO) | 10.8273 (1.79) | 0.42648 (1.94) | ||||
| The passenger’s seat position (third row) (SI) | 0.79105 (2.23) | |||||
| The passenger’s seat position (third row) (FI) | 7.28069 (0.90) | |||||
| The Environment Characteristics | ||||||
| The weather (raining/sleet/hail/freezing rain) (PDO) | −0.28314 (−2.32) | |||||
| The weather (raining/sleet/hail/freezing rain) (SI) | −10.7632 (−2.48) | 1.79862 (3.47) | ||||
| The weather (fog/smog/smoke/foggy/windy/sand, dirt, or snow) (SI) | 2.40506 (2.35) | |||||
| The weather (raining) (SI) | −3.18504 (−1.79) | |||||
| The Random Parameters | ||||||
| The passenger’s gender (male) (PDO) | 1.73786 (2.22) | 2.19824 (2.42) | 3.64986 (3.86) | |||
| The standard deviation of passenger’s gender (male) (PDO) | 6.90195 (3.63) | 2.57070 (1.54) | 2.52726 (2.03) | |||
| The passenger’s age (35~49) (PDO) | 1.94472 (1.68) | |||||
| The standard deviation of passenger’s age (35~49) (PDO) | 3.14826 (2.14) | |||||
| The passenger’s age (50~64) (SI) | 2.45842 (3.23) | |||||
| The standard deviation of passenger’s age (50~64) (SI) | 1.67938 (2.37) | |||||
| The passenger’s protection measures (lap/shoulder/child restrained) (PDO) | 11.9383 (5.76) | 4.84194 (3.65) | ||||
| The standard deviation of passenger’s protection measures (lap/shoulder/child restrained) (PDO) | 20.4196 (5.29) | 5.74692 (3.24) | ||||
| The passenger’s protection measures (lap/shoulder/child restrained) (SI) | −51.4539 (−2.30) | |||||
| The standard deviation of passenger’s protection measures (lap/shoulder/child restrained) (SI) | 73.8423 (2.30) | |||||
| The passenger’s seat position (second row) (PDO) | 11.4627 (1.49) | |||||
| The standard deviation of passenger’s seat position (second row) (PDO) | 23.7168 (1.53) | |||||
| The road surface (wet/snow/slush/ice) (PDO) | 3.03944 (1.83) | 2.53648 (2.84) | ||||
| The standard deviation of road surface (wet/snow/slush/ice) (PDO) | 5.80802 (2.15) | 1.76698 (1.53) | ||||
| The Random Parameters with Heterogeneity in Means | ||||||
| The road surface (wet/snow/slush/ice) (PDO): the time of the accident (weekend) | 0.81728 (1.97) | |||||
| The passenger’s age (50~64) (SI): the road characteristics (curve) | −2.37589 (−4.48) | |||||
| The passenger’s protection measures (lap/shoulder/child restrained) (SI): the passenger’s age (50~64) | 26.1598 (1.73) | |||||
| The passenger’s protection measures (lap/shoulder/child restrained) (PDO): the passenger’s age (>65) | −8.34765 (−3.97) | |||||
| The passenger’s age (35~49) (PDO): the driver’s gender (male) | 1.49195 (1.80) | |||||
| The passenger’s protection measures (lap/shoulder/child restrained) (PDO): the driver’s age (35~49) | −2.86980 (−3.01) | |||||
| The Random Parameters with Heterogeneity in Variances | ||||||
| The passenger’s gender (male) (PDO): the roadway class (rural freeways) | −0.41663 (−2.18) | |||||
| The passenger’s protection measures (lap/shoulder/child restrained)(SI): the passenger’s age (>65) | 2.59715 (6.21) | |||||
| The passenger’s protection measures (lap/shoulder/child restrained) (PDO): the roadway class (urban multilane roads) | 0.42315 (4.05) | |||||
| Variable | Random Parameters Logit Model (Considering Heterogeneity in Means) | ||
|---|---|---|---|
| Property Damage Only (PDO) | Severe Injury (SI) | Fatal Injury (FI) | |
| Constant | |||
| The Environmental Characteristics | |||
| The weather (raining/sleet/hail/freezing rain) (PDO) | −0.0047 | 0.0042 | 0.0005 |
| The Road Characteristics | |||
| The roadway class (urban multilane roads) (PDO) | 0.1383 | −0.1379 | −0.0004 |
| The roadway class (urban multilane roads) (SI) | −0.1789 | 0.1791 | −0.0002 |
| The roadway class (rural freeways) (PDO) | 0.0078 | −0.0074 | −0.0004 |
| The roadway class (rural freeways) (SI) | −0.0130 | 0.0132 | −0.0002 |
| The roadway class (rural multilane road) (PDO) | −0.0050 | 0.0041 | 0.0010 |
| Road characteristics (curve) (SI) | −0.0067 | 0.0070 | −0.0003 |
| The Accident Characteristics | |||
| The location type (not at an intersection driveway) (SI) | −0.0407 | 0.0422 | −0.0015 |
| The Passenger Characteristics | |||
| The passenger’s gender (male) (PDO) | −0.0311 | 0.0309 | 0.0002 |
| The passenger’s gender (male) (FI) | 0.0004 | 0.0021 | −0.0026 |
| The passenger’s age (35~49) (PDO) | −0.0099 | 0.0098 | 0.0001 |
| The passenger’s age (35~49) (FI) | −0.0099 | 0.0098 | 0.0001 |
| The passenger’s age (50~64) (PDO) | 0.0278 | −0.0272 | −0.0006 |
| The passenger’s age (50~64) (SI) | −0.0391 | 0.0393 | −0.0002 |
| The passenger’s protection measures (lap/shoulder/child restrained) (PDO) | 0.1336 | −0.1213 | −0.0123 |
| The Random Parameters | |||
| The passenger’s gender (male) (PDO) | −0.0311 | 0.0309 | 0.0002 |
| The passenger’s age (50~64) (SI) | −0.0391 | 0.0393 | −0.0002 |
| Variable | Random Parameters Logit Model | ||
|---|---|---|---|
| Property Damage Only (PDO) | Severe Injury (SI) | Fatal Injury (FI) | |
| Constant | − | − | |
| The Environmental Characteristics | |||
| The weather (raining/sleet/hail/freezing rain) (SI) | 0.0223 | −0.0234 | 0.0011 |
| The Road Characteristics | |||
| The roadway class (urban multilane roads) (PDO) | 0.0154 | −0.0136 | −0.0017 |
| The roadway class (rural multilane road) (SI) | −0.0019 | 0.0020 | −0.0002 |
| The function class (urban)(SI) | −0.1222 | 0.1284 | −0.0062 |
| The surface type (block top) (SI) | 0.0195 | −0.0203 | 0.0008 |
| The Accident Characteristics | |||
| The time of the accident (weekend) (SI) | −0.0082 | 0.0082 | 0.0000 |
| The time of the accident (weekend) (FI) | 0.0022 | 0.0000 | −0.0022 |
| The Passenger Characteristics | |||
| The passenger’s age (>65) (PDO) | 0. 0628 | −0.0628 | 0.0000 |
| The passenger’s age (50~64) (PDO) | 0.0041 | −0.0037 | −0.0004 |
| The passenger’s seat position (second row) (PDO) | 0.0018 | −0.0011 | −0.0007 |
| The passenger’s seat position (third row) (PDO) | 0.0261 | −0.0176 | −0.0085 |
| The passenger’s seat position (third row) (FI) | −0.0057 | 0.0000 | 0.0058 |
| The passenger’s gender (male) (SI) | 0.0066 | −0.0069 | 0.0003 |
| The passenger’s protection measures (lap/shoulder/child restrained) (SI) | −0.5957 | 0.5917 | 0.0040 |
| The Driver Characteristics | |||
| The driver’s age (35~49) (PDO) | 0.0192 | −0.0192 | 0.0000 |
| The driver’s age (50~64) (PDO) | 0.0081 | −0.0080 | −0.0001 |
| The Random Parameters | |||
| The passenger’s protection measures (lap/shoulder/child restrained) (SI) | −0.5957 | 0.5917 | 0.0040 |
| Variable | Random Parameters Logit Model | ||
|---|---|---|---|
| Property Damage Only (PDO) | Severe Injury (SI) | Fatal Injury (FI) | |
| Constant | − | − | |
| The Environmental Characteristics | |||
| The weather (raining/sleet/hail/freezing rain) (SI) | −0.0045 | 0.0052 | −0.0007 |
| The Road Characteristics | |||
| The road surface (other) (PDO) | 0.0006 | −0.0006 | 0.0000 |
| The roadway class (rural multilane roads) (PDO) | −0.0057 | 0.0054 | 0.0003 |
| The Accident Characteristics | |||
| The location type (not at intersection driveway) (SI) | −0.0251 | 0.0299 | −0.0049 |
| The Passenger Characteristics | |||
| The passenger’s age (>65) (PDO) | 0.0166 | −0.0165 | −0.0001 |
| The passenger’s age (>65) (SI) | −0.0065 | 0.0073 | −0.0007 |
| The passenger’s age (35~49) (SI) | −0.0048 | 0.0050 | −0.0002 |
| The passenger’s age (35~49) (FI) | 0.0000 | 0.0004 | −0.0004 |
| The passenger’s age (50~64) (SI) | −0.0048 | 0.0050 | −0.0002 |
| The passenger’s age (50~64) (FI) | 0.0000 | 0.0003 | −0.0003 |
| The passenger’s gender (male) (SI) | −0.0316 | 0.0345 | −0.0029 |
| The passenger’s seat position (second row) (PDO) | 0.0005 | −0.0005 | 0.0000 |
| The passenger’s seat position (second row) (SI) | −0.0013 | 0.0015 | −0.0003 |
| The passenger’s seat position (third row) (SI) | −0.0029 | 0.0038 | −0.0010 |
| The passenger’s protection measures (lap/shoulder/child restrained) (PDO) | 0.0025 | −0.0036 | 0.0011 |
| The Driver Characteristics | |||
| The driver’s gender (male) (PDO) | −0.0168 | 0.0161 | 0.0007 |
| The driver’s protection measures (lap/shoulder/child restrained) (PDO) | 0.0865 | −0.0835 | −0.0030 |
| The Random Parameters | |||
| The passenger’s age (>65) (PDO) | 0.0166 | −0.0165 | −0.0001 |
| The passenger’s seat position (second row) (PDO) | 0.0005 | −0.0005 | 0.0000 |
| Variable | Random Parameters Logit Model | ||
|---|---|---|---|
| Property Damage Only (PDO) | Severe Injury (SI) | Fatal Injury (FI) | |
| Constant | |||
| The Road Characteristics | |||
| The road surface (wet/snow/slush/ice) (PDO) | −0.0081 | 0.0069 | 0.0012 |
| The road surface (other) (PDO) | −0.0029 | 0.0029 | 0.0000 |
| The roadway class (urban multilane roads) (SI) | −0.0801 | 0.0882 | −0.0081 |
| The roadway class (rural multilane roads) (SI) | −0.0054 | 0.0061 | −0.0007 |
| The Accident Characteristics | |||
| The location type (not at intersection driveway) (PDO) | −0.0411 | 0.0409 | 0.0002 |
| The location type (not at intersection driveway) (FI) | 0.0014 | 0.0015 | −0.0030 |
| The time of the accident (weekend) (SI) | −0.0150 | 0.0161 | −0.0011 |
| The location type (driveway-related) (SI) | −0.0055 | 0.0060 | −0.0006 |
| The Passenger Characteristics | |||
| The passenger’s age (35~49) (PDO) | 0.0261 | −0.0259 | −0.0002 |
| The passenger’s age (35~49) (SI) | −0.0327 | 0.0335 | −0.0008 |
| The passenger’s gender (male) (PDO) | −0.0382 | 0.0353 | 0.0029 |
| The passenger’s seat position (third row) (PDO) | 0.0096 | −0.0090 | −0.0006 |
| The passenger’s protection measures (lap/shoulder/child restrained) (PDO) | 0.3186 | −0.2961 | −0.0225 |
| The Driver Characteristics | |||
| The driver’s age (35~49) (PDO) | 0.0462 | −0.0458 | −0.0003 |
| The driver’s age (35~49) (SI) | −0.0560 | 0.0566 | −0.0007 |
| The driver’s age (50~64) (PDO) | −0.0142 | 0.0130 | 0.0012 |
| The driver’s gender (male) (SI) | −0.0176 | 0.0188 | −0.0011 |
| The Random Parameters | |||
| The passenger’s age (35~49) (PDO) | 0.0261 | −0.0259 | −0.0002 |
| The road surface (wet/snow/slush/ice) (PDO) | −0.0081 | 0.0069 | 0.0012 |
| Variable | Random Parameters Logit Model | ||
|---|---|---|---|
| Property Damage Only (PDO) | Severe Injury (SI) | Fatal Injury (FI) | |
| Constant | − | ||
| The Road Characteristics | |||
| The surface type (block top) (PDO) | −0.0286 | 0.0268 | 0.0018 |
| The roadway class (urban multilane roads) (FI) | 0.0001 | 0.0003 | −0.0007 |
| The Accident Characteristics | |||
| The location type (driveway-related) (SI) | −0.0050 | 0.0052 | −0.0002 |
| The Passenger Characteristics | |||
| The passenger’s gender (male) (PDO) | 0.0644 | −0.0640 | −0.0004 |
| The passenger’s gender (male) (SI) | −0.1176 | 0.1207 | −0.0031 |
| The passenger’s age (50~64) (PDO) | −0.0134 | 0.0133 | 0.0001 |
| The passenger’s age (50~64) (FI) | 0.0002 | 0.0007 | −0.0009 |
| The passenger’s age (>60) (SI) | −0.0101 | 0.0107 | −0.0006 |
| The passenger’s seat position (second row) (PDO) | 0.0038 | −0.0035 | −0.0003 |
| The passenger’s protection measures (lap/shoulder/child restrained) (PDO) | 0.0417 | −0.0437 | 0.0021 |
| The Driver Characteristics | |||
| The driver’s gender (male) (PDO) | 0.0321 | −0.0318 | −0.0002 |
| The driver’s gender (male) (SI) | −0.0618 | 0.0635 | −0.0016 |
| The driver’s age (35~49) (PDO) | 0.0179 | −0.0166 | −0.0013 |
| The driver’s age (50~64) (PDO) | −0.0085 | 0.0081 | 0.0004 |
| The Random Parameters | |||
| The passenger’s gender (male) (PDO) | 0.0644 | −0.0640 | −0.0004 |
| The passenger’s protection measures (lap/shoulder/child restrained) (PDO) | 0.0417 | −0.0437 | 0.0021 |
| Variable | Random Parameters Logit Model | ||
|---|---|---|---|
| Property Damage Only (PDO) | Severe Injury (SI) | Fatal Injury (FI) | |
| Constant | |||
| The Environmental Characteristics | |||
| The weather (fog/smog/smoke/foggy/windy/sand, dirt, or snow) (SI) | −0.0020 | 0.0021 | −0.0001 |
| The weather (raining) (SI) | 0.0020 | −0.0020 | 0.0001 |
| The Road Characteristics | |||
| The roadway class (urban multilane roads) (PDO) | −0.0313 | 0.0289 | 0.0024 |
| The road surface (wet/snow/slush/ice) (PDO) | 0.1181 | −0.1168 | −0.0013 |
| The road surface (wet/snow/slush/ice) (SI) | −0.1419 | 0.1435 | −0.0016 |
| The Accident Characteristics | |||
| The time of the accident (weekend) (PDO) | −0.0274 | 0.0260 | 0.0013 |
| The time of the accident (weekend) (FI) | 0.0023 | 0.0011 | −0.0034 |
| The location type (driveway-related) (PDO) | 0.0067 | −0.0063 | −0.0004 |
| The Passenger Characteristics | |||
| The passenger’s gender (male) (PDO) | 0.1534 | −0.1522 | −0.0011 |
| The passenger’s gender (male) (SI) | −0.2008 | 0.2037 | −0.0029 |
| The passenger’s age (35~49) (SI) | −0.0092 | 0.0095 | −0.0003 |
| The passenger’s age (50~64) (SI) | −0.0132 | 0.0135 | −0.0003 |
| The Driver Characteristics | |||
| The driver’s gender (male) (PDO) | 0.0912 | −0.0895 | −0.0018 |
| The driver’s gender (male) (SI) | −0.1164 | 0.1174 | −0.0010 |
| The driver’s protection measures (lap/shoulder/child restrained) (PDO) | 0.2768 | −0.2527 | −0.0241 |
| The Random Parameters | |||
| The passenger’s gender (male) (PDO) | 0.1534 | −0.1522 | −0.0011 |
| The road surface (wet/snow/slush/ice) (PDO) | 0.1181 | −0.1168 | −0.0013 |
Publisher’s Note: MDPI stays neutral with regard to jurisdictional claims in published maps and institutional affiliations. |
© 2022 by the authors. Licensee MDPI, Basel, Switzerland. This article is an open access article distributed under the terms and conditions of the Creative Commons Attribution (CC BY) license (https://creativecommons.org/licenses/by/4.0/).
Share and Cite
Hou, F.; Lv, C.; Liu, Q.; Yue, R.; Gao, H.; Pi, R.; Cai, R.; Guo, X. Temporal Stability Analysis of Lighting Conditions in Traffic Accidents. Safety 2022, 8, 44. https://doi.org/10.3390/safety8020044
Hou F, Lv C, Liu Q, Yue R, Gao H, Pi R, Cai R, Guo X. Temporal Stability Analysis of Lighting Conditions in Traffic Accidents. Safety. 2022; 8(2):44. https://doi.org/10.3390/safety8020044
Chicago/Turabian StyleHou, Fujin, Chen Lv, Qun Liu, Rui Yue, Huarui Gao, Rendong Pi, Ruirui Cai, and Xinming Guo. 2022. "Temporal Stability Analysis of Lighting Conditions in Traffic Accidents" Safety 8, no. 2: 44. https://doi.org/10.3390/safety8020044
APA StyleHou, F., Lv, C., Liu, Q., Yue, R., Gao, H., Pi, R., Cai, R., & Guo, X. (2022). Temporal Stability Analysis of Lighting Conditions in Traffic Accidents. Safety, 8(2), 44. https://doi.org/10.3390/safety8020044