Article

Relationship between Self-Reported Neighborhood Safety and Happiness and Life Satisfaction among Women in Low-Middle Income Countries

School of Nursing, University of Ottawa, Ottawa, ON K1H 8M5, Canada
*
Author to whom correspondence should be addressed.
Safety 2022, 8(2), 31; https://doi.org/10.3390/safety8020031
Submission received: 31 October 2021 / Revised: 5 March 2022 / Accepted: 21 March 2022 / Published: 12 April 2022

Abstract

:
Measures related to subjective well-being such as perceived happiness and life satisfaction are becoming increasingly popular among health researchers due to their strong correlation with longevity and all-cause mortality. Previous studies have focused on the role of environmental safety on female empowerment. However, not much is known about the impact of environmental risk factors such as perceived safety on subjective well-being, especially in the low-middle-income countries (LMICs). The present study aims to investigate the association between self-reported safety and self-reported happiness and life satisfaction among women in selected LMICs in Asia and Africa. Methods: We analyzed cross-sectional data from eleven countries on 186,388 women aged 15–49 years from the sixth round of the Multiple Indicator Cluster Survey. The outcome measures were self-reported happiness and life satisfaction, and their associations with the safety indicators (i.e., feeling unsafe in the neighborhood and at home) were calculated using generalized ordered logit models by adjusting for relevant sociodemographic factors. Results: The highest percentage of feeling very unsafe both in the neighborhood (39.3%) and at home (26.5%) was reported in Iraq, while Tonga had the highest percentage of reporting both feeling very safe in the neighborhood (55.3%) and at home (54.9%). The odds of self-reported worsening life satisfaction were higher among women who reported feeling very unsafe in the neighborhood [OR = 1.43, 95% CI = 1.36,1.50] and at home [OR = 1.13, 95% CI = 1.08,1.19]. Feeling of being very unsafe in the neighborhood [OR = 1.16, 95% CI = 1.10,1.22] and at home [OR = 1.65, 95% CI = 1.57,1.74] also showed strong positive association with self-reported unhappiness. Conclusions: Our findings from eleven LMICs across Asia and Africa indicate that lack of environmental safety may negatively impact subjective well-being among women. Further research is necessary to explore the root causes of insecurity and design intervention programs aiming to promote women’s psychosocial health and well-being.

1. Introduction

During the last two to three decades, there has been a growing interest surrounding the subjective measures of health (SRH), well-being (SWB), and quality of life (QoL) among public health practitioners and researchers. This is probably due to the fact that these informant-rating questions are fairly easy to measure and still strongly predictive of longevity and all-cause, as well as cause specific, mortality in community settings [1,2,3,4,5]. Advanced analytical methods also likely to have equipped researchers with necessary tools to make concrete conclusions such as ‘SWB is associated with 7.5 to 10 years increase in life expectancy’ [2], and ‘happy people live longer and better’ [6]. As such, the use of single-item questions regarding health and well-being (e.g., how satisfied are you with your overall health/quality of life) have become fairly common in population-based studies measuring social determinants of health among adults.
Neighborhood safety is a well-established social determinant that impacts health and psychosocial well-being through various direct and indirect mechanisms [7,8,9,10]. In LMICs, lack of neighborhood safety among women may greatly prevent access to health and social services vital for self-care and management of health conditions [11]. For instance, women living in neighborhoods with high crime rates are less likely to be able to attend school and participate in outdoor jobs, which can not only curb their potential for socioeconomic empowerment and upward mobility but also have a deleterious impact on their overall health [12,13,14]. Despite this evidence, there is dearth of evidence regarding the impact of environmental safety and subjective well-being among women in the LMICs, which is perhaps due to relatively lower appreciation of the concept of well-being in health and social research and lack of resources to conduct quality research. To address this research gap, we have utilized open-access data from the Multiple Indicator Cluster Surveys (MICS) that are implemented by the United Nations Children’s Fund. Recent rounds of MICS have included questions regarding subjective well-being and neighborhood safety for several countries, thereby allowing investigation of their relationship on internationally comparable sample of women aged 15–49 years. The present study focuses specifically on exploring the cross-sectional relationships between self-reported safety (in neighborhoods and at home) and happiness and improvement in life satisfaction to broaden the understanding of the impact of safety on women’s psychosocial well-being in LMICs.

2. Materials and Methods

Data for the present study were obtained from the UNICEF Multiple Indicator Cluster Surveys conducted in Central African Republic/CAR (2018–2019), Chad (2019), Lesotho (2019), Tonga (2019), Tuvalu (2019–2020), Bangladesh (2019), DR Congo (2017–2018), Iraq (2018), Palestine (2019–2020), Suriname (2018), Zimbabwe (2019). The Multiple Indicator Cluster Survey (MICS) is an international household survey program developed and supported by UNICEF with the aim of collecting quality data on key millennium development goals (MDGs) indicators that are used to track progress towards maternal and child health in the LMICs [15]. The Multiple Indicator Cluster Survey employs a multistage cluster-sampling strategy to select country representative samples. The first stage involves selections of enumeration areas using probability proportional to sizes which serve as the basis for selection of households in the second stage. Finally, households are selected using random systematic sampling into survey clusters consisting of about 20–25 households. Women who meet the eligibility criteria are then interviewed face-to-face. Response rates women’s surveys in MICS is around 90 percent [16]. Sample sizes for the countries included in the present study are shown in Figure 1.

2.1. Variables Used in the Study

Outcome variables: The outcome variables were self-reported change in satisfaction life compared with the previous year (improved; same; worse) and happiness (very happy; happy; neutral; unhappy; very unhappy). Those who answered as ‘don’t know’ or ‘no response’ were not included in the analysis. The exposure variables of interest were perceived safety in the neighborhood (feeling safe walking alone in neighborhood after dark?) and at home (feeling safe at home alone after dark?). Answers to these questions were categorized as: safe; unsafe; and very unsafe. To adjust the analyses for potentially confounding variables, the following were also included in the study: age groups (15–19, 20–24, 25–29, 30–34, 35–39, 40–44, 45–49); currently married (yes/no); area type urban/rural); education (up to primary/secondary/higher); household wealth quantile (poorest/poorer/middle/richest/richest); any child ever died (no/one/>one).

2.2. Data Analysis

All analyses were performed using Stata version 16 by adjusting for the clustered survey design using sampling weight, sampling strata and primary sampling unit. The percentages of reporting unsafe at home and neighborhoods were shown as bar charts across countries. Given the ordinal nature of the outcome variables, we initially applied the ordinal logistic regression method to measure their association with the main explanatory variables by adjusting for several sociodemographic characteristics. However, post-analysis model diagnostics (Brant test statistic p < 0.05) indicated that models violated the assumption of proportional odds, which basically assumes that the estimates between a certain pair of response levels are the same for all other response pairs. As such, we finally selected the gologit2 method (i.e., Generalized Ordered Logit) as an alternative since it is not subject to the parallel odds assumption and therefore reports separate sets of odds ratios for each pair of responses since the relationship between the pairs of responses is not the same (e.g., happy vs. unhappy ≠ happy vs. neutral). We performed a regression analysis first for the entire sample, and then separately for urban and rural sample. This choice was led by the concern that urban and rural areas are likely to vary in terms of well-being and environmental safety concerns. Thus, a total of three regression models were run for each of the outcome variables. The results were reported as odds ratios with 95% confidence intervals. Level of statistical significance was reported for three cut-off points: * p < 0.05, ** p < 0.01, *** p < 0.001. Following the regression analyses, sensitivity (performed on randomly selected 40% and 70% of the sample) and multicollinearity tests (variance inflation factor) to make sure the findings are similar in the test samples and that the level of was collinearity is not an issue.

3. Results

Basic sociodemographic characteristics of the participants were presented in Table A1 (Appendix A). Majority of the participants were in the age groups of 20–24 years (16.45%), were currently married (77.87%), rural residents (65.98%), had higher then secondary educational qualification (40.31%), from households of lowest wealth quintile (20.30%), did not report any children who died (89.1%). About one fifth of the women reported feeling very unsafe in the neighborhood (19.07%), and 2.13% reported feeling very unsafe at home.
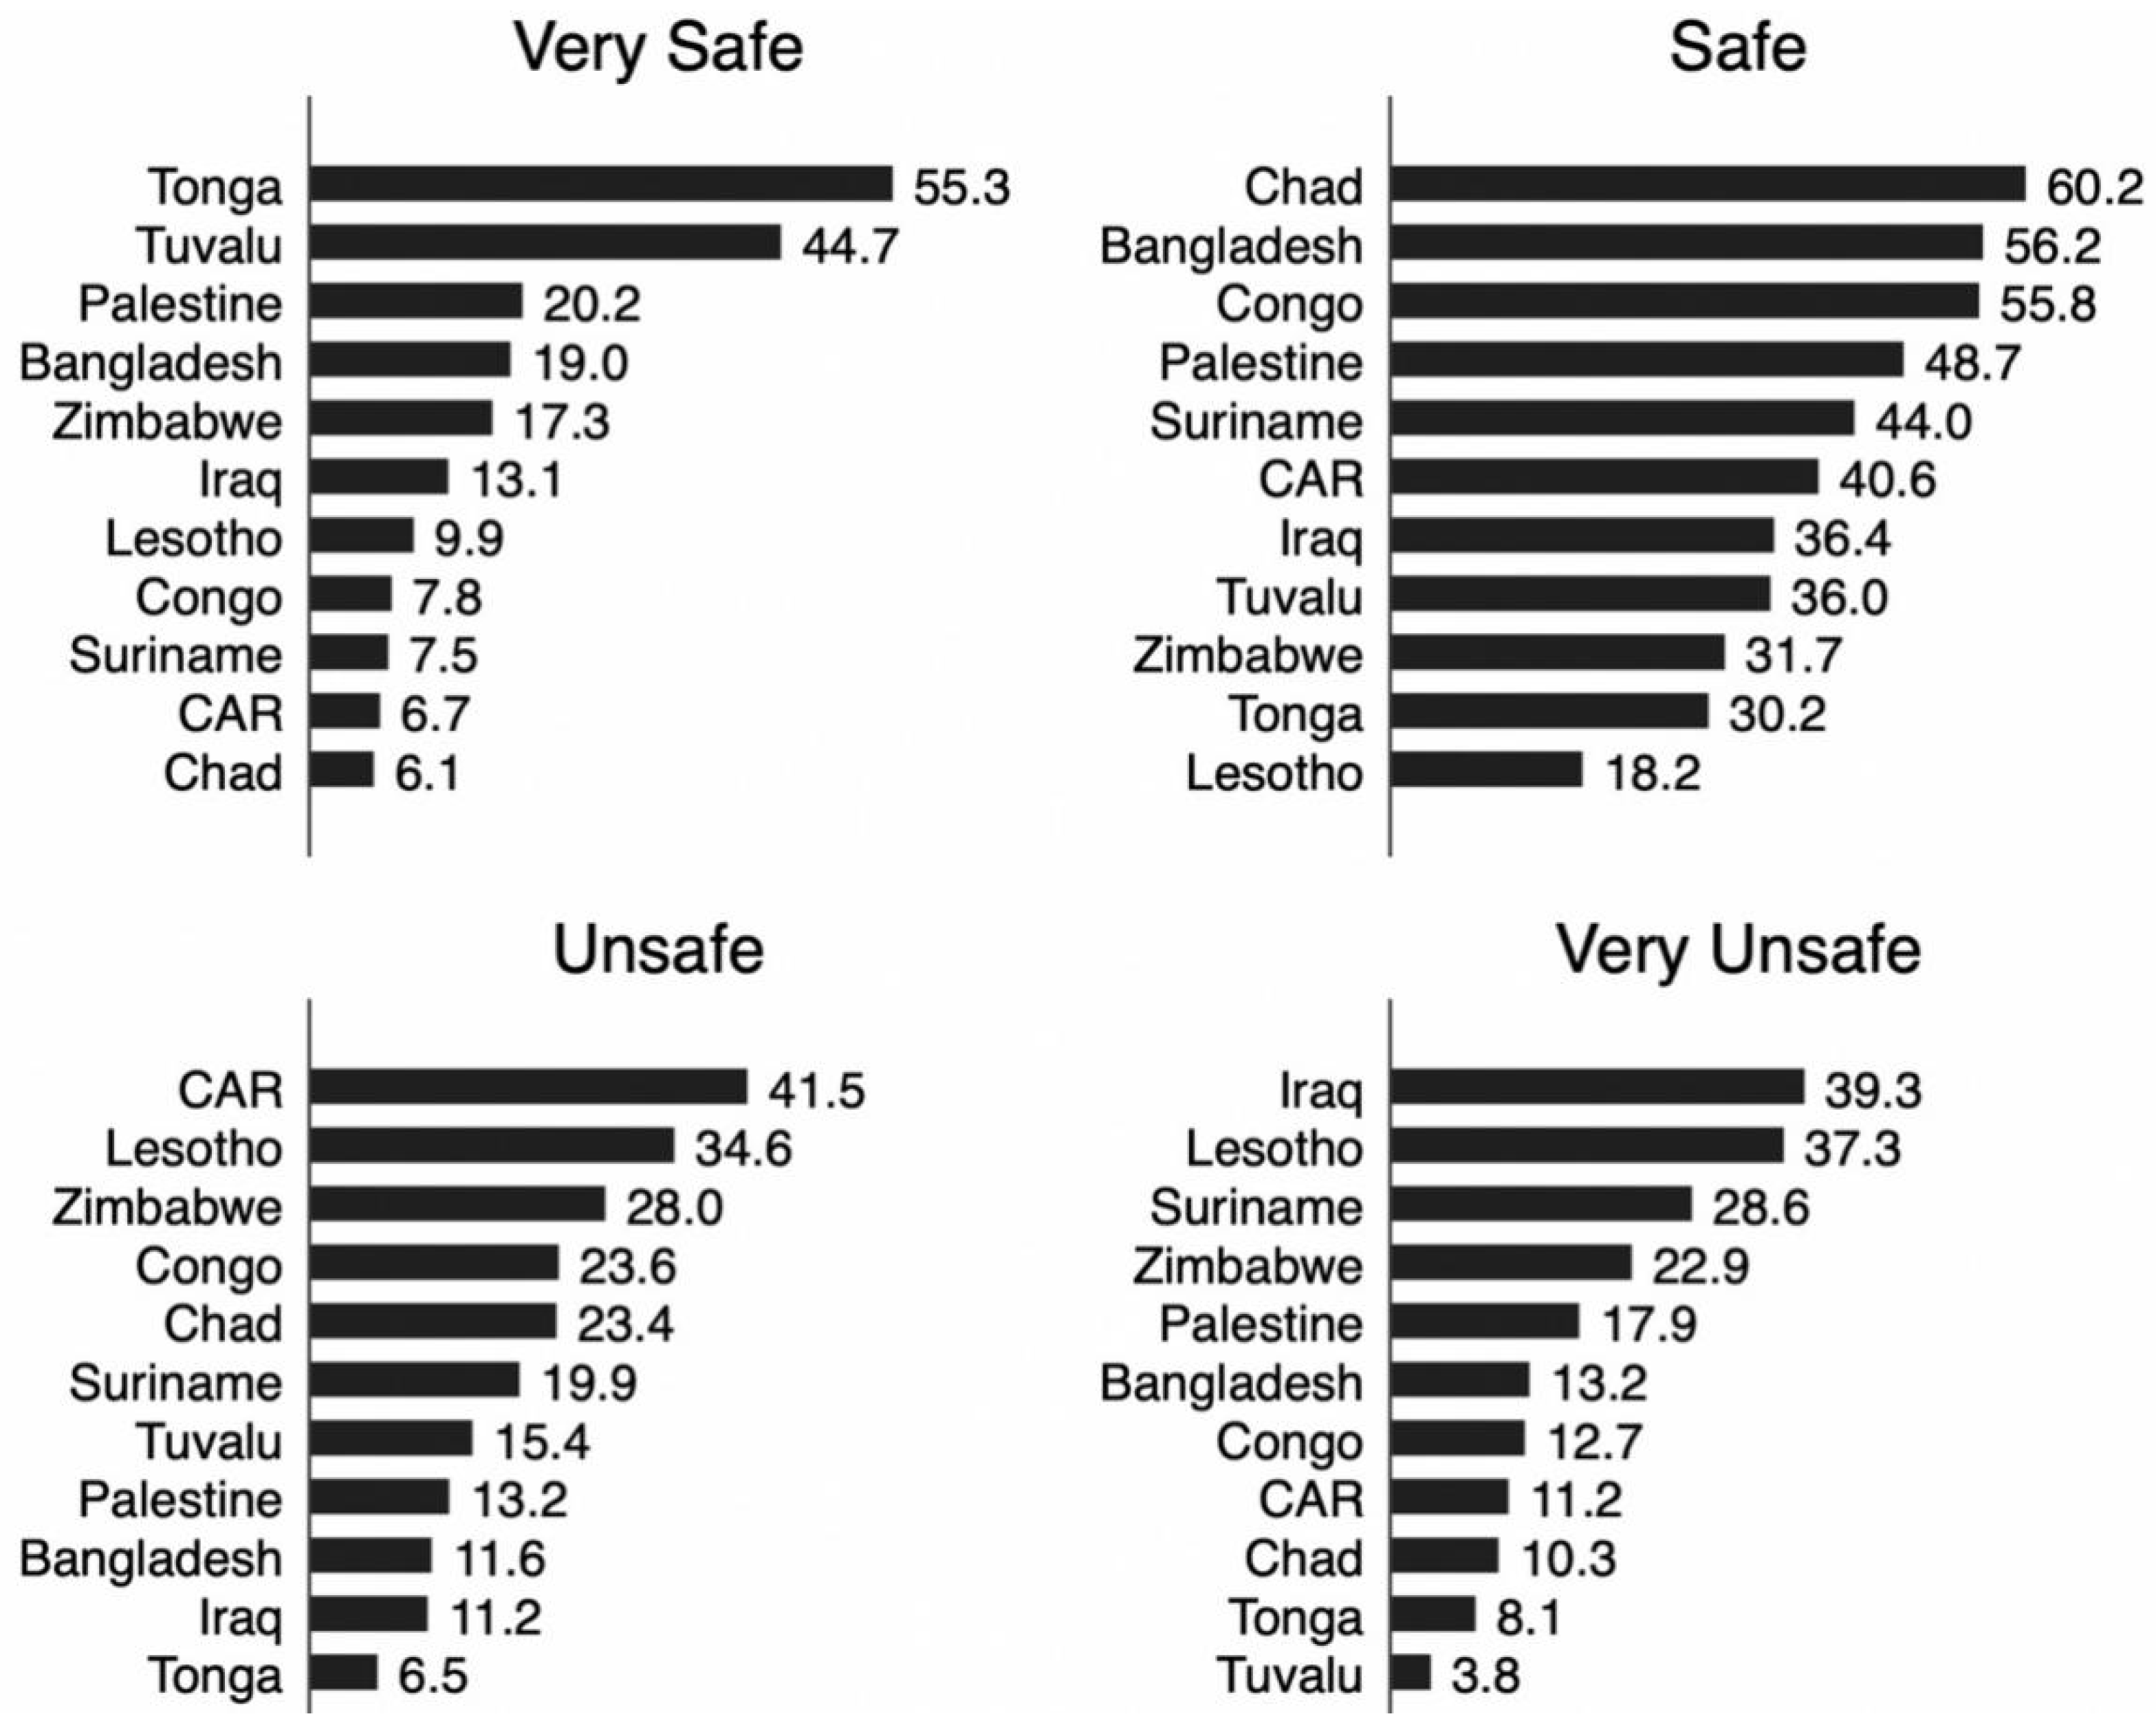
As illustrated by Figure 2, the highest percentage of feeling very unsafe in the neighborhood was reported in Iraq (39.3%), followed by Lesotho (37.3%), Suriname (28.6%) and Zimbabwe (22.9%). On the other hand, the highest percentage of feeling very safe in the neighborhood was reported in Tonga (55.3%) followed by Tuvalu (44.7%), Palestine (20.2%), and Bangladesh (19%).
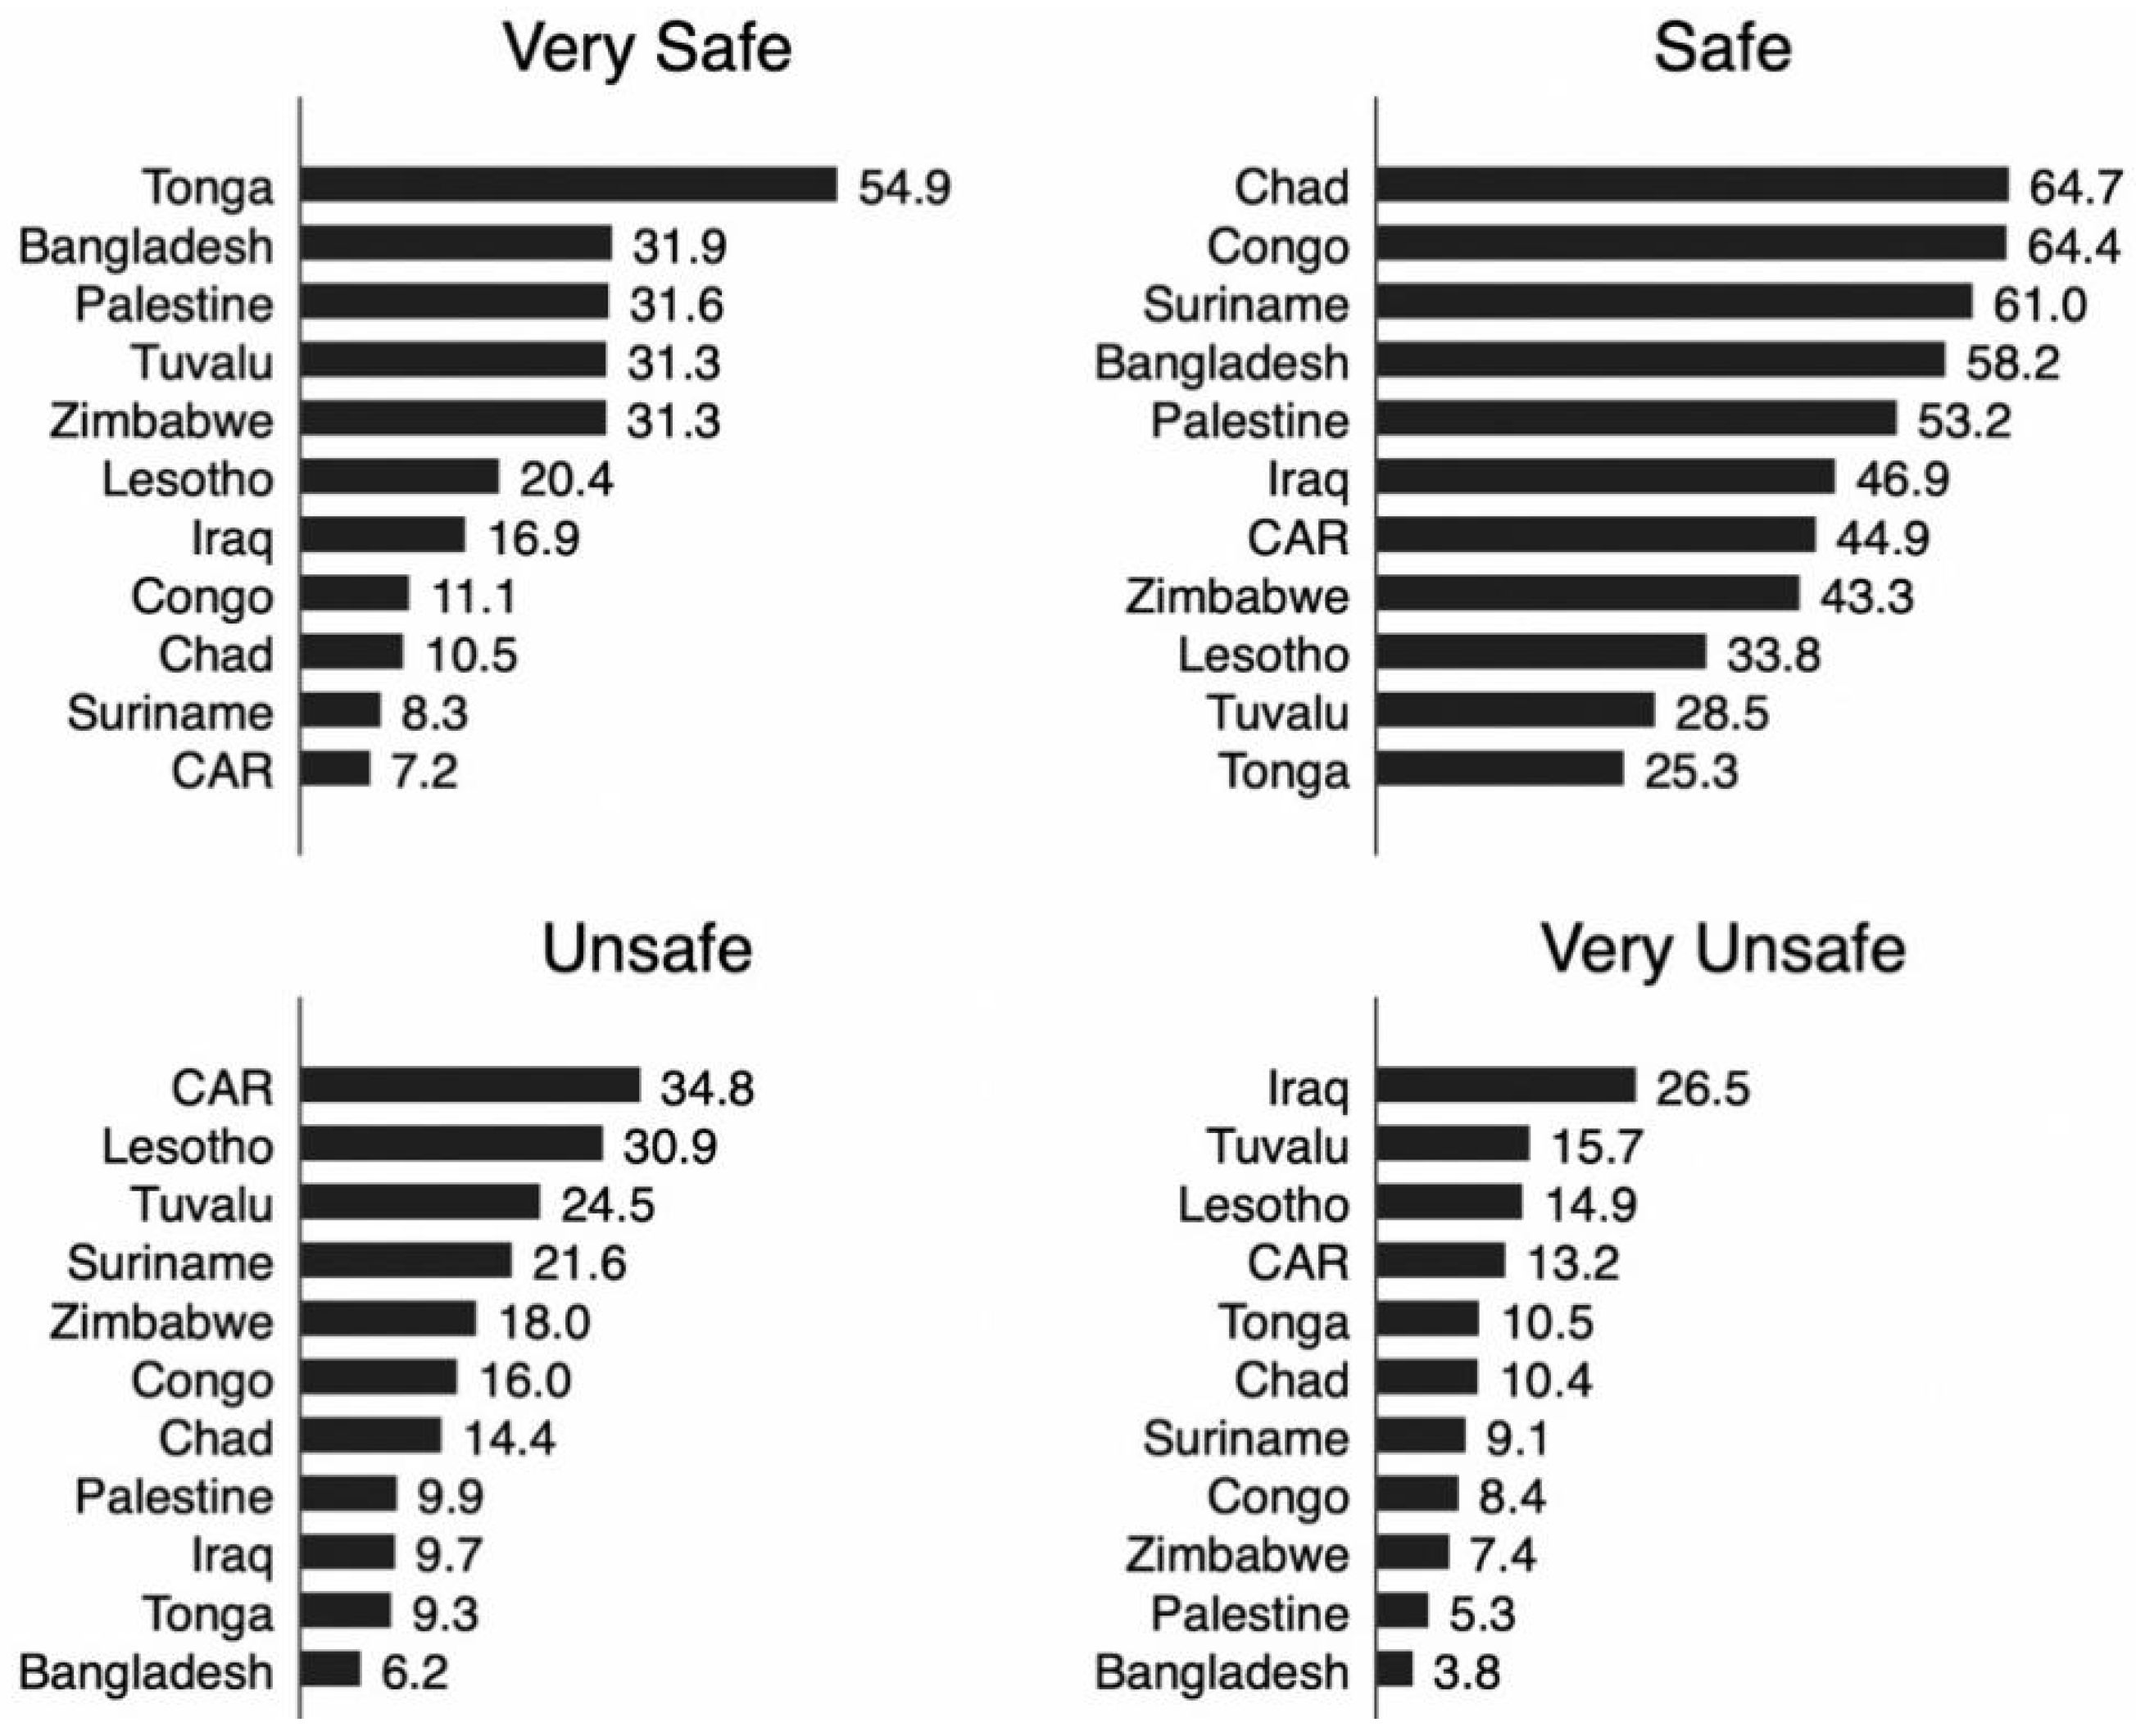
As illustrated by Figure 3, the highest percentage of feeling very unsafe in at home was reported in Iraq (26.5%), followed by Tuvalu (15.7%), Lesotho (14.9%), and the Central African Republic (13.2%). On the other hand, the highest percentage of feeling very safe was reported in Tonga (54.9%) followed by Bangladesh (31.9%), and Palestine (31.6%).
Compared to women who reported feeling very unsafe in the neighborhood, those who reported otherwise had higher odds of reporting worsening life-satisfaction (Table 1). For instance, those who reported feeling very unsafe in the neighborhood had 1.4 times higher odds [OR = 1.43, 95% CI = 1.36,1.50] of reporting worsening life-satisfaction, with the effect being comparatively higher among rural women [OR = 1.49, 95% CI = 1.40,1.58].
Likewise, compared to women who reported feeling very safe at home, those who reported otherwise had higher odds of reporting worsening life-satisfaction. Women who reported feeling very unsafe at home had 1.13 times higher odds [OR = 1.13, 95% CI = 1.08,1.19] of reporting worsening life-satisfaction, with the effect being comparatively higher among urban women [OR = 1.25, 95% CI = 1.15,1.35].
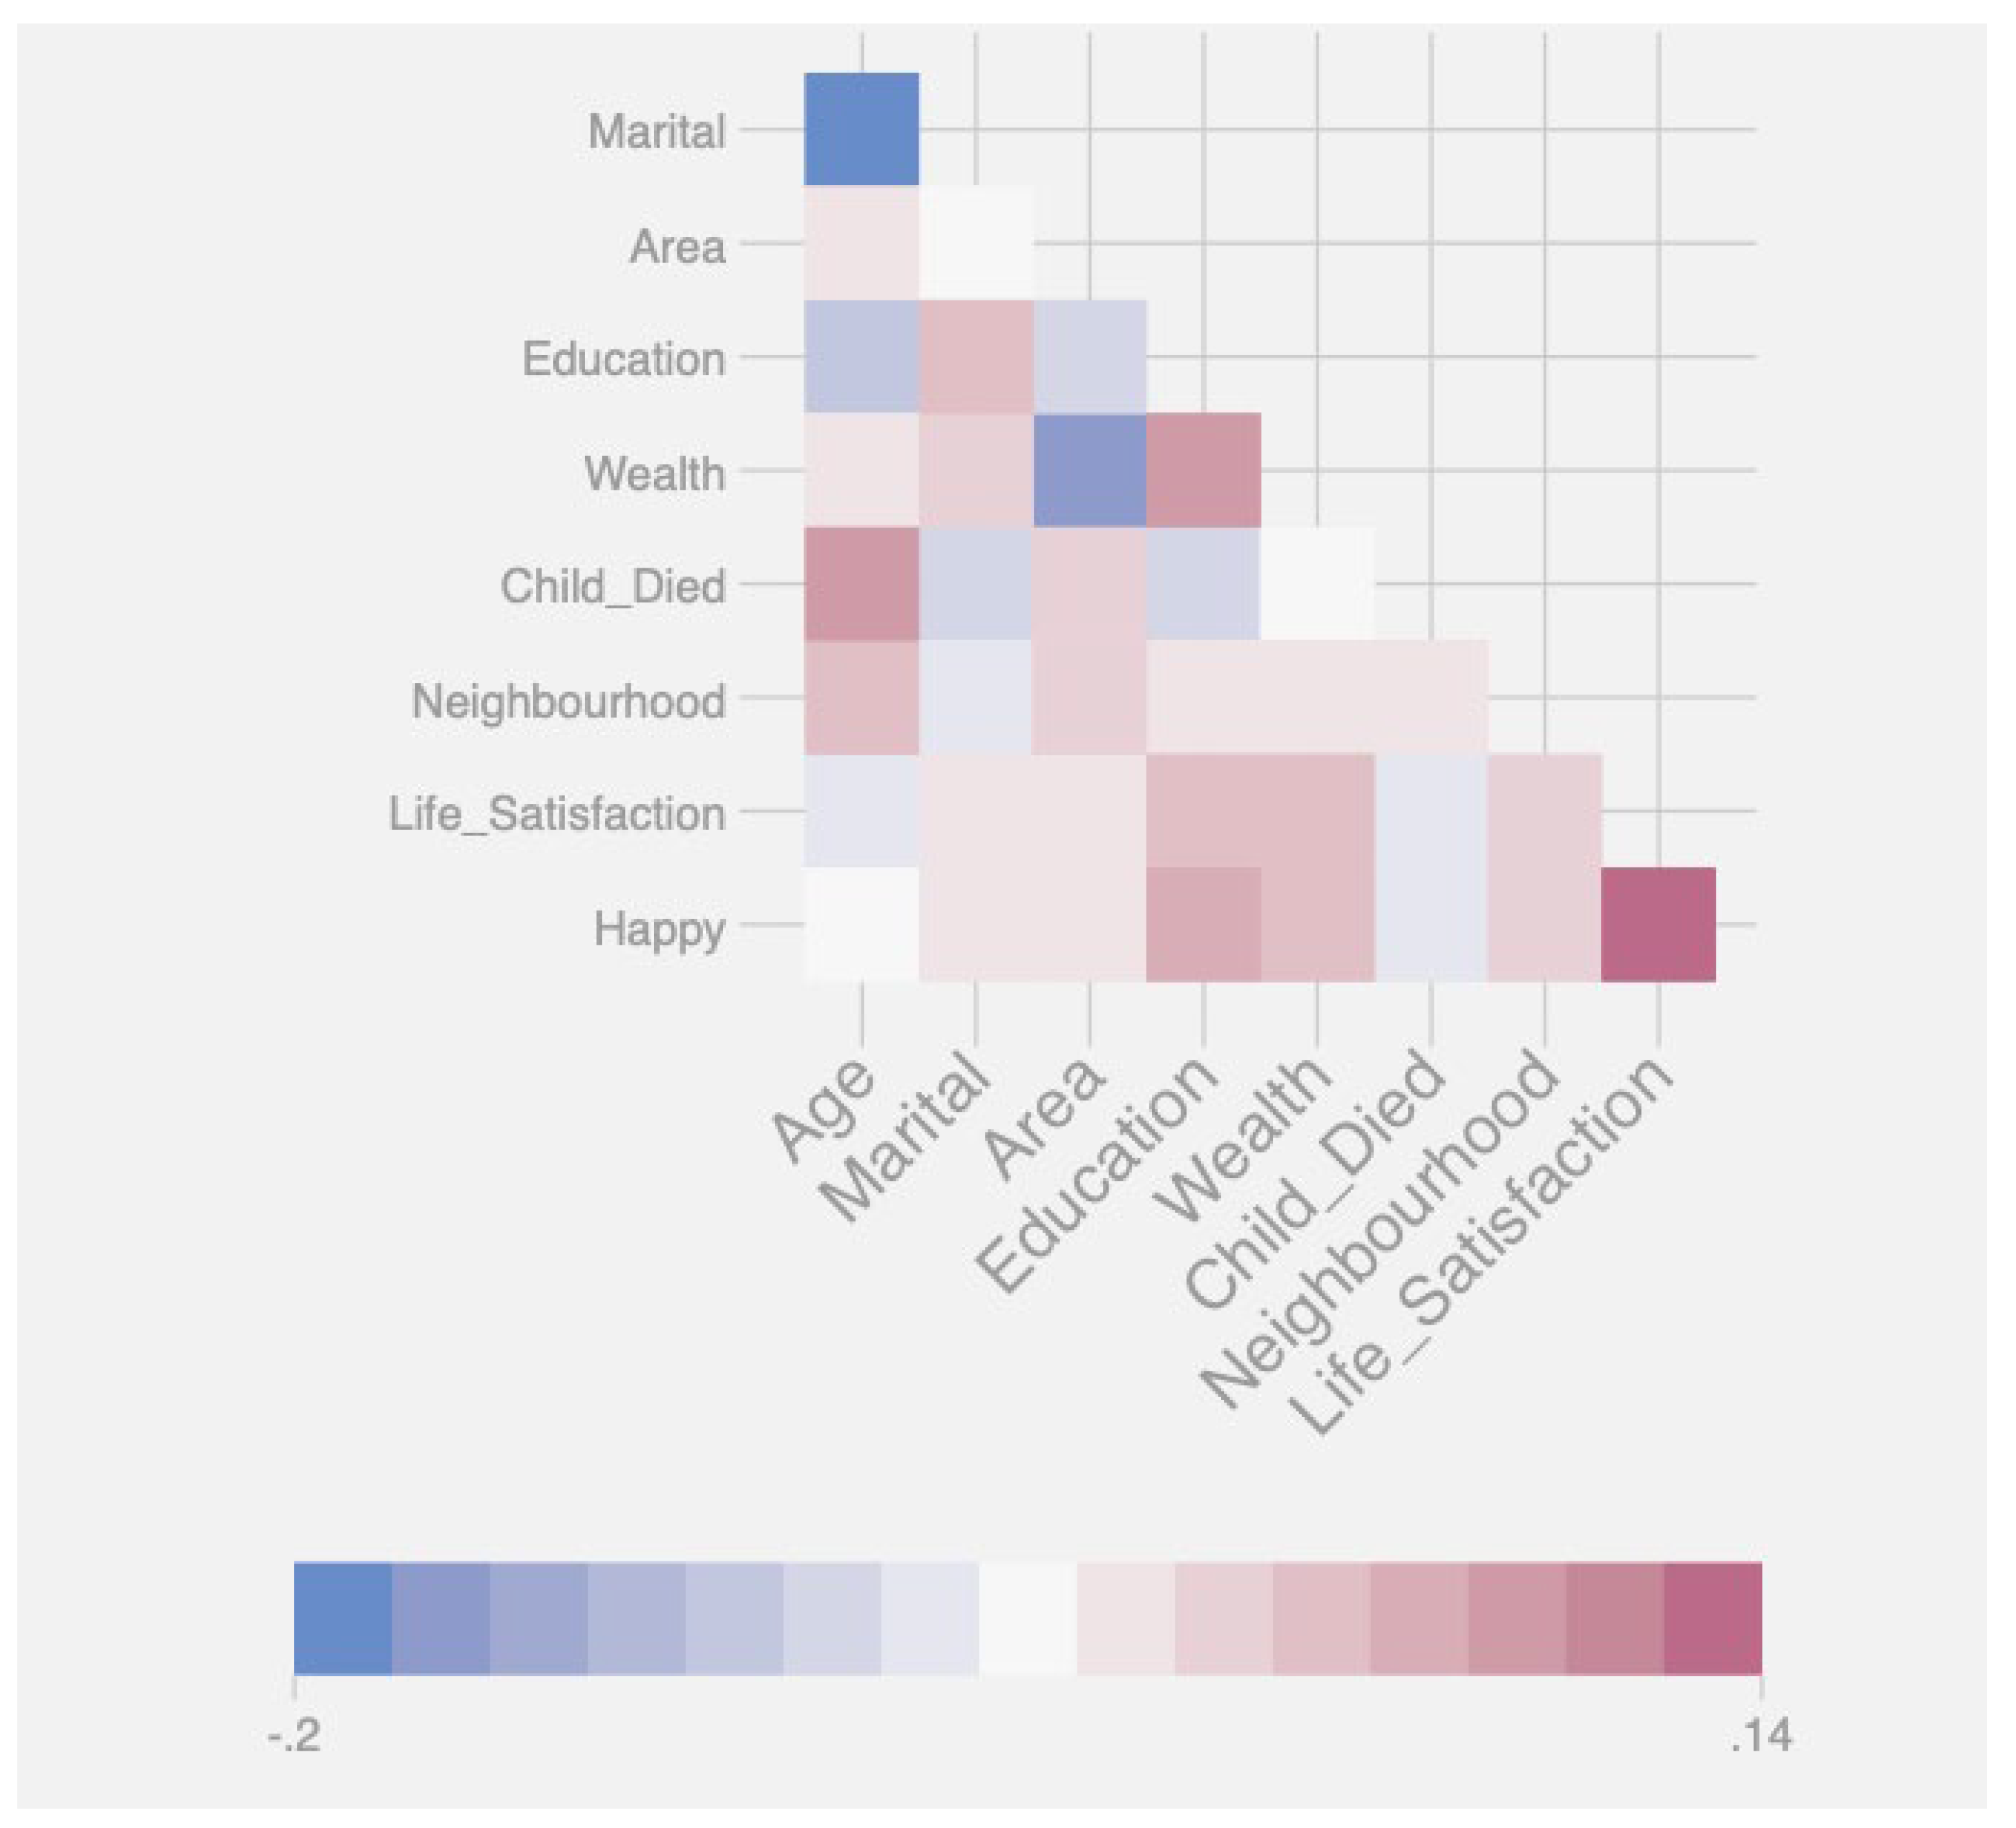
Figure 4 shows the level of correlation among the explanatory and outcome factors. It shows no strong correlation among the exploratory variables, except that age and marital status and happiness and life satisfaction were weakly correlated.
Similar to self-reported improvement in life satisfaction, compared to women who reported feeling very safe at home, those who reported otherwise had higher odds of reporting being unhappy (Table 2). Women who reported feeling very unsafe in the neighborhood were 1.16 times [OR = 1.16, 95% CI = 1.10,1.22] as likely to report being unhappy. The odds of reporting neither happy nor unhappy was also high among those who mentioned feeling very unsafe, however this association was significant among urban women only [OR = 1.23, 95% CI = 1.07,1.43]. Lastly, women who reported feeling very unsafe at home were 1.65 times [OR = 1.65, 95% CI = 1.57,1.74] as likely to report being unhappy, and 1.88 times [OR = 1.16, 95% CI = 1.74,2.03] as likely to report being neither compared with those who reported feeling very safe at home.

4. Discussion

In the present study we analyzed a large sample of adult women from selected LMICs across Asia and Africa and have calculated the proportion of women who reported feeling unsafe in the neighborhood and at home, as well their association with self-reported happiness and improvement in life satisfaction. Our initial descriptive analysis generated disconcerting findings for several countries where more than half of the women reported feeling unsafe at home and in the neighborhood. In Lesotho, over 70% of the women reported feeling unsafe in the neighborhood and over 45% reported feeling unsafe at home. These findings align with the current situation in the country and add to the mounting throes the population has been experiencing including decades of political instability and persistently underperforming economy and healthcare system [16,17,18]. Similar situations can be seen in Iraq [17] and the Central African Republic [18] as well, where the health and well-being of a large proportion of the population remain at risk due to inadequate health and social infrastructure and lack of health coverage.
The situation can be even worse for women due to their higher socioeconomic vulnerability and widespread human right abuse which are important determinants of health. Lack of safety in the community can further compromise women’s ability to access resources and create health promoting opportunities, which in turn can significantly increase the burden on the healthcare systems, as aptly posited by Tinker in, ‘Women’s Health is an Unfinished Agenda for Global health’ [19], and arguably more so in the LMICs, owing to the dire situation of the social determinants of health and lower appreciation of the broader dimensions of health and psychosocial well-being [20,21,22].
Our findings from multivariate regression analyses highlight that feeling unsafe at home and in the neighborhood can significantly affect perceived happiness and life satisfaction. Women who reported feeling unsafe at home and in the neighborhood had higher odds of reporting worsening or no change in life satisfaction compared with those who reported feeling safe and very safe. These relationships were significant for both urban and rural sample, with the effect sizes being generally higher for rural women. Stratifying the analyses by type of place of residence was deemed important as crime rates [23,24] and subjective well-being [25] tend to vary between urban and rural areas. Evidence shows that urbanicity is associated with higher risk of mental health issues [26,27,28] and thus can confound the relationship between safety and wellbeing. Additional descriptive analyses (not shown in the results) indicated that the percentage of reporting feeling unsafe was relatively higher in the rural areas, adding an important insight to the current literature regarding the difference in perceived safety among women in the LMICs.
Similar patterns were observed for self-reported happiness as well, with the odds of unhappiness being significantly higher among the women who reported feeling unsafe at home and in the neighborhoods. Interestingly, for self-reported improvement in life satisfaction, the effect sizes were comparative higher for feeling unsafe and very unsafe in the neighborhood, whereas for happiness feeling unsafe at home appeared to have a stronger effect than feeling unsafe in the neighborhoods. Although this is a cross-sectional study and the findings do not allow inferring any causal relationship, these findings however provoke important questions regarding the nuanced differences in life satisfaction and happiness in their associations with perceived safety at home and in the neighborhoods. Further qualitative studies are necessary for more in-depth investigation of these temporal relationships between safety and subjective well-being. Previous studies have shown that neighborhood safety is associated with higher likelihood of engaging in health promoting behavior such as outdoor physical activities and social cohesion. Although the current data are not grained enough to explain the potential mechanisms behind these correlations, some possible mediators might be higher empowerment opportunities and greater social cohesion and sense of belonging that are important predictors of health and well-being outcomes [29,30].
Our findings provide important insights regarding the relationship between lack of safety and subjective well-being among women in the LMICs. While previous studies have focused largely on health-related behaviors such as physical activity and social participation, the present study extends the scope of the research and enhances our understanding of the potentially adverse role that unsafe social environment can play on subjective well-being. The sample size was considerably large and data were collected from recent surveys. Therefore the descriptive findings are expected to reflect the current situation regarding the prevalence of reporting lack of safety in the countries under study. Our findings also point to some nuanced difference in the respective associations, such that neighborhood level safety may matter more in terms of life satisfaction whereas perceived happiness may be affected more by feeling of safety at home than safety in the neighborhood. Despite these contributions of this study, there are several important limitations linked to the data and type of surveys that should be kept in mind when interpreting the associations. Firstly, the variables are measured subjectively and are naturally subject to reporting biases. Secondly, self-reported lack of safety may not represent the actual situation as someone’s lack of feeling unsafe can be influenced by negative experiences in the past. A common issue with self-reported indicators is that it makes comparisons difficult with studies that use an objective measurement. Similarly, change in life satisfaction and happiness are subjective constructs and are likely to be impacted by factors that were not captured by the data. The cross-sectional nature of the data also precludes making any causal inference. It is indeed possible that state of unhappiness and worsening life satisfaction among individuals can lead to precarious living conditions that can create a feeling of insecurity. More studies are needed to clarify the direction of and mechanisms behind these associations.

5. Conclusions

This was a large cross-sectional study based on MICS data on adult women in eleven LMICs in Asia and Africa. Findings suggest a considerably higher percentage of reporting neighborhood and home level insecurity in Iraq, Lesotho, and the Central African Republic. The main finding of the study is that feeling unsafe both at home and in the neighborhood is positively associated with worsening life satisfaction and unhappiness among women. As such, lack of security can have significant bearing on subjective well-being and must be given special research and policy attention to promote overall health and life experience as conceptualized in the definition of health by the World Health Organization.

Author Contributions

Conceptualization, B.G.; Methodology, B.G.; Software, B.G.; Formal Analysis, B.G., J.E.; Investigation, J.E.; Resources, J.E.; Data Curation, B.G.; Writing, B.G., J.E.; Writing, B.G., J.E.; Visualization, B.G.; Supervision, B.G., J.E.; Project Administration, J.E. All authors have read and agreed to the published version of the manuscript.

Funding

This research received no external funding.

Institutional Review Board Statement

Not applicable; data were secondary and available in the public domain. All participants gave written consent before taking part in the survey.

Acknowledgments

We are thankful to UNICEF MICS for the provision of the data in the public domain.

Conflicts of Interest

The authors declare no conflict of interest.

Appendix A

Table A1. Basic sociodemographic characteristics of the participants.
Age GroupsPercentCum.
15–1918.718.7
20–2416.4535.15
25–2916.0751.22
30–3415.4466.66
35–3913.7180.36
40–4410.6691.03
45–498.97100
Currently MarriedPercentCum.
Yes77.8777.87
No22.13100
Area typePercentCum.
Urban34.0234.02
Rural65.98100
EducationPercentCum.
Up To Primary27.7427.74
Secondary31.9559.69
Higher40.31100
Household Wealth quantilePercentCum.
Poorest20.320.3
Second19.8740.17
Middle20.2260.39
Fourth19.6480.03
Richest19.97100
Any Child ever diedPercentCum.
No89.189.1
One7.9197.01
>one2.99100
Neighbourhood safetyPercentCum.
Very Safe14.5014.50
Safe48.5963.09
Unsafe17.8580.93
Very Unsafe19.07100.00
Feels unsafe at homePercentCum.
Very Safe29.3529.35
Safe65.8895.23
Unsafe2.6397.87
Very Unsafe2.13100.00

References

  1. Kimm, H.; Sull, J.W.; Gombojav, B.; Yi, S.-W.; Ohrr, H. Life satisfaction and mortality in elderly people: The Kangwha Cohort Study. BMC Public Health 2012, 12, 54. [Google Scholar] [CrossRef] [PubMed] [Green Version]
  2. Feller, S.; Teucher, B.; Kaaks, R.; Boeing, H.; Vigl, M. Life Satisfaction and Risk of Chronic Diseases in the European Prospective Investigation into Cancer and Nutrition (EPIC)-Germany Study. PLoS ONE 2013, 8, e73462. [Google Scholar] [CrossRef] [PubMed]
  3. Huang, R.; Ghose, B.; Tang, S. Effect of financial stress on self-rereported health and quality of life among older adults in five developing countries: A cross sectional analysis of WHO-SAGE survey. BMC Geriatr. 2020, 20, 288. [Google Scholar] [CrossRef] [PubMed]
  4. He, Z.; Cheng, Z.; Bishwajit, G.; Zou, D. Wealth Inequality as a Predictor of Subjective Health, Happiness and Life Satisfaction among Nepalese Women. Int. J. Environ. Res. Public Health 2018, 15, 2836. [Google Scholar] [CrossRef] [Green Version]
  5. Koivumaa-Honkanen, H.; Honkanen, R.; Viinamäki, H.; Heikkilä, K.; Kaprio, J.; Koskenvuo, M. Self-reported life satisfaction and 20-year mortality in healthy Finnish adults. Am. J. Epidemiol. 2000, 152, 983–991. [Google Scholar] [CrossRef] [Green Version]
  6. Gan, Y. Happy People Live Longer and Better: Advances in Research on Subjective Well-Being. Appl. Psychol. Health Well-Being 2020, 12, 3–6. [Google Scholar] [CrossRef] [PubMed]
  7. Bennett, G.G.; McNeill, L.H.; Wolin, K.Y.; Duncan, D.T.; Puleo, E.; Emmons, K.M. Safe to walk? Neighborhood safety and physical activity among public housing residents. PLoS Med. 2007, 4, 1599–1606; discussion 1607. [Google Scholar] [CrossRef] [Green Version]
  8. Kerr, Z.; Evenson, K.R.; Moore, K.; Block, R.; Diez Roux, A.V. Changes in Walking Associated with Perceived Neighborhood Safety and Police-Recorded Crime: The Multi-Ethnic Study of Atherosclerosis. Prev. Med. 2015, 73, 88–93. [Google Scholar] [CrossRef] [Green Version]
  9. Carver, A.; Timperio, A.; Crawford, D. Playing it safe: The influence of neighbourhood safety on children’s physical activity. A review. Health Place 2008, 14, 217–227. [Google Scholar] [CrossRef]
  10. An, R.; Yang, Y.; Hoschke, A.; Xue, H.; Wang, Y. Influence of Neighborhood Safety on Childhood Obesity: A Systematic Review and Meta-analysis of Longitudinal Studies. Obes. Rev. Off. J. Int. Assoc. Study Obes. 2017, 18, 1289–1309. [Google Scholar] [CrossRef]
  11. Tung, E.L.; Boyd, K.; Lindau, S.T.; Peek, M.E. Neighborhood crime and access to health-enabling resources in Chicago. Prev. Med. Rep. 2018, 9, 153–156. [Google Scholar] [CrossRef]
  12. For Girls, Success Starts with Safe Schools. Women Deliver. 2016. Available online: https://womendeliver.org/2016/for-girls-success-starts-with-safe-schools/ (accessed on 23 October 2021).
  13. Mori, Y.; Tiiri, E.; Khanal, P.; Khakurel, J.; Mishina, K.; Sourander, A. Feeling Unsafe at School and Associated Mental Health Difficulties among Children and Adolescents: A Systematic Review. Children 2021, 8, 232. [Google Scholar] [CrossRef]
  14. Meyer, S.R.; Yu, G.; Hermosilla, S.; Stark, L. School violence, perceptions of safety and school attendance: Results from a cross-sectional study in Rwanda and Uganda. J. Glob. Health Rep. 2018, 2, e2018020. [Google Scholar] [CrossRef] [PubMed]
  15. Buh, A.; Kota, K.; Bishwajit, G.; Yaya, S. Prevalence and Associated Factors of Taking Intermittent Preventive Treatment in Pregnancy in Sierra Leone. Trop. Med. Infect. Dis. 2019, 4, 32. [Google Scholar] [CrossRef] [Green Version]
  16. Khan, S.; Hancioglu, A. Multiple Indicator Cluster Surveys: Delivering Robust Data on Children and Women across the Globe. Stud. Fam. Plann. 2019, 50, 279–286. [Google Scholar] [CrossRef] [Green Version]
  17. Al Hilfi, T.K.Y. Toward a Healthier Iraq. Yale J. Biol. Med. 2014, 87, 289–297. [Google Scholar] [PubMed]
  18. Robinson, E.; Lee, L.; Roberts, L.F.; Poelhekke, A.; Charles, X.; Ouabo, A.; Vyncke, J.; Ariti, C.; Gbanzi, M.C.A.; Ouakouma, M.T.; et al. Mortality beyond emergency threshold in a silent crisis—Results from a population-based mortality survey in Ouaka prefecture, Central African Republic, 2020. Confl. Health 2021, 15, 50. [Google Scholar] [CrossRef] [PubMed]
  19. Tinker, A. Women’s health: The unfinished agenda. Int. J. Gynaecol. Obstet. Off. Organ Int. Fed. Gynaecol. Obstet. 2000, 70, 149–158. [Google Scholar] [CrossRef]
  20. Mendenhall, E.; Weaver, L.J. Reorienting women’s health in low- and middle-income countries: The case of depression and Type 2 diabetes. Glob. Health Action 2014, 7, 22803. [Google Scholar] [CrossRef] [Green Version]
  21. Liu, E.; Iwelunmor, J.; Gabagaya, G.; Anyasi, H.; Leyton, A.; Goraleski, K.A.; Wei, S.; del Barrio, M.O.; Olaleye, A.; Launois, P.; et al. Women’s global health leadership in LMICs. Lancet Glob. Health 2019, 7, E1172–E1173. [Google Scholar] [CrossRef] [Green Version]
  22. McDonald, C.R.; Weckman, A.M.; Wright, J.K.; Conroy, A.L.; Kain, K.C. Pregnant Women in Low- and Middle-Income Countries Require a Special Focus During the COVID-19 Pandemic. Front. Glob. Womens Health 2020, 1, 6. [Google Scholar] [CrossRef] [PubMed]
  23. Myers, S.R.; Branas, C.C.; French, B.C.; Nance, M.L.; Kallan, M.J.; Wiebe, D.J.; Carr, B.G. Safety in numbers: Are major cities the safest places in the United States? Ann. Emerg. Med. 2013, 62, 408–418.e3. [Google Scholar] [CrossRef] [Green Version]
  24. Government of Canada, Statistics Canada. Police-Reported Crime in Rural and Urban Areas in the Canadian Provinces, 2017. 2019. Available online: https://www150.statcan.gc.ca/n1/pub/85-002-x/2019001/article/00009-eng.htm (accessed on 23 October 2021).
  25. Helliwell, J.F.; Shiplett, H.; Barrington-Leigh, C.P. How Happy are Your Neighbours? Variation in Life Satisfaction among 1200 Canadian Neighbourhoods and Communities; Working Paper; National Bureau of Economic Research: Cambridge, MA, USA, 2018. [Google Scholar] [CrossRef]
  26. Gruebner, O.; Rapp, M.A.; Adli, M.; Kluge, U.; Galea, S.; Heinz, A. Cities and Mental Health. Dtsch. Ärztebl. Int. 2017, 114, 121. [Google Scholar] [CrossRef] [PubMed] [Green Version]
  27. Blue, I.; Harpham, T. Urbanization and mental health in developing countries. Curr. Issues Public Health 1996, 2, 181–185. [Google Scholar]
  28. Galea, S.; Uddin, M.; Koenen, K. The urban environment and mental disorders. Epigenetics 2011, 6, 400–404. [Google Scholar] [CrossRef] [PubMed] [Green Version]
  29. Cramm, J.M.; Nieboer, A.P. Relationships between frailty, neighborhood security, social cohesion and sense of belonging among community-dwelling older people. Geriatr. Gerontol. Int. 2013, 13, 759–763. [Google Scholar] [CrossRef]
  30. Cramm, J.M.; Nieboer, A.P. Neighborhood attributes security and solidarity promote the well-being of community-dwelling older people in the Netherlands. Geriatr. Gerontol. Int. 2014, 14, 681–688. [Google Scholar] [CrossRef] [PubMed]
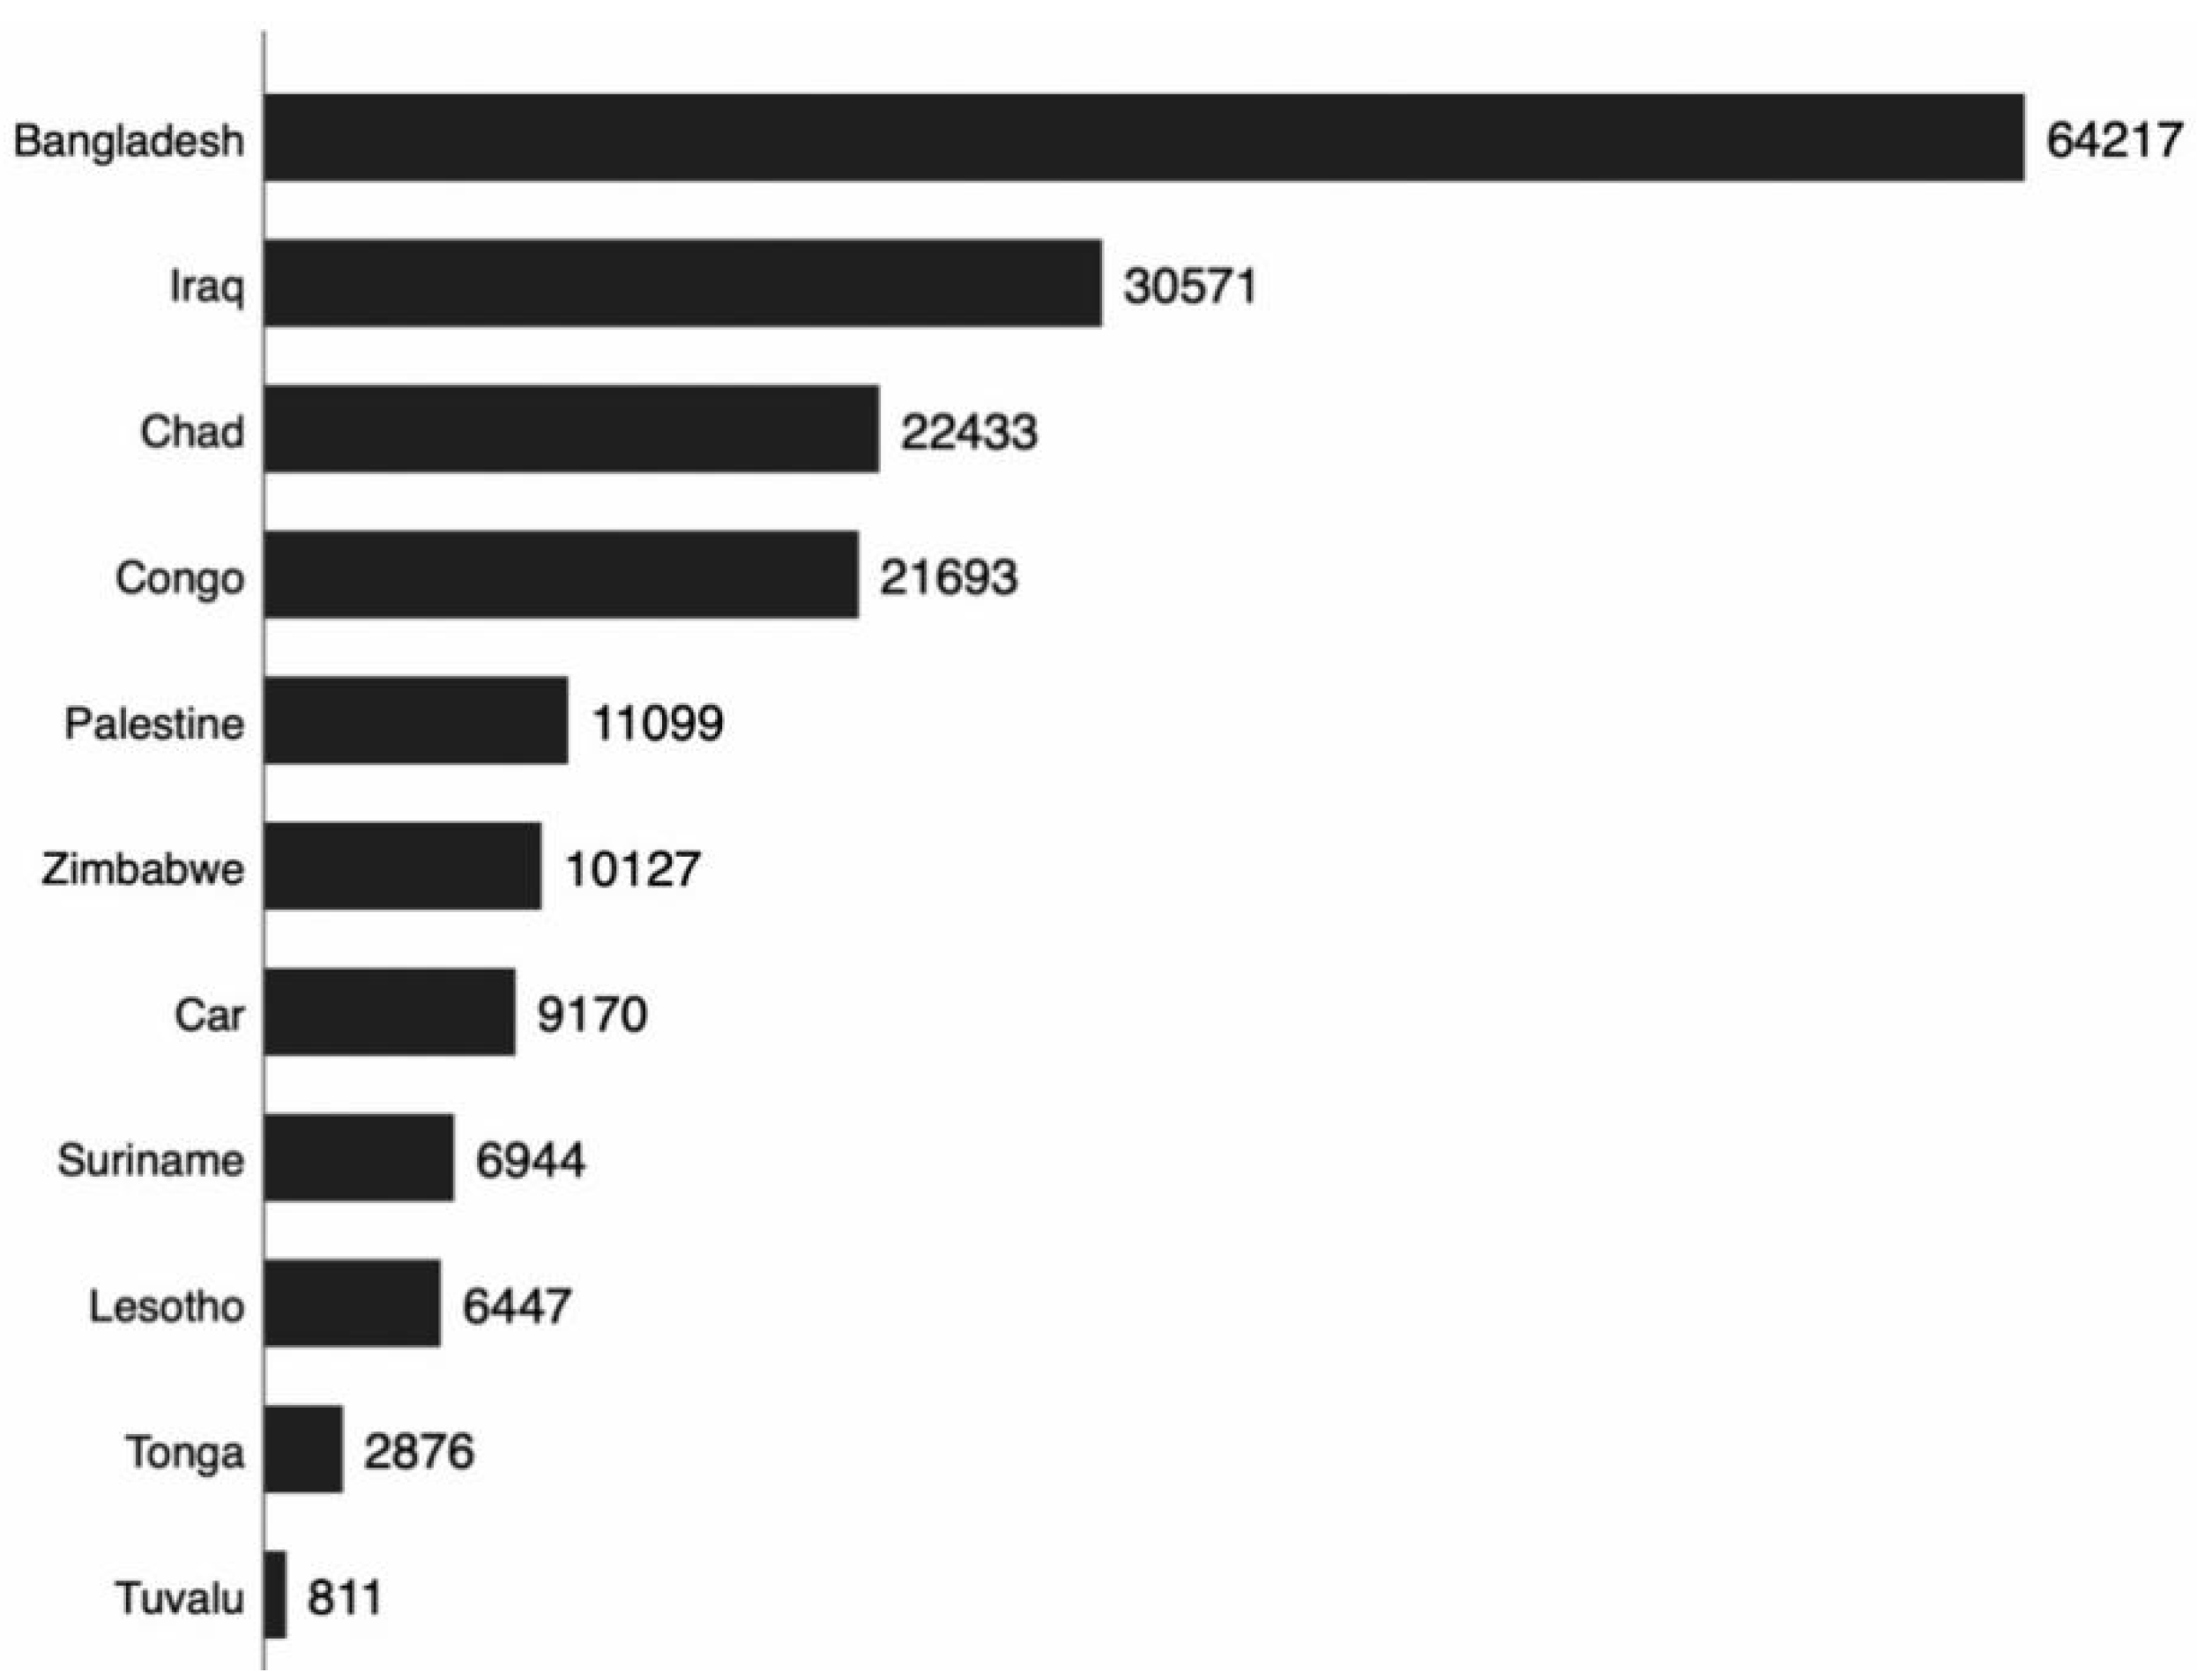
Figure 1. Sample size by country (n = 186,388).
Safety 08 00031 g001
Figure 2. Percentage of reporting neighborhood safety by country.
Safety 08 00031 g002
Figure 3. Percentage of reporting home safety by country.
Safety 08 00031 g003
Figure 4. Correlation among the study variables. −.2 and .14 represent −0.2 and 0.14 respectively.
Safety 08 00031 g004
Table 1. Odds (with 95% CIs) of association between perceived neighborhood safety and self-reported life satisfaction.
Worse vs. ImprovedWorse vs. Same
Full SampleUrbanRuralFull SampleUrbanRural
Neighborhood (Very Unsafe)refrefrefrefrefref
Safe0.950.950.951.071.081.02
[0.89, 1.02][0.89, 1.02][0.89, 1.02][0.99, 1.15][0.99, 1.18][0.92, 1.13]
Unsafe1.37 ***1.25 ***1.46 ***1.21 **1.22 ***1.47 ***
[1.31, 1.43][1.15, 1.35][1.38, 1.55][1.28, 1.46][1.10, 1.37][1.36, 1.60]
Very Unsafe1.43 ***1.32 ***1.49 ***1.57 ***1.38 ***1.66 ***
[1.36, 1.50][1.22, 1.44][1.40, 1.58][1.46, 1.67][1.22, 1.54][1.53, 1.80]
Home (Very safe)refrefrefrefrefref
Safe1.011.001.010.90 ***0.950.87 ***
[0.97, 1.04][0.94, 1.07][0.96, 1.05][0.86, 0.94][0.87, 1.03][0.82, 0.93]
Unsafe1.10 ***1.12 **1.08 *0.950.940.98
[1.04, 1.15][1.04, 1.22][1.01, 1.15][0.89, 1.02][0.84, 1.05][0.90, 1.06]
Very Unsafe1.13 ***1.25 ***1.07 *1.12 ***1.22 ***1.23 **
[1.08, 1.19][1.15, 1.35][1.01, 1.13][1.05, 1.19][1.09, 1.35][1.07, 1.43]
Notes: * p < 0.05, ** p < 0.01, *** p < 0.001. All models are adjusted for country, age, area, marital status, education, household wealth status, child death, and country of residence.
Table 2. Odds (with 95% CIs) of association between perceived neighborhood safety and self-reported happiness.
Unhappy vs. HappyUnhappy vs. Neither
Full SampleUrbanRuralFull SampleUrbanRural
Neighbourhood (Very Unsafe)refrefrefrefrefref
Safe1.12 ***1.20 ***1.08 *1.021.10.98
[1.06, 1.17][1.10, 1.30][1.02, 1.15][0.94, 1.10][0.95, 1.26][0.89, 1.08]
Unsafe1.44 ***1.49 ***1.40 ***1.22 ***1.32 ***1.02
[1.36, 1.52][1.36, 1.64][1.31, 1.50][1.12, 1.33][1.13, 1.53][0.92, 1.13]
Very Unsafe1.16 ***1.29 ***1.10 **1.081.23 **1.17 **
[1.10, 1.22][1.18, 1.41][1.03, 1.18][0.99, 1.18][1.07, 1.43][1.05, 1.29]
Home (Very safe)refrefrefrefrefref
Safe1.28 ***1.27 ***1.28 ***1.36 ***1.30 ***1.39 ***
[1.23, 1.33][1.19, 1.37][1.22, 1.35][1.28, 1.46][1.15, 1.45][1.28, 1.51]
Unsafe1.54 ***1.37 ***1.65 ***1.85 ***1.51 ***2.07 ***
[1.46, 1.62][1.25, 1.50][1.54, 1.76][1.71, 2.01][1.31, 1.74][1.87, 2.29]
Very Unsafe1.65 ***1.55 ***1.71 ***1.88 ***1.63 ***2.01 ***
[1.57, 1.74][1.42, 1.69][1.60, 1.82][1.74, 2.03][1.43, 1.87][1.82, 2.21]
Notes: * p < 0.05, ** p < 0.01, *** p < 0.001. All models are adjusted for country, age, area, marital status, education, household wealth status, child death, and country of residence.
Publisher’s Note: MDPI stays neutral with regard to jurisdictional claims in published maps and institutional affiliations.