1. Introduction
Flame retardants (FRs) are a diverse group of chemicals that are added to manufactured materials, such as plastics, textiles, surface finishes, and coatings. FRs are activated by the presence of an ignition source and are intended to prevent or slow the further development of ignition by a variety of physical and chemical methods [
1]. The parts and components of electric and electronic (E&E) products are generally combustible, and most plastics are not heat resistant and ignite at relatively low temperatures. Plastics containing FRs improve the fire safety of products [
2].
FRs have been reported to be hazardous to human health and the environment. In fact, some of them are banned for production and use. The Restriction of Hazardous Substances (RoHS) Directive has restricted the use of polybrominated diphenyl ethers (PBDEs) in E&E equipment marketed in Europe since 2006. The Waste Electrical and Electronic Equipment (WEEE) Directive was adopted in 2002 along with RoHS, and plastics containing brominated FRs are listed in the annex and specified as components that should be removed from separated WEEE. Consequently, manufacturers have been phasing out the use of PBDEs by switching to polymer-based brominated compounds with a molecular weight of over 1000 [
2] or to phosphorus compounds which are less toxic than PBDEs.
However, the electric circuits in some E&E home appliances have short-circuited, leading to ignition or heat deformation. The cause was probably the deterioration of insulation by a chemical reaction with red phosphorus, which is used as an alternative to brominated FRs [
3]. This chemical alteration reduces the chemical risk but increases the fire risk, thereby presenting a risk trade-off.
Some studies have analyzed the risk trade-off between fires and chemical substances when using and not using FRs. Simonson et al. [
4] reviewed statistical data from Sweden, Germany, and the US on fires caused by televisions (TVs) to estimate the increases in fires and casualties in Europe in the latter half of the 1990s due to TVs after TV manufacturers switched to non-FR casings. In addition, the data were used to conduct a cost–benefit analysis [
5], with the comparative indicator based on monetary willingness to pay. Using FRs reduced the fire risk, saving 1050–1490 million USD a year, but using the FR decabromodiphenyl ether (decaBDE) resulted in a cost increase of 110–393 million USD a year, with its impact on human health not considered. Inoue et al. [
6] estimated the increases or decreases in damage caused by TV fires with or without FRs based on data from Europe [
7], and they reported that 5–63 billion JPY were saved annually in Europe by reducing the fire risk. Moreover, to consider the worst-case scenario for the effects of decaBDE on human health [
8], they referred to toxicity data on more-toxic lower-brominated compounds (e.g., pentabromodiphenyl ether, octabromodiphenyl ether) and polychlorinated biphenyls and concluded that chemical risks would cost an additional 3–12 billion JPY per year. These results indicate that the reduced fire risk more than makes up for the increased chemical risks, thereby validating the merits of using FRs. However, the aforementioned studies used only a natural-science approach to risk quantification, and it is necessary to expand the approach to include social science by considering individual perceptions.
Khan and Morrow [
9] assessed awareness of FR textile products, cost and care practices of FR fabrics, and attitudes toward legislation in a southwestern US city. Crighton et al. [
10] undertook a case study using interviews with new mothers and focus groups regarding exposure to chemicals such as FRs as a public health issue. They reported that environmental risks that originate outside the home were viewed as being less controllable and more threatening than risks in the indoor environment. However, these two studies considered only the chemical risk of FRs to people and the environment.
In the present study, a questionnaire survey was conducted on consumer preference regarding both fire risk and chemical risk focused on FRs in plastic parts of E&E home appliances. The assessment was performed for FRs and home appliances in general rather than on a specific FR material and specific plastic parts and components of products.
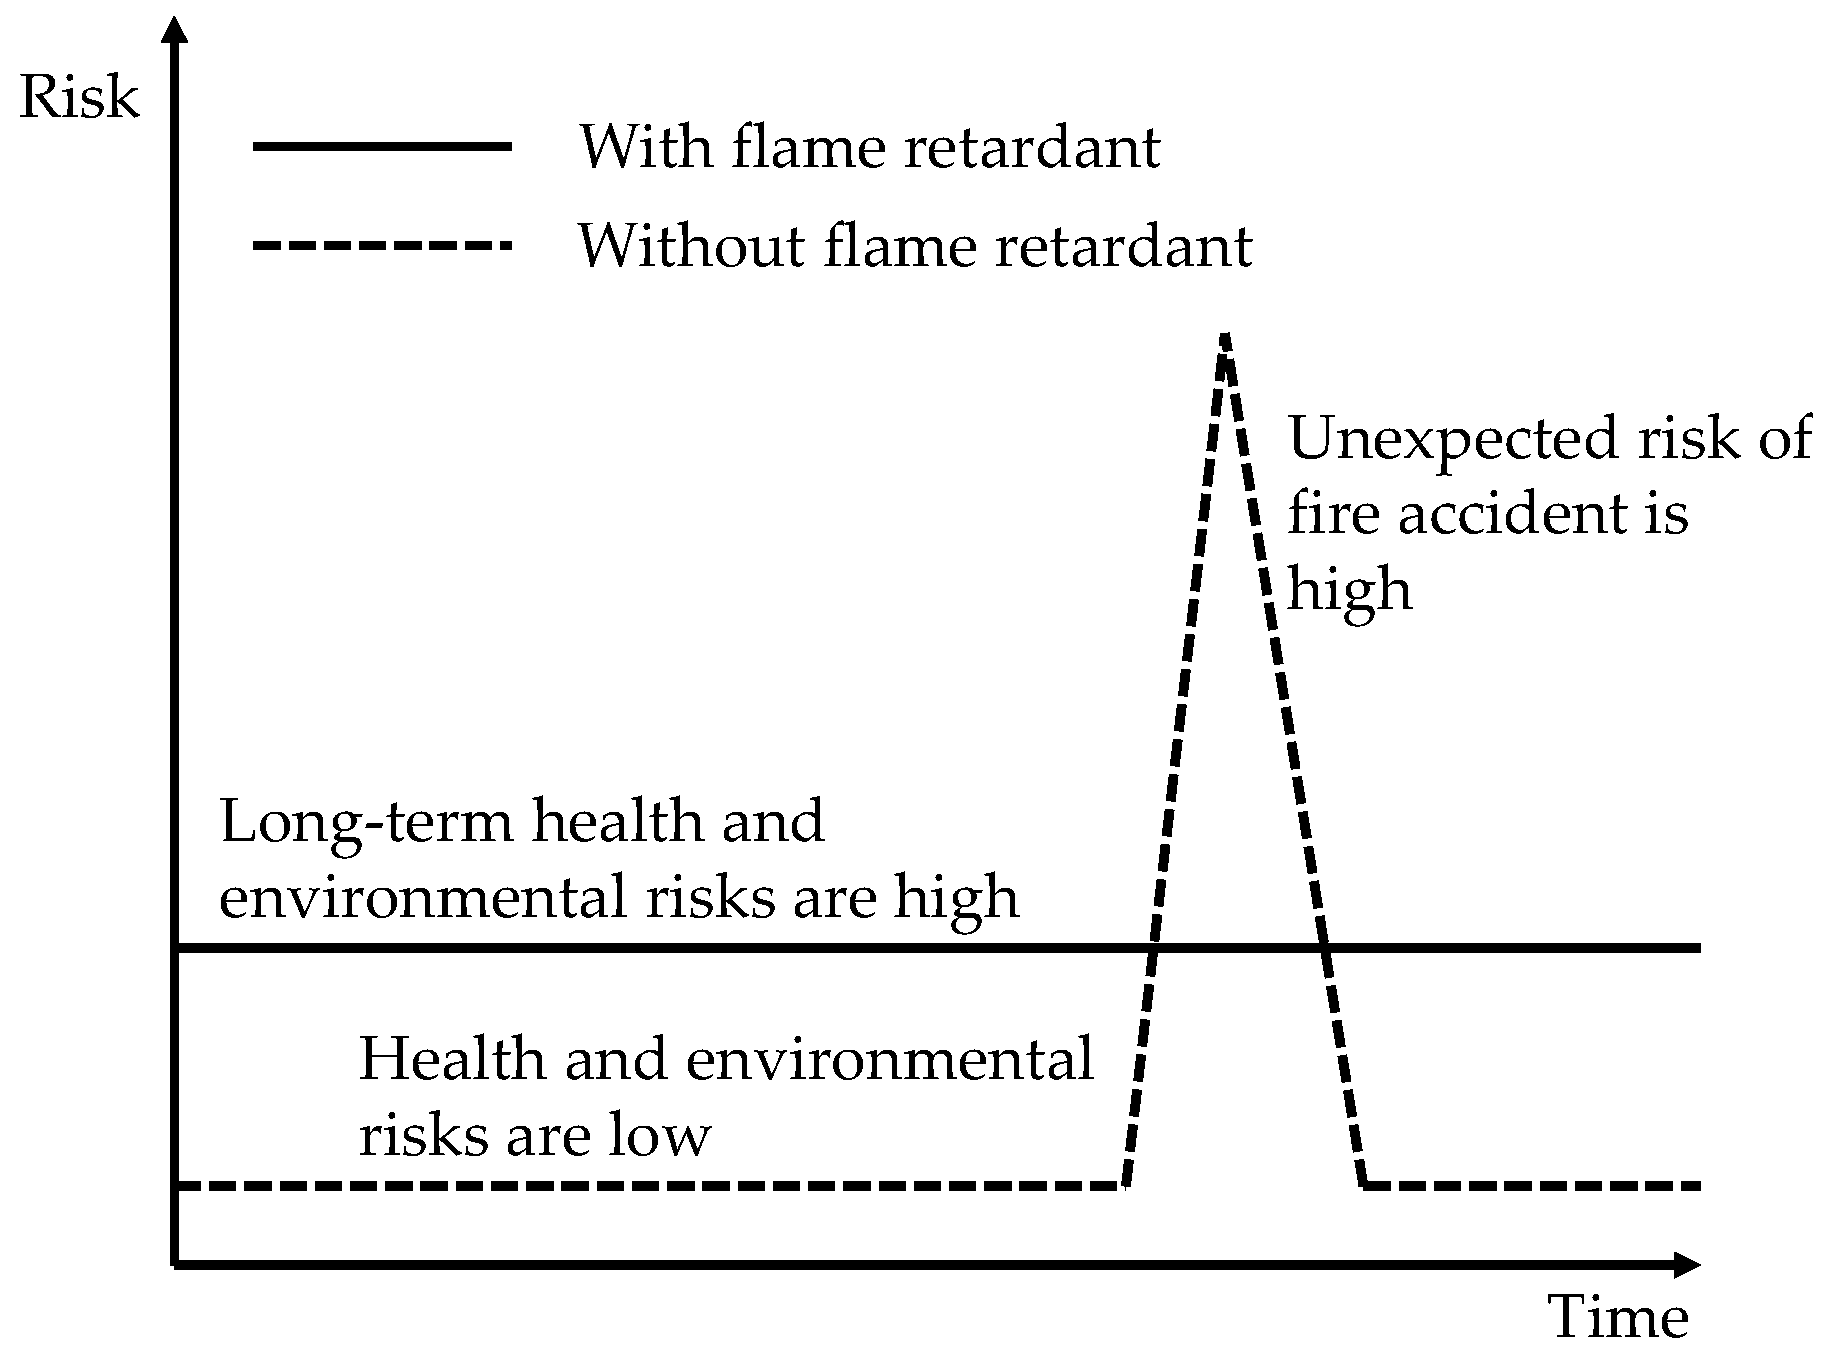
Figure 1 shows a schematic of long- and short-term risks. On the one hand, long-term health and environmental risks are high when using E&E products containing FRs in plastic parts. On the other hand, the unexpected risk of a fire accident is a concern when using products that do not contain FRs, while the health and environmental risks are low. Our focus was on the long-term risks regarding “Health” and “Environment” and the short-term risks regarding “Safety” and “Cost”, and we conducted a comparative evaluation. We also observed the change in risk acceptance by consumers after watching a video describing the effect on fire safety of using FRs. The aim of this study was to construct a framework for qualitative and quantitative evaluation of various effects including consumer preference to help establish safety targets for domestic appliances.
2. Materials and Methods
2.1. Analytic Hierarchy Process
The analytic hierarchy process (AHP) enables decision makers to structure a complex problem in the form of a simple hierarchy and assess a large number of quantitative and qualitative factors systematically [
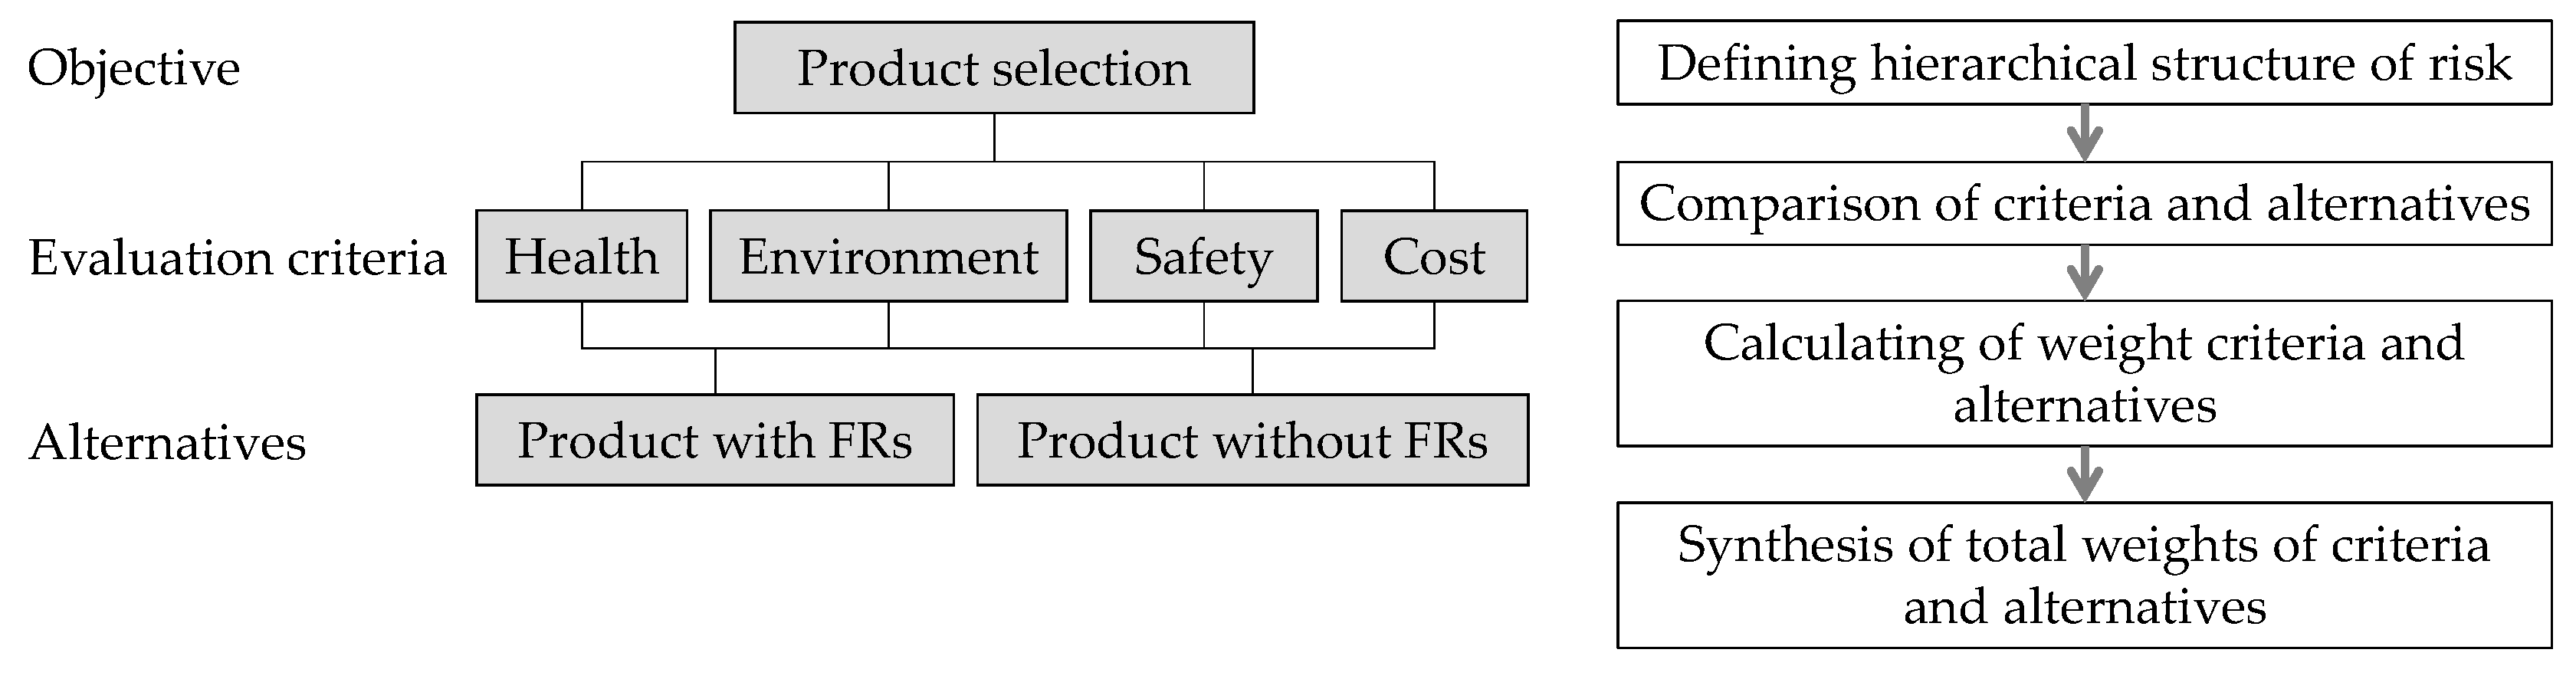
11]. In the AHP, the elements of a problem are distributed in a hierarchical structure from (i) the total objective at the top of the structure, through (ii) criteria and sub-criteria on their respective levels, to (iii) alternatives on the lowest level. The alternatives represent the final result of the analysis, namely, weight values in relation to the set objective.
In this study, we constructed a hierarchical decision-making structure for purchasing E&E products whose plastic parts contain FRs to prevent fire accidents (
Figure 2). We set four risk types as the evaluation criteria and set E&E products with and without FRs as the alternatives.
We applied the AHP as follows. First, the decision makers determine the weight
wj to be given to each criterion
j in making the product selection based on pairwise comparisons of the criteria. In the pairwise comparison method, all pairs of the four evaluation criteria (i.e., “Health”, “Environment”, “Safety”, and “Cost”) were compared, and the weight of priority between the two criteria in a pair was scored on a 4-point Likert scale as 1, 3, 5, or 7 (see
Section 2.3). The total
wj is expressed as
Another task was to determine the weight
aij to be given to each alternative
i with respect to each criterion
j. The alternatives “The products with FR” (
i = 0) and “The products without FR” (
i = 1) were compared in each case, and the preference for product selection was scored on a 4-point Likert scale as 1, 3, 5 or 7 (see
Section 2.3). The total
aij is expressed as
We then synthesized all the priority values to obtain the priority of each element in relation to the objective. The priority
Si of alternative
i is determined as
2.2. Subjects
The survey was conducted on 20–26 March 2018. The respondents were Japanese citizens (age 18–69) living in every region of Japan who registered as survey panelists for Intage Research Inc. (Tokyo, Japan), a Japanese marketing research company. As of September 2017, Intage Research Inc. had 450,000 panelists, all of whom were covered by the prescribed “Information security management systems—Requirements (ISO/IEC27001:2013).” Intage Research Inc. removed all individual information from the dataset that we used in the analysis. All subjects gave their informed consent for inclusion before they participated in the survey. The survey was conducted in accordance with the Declaration of Helsinki, and the protocol was approved by the Safety Management Division in the National Institute of Advanced Industrial Science and Technology.
An internet survey was conducted with a sample of 1420 consumers to investigate their perceptions of the risk of FRs used in plastic parts of E&E home appliances before and after watching a video made by the Bromine Science and Environmental Forum [
12]. This video shows a test of burning TV sets, demonstrating the need for high fire safety standards and the level of fire protection that FR materials can provide when they are added to consumer electronics. The video shows two TV sets (same model and brand) with/without FRs and exposed to an ignition source undergoing attempted ignition. The TV without FRs is exposed to a small open flame for just 60 s, and within 2–3 min the TV is engulfed in flames. However, even after being exposed to a larger flame, the TV with FRs fails to ignite.
We excluded the 101 subjects who gave all their weighted responses as “intermediate” because those subjects were considered to have answered the questionnaire inappropriately. The final number of subjects was 1319. The mean time to complete the questionnaire survey was 15 min 31 s including the video streaming for 2 min 44 s.
Table 1 lists the subjects’ attributes. The subjects were asked questions regarding their sex, age, region of residence, household annual income, housing type (detached or multi-family), number of children (under 18 years old) residing with them, and educational attainment.
2.3. Questionnaire
A 21-item questionnaire was used to investigate several topics, consisting of knowledge about FRs (Q1–3), the subject’s weighting of the factors of health, environment, safety, and cost (Q4–9), product selection (Q10–13), risk preference (Q14–15), personal attributes (Q16–20), and ownership status of electrical products (Q21). The subjects watched the video showing the effect of FRs after Q13, and they then responded to Q4–13 again.
We provided the subjects with a series of questions (Q1–3) about their knowledge of FRs using a 4-point Likert scale (4: strongly agree; 3: agree; 2: disagree; 1: strongly disagree). We also provided the subjects with a series of questions (Q14–15) about their risk preference using the same 4-point Likert scale.
Questions 4–9 explored consumers’ individual preference regarding one evaluation criterion compared with another in the hierarchy. The evaluation criteria were explained as shown in
Table 2. The numerical scales were attributed by making pairwise comparisons among evaluation criteria as 1 (both criteria are equally important), 3 (one criterion is slightly more important that the other), 5 (one criterion is much more important than the other), and 7 (one criterion is absolutely more important than the other). Questions 10–13 explored consumers’ individual preference regarding an E&E product with FR compared with another product without FR. The E&E products were explained as shown in
Table 3. The numerical scales were attributed by making pairwise comparisons among products as 1, 3, 5, or 7, which have the same meanings as in Q4–9.
The weight wj of each evaluation criterion j, the weight aij of each product alternative i regarding each criterion j, and the priority Si of product alternative i were compared before and after watching the video.
3. Results
3.1. Weights of Evaluation Criteria
The weight
wj of each criterion
j in making the product selection by the AHP is shown in
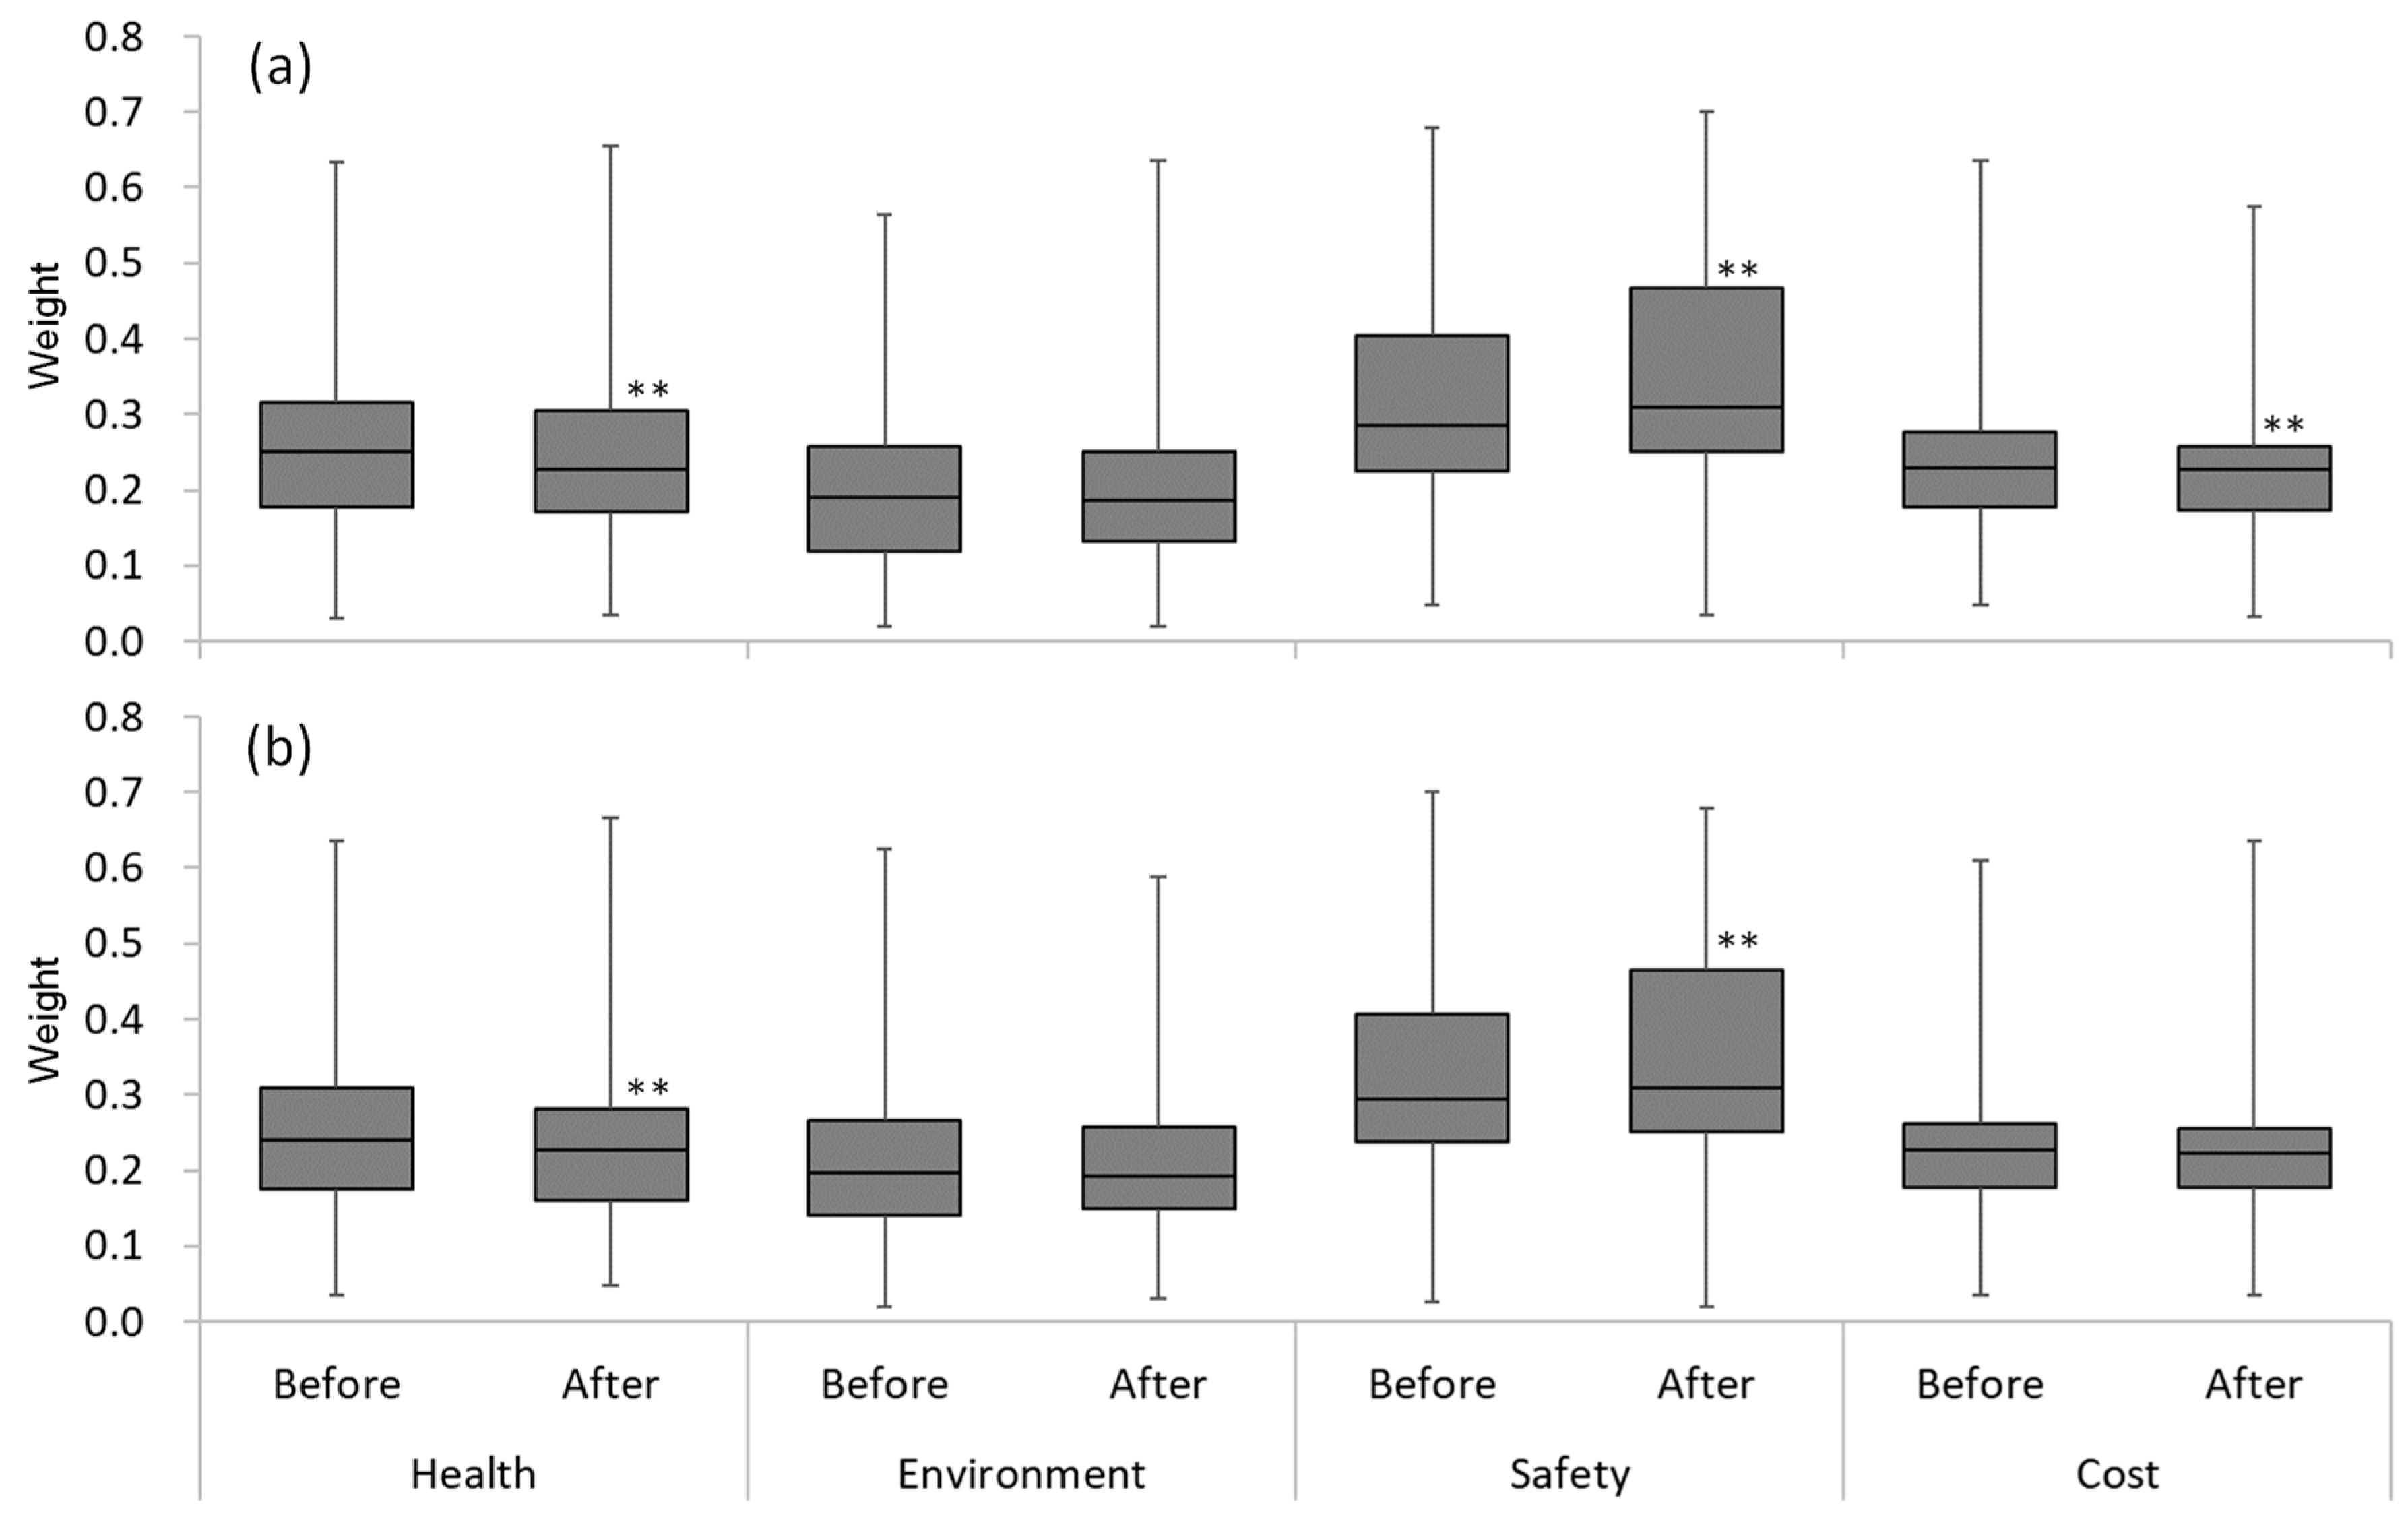
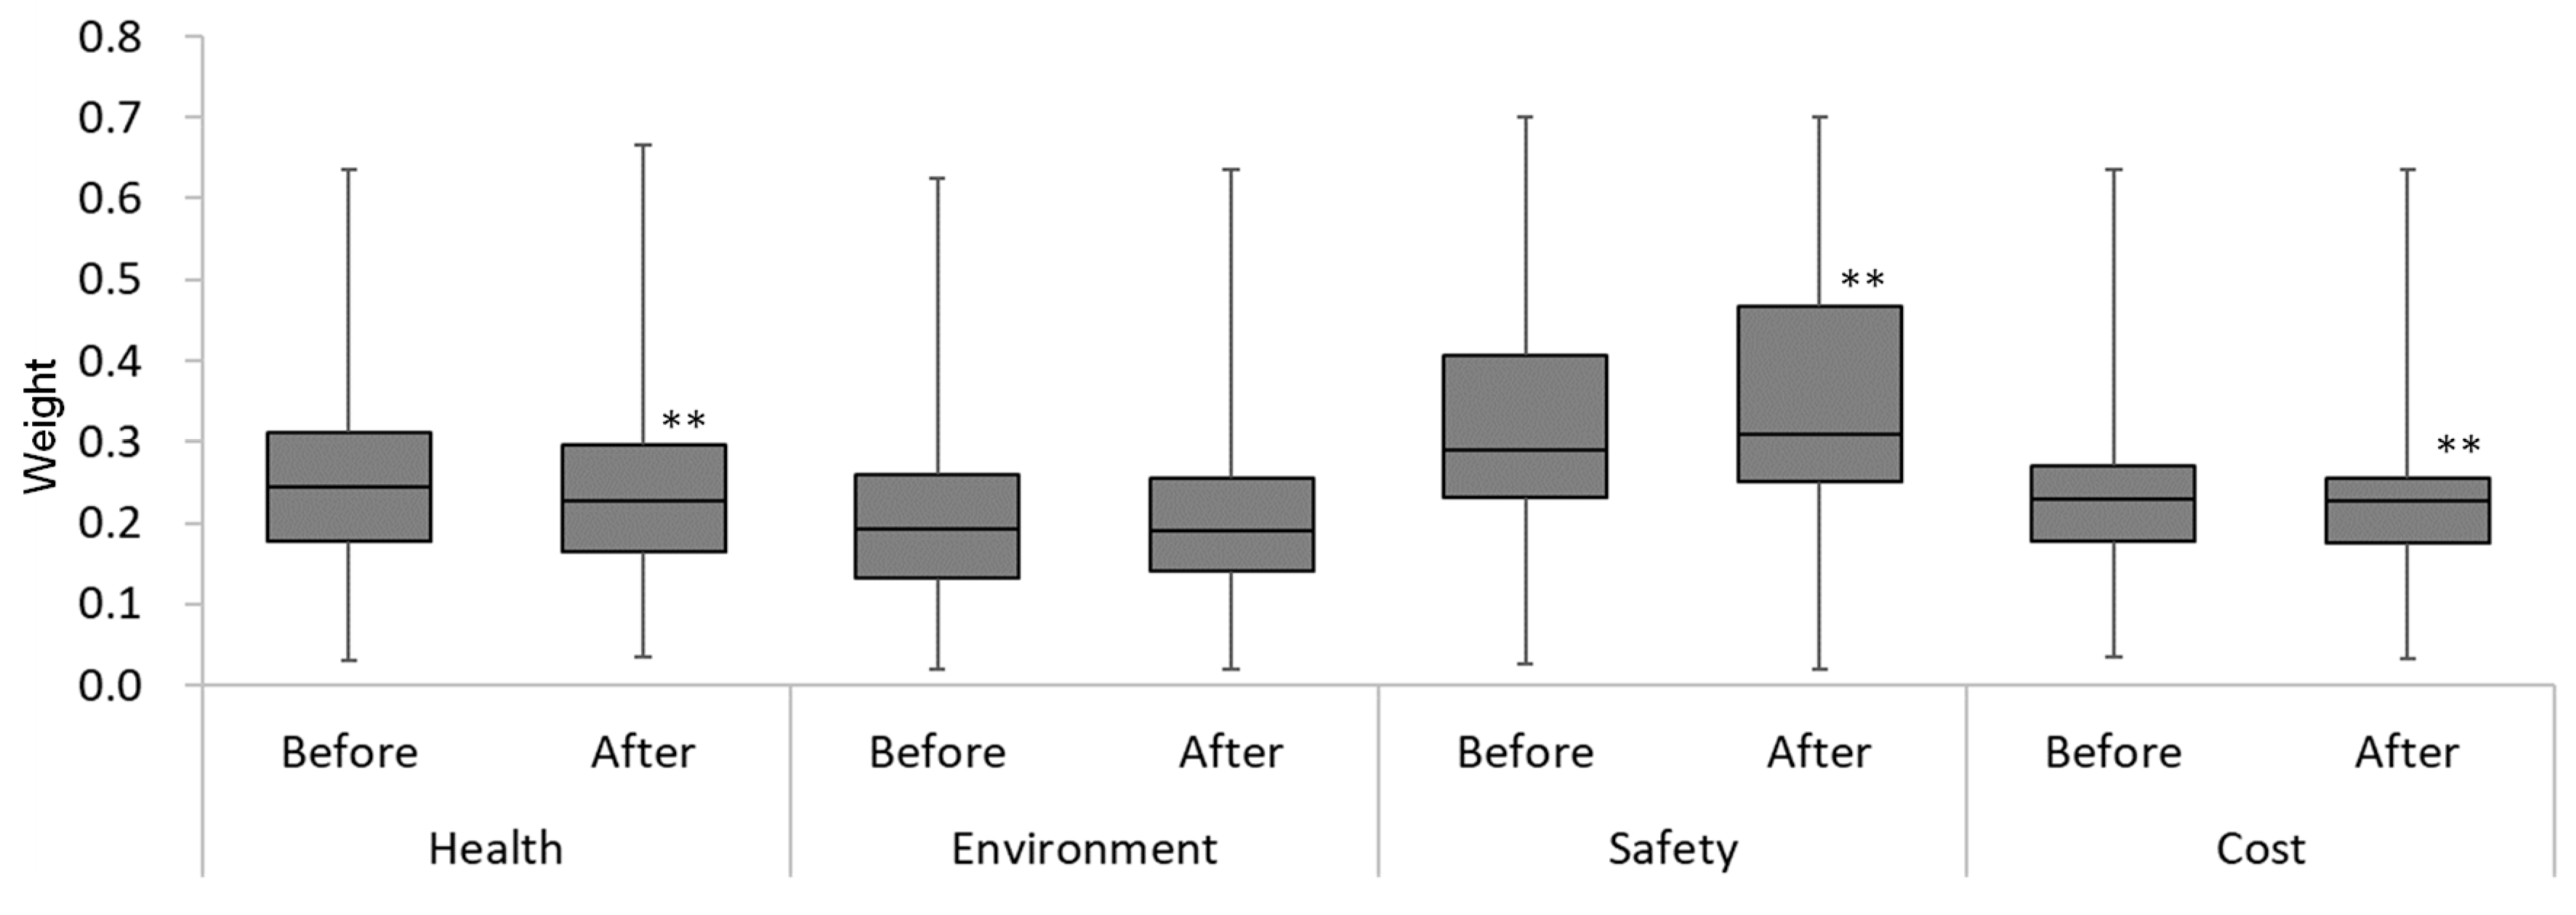
Figure 3. Before watching the video, “Safety” was perceived as the most important criterion, followed by “Health”, “Cost”, and “Environment” in that order. After watching the video, the weight of “Safety” increased and those of “Health” and “Cost” decreased.
The changes in the weights of the evaluation criteria after watching the video were almost the same for all subjects irrespective of knowledge about FRs and personal attributes. The weight for “Cost” allocated by male subjects decreased after watching the video (
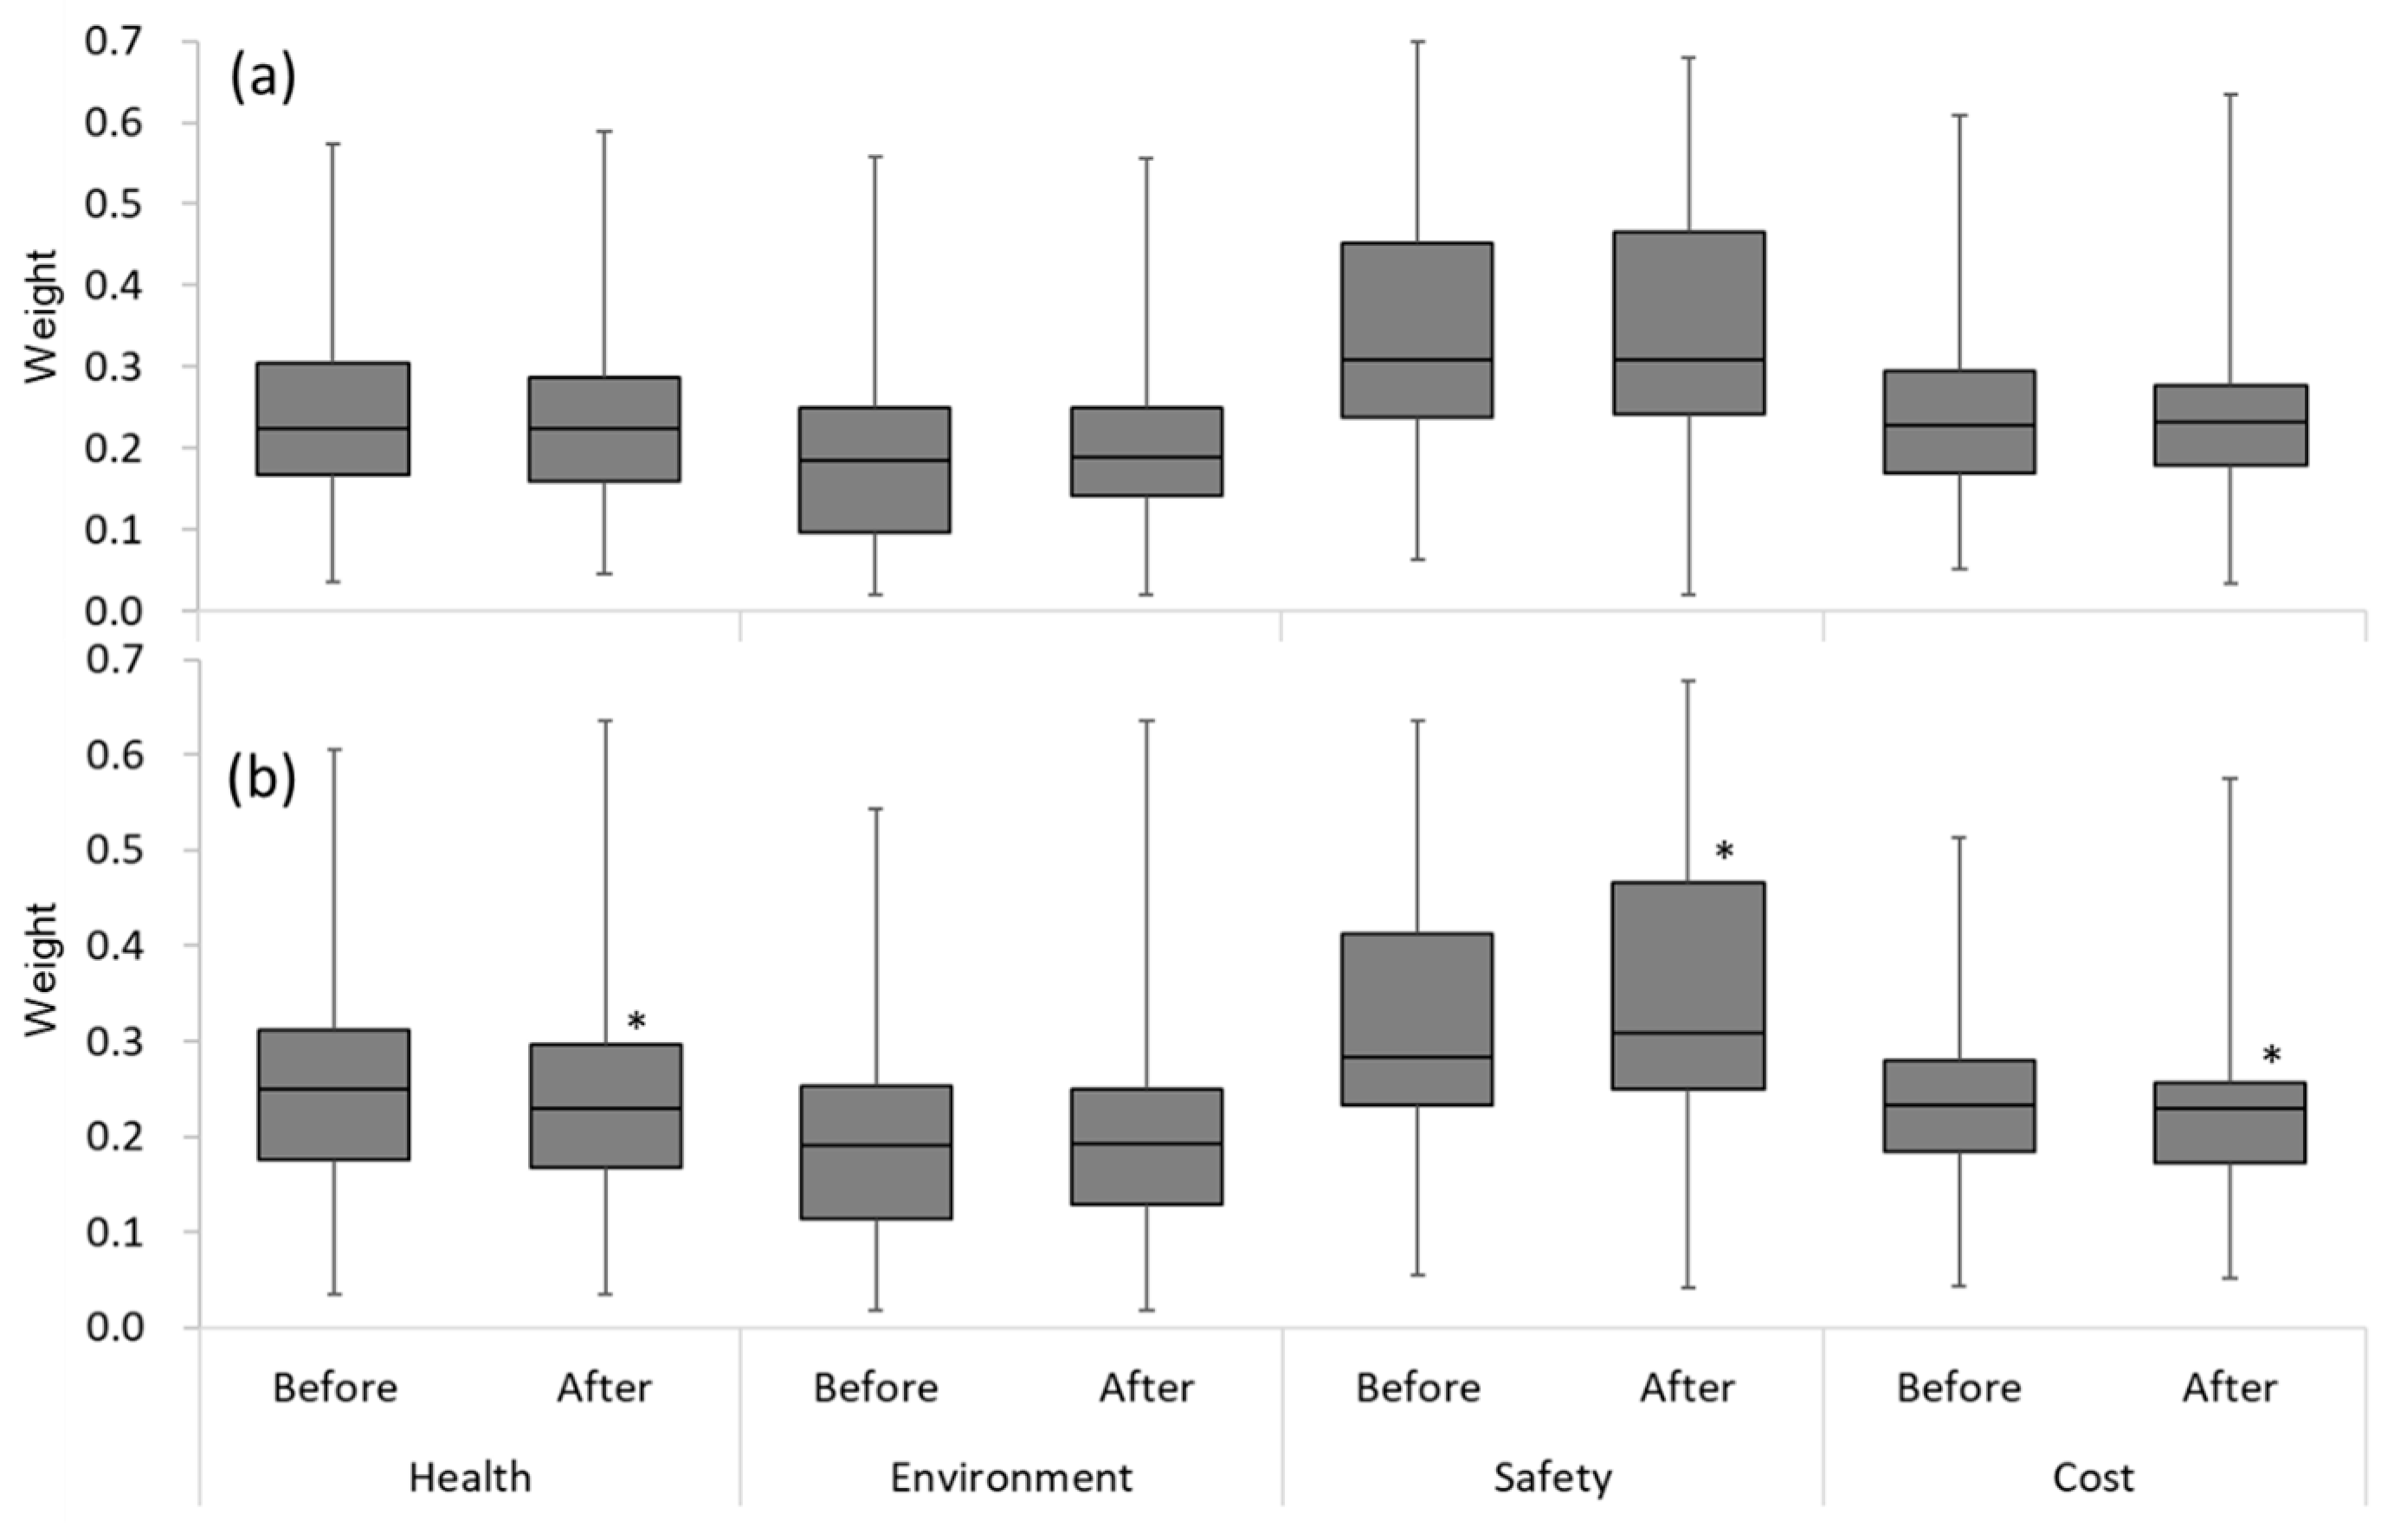
Figure 4). However, no significant difference after watching the video was observed in subjects younger than 30 years old (
Figure 5). The video may not have affected those subjects because younger people are accustomed to watching many videos on their personal computers, smartphones, and other devices.
3.2. Weights of Product Alternatives
The weight
aij of each product alternative
i regarding each criterion
j is shown in
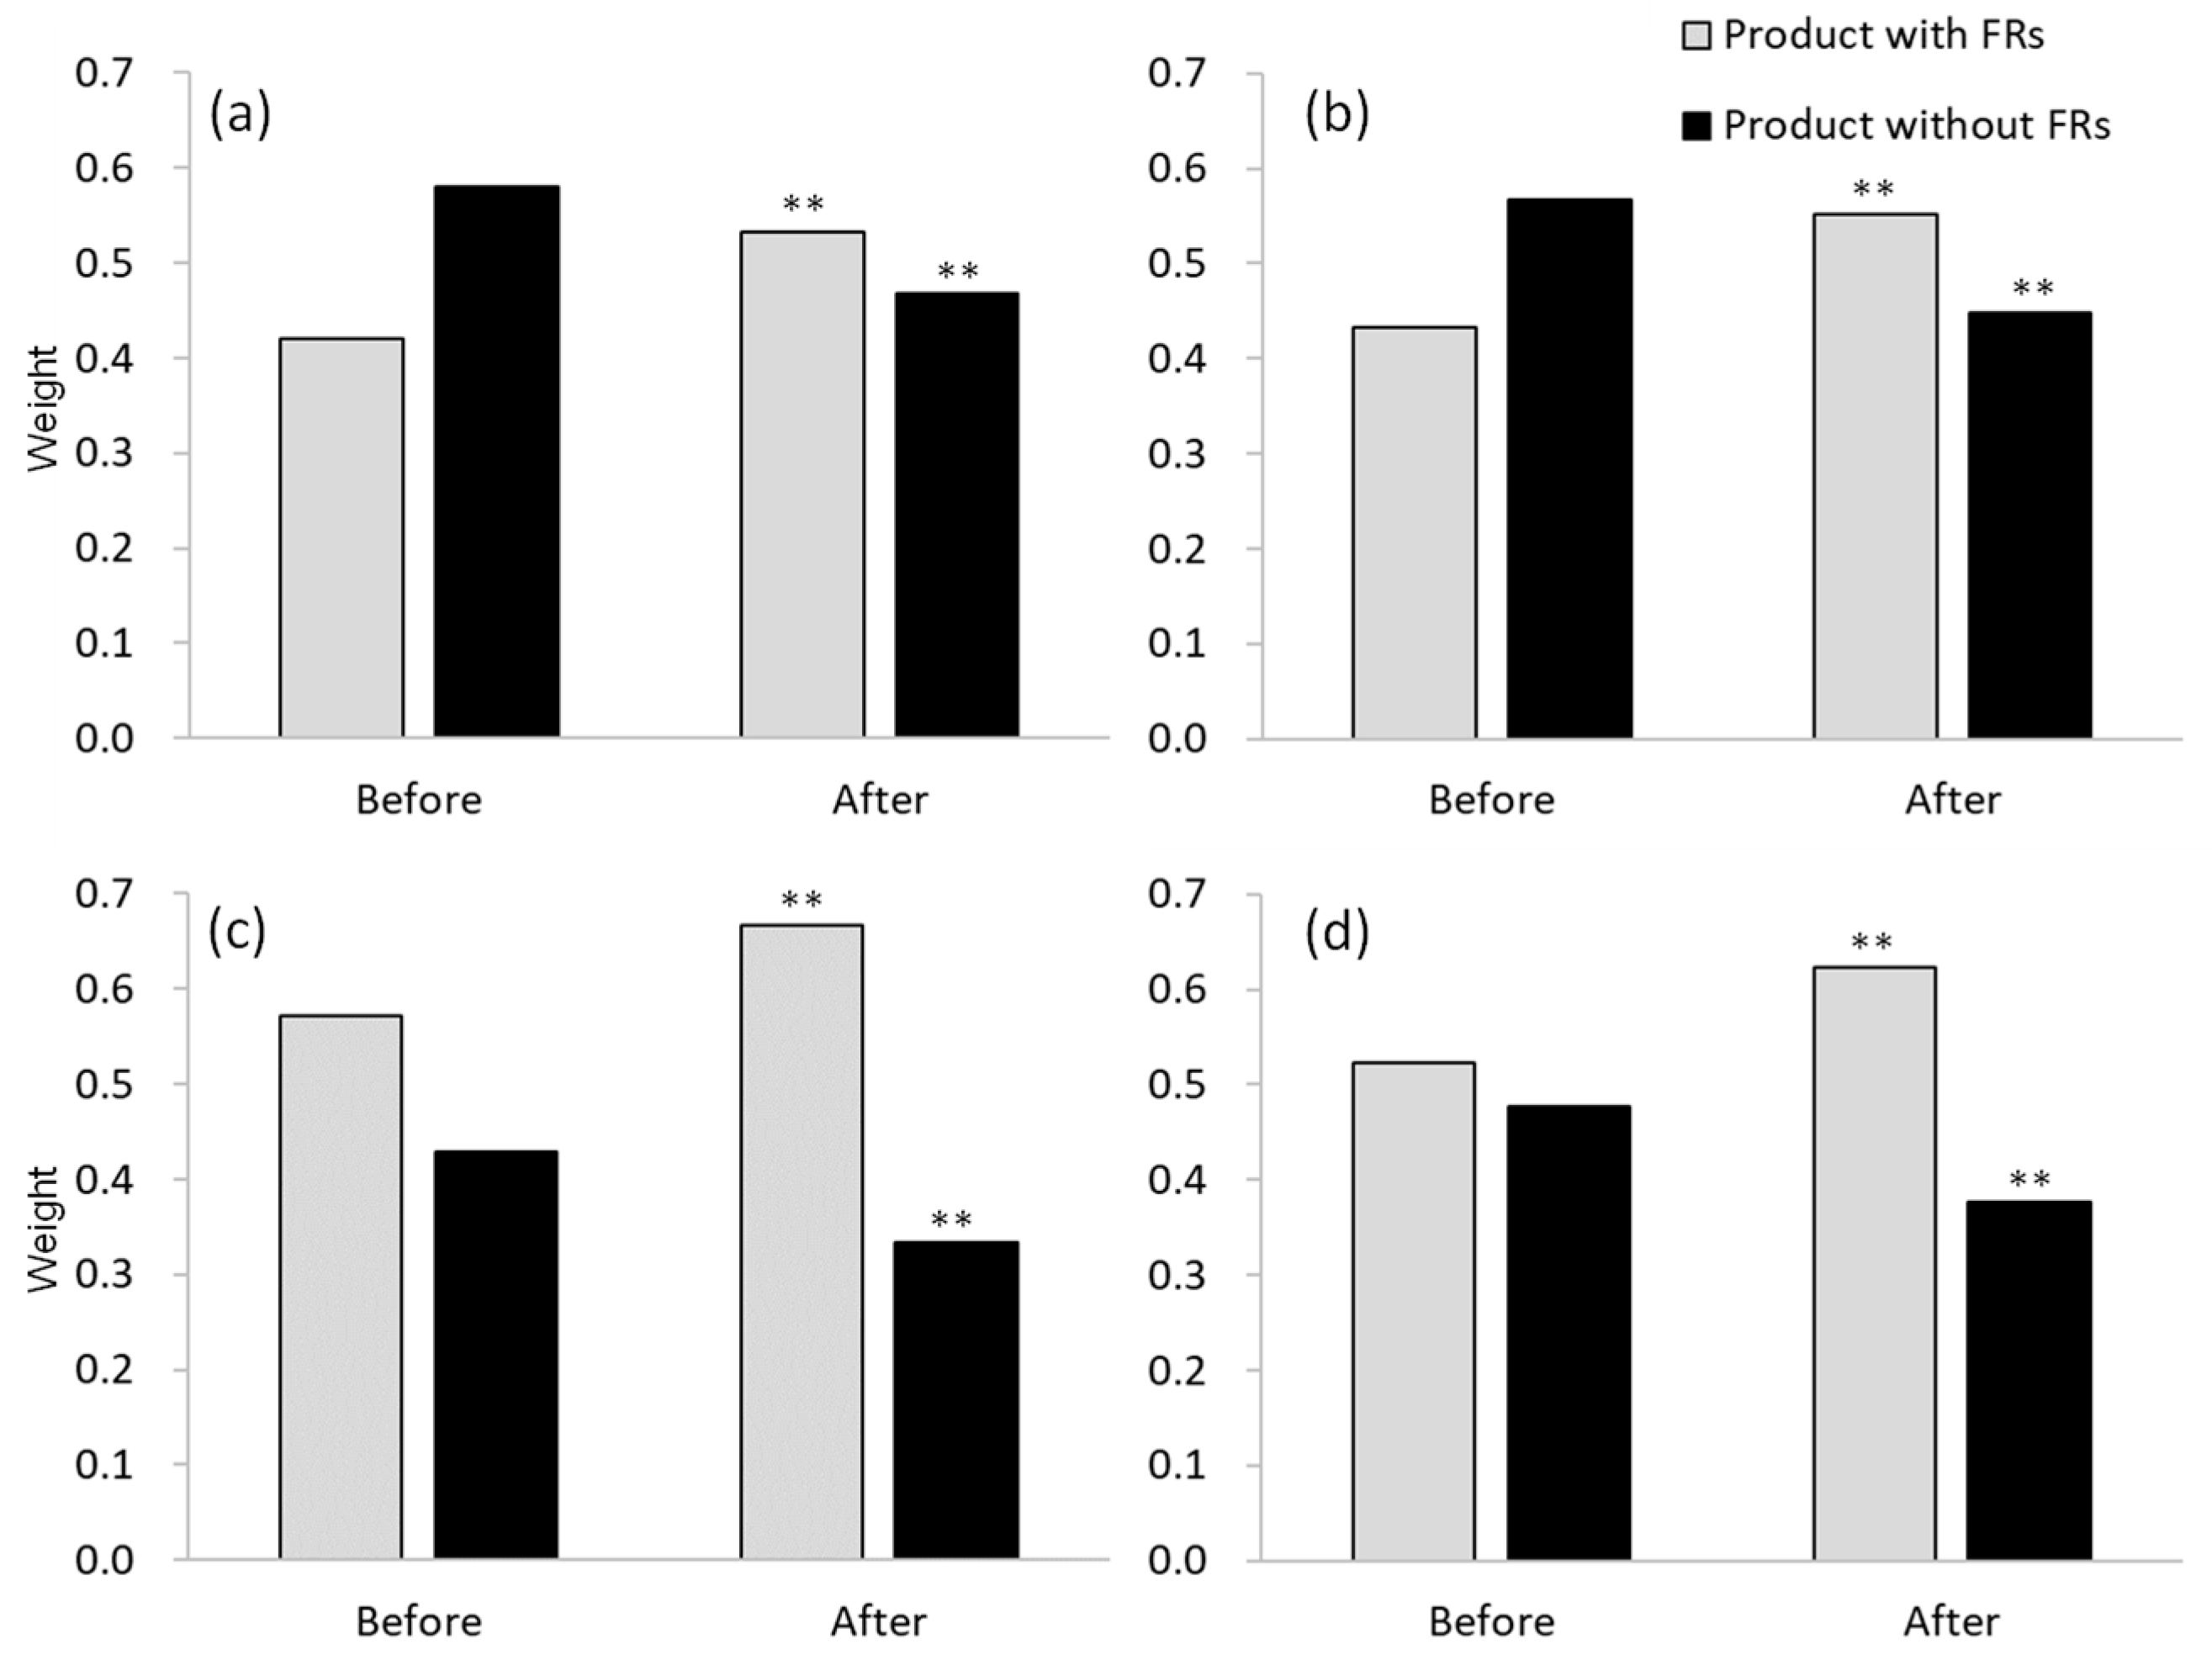
Figure 6. Significant differences in the weights of the product alternatives by evaluation criteria were observed from before to after watching the video, with the criteria of “Health”, “Safety”, and “The product without FRs” being perceived as more significant than “The product with FRs” before watching the video. However, the weights between the two product alternatives were reversed after watching the video.
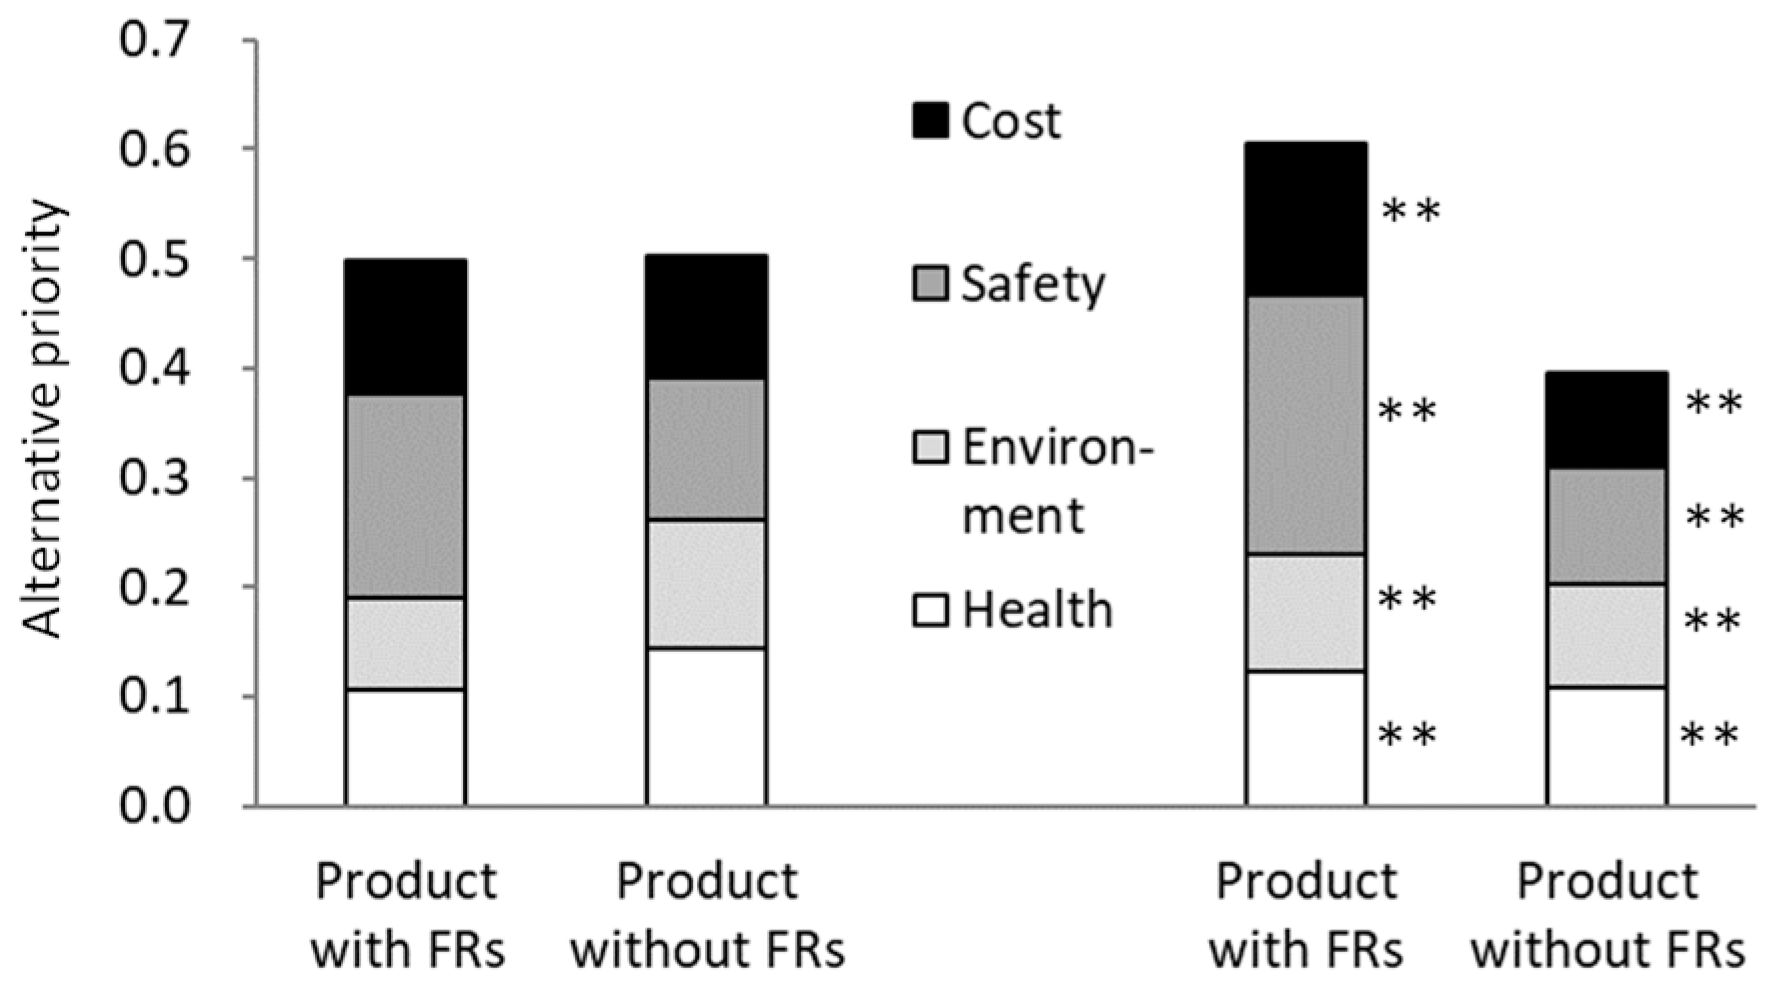
The priority
Si of product alternative
i is shown in
Figure 7. Before watching the video, “The product without FRs” was perceived as being slightly more important than “The product with FRs.” The subjects who selected “The product with FRs” with high priority perceived “Safety” as being the most important criterion, and the subjects who selected “The product without FRs” with high priority perceived “Health” and “Environment” as being the most important criteria. After watching the video, the importance of “The product with FRs” increased.
4. Discussion
Factor analysis was conducted to extract factors based on the datasets for the risk acceptance scale (Q14, see
Table 4) and risk-avoidance orientation (Q15, see
Table 5) because psychological factors would have affected the questionnaire results. The maximum-likelihood procedure was used, followed by the promax rotation. We extracted factors with an eigenvalue of more than one, and we estimated the factor scores using the regression method. Items of lower communalities (
h2 < 0.3) were deleted after obtaining the eigenvalues, and then factor analysis was repeated.
The results of factor analysis for risk acceptance and risk-avoidance orientation are given in
Table 4 and
Table 5, respectively. Both of the factor analyses showed Kaiser–Meyer–Olkin (KMO) values of 0.81 in terms of sampling adequacy and
p < 0.001 (Bartlett’s test) for exhibiting reliable estimates. Factor loadings are equivalent to the strength of the correlations between a factor and the variables that contributed to that factor [
13].
Four factors, namely, “Challenging”, “Cautious”, “Balance” and “Reckless”, were extracted for risk acceptance (
Table 4). Two factors, namely, “Fear of rare accidents” and “Fear of frequent accidents or worry about health” were extracted for risk-avoidance orientation (
Table 5). We conducted a
t-test of the priorities of product alternatives for subjects grouped according to risk acceptance and risk-avoidance orientation. Some of the results are shown in
Figure 8. The priority of product alternatives between before and after watching the video tended to almost be the same among the groups based on risk acceptance and risk-avoidance orientation. However, some significant differences can be observed between the upper and lower groups of factors.
5. Conclusions
In this study, we constructed a framework of qualitative and quantitative evaluation of various effects including consumer preference to help establish safety targets for domestic appliances. A questionnaire survey was conducted to explore consumer preference between fire risk and chemical risk, with a focus on using or not using FRs in plastic parts of E&E home appliances. An AHP method was used to evaluate the change in risk acceptance of consumers before and after watching a video describing the effect of FR.
From the results, the degree of each consumer’s preference for “Safety” was the highest before watching the video, and that degree increased after watching the video whereas those for “Health” and “Environment” decreased. Thus, the subjects gave higher priority to short-term risk than to long-term risk.
The degrees of consumer preference for “The product with FRs” and “The product without FRs” were almost the same before watching the video, but the preference for “The product with FRs” increased after watching the video. The tendency of the weights of the evaluation criteria from before to after watching the video was almost the same regardless of knowledge of FRs and personal attributes.
Factor analysis was conducted to extract factors based on risk acceptance and risk-avoidance orientation. The t-test was used to compare the priorities of product alternatives for subjects grouped according to risk acceptance and risk-avoidance orientation because we considered that psychological factors would have affected the questionnaire results. However, the tendency of the priorities of product alternatives from before to after watching the video was almost the same for subjects grouped according to risk acceptance and risk-avoidance orientation.
In conclusion, this study has revealed that consumers generally give greater consideration to sudden risks such as fire accidents, but do not proactively choose products that contain FRs to prevent such accidents because they have little knowledge of FRs. This is the first study to show that watching a video improves consumers’ understanding of how FRs affect fire safety and changes consumer preferences in selecting products. This study has also shown that a video about generally unfamiliar materials such as FRs is an effective means of risk communication with consumers.
This work has some limitations. Our original intention was to examine the influence of specific health and environmental effects on consumer preferences regarding several kinds of FRs. However, we had to ensure that subjects could understand the questionnaire easily and quickly, so such details were omitted. In addition, the degree of influence of health and the environment and the degree of influence of fire safety and cost could not be shown quantitatively because this survey was performed for FRs in general rather than for a specific FR material. Therefore, the explanation of the evaluation criteria became qualitative, and it might have been difficult for subjects to weight these criteria in the AHP.
In future work, we intend to conduct a questionnaire survey using a video that describes the toxicity of some FRs, and we will analyze the difference in risk acceptance before and after viewing conflicting claims in videos. We also intend to examine the use of videos for risk communication with consumers about the safety of E&E products.
Author Contributions
Conceptualization, K.T.; methodology, K.T.; software, A.K. and K.O.; validation, A.K. and K.O.; formal analysis, K.T. and A.K.; investigation, K.T. and A.K.; resources, K.T.; data curation, A.K.; writing—original draft preparation, K.T.; writing—review and editing, K.O.; visualization, K.T.; supervision, K.T.; project administration, K.T..; funding acquisition, K.T.
Funding
This work was supported by the Research Institute of Science for Safety and Sustainability in the National Institute of Advanced Industrial Science and Technology.
Conflicts of Interest
The authors declare no conflict of interest.
References
- Hofland, W.; Dijkman, M.C.T.H. Fire hazard vs. risk of chemical substances. J. Risk Res. 2016, 19, 1071–1077. [Google Scholar] [CrossRef]
- Kamibayashiyama, H. Flame retardants. In Introduction to Flame Retardancy Science Guidebook: Protect Your Life and Property from Fire; Kitano, M., Ed.; Chemical Daily Co.: Tokyo, Japan, 2016; pp. 1–27. English version published by BSEF—The International Bromine Council, 2017; pp. 13–30. (In Japanese) [Google Scholar]
- National Institute of Technology and Evaluation A Technique for Highly Flame-Retardant and an Accident Case by Flame Retardant Substance. Available online: https://www.nite.go.jp/data/000088111.pdf (accessed on 28 May 2019). (In Japanese)
- Simonson, S.; Andersson, P.; Berg, M. Cost Benefit Analysis Model for Fire Safety, Methodology and TV (decaBDE) Case Study; SP Swedish National Testing and Research Institute: Borås, Sweden, 2006; pp. 1–65. [Google Scholar]
- Inoue, T.; Masunaga, S.; Ohtani, H. Evaluation of the risk trade-off concerning brominated flame retardants in EU—Phase out of deca-BDE and increase of TV fires-. Organohalogen Compd. 2009, 71, 1875–1880. [Google Scholar]
- Inoue, T.; Managaki, S.; Masunaga, S. Determination of chemical substance benefits—Fire risk and human health risk of brominated flame retardants. Chem. Eng. 2010, 55, 8–13. (In Japanese) [Google Scholar]
- Clarke, F. The life safety benefits of brominated flame retardants in the United States. In Final Report to the Chemical Manufacturers Association Brominated Flame Retardant Industry Panel; Benjamin/Clarke Associates: Arlington, VA, USA, 1997. [Google Scholar]
- Washington State. Polybrominated Diphenyl Ether (PBDE) Chemical Action Plan: Final Plan. 2006. Available online: http://www.ecy.wa.gov/pubs/0507048.pdf (accessed on 9 May 2010).
- Khan, S.; Morrow, C.H. Consumer awareness and acceptance of flame retardant textile products and flammability legislation. J. Consum. Stud. 1983, 7, 137–146. [Google Scholar] [CrossRef]
- Crighton, E.J.; Brown, C.; Baxter, J.; Lemyre, L.; Masuda, J.R.; Ursitti, F. Perceptions and experiences of environmental health risks among new mothers: A qualitative study in Ontario, Canada. HealthRisk Soc. 2013, 15, 295–312. [Google Scholar] [CrossRef] [PubMed]
- Radivojević, G.; Gajović, V. Supply chain risk modeling by AHP and Fuzzy AHP methods. J. Risk Res. 2014, 17, 337–352. [Google Scholar] [CrossRef]
- The International Bromine Council. BSEF Television Fire Safety. Available online: http://www.bsef-japan.com/index/ (accessed on 28 May 2019).
- Slovic, P. Perception of Risk. Science 1987, 236, 280–285. [Google Scholar] [CrossRef] [PubMed]
Figure 1.
Long- and short-term risks.
Figure 1.
Long- and short-term risks.
Figure 2.
Hierarchical structure of AHP for product selection (left) and process flow to determine weightings using AHP (right).
Figure 2.
Hierarchical structure of AHP for product selection (left) and process flow to determine weightings using AHP (right).
Figure 3.
Weights of evaluation criteria (left: before watching video; right: after watching video). Two-sided test, alternative hypothesis: “before watching video” ≠ “after watching video”, ** p < 0.01. In the box plots, the boundary of the box closest to zero indicates the 25th percentile, the black line within the box marks the median, and the boundary of the box farthest from zero indicates the 75th percentile. Whiskers above and below the box indicate the 95th and 5th percentiles, respectively.
Figure 4.
Weights of evaluation criteria by sex: (a) men; (b) women (left: before watching video; right: after watching video). Two-sided test, alternative hypothesis: “before watching video” ≠ “after watching video”, ** p < 0.01. In the box plots, the boundary of the box closest to zero indicates the 25th percentile, the black line within the box marks the median, and the boundary of the box farthest from zero indicates the 75th percentile. Whiskers above and below the box indicate the 95th and 5th percentiles, respectively.
Figure 5.
Weights of evaluation criteria by age group: (a) 18–29 years; (b) 30–39 years (left: before watching video; right: after watching video). Two-sided test, alternative hypothesis: “before watching video” ≠ “after watching video”, * p < 0.05. In the box plots, the boundary of the box closest to zero indicates the 25th percentile, the black line within the box marks the median, and the boundary of the box farthest from zero indicates the 75th percentile. Whiskers above and below the box indicate the 95th and 5th percentiles, respectively.
Figure 6.
Weights of product alternatives by evaluation criteria: (a) Health; (b) Environment; (c) Safety; (d) Cost (left: before watching video; right: after watching video). Two-sided test, alternative hypothesis: “before watching video” ≠ “after watching video”, ** p < 0.01.
Figure 6.
Weights of product alternatives by evaluation criteria: (a) Health; (b) Environment; (c) Safety; (d) Cost (left: before watching video; right: after watching video). Two-sided test, alternative hypothesis: “before watching video” ≠ “after watching video”, ** p < 0.01.
Figure 7.
Priorities of product alternatives (left: before watching video; right: after watching video). Two-sided test, alternative hypothesis: “before watching video” ≠ “after watching video”, ** p < 0.01.
Figure 7.
Priorities of product alternatives (left: before watching video; right: after watching video). Two-sided test, alternative hypothesis: “before watching video” ≠ “after watching video”, ** p < 0.01.
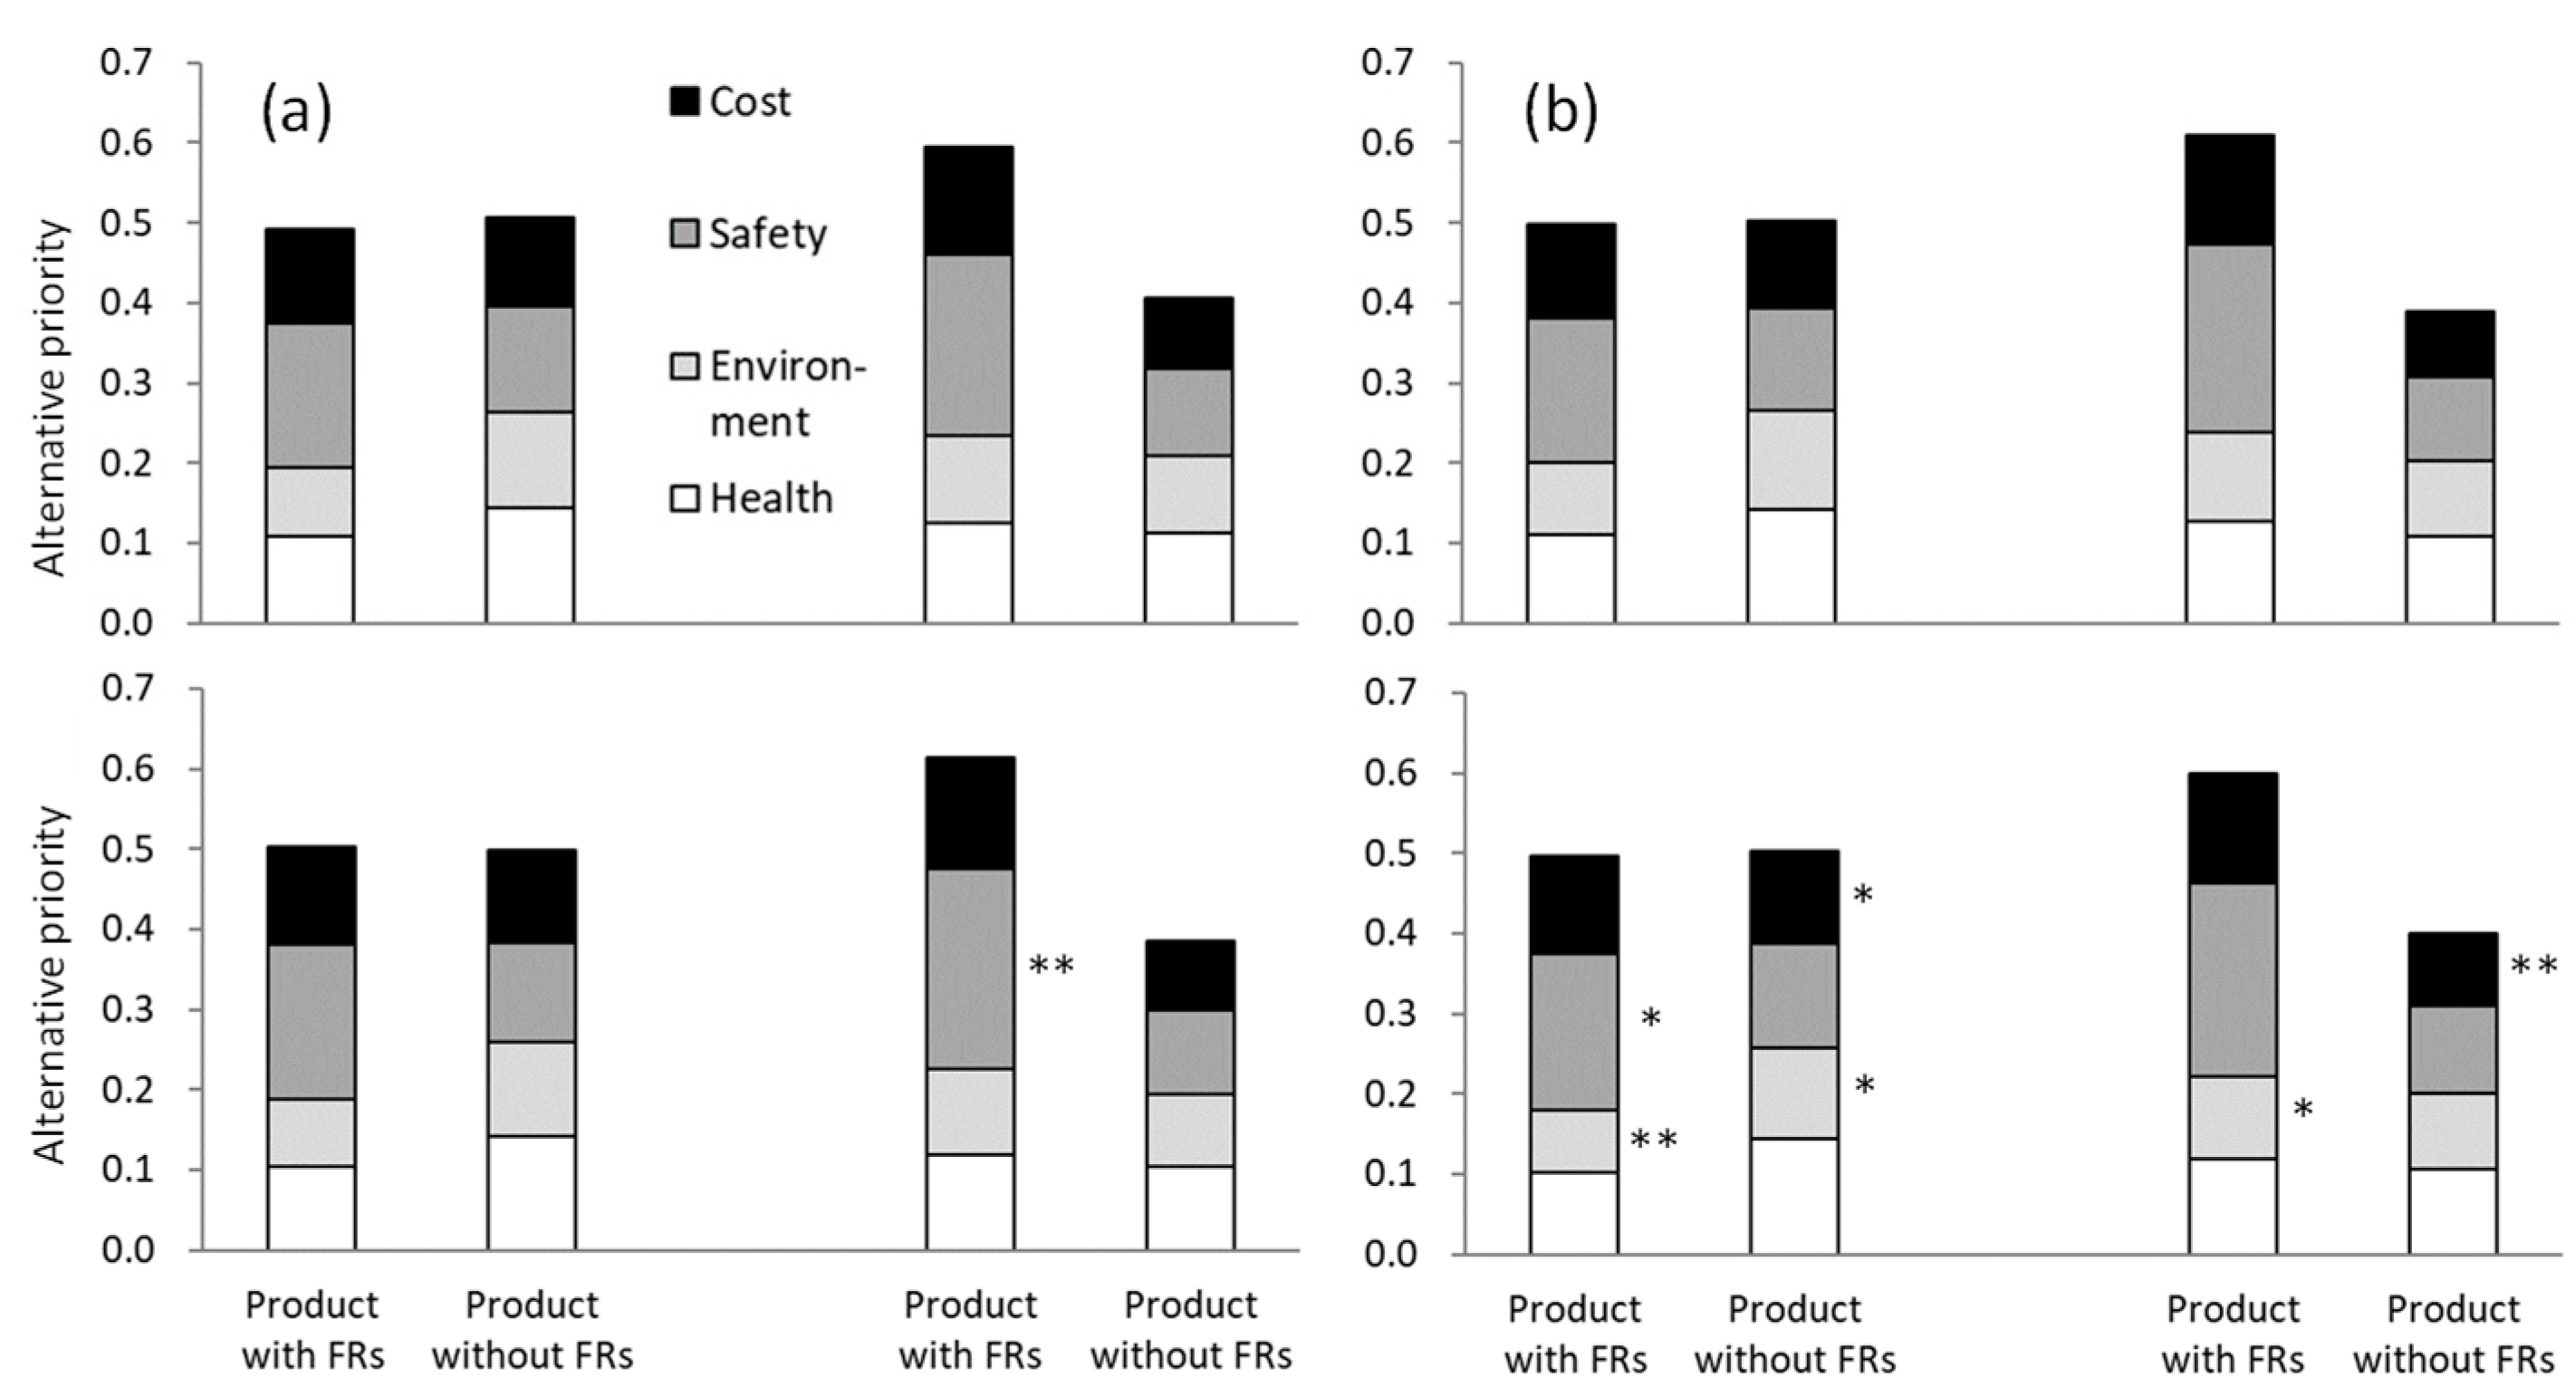
Figure 8.
Comparison of priorities of product alternatives for subjects grouped according to risk acceptance and risk-avoidance orientation: (a) fear of rare accidents; (b) fear of frequent accidents or worry about health (left: before watching video; right: after watching video; upper: upper group of factors; lower: lower group of factors). Two-sided test, alternative hypothesis: “upper group of factors” ≠ “lower group of factors”, * p < 0.05; ** p < 0.01.
Table 1.
Subject attributes (N = 1319).
Table 1.
Subject attributes (N = 1319).
| Characteristics | Ratio (%) | Persons | Characteristics | Ratio (%) | Persons |
|---|
| Sex | | | Housing type | | |
| Male | 49.1 | 647 | Owned home (Detached house) | 52.9 | 698 |
| Female | 50.9 | 672 | Owned home (Housing complex) | 9.5 | 125 |
| Age distribution | | | Leased home (Detached house) | 4.5 | 59 |
| 18–29 years | 19.2 | 253 | Leased home (Housing complex) | 30.5 | 402 |
| 30–39 years | 20.1 | 265 | Others | 2.7 | 35 |
| 40–49 years | 19.7 | 260 | Children under the age of 18 years | | |
| 50–59 years | 20.8 | 275 | <1 year | 2.8 | 41 |
| 60–99 years | 20.2 | 266 | 1–6 years | 11.9 | 175 |
| Regional distribution | | | Elementary school student | 10.8 | 158 |
| Hokkaido | 12.5 | 165 | Junior high school student | 4.6 | 68 |
| Tohoku | 12.6 | 166 | High school student | 6.0 | 88 |
| Kanto | 12.8 | 169 | Other | 2.9 | 43 |
| Chubu | 13.3 | 176 | No children <18 years old | 60.9 | 892 |
| Kinki | 12.5 | 165 | Final educational attainment | | |
| Chugoku | 11.8 | 155 | Junior high school | 2.7 | 36 |
| Shikoku | 12.1 | 160 | High school | 35.3 | 465 |
| Kyushu | 12.4 | 163 | College | 8.9 | 117 |
| Household income | | | University | 33.4 | 440 |
| <2 million JPY | 13.2 | 174 | Graduate school | 3.0 | 39 |
| 2–4 million JPY | 29.2 | 385 | Vocational college | 12.3 | 162 |
| 4–6 million JPY | 29.3 | 386 | Technical college | 1.7 | 22 |
| 6–8 million JPY | 13.5 | 178 | Other school | 0.2 | 3 |
| 8–10 million JPY | 7.7 | 102 | No answer | 2.7 | 35 |
| <15 million JPY | 5.1 | 67 | Major | | |
| <20 million JPY | 1.4 | 18 | Non-scientific field | 60.8 | 474 |
| >20 million JPY | 0.7 | 9 | Scientific field | 39.2 | 306 |
Table 2.
Explanation of evaluation criteria.
Table 2.
Explanation of evaluation criteria.
| Evaluation Criteria | Explanations |
|---|
| Health | FRs 1 gradually accumulate in the human body over the long term; thus, there is a high health risk. When FRs are not used, there is no health risk. |
| Environment | FRs gradually accumulate in living organisms over the long term; thus, there is a risk of adverse effects. |
| Safety | The risk of sudden fire accidents is high for electrical appliances that do not use FRs, which could lead to burns or deaths. |
| Cost | The price of electrical appliances rises a little when FRs are used; thus, the cost to buy the product is a little higher. |
Table 3.
Explanation of E&E 1 products with/without FRs 1.
Table 3.
Explanation of E&E 1 products with/without FRs 1.
| | | Product Alternatives |
|---|
| With FRs | Without FRs |
|---|
| Evaluation criteria | Health | Possible health effects on humans | No effect on human health |
| Environment | Propensity to accumulate easily in living organisms | No effect on living organisms |
| Safety | Effectively prevents fire accidents in electrical appliances | Possibility of sudden fire accidents occurring because FRs are not used |
| Cost | The price of the product rises slightly | The prices of the product does not rise |
Table 4.
Arithmetic mean, standard deviation, and factor loading matrix for risk acceptance and interpretations of the factors. KMO, 0.81; p < 0.001 (Bartlett’s test).
Table 4.
Arithmetic mean, standard deviation, and factor loading matrix for risk acceptance and interpretations of the factors. KMO, 0.81; p < 0.001 (Bartlett’s test).
| Question 14 | AM 1 | SD 1 | Factor 1 2 | Factor 2 2 | Factor 3 2 | Factor 4 2 |
|---|
| You continue to take risks without quitting, even if it does not go smoothly. | 2.34 | 0.70 | 0.87 | 0.11 | −0.13 | −0.12 |
| Difficult problems are challenging. | 2.58 | 0.75 | 0.83 | 0.04 | −0.13 | 0.04 |
| You like the challenge of something new. | 2.46 | 0.72 | 0.64 | −0.01 | 0.01 | −0.02 |
| When you find challenging things, you start them soon. | 2.77 | 0.67 | 0.47 | −0.08 | 0.05 | 0.2 |
| Life is what keeps you on the right side of danger. | 2.68 | 0.72 | 0.4 | −0.02 | 0.2 | 0.11 |
| You are careful in responding to anything. | 2.15 | 0.60 | 0.06 | 0.69 | 0.07 | −0.04 |
| You always want to play it safe. | 1.90 | 0.62 | 0.01 | 0.66 | −0.03 | 0.01 |
| You are careful not to fail at anything you do. | 2.22 | 0.64 | 0.23 | 0.57 | 0.01 | −0.07 |
| You do not start with difficult problems before having a comprehensive understanding. | 2.16 | 0.60 | 0.02 | 0.57 | 0.17 | −0.03 |
| You never approach dangerous places. | 2.13 | 0.74 | −0.08 | 0.57 | −0.01 | −0.02 |
| You dislike anything scary. | 2.20 | 0.75 | −0.16 | 0.53 | −0.1 | 0.19 |
| All events include some risks. | 2.21 | 0.63 | −0.16 | 0.05 | 0.78 | 0.02 |
| Society is comprised of a mixture of dangers and safety. | 2.13 | 0.59 | −0.01 | 0.11 | 0.57 | −0.06 |
| You accept some risks if you obtain benefits. | 2.56 | 0.65 | 0.14 | −0.14 | 0.51 | 0.04 |
| You take a risk without considering your ability. | 2.98 | 0.68 | 0.08 | 0.04 | −0.01 | 0.81 |
| Some say that you are a daredevil. | 3.01 | 0.68 | −0.02 | −0.02 | 0 | 0.7 |
| Factor correlations | | | | | | |
| Factor 1 | | | 1 | −0.14 | 0.41 | 0.58 |
| Factor 2 | | | −0.14 | 1 | −0.3 | −0.01 |
| Factor 3 | | | 0.41 | −0.3 | 1 | 0.22 |
| Eigenvalue | | | 2.30 | 2.22 | 1.24 | 1.30 |
| Cumulative contribution ratio | (%) | | 14 | 28 | 36 | 44 |
| Interpretation | | | Challenging | Cautious | Balance | Reckless |
Table 5.
Arithmetic mean, standard deviation, and factor loading matrix for risk-avoidance orientation and interpretations of the factors. KMO, 0.81; p < 0.001 (Bartlett’s test).
Table 5.
Arithmetic mean, standard deviation, and factor loading matrix for risk-avoidance orientation and interpretations of the factors. KMO, 0.81; p < 0.001 (Bartlett’s test).
| Question 15 | AM 1 | SD 1 | Factor 1 2 | Factor 2 2 |
|---|
| You worry about everything. | 2.36 | 0.75 | 0.86 | −0.25 |
| You worry about accidents on airplanes and buses. | 2.65 | 0.80 | 0.72 | 0.04 |
| You often worry that you will experience a natural disaster such as an earthquake, a flood, or a lightning strike. | 2.54 | 0.72 | 0.49 | 0.21 |
| You confirm your evacuation route when you stay at hotels. | 2.57 | 0.79 | −0.02 | 0.67 |
| You rarely eat food with additives and artificial coloring. | 2.55 | 0.75 | −0.2 | 0.63 |
| You avoid more dangerous seats when you take cars or highway express buses. | 2.81 | 0.73 | 0.21 | 0.41 |
| You consider safety against fire when you select a house. | 2.30 | 0.73 | 0.27 | 0.37 |
| You worry if you do not check the locks and fire hazards before you sleep. | 2.26 | 0.80 | 0.22 | 0.37 |
| Factor correlations | | | | |
| Factor 1 | | | - | 0.65 |
| Eigenvalue | | | 1.73 | 1.44 |
| Cumulative contribution ratio | (%) | | 22 | 40 |
| Interpretation | | | Fear of rare accidents | Fear of frequent accidents or worry about health |
© 2019 by the authors. Licensee MDPI, Basel, Switzerland. This article is an open access article distributed under the terms and conditions of the Creative Commons Attribution (CC BY) license (http://creativecommons.org/licenses/by/4.0/).


