A Rare Event Modelling Approach to Assess Injury Severity Risk of Vulnerable Road Users


Abstract
1. Introduction
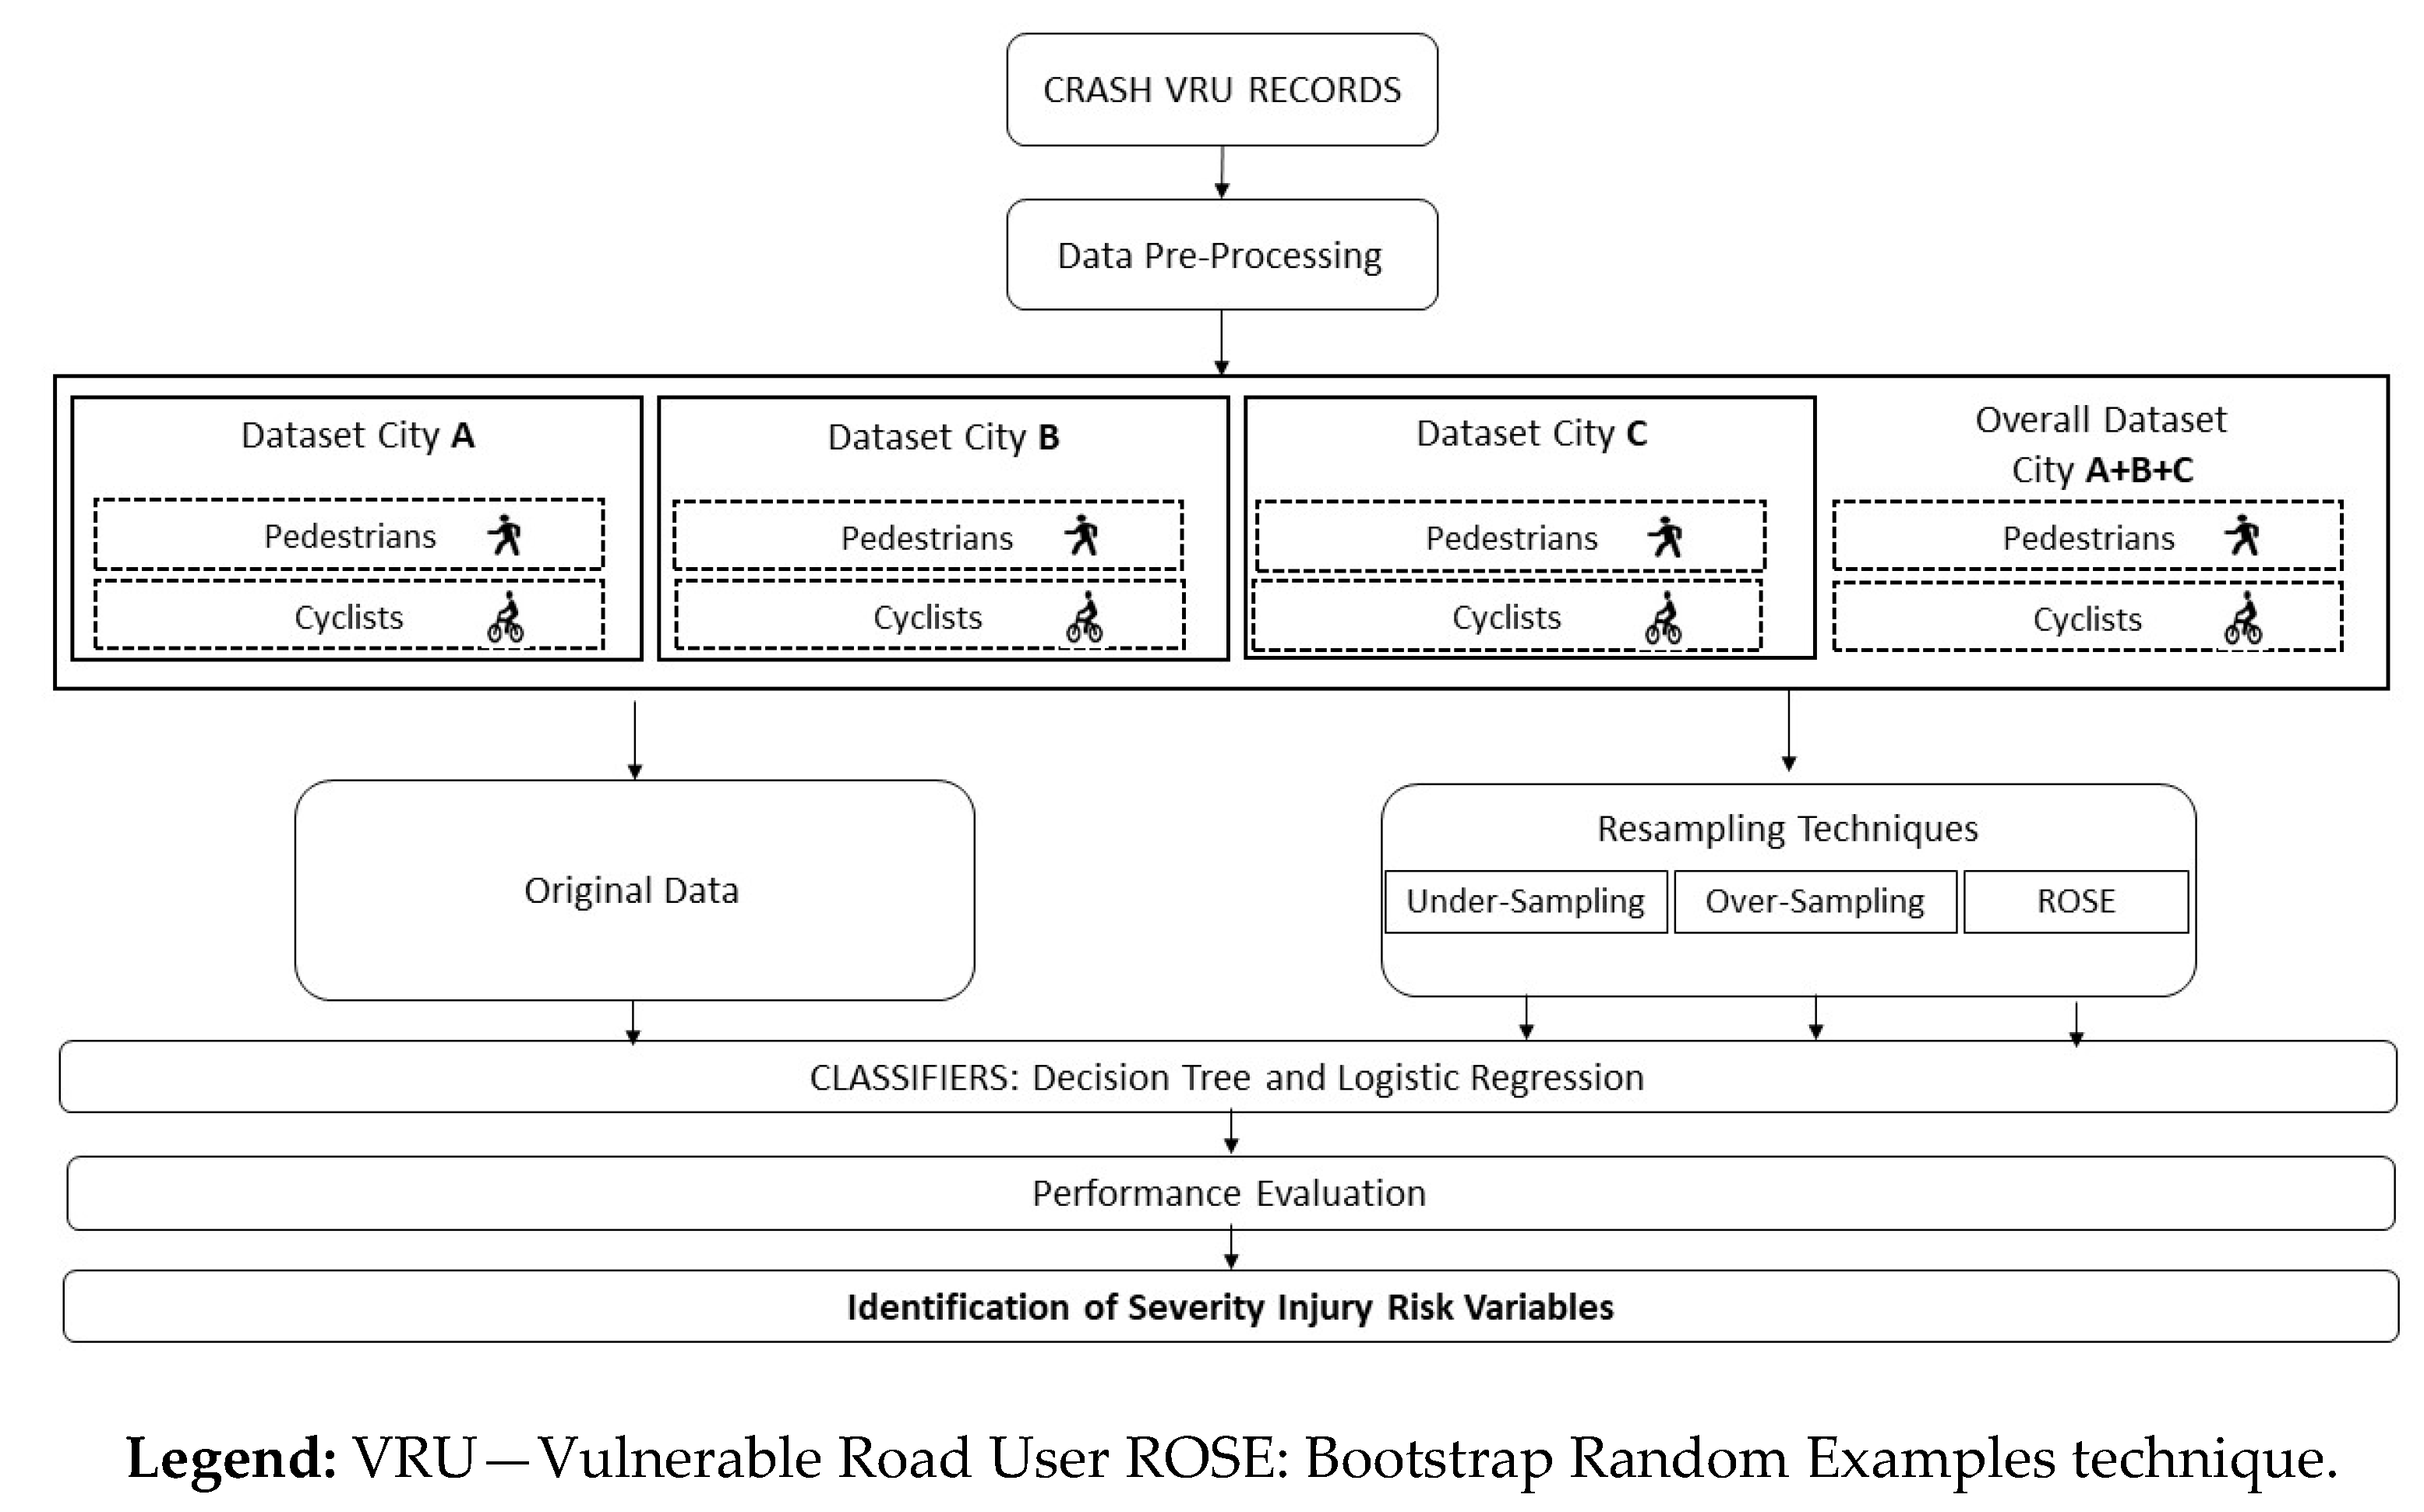
2. Methodology
2.1. Resampling Techniques
2.1.1. Undersampling
2.1.2. Oversampling
2.1.3. ROSE
2.2. Supervised Learning Classifiers
2.2.1. Decision Tree
2.2.2. Logistic Regression
2.3. Data Description and Case Studies
2.4. Pre-Processing Data
- VRU profile: gender and age group;
- Temporal variables: month, weekday and time period;
- Weather conditions: subdivided into good or bad (including any adverse situation, e.g., rain, fog, snow, strong winds);
- Luminosity: subdivided based on the national authority classification as daylight, sun glare, dawn or dusk, night with road lights or night without road lights;
- Road characteristics: describing the conservation conditions of the pavement (road conditions) and the presence of road surface markings for separating directions or directions and lanes (road markings).
3. Results
- To evaluate the most efficient prediction model based on three resampling techniques (undersampling, oversampling and ROSE);
- To explore and compare the results of two supervised classification techniques in order to identify which variables can significantly affect pedestrian and cyclist injury severity when involved in a motor vehicle crash.
4. Discussion
- Gender and age factors seem to play an important role in this type of VRU;
- Road markings are a risk factor considering pedestrian injury severity, especially for bigger cities;
- The luminosity of the road seems to be more important than weather conditions.
Limitations and Future Research
5. Conclusions
Author Contributions
Funding
Acknowledgments
Conflicts of Interest
References
- WHO. Global Status Report on Road Safety 2018; License: CC BY-NC-SA 3.0 IGO; World Health Organization: Geneva, Switzerland, 2018. [Google Scholar]
- European Commission. Pedestrians and Cyclists; Directorate General for Transport, February 2018; European Commission: Brussels, Belgium, 2018.
- European Commission. 2017 Road Safety Statistics: What Is behind the Figures? European Commission: Brussels, Belgium, 2018; pp. 1–4.
- ANSR. Annual Report 2017 (30 Days Victims)—National Authority of Road Safety; Portuguese National Authority for Road Safety: Lisbon, Portugal, 2017. (In Portuguese) [Google Scholar]
- National Academies of Sciences, Engineering, and Medicine. Critical Issues in Transportation 2019; National Academies Press: Washington, DC, USA, 2019; ISBN 978-0-309-48676-7. [Google Scholar]
- Monsere, C.; Wang, H.; Wang, Y.; Chen, C. Risk Factors for Pedestrians and Bicycle Crashes—Final Report—SPR 779; Oregon Department of Transportation: Salem, OR, USA, 2017.
- Liu, G.; Chen, S.; Zeng, Z.; Cui, H.; Fang, Y.; Gu, D.; Yin, Z.; Wang, Z. Risk factors for extremely serious road accidents: Results from national Road Accident Statistical Annual Report of China. PLoS ONE 2018, 13, e0201587. [Google Scholar] [CrossRef] [PubMed]
- SafetyNet Pedestrians & Cyclists. Available online: https://ec.europa.eu/transport/road_safety/sites/roadsafety/files/specialist/knowledge/pdf/pedestrians.pdf (accessed on 17 June 2018).
- Abellán, J.; López, G.; De Oña, J. Analysis of traffic accident severity using Decision Rules via decision trees. Expert Syst. Appl. 2013, 40, 6047–6054. [Google Scholar] [CrossRef]
- Ma, X.; Chen, S.; Chen, F. Multivariate space-time modeling of crash frequencies by injury severity levels. Anal. Methods Accid. Res. 2017, 15, 29–40. [Google Scholar] [CrossRef]
- Wang, Z.; Yue, Y.; Li, Q.; Nie, K.; Tu, W.; Liang, S.; Wang, Z.; Yue, Y.; Li, Q.; Nie, K.; et al. Analyzing Risk Factors for Fatality in Urban Traffic Crashes: A Case Study of Wuhan, China. Sustainability 2017, 9, 897. [Google Scholar] [CrossRef]
- Ferreira, S.; Amorim, M.; Couto, A. Risk factors affecting injury severity determined by the MAIS score. Traffic Inj. Prev. 2017, 18, 515–520. [Google Scholar] [CrossRef] [PubMed]
- Delen, D.; Tomak, L.; Topuz, K.; Eryarsoy, E. Investigating injury severity risk factors in automobile crashes with predictive analytics and sensitivity analysis methods. J. Transp. Health 2017, 4, 118–131. [Google Scholar] [CrossRef]
- Fountas, G.; Anastasopoulos, P.C.; Abdel-Aty, M. Analysis of accident injury-severities using a correlated random parameters ordered probit approach with time variant covariates. Anal. Methods Accid. Res. 2018, 18, 57–68. [Google Scholar] [CrossRef]
- Fountas, G.; Anastasopoulos, P.C.; Mannering, F.L. Analysis of vehicle accident-injury severities: A comparison of segment- versus accident-based latent class ordered probit models with class-probability functions. Anal. Methods Accid. Res. 2018, 18, 15–32. [Google Scholar] [CrossRef]
- Fountas, G.; Anastasopoulos, P.C. Analysis of accident injury-severity outcomes: The zero-inflated hierarchical ordered probit model with correlated disturbances. Anal. Methods Accid. Res. 2018, 20, 30–45. [Google Scholar] [CrossRef]
- Ramachandiran, V.M.; Babu, P.N.K.; Manikandan, R. Prediction of Road Accidents Severity using various algorithms. Int. J. Pure Appl. Math. 2018, 119, 16663–16669. [Google Scholar]
- Duddu, V.R.; Kukkapalli, V.M.; Pulugurtha, S.S. Crash risk factors associated with injury severity of teen drivers. IATSS Res. 2018, 43, 37–43. [Google Scholar] [CrossRef]
- Senserrick, T.; Boufous, S.; de Rome, L.; Ivers, R.; Stevenson, M. Detailed Analysis of Pedestrian Casualty Collisions in Victoria, Australia. Traffic Inj. Prev. 2014, 15, 197–205. [Google Scholar] [CrossRef] [PubMed]
- Pour-Rouholamin, M.; Zhou, H. Investigating the risk factors associated with pedestrian injury severity in Illinois. J. Saf. Res. 2016, 57, 9–17. [Google Scholar] [CrossRef]
- Xin, C.; Guo, R.; Wang, Z.; Lu, Q.; Lin, P.S. The effects of neighborhood characteristics and the built environment on pedestrian injury severity: A random parameters generalized ordered probability model with heterogeneity in means and variances. Anal. Methods Accid. Res. 2017, 16, 117–132. [Google Scholar] [CrossRef]
- Kim, M.; Kho, S.Y.; Kim, D.K. Hierarchical ordered model for injury severity of pedestrian crashes in South Korea. J. Saf. Res. 2017, 61, 33–40. [Google Scholar] [CrossRef]
- Uddin, M.; Ahmed, F. Pedestrian Injury Severity Analysis in Motor Vehicle Crashes in Ohio. Safety 2018, 4, 20. [Google Scholar] [CrossRef]
- Zhai, X.; Huang, H.; Sze, N.N.; Song, Z.; Hon, K.K. Diagnostic analysis of the effects of weather condition on pedestrian crash severity. Accid. Anal. Prev. 2019, 122, 318–324. [Google Scholar] [CrossRef]
- Kaplan, S.; Vavatsoulas, K.; Prato, C.G. Aggravating and mitigating factors associated with cyclist injury severity in Denmark. J. Saf. Res. 2014, 50, 75–82. [Google Scholar] [CrossRef]
- Chen, P.; Shen, Q. Built environment effects on cyclist injury severity in automobile-involved bicycle crashes. Accid. Anal. Prev. 2016, 86, 239–246. [Google Scholar] [CrossRef]
- Wall, S.P.; Lee, D.C.; Frangos, S.G.; Sethi, M.; Heyer, J.H.; Ayoung-chee, P.; DiMaggio, C.J. The Effect of Sharrows, Painted Bicycle Lanes and Physically Protected Paths on the Severity of Bicycle Injuries Caused by Motor Vehicles. Safety 2016, 2, 26. [Google Scholar] [CrossRef]
- Behnood, A.; Mannering, F. Determinants of bicyclist injury severities in bicycle-vehicle crashes: A random parameters approach with heterogeneity in means and variances. Anal. Methods Accid. Res. 2017, 16, 35–47. [Google Scholar] [CrossRef]
- Prati, G.; Pietrantoni, L.; Fraboni, F. Using data mining techniques to predict the severity of bicycle crashes. Accid. Anal. Prev. 2017, 101, 44–54. [Google Scholar] [CrossRef]
- Useche, S.; Montoro, L.; Alonso, F.; Oviedo-Trespalacios, O. Infrastructural and Human Factors Affecting Safety Outcomes of Cyclists. Sustainability 2018, 10, 299. [Google Scholar] [CrossRef]
- Zahabi, S.; Strauss, J.; Manaugh, K.; Miranda-Moreno, L. Estimating Potential Effect of Speed Limits, Built Environment, and Other Factors on Severity of Pedestrian and Cyclist Injuries in Crashes. Transp. Res. Rec. J. Transp. Res. Board 2011, 2247, 81–90. [Google Scholar] [CrossRef]
- Torrão, G.; Coelho, M.; Rouphail, N. Modeling the impact of subject and opponent vehicles on crash severity in two-vehicle collisions. Transp. Res. Rec. 2014, 2432, 53–64. [Google Scholar] [CrossRef]
- Amoh-Gyimah, R.; Saberi, M.; Sarvi, M. Macroscopic modeling of pedestrian and bicycle crashes: A cross-comparison of estimation methods. Accid. Anal. Prev. 2016, 93, 147–159. [Google Scholar] [CrossRef]
- Yuan, Q.; Chen, H. Factor comparison of passenger-vehicle to vulnerable road user crashes in Beijing, China. Int. J. Crashworthiness 2017, 22, 260–270. [Google Scholar] [CrossRef]
- Heydari, S.; Fu, L.; Miranda-Moreno, L.F.; Jopseph, L. Using a flexible multivariate latent class approach to model correlated outcomes: A joint analysis of pedestrian and cyclist injuries. Anal. Methods Accid. Res. 2017, 13, 16–27. [Google Scholar] [CrossRef]
- Vilaça, M.; Silva, N.; Coelho, M.C. Statistical Analysis of the Occurrence and Severity of Crashes Involving Vulnerable Road Users. Transp. Res. Procedia 2017, 27, 1113–1120. [Google Scholar] [CrossRef]
- Vilaça, M.; Macedo, E.; Tafidis, P.; Coelho, M. Frequency and severity of crashes involving vulnerable road users—An integrated spatial and temporal analysis. In Proceedings of the Annual Meeting Transportation Research Board, Washignton, DC, USA, 12–16 January 2018; pp. 1–17. [Google Scholar]
- Salon, D.; McIntyre, A. Determinants of pedestrian and bicyclist crash severity by party at fault in San Francisco, CA. Accid. Anal. Prev. 2018, 110, 149–160. [Google Scholar] [CrossRef]
- Ouni, F.; Belloumi, M. Spatio-temporal pattern of vulnerable road user’s collisions hot spots and related risk factors for injury severity in Tunisia. Transp. Res. Part F Traffic Psychol. Behav. 2018, 56, 477–495. [Google Scholar] [CrossRef]
- Weast, R. Temporal factors in motor-vehicle crash deaths: Ten years later. J. Saf. Res. 2018, 65, 125–131. [Google Scholar] [CrossRef]
- Haixiang, G.; Yijing, L.; Shang, J.; Mingyun, G.; Yuanyue, H.; Bing, G. Learning from class-imbalanced data: Review of methods and applications. Expert Syst. Appl. 2017, 73, 220–239. [Google Scholar] [CrossRef]
- Rokach, L.; Maimon, O. Data Mining with Decision Trees: Theory and Applications; Series in Machine Perception and Artificial Intelligence; World Scientific: Singapore, 2014; Volume 81, ISBN 978-981-4590-07-5. [Google Scholar]
- Dovom, H.Z.; Saffarzadeh, M.; Dovom, M.Z.; Nadimi, N. An Analysis of Pedestrian Fatal Accident Severity Using a Binary logistic regression Model. ITE 2012, 82, 38. [Google Scholar]
- Moudon, A.V.; Lin, L.; Jiao, J.; Hurvitz, P.; Reeves, P. The risk of pedestrian injury and fatality in collisions with motor vehicles, a social ecological study of state routes and city streets in King County, Washington. Accid. Anal. Prev. 2011, 43, 11–24. [Google Scholar] [CrossRef]
- Harrell, F.E. Regression Modeling Strategies—With Applications to Linear Models, Logistic and Ordinal Regression, and Survival Analysis; Springer Science + Business Media: New York, NY, USA, 2015; ISBN 978-3319194240. [Google Scholar]
- Abdulhafedh, A. Incorporating the Multinomial logistic regression in Vehicle Crash Severity Modeling: A Detailed Overview. J. Transp. Technol. 2017, 7, 279–303. [Google Scholar] [CrossRef]
- Al-Radaideh, Q.A.; Daoud, E.J. Data mining methods for traffic accident severity prediction. Int. J. Neural Netw. Adv. Appl. 2018, 5, 1–12. [Google Scholar]
- Japkowicz, N. Assessment Metrics for Imbalanced Learning. In Imbalanced Learning; John Wiley & Sons, Inc.: Hoboken, NJ, USA, 2013; pp. 187–206. [Google Scholar]
- López, V.; Fernández, A.; García, S.; Palade, V.; Herrera, F. An insight into classification with imbalanced data: Empirical results and current trends on using data intrinsic characteristics. Inf. Sci. 2013, 250, 113–141. [Google Scholar] [CrossRef]
- More, A. Survey of resampling techniques for improving classification performance in unbalanced datasets. arXiv 2016, arXiv:1608.06048. [Google Scholar]
- Burnaev, E.; Erofeev, P.; Papanov, A. Influence of Resampling on Accuracy of Imbalanced Classification. In Proceedings of the Eighth International Conference on Machine Vision (ICMV 2015), Barcelona, Spain, 19–20 November 2015. [Google Scholar]
- Tantithamthavorn, C.; Hassan, A.E.; Matsumoto, K. The Impact of Class Rebalancing Techniques on the Performance and Interpretation of Defect Prediction Models. IEEE Trans. Softw. Eng. 2018, 1–20. [Google Scholar] [CrossRef]
- Crone, S.F.; Finlay, S. Instance sampling in credit scoring: An empirical study of sample size and balancing. Int. J. Forecast. 2012, 28, 224–238. [Google Scholar] [CrossRef]
- He, H.; Garcia, E.A. Learning from Imbalanced Data. Knowl. Data Eng. IEE Trans. 2009, 21, 1263–1284. [Google Scholar]
- Pei, X.; Sze, N.N.; Wong, S.C.; Yao, D. Bootstrap resampling approach to disaggregate analysis of road crashes in Hong Kong. Accid. Anal. Prev. 2016, 95, 512–520. [Google Scholar] [CrossRef]
- Mujalli, R.O.; López, G.; Garach, L. Bayes classifiers for imbalanced traffic accidents datasets. Accid. Anal. Prev. 2016, 88, 37–51. [Google Scholar] [CrossRef] [PubMed]
- Mussone, L.; Bassani, M.; Masci, P. Analysis of factors affecting the severity of crashes in urban road intersections. Accid. Anal. Prev. 2017, 103, 112–122. [Google Scholar] [CrossRef] [PubMed]
- Taamneh, M.; Alkheder, S.; Taamneh, S. Data-mining techniques for traffic accident modeling and prediction in the United Arab Emirates. J. Transp. Saf. Secur. 2017, 9, 146–166. [Google Scholar] [CrossRef]
- Jiang, L.; Xie, Y. Modelling highly unbalanced crash injury severity data by ensemble methods and global sensitivity analysis. In Proceedings of the Transportation Research Board 98th Annual Meeting, Washington, DC, USA, 13–17 January 2019. [Google Scholar]
- R Development Core Team. R: A Language and Environment for Statistical Computing; R Development Core Team: Vienna, Austria, 2008. [Google Scholar]
- Lunardon, N.; Menardi, G.; Torelli, N. ROSE: Random Oversampling Examples. ROSE-Package, Version 0.0-3, License GPL-2, CRAN. 2014. Available online: https://rdrr.io/cran/ROSE/man/ROSE-package.html (accessed on 1 March 2019).
- Lunardon, N.; Menardi, G.; Torelli, N. ROSE: A Package for Binary Imbalanced Learning. R J. 2014, 6, 79–89. [Google Scholar] [CrossRef]
- Menardi, G.; Torelli, N. Training and assessing classification rules with imbalanced data. Data Min. Knowl. Discov. 2014, 28, 92–122. [Google Scholar] [CrossRef]
- Liu, H.; Gegov, A.; Cocea, M. Unified Framework for Control of Machine Learning Tasks towards Effective and Efficient Processing of Big Data. In Data Science and Big Data: An Environment of Computational Intelligence; Springer: Cham, Switzerland, 2017; pp. 123–140. ISBN 978-3-319-53473-2. [Google Scholar]
- Hanley, J.A.; McNeil, B.J. The meaning and use of the area under a receiver operating characteristic (ROC) curve. Radiology 1982, 143, 29–36. [Google Scholar] [CrossRef]
- Akobeng, A.K. Understanding diagnostic tests 3: Receiver operating characteristic curves. Acta Paediatr. 2007, 96, 644–647. [Google Scholar] [CrossRef]
- Williams, G. Data Mining with Rattle and R; Springer: New York, NY, USA, 2011; ISBN 978-1-4419-9889-7. [Google Scholar]
- Ryza, S.; Laserson, U.; Owen, S.; Wills, J. Advanced Analytics with Spark: Patterns from Learning from Data at Scale; O’Reilly Media, Inc.: Sevastopol, CA, USA, 2017; ISBN 9781491972946. [Google Scholar]
- Hosmer, D.W.; Lemeshow, S. Applied Logistic Regression, 3rd ed.; A Wiley-Interscience Publication: Hoboken, NJ, USA, 2013; ISBN 0-471-35632-8. [Google Scholar]
- INE. Censos 2011 Resultados Definitivos—Portugal; Portuguese Statistics Institute: Lisbon, Portugal, 2011. (In Portuguese)


| Variable | Code | Description | Aveiro | Porto | Lisbon | |||
|---|---|---|---|---|---|---|---|---|
| NSI | SI | NSI | SI | NSI | SI | |||
| Gender | 0 | Male | 245 | 25 | 942 | 44 | 2072 | 178 |
| 1 | Female | 218 | 19 | 1062 | 27 | 2097 | 119 | |
| Age | 1 | 11 years old | 22 | 4 | 89 | 3 | 213 | 11 |
| 2 | 12–17 years old | 29 | 2 | 146 | 4 | 291 | 14 | |
| 3 | 18–24 years old | 75 | 4 | 235 | 7 | 544 | 28 | |
| 4 | 25–49 years old | 140 | 15 | 572 | 11 | 1298 | 87 | |
| 5 | 50–65 years old | 102 | 8 | 472 | 14 | 820 | 51 | |
| 6 | >65 years old | 95 | 11 | 490 | 32 | 1003 | 106 | |
| Month | 1 | January | 38 | 4 | 159 | 6 | 340 | 30 |
| 2 | February | 33 | 3 | 150 | 8 | 327 | 28 | |
| 3 | March | 36 | 3 | 172 | 4 | 325 | 25 | |
| 4 | April | 35 | 3 | 133 | 7 | 328 | 10 | |
| 5 | May | 35 | 6 | 162 | 4 | 391 | 30 | |
| 6 | June | 38 | 3 | 165 | 4 | 326 | 20 | |
| 7 | July | 37 | 2 | 187 | 3 | 344 | 24 | |
| 8 | August | 39 | 5 | 117 | 3 | 255 | 24 | |
| 9 | September | 37 | 5 | 201 | 9 | 387 | 21 | |
| 10 | October | 43 | 2 | 194 | 10 | 389 | 27 | |
| 11 | November | 55 | 3 | 182 | 5 | 387 | 29 | |
| 12 | December | 37 | 5 | 182 | 8 | 370 | 29 | |
| Weekday | 1 | Sunday | 42 | 3 | 150 | 6 | 342 | 29 |
| 2 | Monday | 66 | 8 | 334 | 10 | 619 | 38 | |
| 3 | Tuesday | 80 | 3 | 297 | 12 | 671 | 44 | |
| 4 | Wednesday | 70 | 5 | 341 | 11 | 682 | 46 | |
| 5 | Thursday | 88 | 9 | 328 | 16 | 715 | 50 | |
| 6 | Friday | 65 | 10 | 342 | 9 | 723 | 56 | |
| 7 | Saturday | 52 | 6 | 212 | 7 | 417 | 34 | |
| Time | 1 | 00:00–06:00 h | 22 | 4 | 67 | 4 | 222 | 22 |
| 2 | 07:00–10:00 h | 112 | 9 | 418 | 18 | 947 | 38 | |
| 3 | 11:00–15:00 h | 123 | 6 | 658 | 25 | 1256 | 91 | |
| 4 | 16:00–19:00 h | 163 | 18 | 637 | 14 | 1302 | 82 | |
| 5 | 20:00–23:00 h | 43 | 7 | 224 | 10 | 442 | 64 | |
| Weather | 0 | Bad | 71 | 5 | 315 | 14 | 472 | 35 |
| 1 | Good | 392 | 39 | 1689 | 57 | 3697 | 262 | |
| Luminosity | 1 | Daylight | 344 | 29 | 1519 | 50 | 3074 | 182 |
| 2 | Sun glare | 1 | 1 | 8 | 1 | 20 | 3 | |
| 3 | Dawn or dusk | 10 | 0 | 29 | 0 | 131 | 13 | |
| 4 | Night with road lights | 91 | 10 | 419 | 19 | 925 | 92 | |
| 5 | Night without road lights | 17 | 4 | 29 | 1 | 19 | 7 | |
| Road Conditions | 1 | Good | 239 | 19 | 1306 | 34 | 1998 | 143 |
| 2 | Regular | 219 | 22 | 691 | 37 | 2080 | 151 | |
| 3 | Bad | 5 | 3 | 7 | 0 | 91 | 3 | |
| Road Markings | 1 | Without | 183 | 16 | 382 | 7 | 1736 | 71 |
| 2 | Separating directions | 121 | 12 | 384 | 7 | 468 | 41 | |
| 3 | Separating directions and lanes | 159 | 16 | 1238 | 57 | 1965 | 185 | |
| Datasets | Total | NSI | SI | |||
|---|---|---|---|---|---|---|
| Aveiro |  |  | | | | |
| Original | 249 | 258 | 222 | 241 | 27 | 17 |
| Undersampling | 54 | 34 | 27 | 17 | 27 | 17 |
| Oversampling | 444 | 482 | 222 | 241 | 222 | 241 |
| ROSE | 249 | 258 | 126 | 131 | 123 | 127 |
| Porto | ||||||
| Original | 1849 | 226 | 1780 | 224 | 69 | 2 |
| Undersampling | 138 | 4 | 69 | 2 | 69 | 2 |
| Oversampling | 3560 | 448 | 1780 | 224 | 1780 | 224 |
| ROSE | 1849 | 226 | 959 | 110 | 890 | 116 |
| Lisbon | ||||||
| Original | 3990 | 476 | 3713 | 456 | 277 | 20 |
| Undersampling | 554 | 40 | 277 | 20 | 277 | 20 |
| Oversampling | 7426 | 912 | 3713 | 456 | 3713 | 456 |
| ROSE | 3990 | 476 | 2060 | 257 | 1930 | 219 |
| Overall | ||||||
| Original | 6088 | 960 | 5715 | 921 | 373 | 39 |
| Undersampling | 746 | 78 | 373 | 39 | 373 | 39 |
| Oversampling | 11430 | 1842 | 5715 | 921 | 5715 | 921 |
| ROSE | 6088 | 960 | 3085 | 497 | 3003 | 463 |
represents pedestrians; represents cyclists.| Decision Tree | VRU | Original | Undersampling | Oversampling | ROSE |
| Aveiro | | 0.576 | 0.611 | 0.773 | 0.536 |
| 0.505 | 0.667 | 0.839 | 0.635 | |
| Porto | | 0.538 | 0.524 | 0.796 | 0.656 |
| 0.547 | 0.500 1 | 0.962 | 0.974 | |
| Lisbon | | 0.558 | 0.671 | 0.660 | 0.636 |
| 0.574 | 0.571 | 0.931 | 0.547 | |
| Overall | | 0.500 1 | 0.584 | 0.624 | 0.615 |
| 0.614 | 0.552 | 0.894 | 0.672 | |
| Logistic Regression | VRU | Original | Undersampling | Oversampling | ROSE |
| Aveiro | | 0.547 | 0.580 | 0.652 | 0.540 |
| 0.561 | 0.556 | 0.772 | 0.738 | |
| Porto | | 0.652 | 0.512 | 0.684 | 0.692 |
| 0.680 | - 2 | 0.861 | 0.814 | |
| Lisbon | | 0.653 | 0.694 | 0.697 | 0.679 |
| 0.578 | 0.510 | 0.692 | 0.623 | |
| Overall | | 0.630 | 0.649 | 0.662 | 0.619 |
| 0.539 | 0.667 | 0.631 | 0.584 |
| Resampling Techniques | VRU | Aveiro | Porto | Lisbon | Overall |
|---|---|---|---|---|---|
| Original | | Age (28) Month (20) Luminosity (14) | Road Markings (100) | Road Markings (93) Age (4) Road Conditions (3) | |
| Age (31) Gender (28) Month (18) | Age (100) | Age (42) Weekday (36) Month (19) | Weekday (47) Age (36) Time (16) | |
| Undersampling | | Month (51) Luminosity (15) Time (10) | Age (36) Month (24) Road Markings (17) | Road Markings (25) Age (24) Month (14) | Month (33) Luminosity (19) Road Markings (19) |
| Month (46) Age (12) Time (12) Luminosity (12) Road Conditions (12) | Road Markings (77) Gender (8) Age (8) Month (8) | Road Conditions (30) Month (22) Age (17) | ||
| Oversampling | | Road Conditions (19) Month (17) Age (14) | Month (18) Road Markings (14) Age (14) | Road Markings (42) Time (21) Age (19) | Age (43) Gender (30) Road Markings (20) |
| Weekday (18) Month (17) Age (14) Time (14) | Month (61) Time (17) Luminosity (9) | Weekday (22) Time (22) Month (15) | Age (21) Month (20) Weekday (19) | |
| ROSE | | Gender (41) Road Markings (16) Time (11) | Road Markings (23) Gender (20) Age (18) | Road Markings (42) Luminosity (36) Age (11) | Gender (28) Road Markings (25) Age (20) |
| Gender (31) Age (17) Road Conditions (16) | Month (30) Gender (18) Time (17) | Luminosity (24) Weather (19) Weekday (13) Time (13) | Road Conditions (19) Age (18) Luminosity (16) |
| Dataset | Resampling Technique | Gender | Age | Month | Weekday | Time | Weather | Luminosity | Road Conditions | Road Markings |
|---|---|---|---|---|---|---|---|---|---|---|
| Aveiro | Original | 0.4115 * | ||||||||
| Undersampling | 2.0020 * | |||||||||
| Oversampling | 0.9262 ** | 0.2262 ** | 0.4465 ** | |||||||
| ROSE | −0.8828 *** | 0.2323 * | 0.4263 ** | |||||||
| Porto | Original | −0.8858 *** | 1.0265 *** | |||||||
| Undersampling | 0.3958 ** | 0.8862 * | ||||||||
| Oversampling | −0.9121 *** | 0.2355 *** | −0.0515 ** | −0.2357 *** | −0.2142 * | 0.1561 *** | 0.7761 *** | 0.6581 *** | ||
| ROSE | −0.5685 *** | 0.1181 *** | −0.1227 ** | 0.1065 *** | 0.4855 *** | 0.4051 *** | ||||
| Lisbon | Original | −0.3684 ** | 0.2090 *** | 0.4627 * | 0.1456 ** | 0.5239 *** | ||||
| Undersampling | −0.3795 * | 0.2079 ** | 0.2833 ** | |||||||
| Oversampling | −0.4822 *** | 0.2601 *** | −0.0256 *** | 0.1009 *** | 0.1849 ** | 0.1653 *** | 0.3945 *** | |||
| ROSE | −0.4406 *** | 0.1959 *** | 0.1158 *** | 0.2369 ** | 0.1072 *** | 0.3403 *** | ||||
| Overall | Original | −0.5991 *** | 0.1812 *** | 0.16196 *** | 0.3441 *** | 0.4130 *** | ||||
| Undersampling | 0.2438 *** | 0.2932 * | 0.3413 *** | |||||||
| Oversampling | −0.5041 *** | 0.1970 *** | −0.0166 ** | 0.0609 *** | 0.2412 *** | 0.1573 *** | 0.2865 *** | 0.3219 *** | ||
| ROSE | −0.3931 *** | 0.1325 *** | −0.020 ** | 0.0655 ** | 0.0804 *** | 0.1874 *** | 0.2808 *** |
| Dataset | Resampling Technique | Gender | Age | Month | Weekday | Time | Weather | Luminosity | Road Conditions | Road Markings |
|---|---|---|---|---|---|---|---|---|---|---|
| Aveiro | Original | 1.0863 ** | ||||||||
| Undersampling | ||||||||||
| Oversampling | −1.0377 *** | 1.0251 *** | 0.5456 *** | 0.7132 *** | −0.4234 *** | 1.3226 *** | 0.3846 ** | |||
| ROSE | −0.9348 *** | 0.1494 * | 1.2172 *** | |||||||
| Porto | Original | |||||||||
| Undersampling | ||||||||||
| Oversampling | −0.9513 *** | −0.6974 *** | −2.0614 *** | |||||||
| ROSE | −0.9218 *** | 5.7643 ** | −0.3771 * | |||||||
| Lisbon | Original | |||||||||
| Undersampling | 0.4457 * | |||||||||
| Oversampling | 0.0626 ** | 0.0342 ** | 0.1109 * | |||||||
| ROSE | 0.0748 ** | 0.1847 ** | ||||||||
| Overall | Original | |||||||||
| Undersampling | ||||||||||
| Oversampling | −0.3509 ** | 0.2066 *** | 0.0669 ** | 0.2386 *** | 0.6649 *** | |||||
| ROSE | 0.1407 ** |
© 2019 by the authors. Licensee MDPI, Basel, Switzerland. This article is an open access article distributed under the terms and conditions of the Creative Commons Attribution (CC BY) license (http://creativecommons.org/licenses/by/4.0/).
Share and Cite
Vilaça, M.; Macedo, E.; Coelho, M.C. A Rare Event Modelling Approach to Assess Injury Severity Risk of Vulnerable Road Users. Safety 2019, 5, 29. https://doi.org/10.3390/safety5020029
Vilaça M, Macedo E, Coelho MC. A Rare Event Modelling Approach to Assess Injury Severity Risk of Vulnerable Road Users. Safety. 2019; 5(2):29. https://doi.org/10.3390/safety5020029
Chicago/Turabian StyleVilaça, Mariana, Eloísa Macedo, and Margarida C. Coelho. 2019. "A Rare Event Modelling Approach to Assess Injury Severity Risk of Vulnerable Road Users" Safety 5, no. 2: 29. https://doi.org/10.3390/safety5020029
APA StyleVilaça, M., Macedo, E., & Coelho, M. C. (2019). A Rare Event Modelling Approach to Assess Injury Severity Risk of Vulnerable Road Users. Safety, 5(2), 29. https://doi.org/10.3390/safety5020029