1. Introduction
Over the past several years, airspace has become congested with the increasing number of flights [
1]. The introduction of unmanned aircraft systems (UAS), also known as remotely piloted aircraft systems (RPAS), into the National Airspace System (NAS) has further increased congestion, especially below the transition altitude where most of the general aviation aircraft fly. According to the Federal Aviation Administration (FAA), the use of small unmanned aircraft systems (SUAS) for commercial operations has greatly increased in recent years. This is not only for commercial purposes, but hobbyists are also using this platform for various recreational activities. The FAA also states that more than 6800 airspace waiver requests were submitted for operations in controlled airspace by the end of December 2016 [
2]. While almost half of them were for operations in class D airspace (i.e., smaller airports with control towers), other classes were also requested and regularly flown. These statistics of UAS integration indicate a unified airspace for both manned and unmanned aircraft in the future.
The Next Generation Air Transportation System, in short NextGen, is a series of inter-linked programs, systems, and policies that implement advanced technologies and capabilities [
3]. ADS-B is the backbone of this NextGen program that utilizes the Global Navigation Satellite System (GNSS) technology to provide the pilot and air traffic control (ATC) with more information which enables an efficient navigation of aircraft in the increasingly congested airspace. The FAA mandated all aircraft must be equipped with ADS-B out by the year 2020 to fly within the designated controlled airspace, as stated in Federal Regulation 14 CFR 91.225 [
4]. The General Aviation ADS-B Rebate Program [
5] was introduced by the FAA to encourage and help owners to equip aircraft with the required avionics for NextGen. Radio Technical Commission for Aeronautics (RTCA) [
6] defines ADS-B as a function on an aircraft or a surface vehicle operating within the surface movement area that periodically broadcasts its position and other information without the knowledge of the identity of the recipients and without expecting acknowledgments. ADS-B is a cooperative system because it requires common equipage for aircraft, or vehicles on the airport surface, to exchange information. It also provides aircraft state information such as horizontal position, altitude, vector, velocity, and trajectory intent information. In the United States, ADS-B works on two different frequencies; one is at the 1090 MHz Extended Squitter and the other is UAT at 978 MHz.
According to minimal operational performance standard (MOPS) for UAS [
7], UAS detect and avoid (DAA) will have two different classes of surveillance systems onboard. Both class 1 and class 2 will have ADS-B onboard. As the onboard computer will make use of surveillance sensor data to trigger alert in the absence of the ‘human eye’, it is crucial to have robust and efficient surveillance sensors. However, studies have shown that, both the 1090ES and UAT ADS-B are prone to significant message degradations [
8,
9,
10,
11,
12,
13,
14,
15,
16]. One of the drawbacks of ADS-B is message loss or dropout. In our previous studies, ADS-B has shown significant message loss along with different message anomalies [
13,
14,
15,
16]. In this work, the severity and risk associated with ADS-B drop-out in DAA function are investigated utilizing Monte Carlo simulation. Two different encounter scenarios are generated using the aircraft dynamic model parameters. This analysis resolves how ADS-B message drop-out could affect UAS DAA alerting if used as a single mean of surveillance without any ATC interaction. Different durations of ADS-B update rate that are detected in the data analysis [
16] are used as input to the encounter simulations.
Section 2 provides a background of ADS-B message drop out and introduces a well clear metric for evaluating self-separation criteria of UAS.
Section 3 describes the experimental design, assumptions and simulation methods.
Section 4 discusses the simulation results and
Section 5 relates the drop-out to the system level failure, ties to potential technical reasons and discusses how ATC and aerospace are impacted by the occurrence of drop-out.
2. Background of ADS-B Message Drop-Out and UAS Well Clear
As one of the fundamental components of NextGen, significant studies are ongoing on various aspects of ADS-B. This includes, but is not limited to, security and verification of messages [
17,
18,
19], experimental attack analysis [
20,
21,
22,
23,
24,
25], safety assessment [
26,
27,
28], etc. A handful of studies were found on 1090ES ADS-B data assessment [
8,
10,
12] describing the data integrity, accuracy, error detected, and potential risk. Busyairah et al. evaluate ADS-B messages collected from London Terminal Area Ground Receiver and describes an assessment framework [
26]. This framework provides an outline for evaluating 1090ES ADS-B data performance. This involves comparing onboard GPS data collected from British Airways with received ADS-B data from a ground station [
26]. This study showed that ADS-B message failed to update within a specified interval and also revealed that it failed to assign the correct navigation integrity category (NIC) and navigation accuracy category for position (NACp) values. Busyairah et al. [
12] also developed a generalized linear model to mathematically represent ADS-B message discontinuation.
2.1. UAT ADS-B Drop-Out
Our initial work as a part of the FAA ASSURE A6 surveillance criticality team [
13] studied drop-out in UAT ADS-B. The test data received from Grand Forks International Airport was in GDL-90 format. This is the format of the data interface to the serial communication and control panel ports of the Garmin AT UAT Data Link Sensor, model GDL 90 [
29]. A python module was developed to decode the archived data as defined in RTCA DO 282B [
30]. The anomalies revealed in a step-by-step assessment can be divided into five distinct categories namely dropout, missing payload, low confidence data, data jump, and altitude discrepancy [
15,
16]. A summary of the ADS-B message evaluation is provided in
Table 1International Civil Aviation Organization (ICAO) listed update rate as one of the important parameters to characterize the performance of any surveillance system [
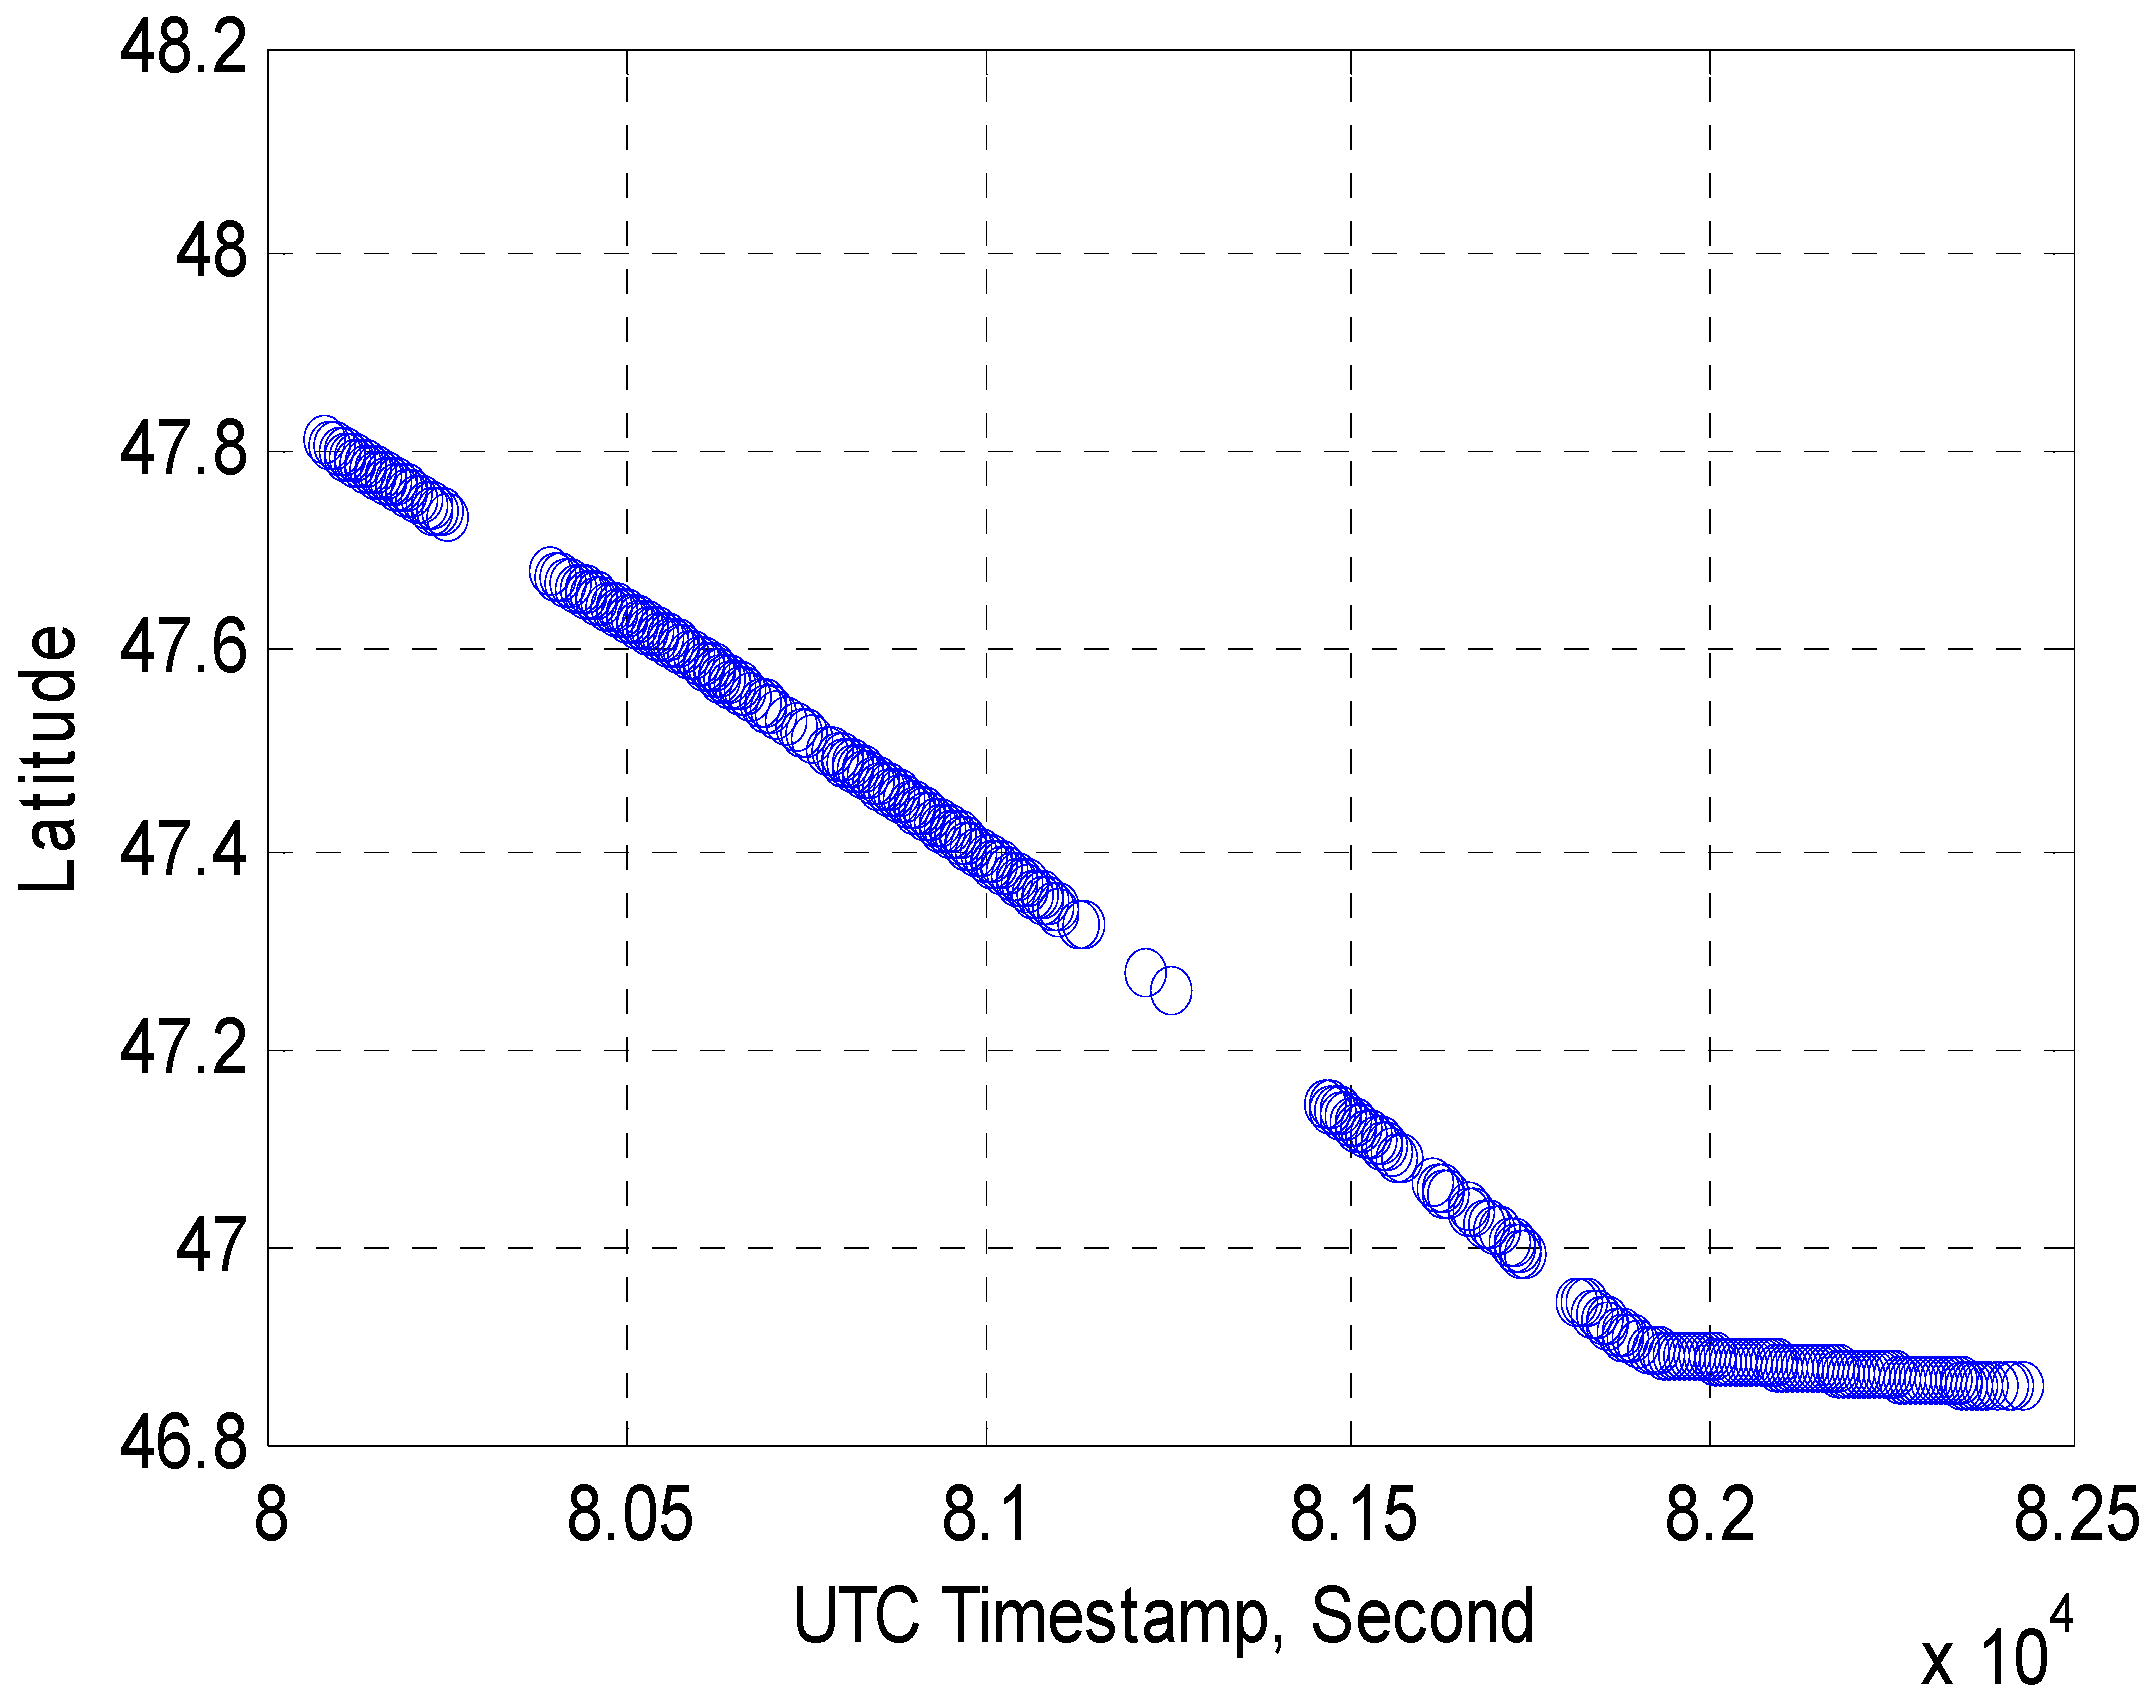
31]. ADS-B is envisioned to provide continuous surveillance and address the limitation of radar systems with a lower update rate. This is one of the most concerning issues, because it degrades the situational awareness and increases the risk, especially in a high-density airspace.
Figure 1 is a visual presentation of the discontinuation of update rate in a flight.
The continuity of the ADS-B system is measured in seconds at which rate the message received at the ground receiver. The continuity of the data stream is one of the crucial metrics for considering the performance of the surveillance system. The expected continuity or update rate for ADS-B according to ICAO [
31] is no more than 2 s, significantly faster than the radar system’s 4–15 s update rate.
2.2. UAS Well Clear
‘Well clear’ is the separation standard for UAS similar to the separation standard of manned aircraft, named separation minima [
32]. The concept of well clear has been proposed as an airborne separation standard to which an unmanned DAA system must adhere to in order to maintain self-separation [
33]. Well clear is the condition of maintaining a safe distance from other aircraft so that it would not be the cause of initiate a collision avoidance maneuver by either aircraft. The quantitative definition of well clear separation minima is based on acceptable collision risks in consideration of its operating environment and compatibility with aircraft collision avoidance systems [
7]. Horizontal separation minima are based on the time-based parameter, and the vertical separation minima are based on distance.
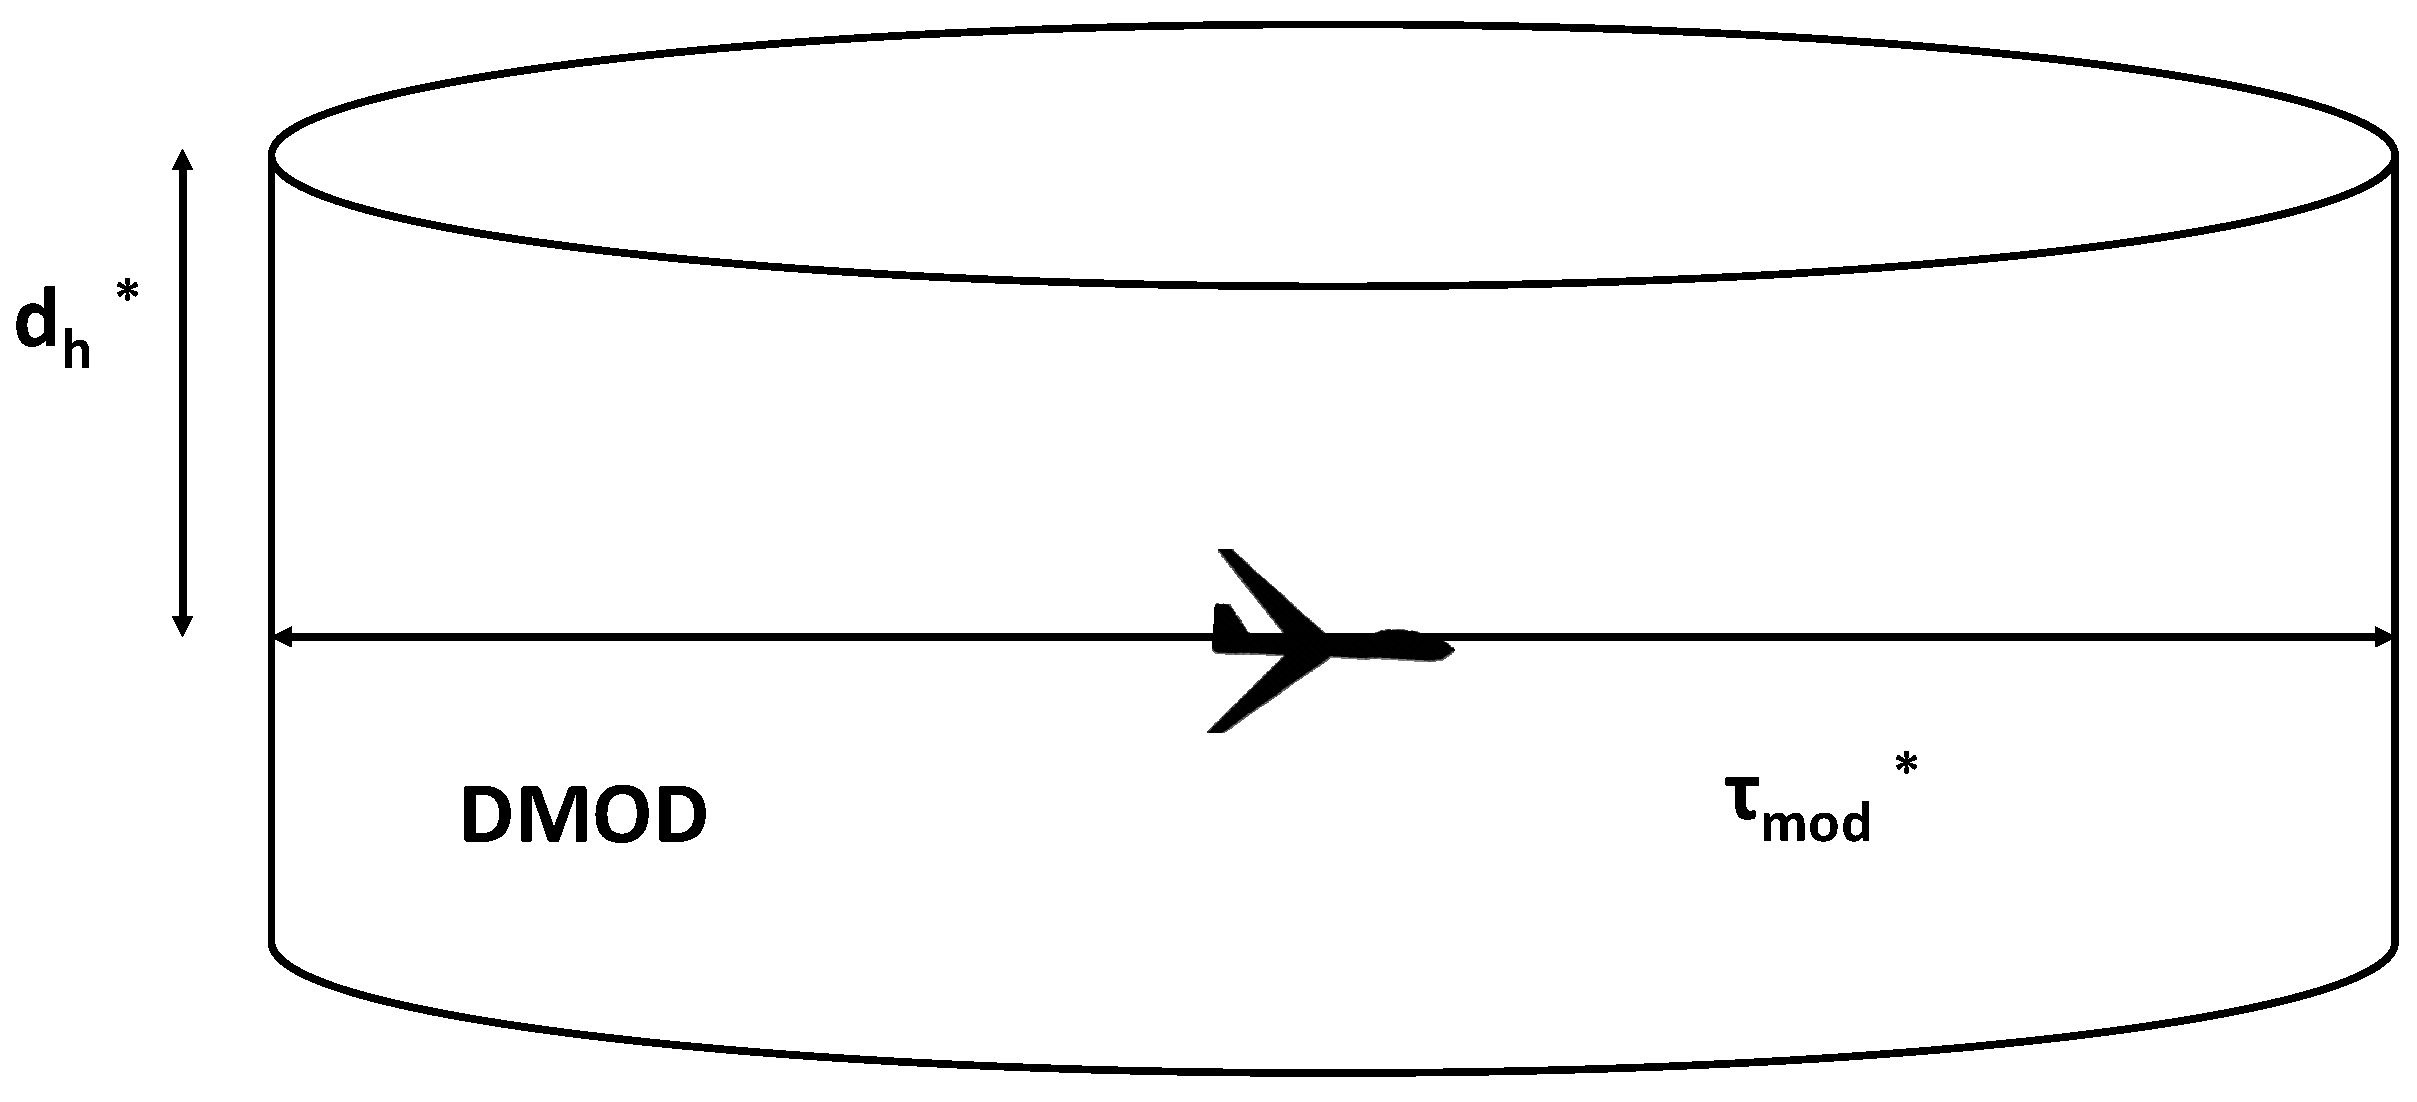
Figure 2 illustrates the well clear volume.
Well clear thresholds are estimated from the recommendation made by Special Committee-228 [
7] and the FAA stands with the recommendation with a slight modification of vertical separation changing vertical separation thresholds from 750 feet to 450 feet.
Table 2 represents the well-clear definition thresholds.
Hence, the loss of well clear (LoWC) can be defined as the situation where UAS is near with another aircraft such that the following three conditions are concurrently true:
Current vertical distance,
Horizontal miss distance, HMD ≤ HMD*
Tau modification,
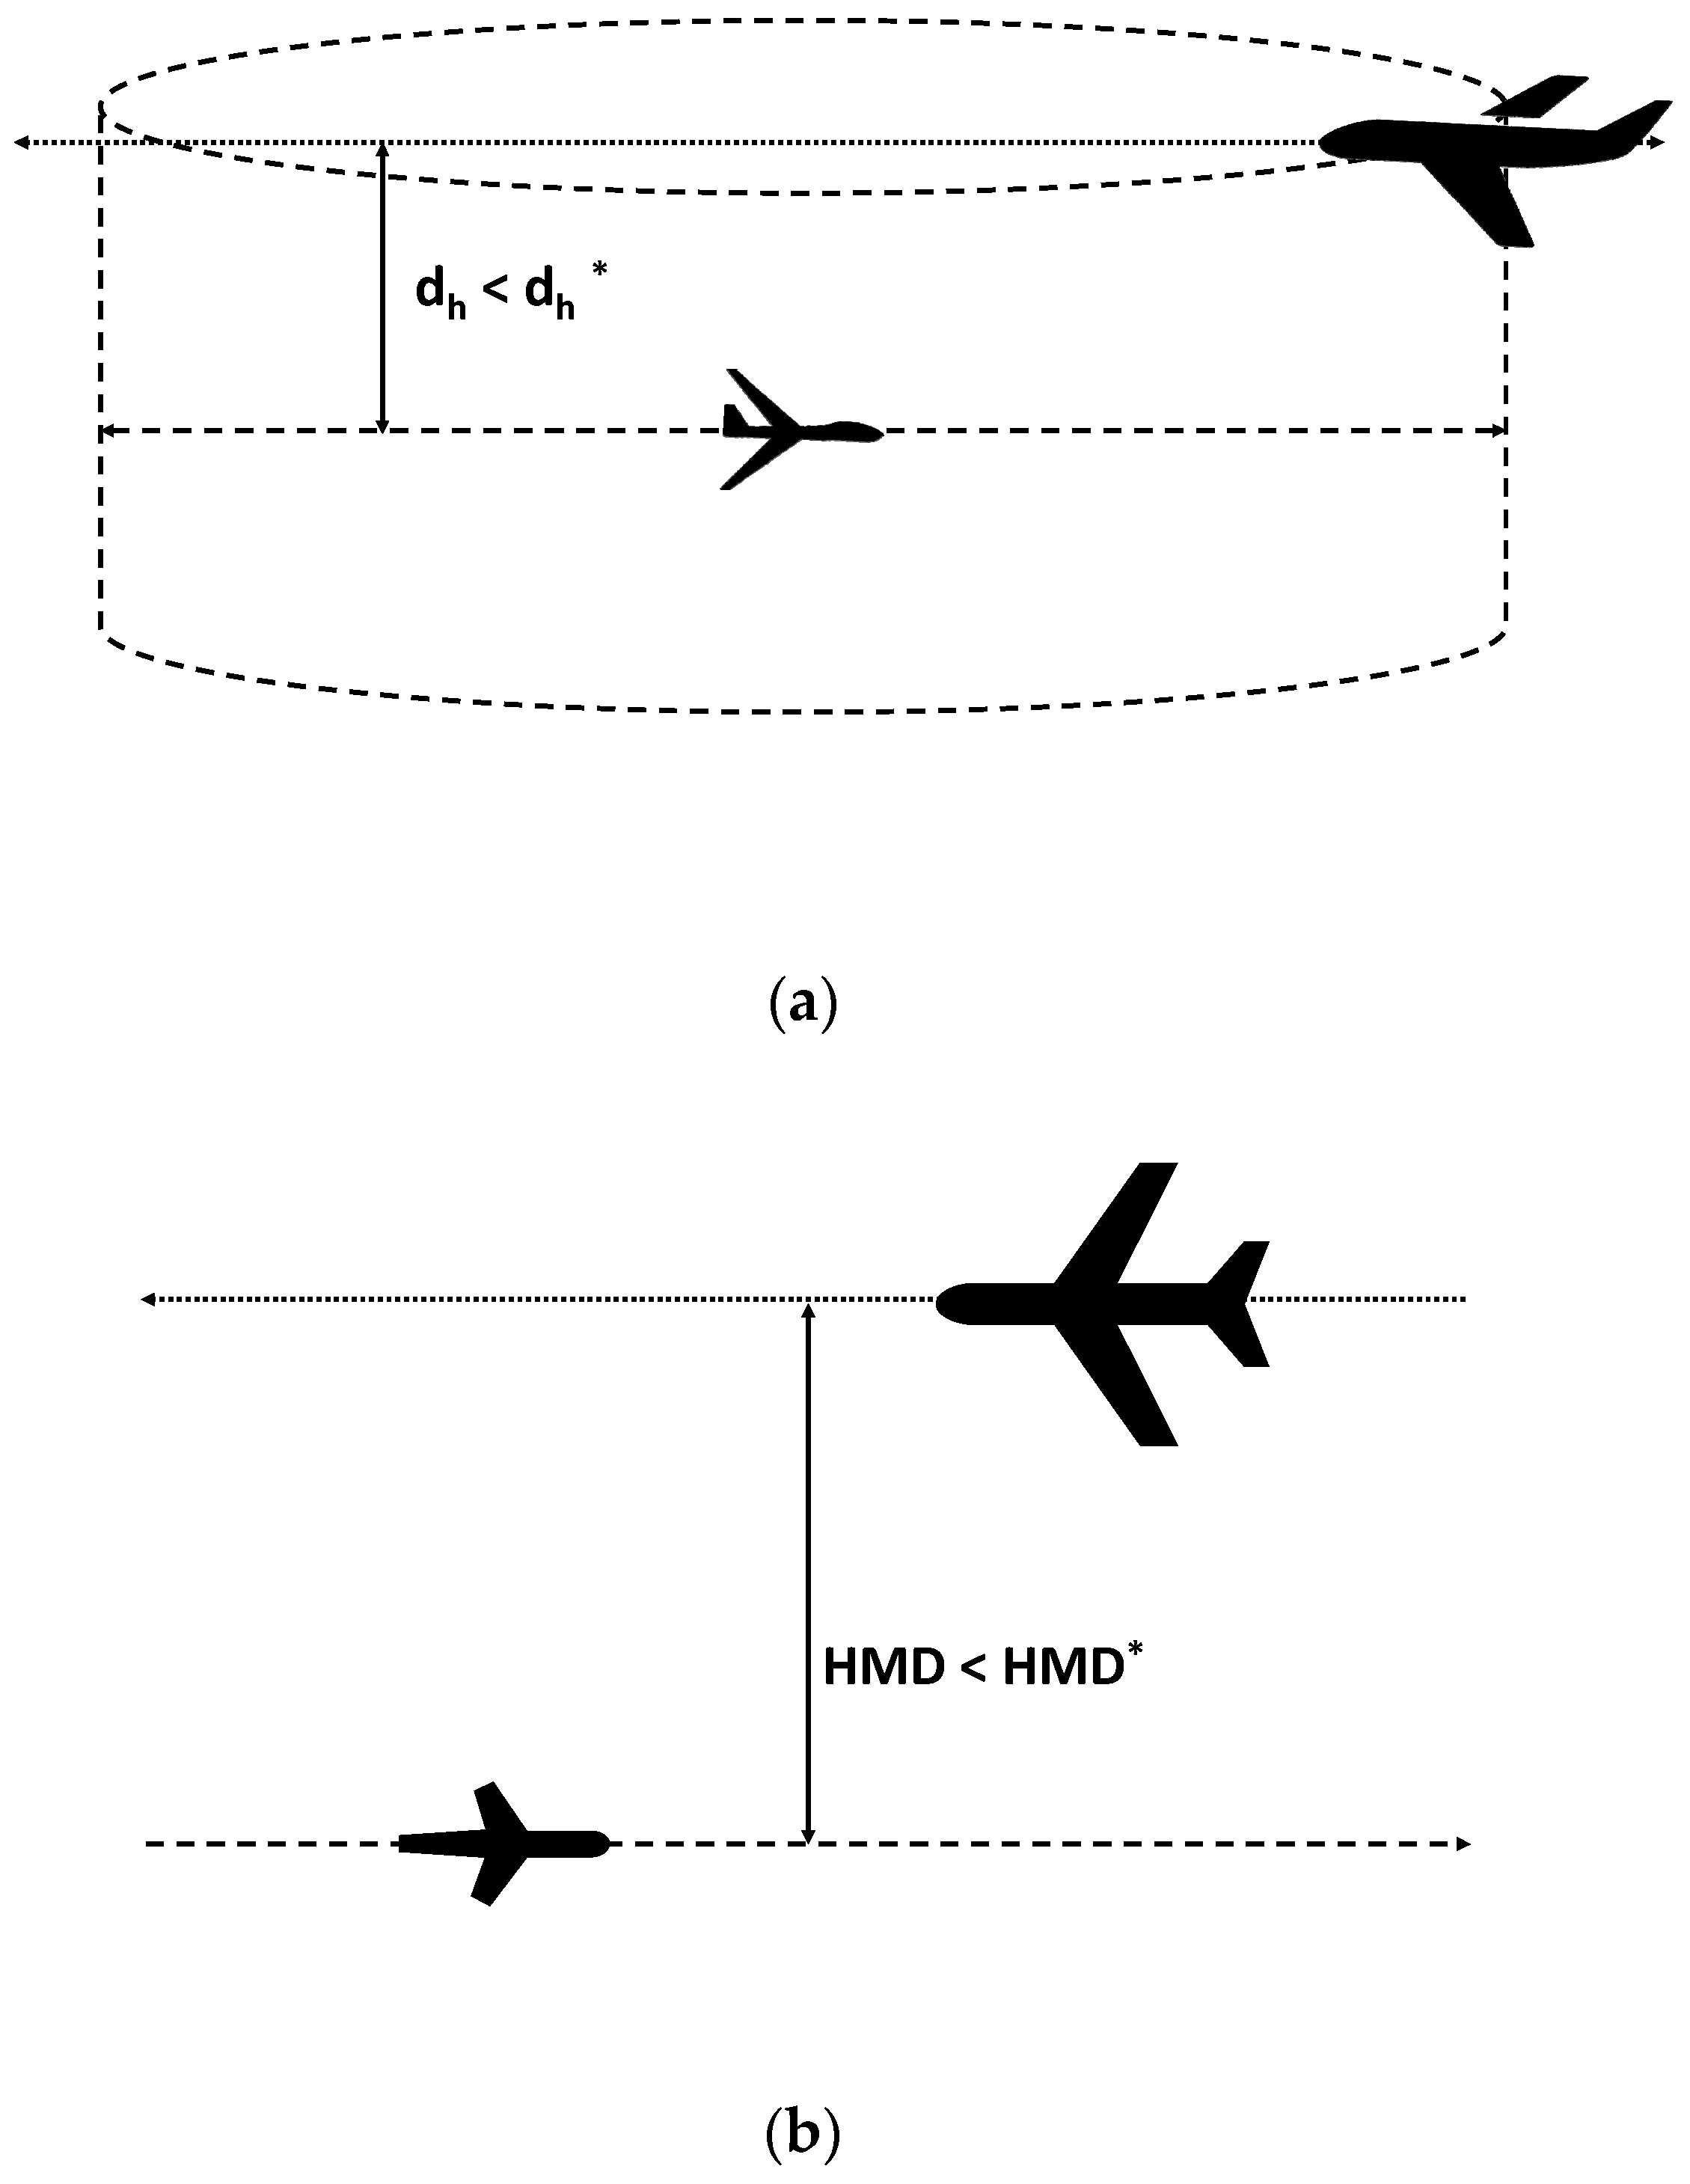
The loss of well clear in an encounter scenario is represented in
Figure 3. Two different views are provided to distinguish horizontal well clear and vertical well clear.
The DAIDALUS [
33] DAA alerting criteria are based on “time to loss of well clear”. The well-clear detection logic is implemented to determine the time to loss of well clear with a look-ahead time. Look-ahead time is a time interval [
34] which is used to determine if two aircraft conflict within that time considering constant velocity.
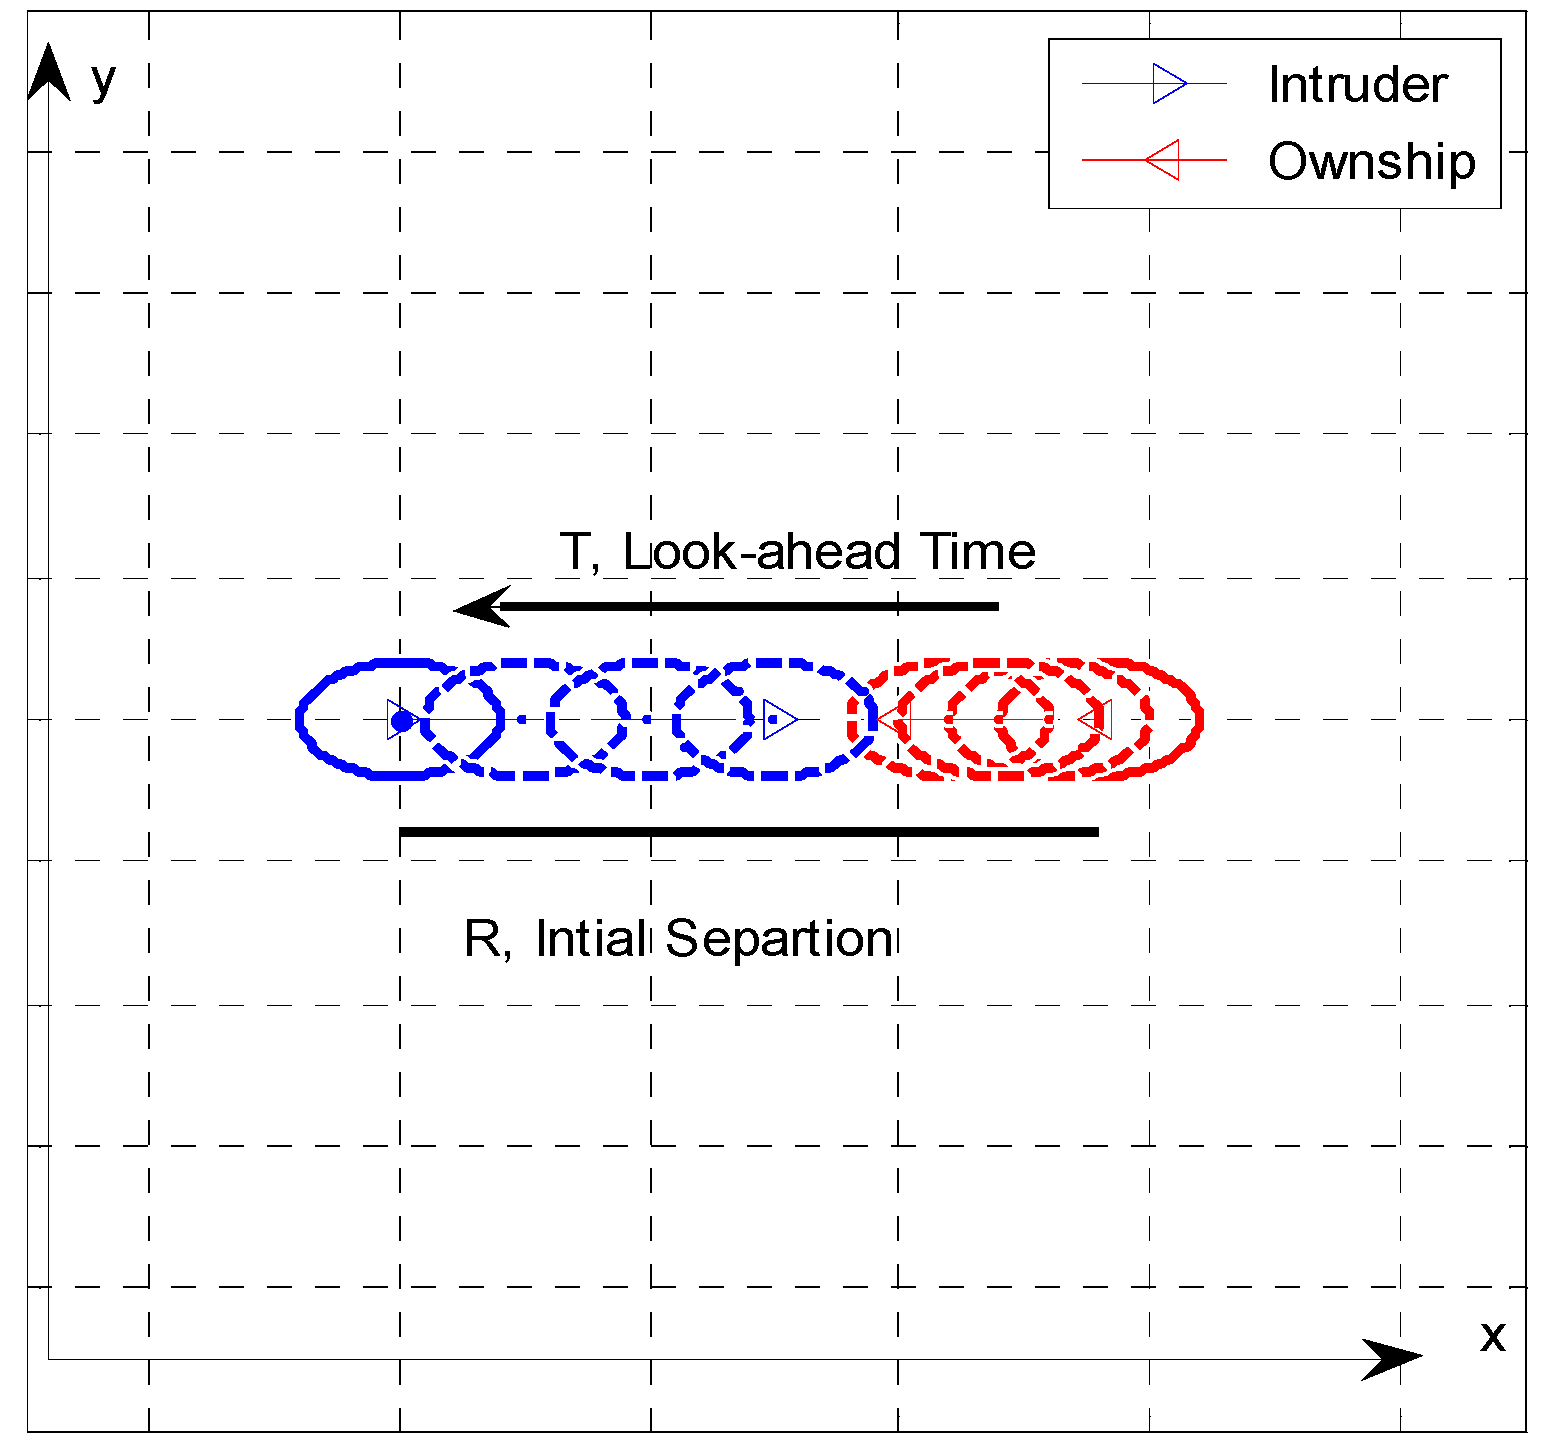
Figure 4 is a simple illustration of time to loss of well clear in an encounter.
The predictions made by the detection logic are based on pairwise, constant-velocity projections. The logic returns empty if there is no loss of well clear within the look-ahead time. The time to loss of well clear is used to alert the DAA pilot about potential risk level.
Table 3 shows the value of different alerting criteria based on time to loss of well clear.
Two different alerts are triggered; one is corrective, and the other is a warning [
35]. The DAA corrective alert is intended to get the pilot in command’s (PIC) attention, get the PIC to determine a needed maneuver, start PIC coordination with ATC, and is the initiating point at which maneuvering will likely be started based on PIC judgment [
36]. The DAA warning alert is intended to inform the PIC that immediate action is required to maintain well clear.
3. Simulation Scenario and Assumptions
The goal of this analysis is to estimate the number of alerts triggered in en-route airspace given no ATC interaction and ADS-B as a single surveillance mean onboard. To accomplish this, a model is constructed from the perspective of two flights—UAS as ownship and manned aircraft as intruders—such that the UAS will experience a loss of well clear T seconds after the beginning of the simulation with complete certainty in the absence of a collision avoidance maneuver and ATC interaction. A Monte Carlo simulation approach has been adopted to resolve what happens with different update rate occurs at time =
t. The key feature of this simulation is that the input, i.e., the update rate is derived from the actual ADS-B data from manned aircraft. Hence, it exhibits the actual ADS-B update rate properties in the current airspace. The function detection_WCV [
7] was used to calculate the time to loss of well clear. This function takes the relative position and velocity of the aircraft and a look-ahead time interval [
B,
T] as inputs and returns a time interval [
tin,
tout] within [
B,
T].
B is typically 0 and
T represents the look-ahead time. If
tin ≤
tout, the t
in represents time to LoWC and t
out represents the time to exit LoWC, assuming constant velocity. The returned time interval is empty, i.e.,
tin >
tout, if the aircraft are not predicted to be a LoWC state within the interval [
B,
T]. The complete description of the logic can be found in [
33].
3.1. Encounter Generation
A constant velocity model is assumed to generate the encounters. The velocity can be represented by
where
Gs is ground speed,
β is the bearing, and
vv is the vertical speed. The ownship position is known as well as the velocity. To encode the encounter three other parameters are utilized. They are:
Look-ahead time, T. This is the time after which the UAS will experience a loss of well clear assuming continues velocity projection;
R, the relative distance between two aircraft at the beginning of the simulation and;
θ, the angle of approach at the well clear volume.
Therefore, using these parameters several encounter scenarios can be generated. The model can be described as
Figure 5 illustrates a simple head-to-head encounter in 2-D plan.
Using a constant-velocity model, two most common scenarios; head-to-head and overtaking were generated for this study. Hence, θ, the angle of approach will be 0 and 180 consecutively.
3.2. Input Data Generation
The empirical data utilized in this study came from our previous studies [
15,
16] and transmitted from actual ADS-B from the manned aircraft. A total of 12,852,609 messages archived though four weeks were analyzed. The preliminary analysis of the test data demonstrates that approximately 67.51% of the messages were updated within the specified update rate. Dropouts were those 32.49% instances where the update rate is greater than or equal to 3 s.
Table 4 illustrates the update rate category based on the duration of update interval. The frequency of each drop-out occurrence was calculated based on the total message received. The update rate categorized into eight different groups and the frequency of each group’s dropout occurrence is provided in the
Table 4.
As the frequency of occurring a Group 7 drop-out 7.3177 × 10⁻⁵, to achieve desired level accuracy the number of runs must be 105. An update rate matrix is created based on the frequency of drop-out on our datasets.
3.3. Simulation Assumptions
The horizontal velocity for the manned aircraft is 200 knots and the UAS is 80 knots, and these are kept constant. According to the US Department of Defense (DoD), for a small UAS, the maximum airspeed must not exceed 100 knots [
37], we arbitrarily chose the value as 80 knots. The values chosen are meant to be representative velocities for each of the aircraft. Both aircraft are assumed to fly a level flight. As the detection logic predicts the LoWC within look-ahead time, three different look-ahead times were used to study the severity of dropout duration. The first look-ahead time (
T) chosen was 180 s and the second and the third look-ahead times were 120 s and 60 s, respectively. The different time windows were chosen to mimic the situation where drop-out occurs at different times. Each simulation trial consists of one encounter that may experience drop-out and alert will be generated given no air traffic control intervention. Also, it assumed ADS-B as a sole surveillance mean which implies no other traffic data can be obtained if the onboard ADS-B surveillance system fails. Each simulation runs as follows:
Initialize ownship and intruder position, starts calculating with constant velocity projection
At T, insert the update rate. Note that, the update rate might be a drop-out depending on the assigned probability
If update rate inserted > T, consider the loss of well clear
If tloss ≤ 55 s at the immediate step, consider count an alert either corrective (1 or 2) or warning (3 or 4) depending on the time to loss of well clear value otherwise continue
If an alert is found, terminate run and go back to Step i.
DAA computer discards an aircraft as a potential threat if the data is not updated for a certain time-period. This points to the fact that in the event of drop-out, a potential threat might be excluded and will not be considered as a threat even when the threat may still be present. This leads to the generation of a sudden alert after regaining the specified update rate. Therefore, these alerts are called ‘drop-out affected alert’ in the analysis. To further understand the effect of alert, the corrective and warning alerts are categorized into two types based on how much time has left for the pilot to respond. Total response time is a measure of the time it takes a UAS operator to upload a final maneuver resolution to the aircraft in response to a traffic alert [
38]. Studies [
38,
39] show that the total response time depends on the UAS DAA display as well as the alerts, inter-action time with ATC, and pilot workload. DAA MOPS [
7] specifies minimum time for a pilot to respond to an alert is approximately 15 s during a corrective alert and approximately 10 s during a warning alert. The greater the time window i.e., time to loss of well clear, the greater the response time. Hence, the severity increases as the time to loss of well clear decreases. This time is calculated as the time between the initial appearance of the traffic alert and the final maneuver upload to the UAS. The classification of alert based on the response time is illustrated in
Table 5.
A single Monte Carlo simulation with 100,000 trials is carried out. According to the encounter setup, drop-out will occur at the beginning of the look-ahead time. The number of alerts triggered is determined. The alert count is based on the ‘time to loss of well clear’. If the time to loss of well clear is less than or equal to the alert threshold, the associate alert is assumed to be triggered. For example, if the ‘time to loss of well clear’ is less than 25 s, a warning alert is counted. If the ‘time to loss of well clear’ is greater than 55 s, it is counted as a successful alert as it would eventually generate an alert on time.
When any dropout duration is higher than the look-ahead time, those are automatically considered as the loss of well clear, as no information is available over the look-ahead time. In the event of data loss, the DAA logic does not predict the encounter in a timely manner. This could lead to an abrupt maneuver of the ownship to avoid a potential well clear violation.
4. Results and Analysis
The number of alerts triggered in three different simulations is provided in
Table 6. An alert is counted only when
tloss ≤55 s at the subsequent step after the update rate is inserted. As the look-ahead time decreases the number of warning alerts increases and successful alert number decreases. If there were no drop-outs, considering continuous velocity projection all the alerts triggered would be corrective, as DAA would detect the intruder at the appropriate time.
Simulation results show that most of the alerts generated are corrective alerts. Only a small number of runs created a loss of well clear scenario. Also, as the look-ahead time decreases the number of alerts triggered increases. The change in the look-ahead time allowed to visualize the situation the drop-out would take place at a different time. As stated earlier, if after inserting the update rate no alert is generated, it is assumed to a successful alert generation event. This indicates the ownship will experience an alert which is not affected by a drop-out.
Table 7 provides the overall statistics of the simulation.
The result from
Table 7 indicates that, the alerts affected by drop-out as well as by the encounter geometry. The number of alerts increase when the look-ahead time decrease for both scenarios. For the overtaking, the number of alerts generated is higher than a head-to-head encounter scenario for same look-ahead time. In cases where UAS will be overtaken by manned aircraft, drop-out will affect the UAS safety more severely.
Hazard analyses are performed to identify and define hazardous conditions/risks for their elimination or control. One of the crucial steps is to perform a risk assessment of the severity of consequence and likelihood of occurrence. To assess risk, the FAA and other organizations use safety risk management (SRM), which is a process to analyze, assess, and accept risk for designs, policies, and many other aspects. A risk matrix is one of the tools that helps quantify the amount of risk. The risk matrix considers the severity and likelihood of an event, then using the combination of both interactions, assigns a rating in terms of risk: unacceptable risk, acceptable risk with mitigation, and acceptable risk.
A risk matrix for dropout was created based on the percent of dropout that occurred in the dataset and the value of time to loss of well clear. The likelihood and the severity definition developed for the dropout hazard assessment along with the FAA likelihood definitions, the FAA severity definitions are described in
Table 8 and
Table 9.
Table 8 is derived from the
FAA System Safety Handbook [
40].
The severity of the alert was decided based on the ‘time to loss of well clear’,
tloss value.
Table 9 summarizes the qualitative definition of the severity level and provides a quantitative measure based on the time to loss of well clear.
A value of
tloss = 55 s will trigger a corrective alert where as a value of
tloss = 26 s will also trigger a corrective alert, but the risk associated with both alerts is not the same. The severity is dependent on the total response time [
39] the pilot will have at the time alert. To quantify the severity based on the
tloss, the response time was utilized. The qualitative severity definition is derived from the FAA system safety handbook and the quantitative value was chosen based on the previous study and DAA MOPS. The severity is minimal if the time to loss of well clear is greater than 55 s which implies a successful alert generation. The severity is minor if during a corrective alert the time to loss of well clear provides at least 15 s to the pilot to respond. The severity is considered major if
tloss allows the pilot maximum of 15 s to respond during the corrective alert. If the time to loss of well clear is less than or equal to 25 s, the severity increases and in the worst case can deteriorate the safe flight conditions. An event is categorized as catastrophic if the time to loss of well clear provides less than or equal to 10 s response time to the pilot.
To generate the risk matrix, the first task is to calculate the probability of dropout affected alert. The probability of triggering an alert affected by drop-out is calculated using the following formula
This value represents, the probability of drop-out affected alert in terms of the simulation run. In order to scale them to flight hour, we calculated the total flight hour summing up the update rate. The probability of drop-out affected alert per flight hour is calculated by
The total flight hour for this simulation is 85.865 h.
Table 8 and
Table 9 provides the summary of dropout affected alert probability per flight hour as well as the probability from the number of runs.
From
Table 10, it can be seen that when the look-ahead time window is smaller, the probability of a severe alert increases. For a fixed look-ahead time, the number of corrective alerts generated is higher than the number of warning alerts generated.
Based on the definition, the number of events that generated an alert on different severity scale is placed on the risk matrix. The risk rating matrices for three different look-ahead times are represented through
Table 11,
Table 12,
Table 13,
Table 14,
Table 15 and
Table 16. Hence, the number of events placed on the matrix is based on the type of alert and their likelihood as described in
Table 17.
The green rectangles represent the acceptable risk, yellow rectangles represent acceptable risk with mitigation, the red rectangles represent unacceptable risk and bottom corner represents unacceptable with a single/common cause failure. As seen from the previous tables, when the look-ahead time decreases the number of cases in the yellow and red rectangles increases, i.e., severity increases. A small look-ahead time window made the DAA alert more severe, which indicates that the time at which the dropout occurred is crucial for alert.
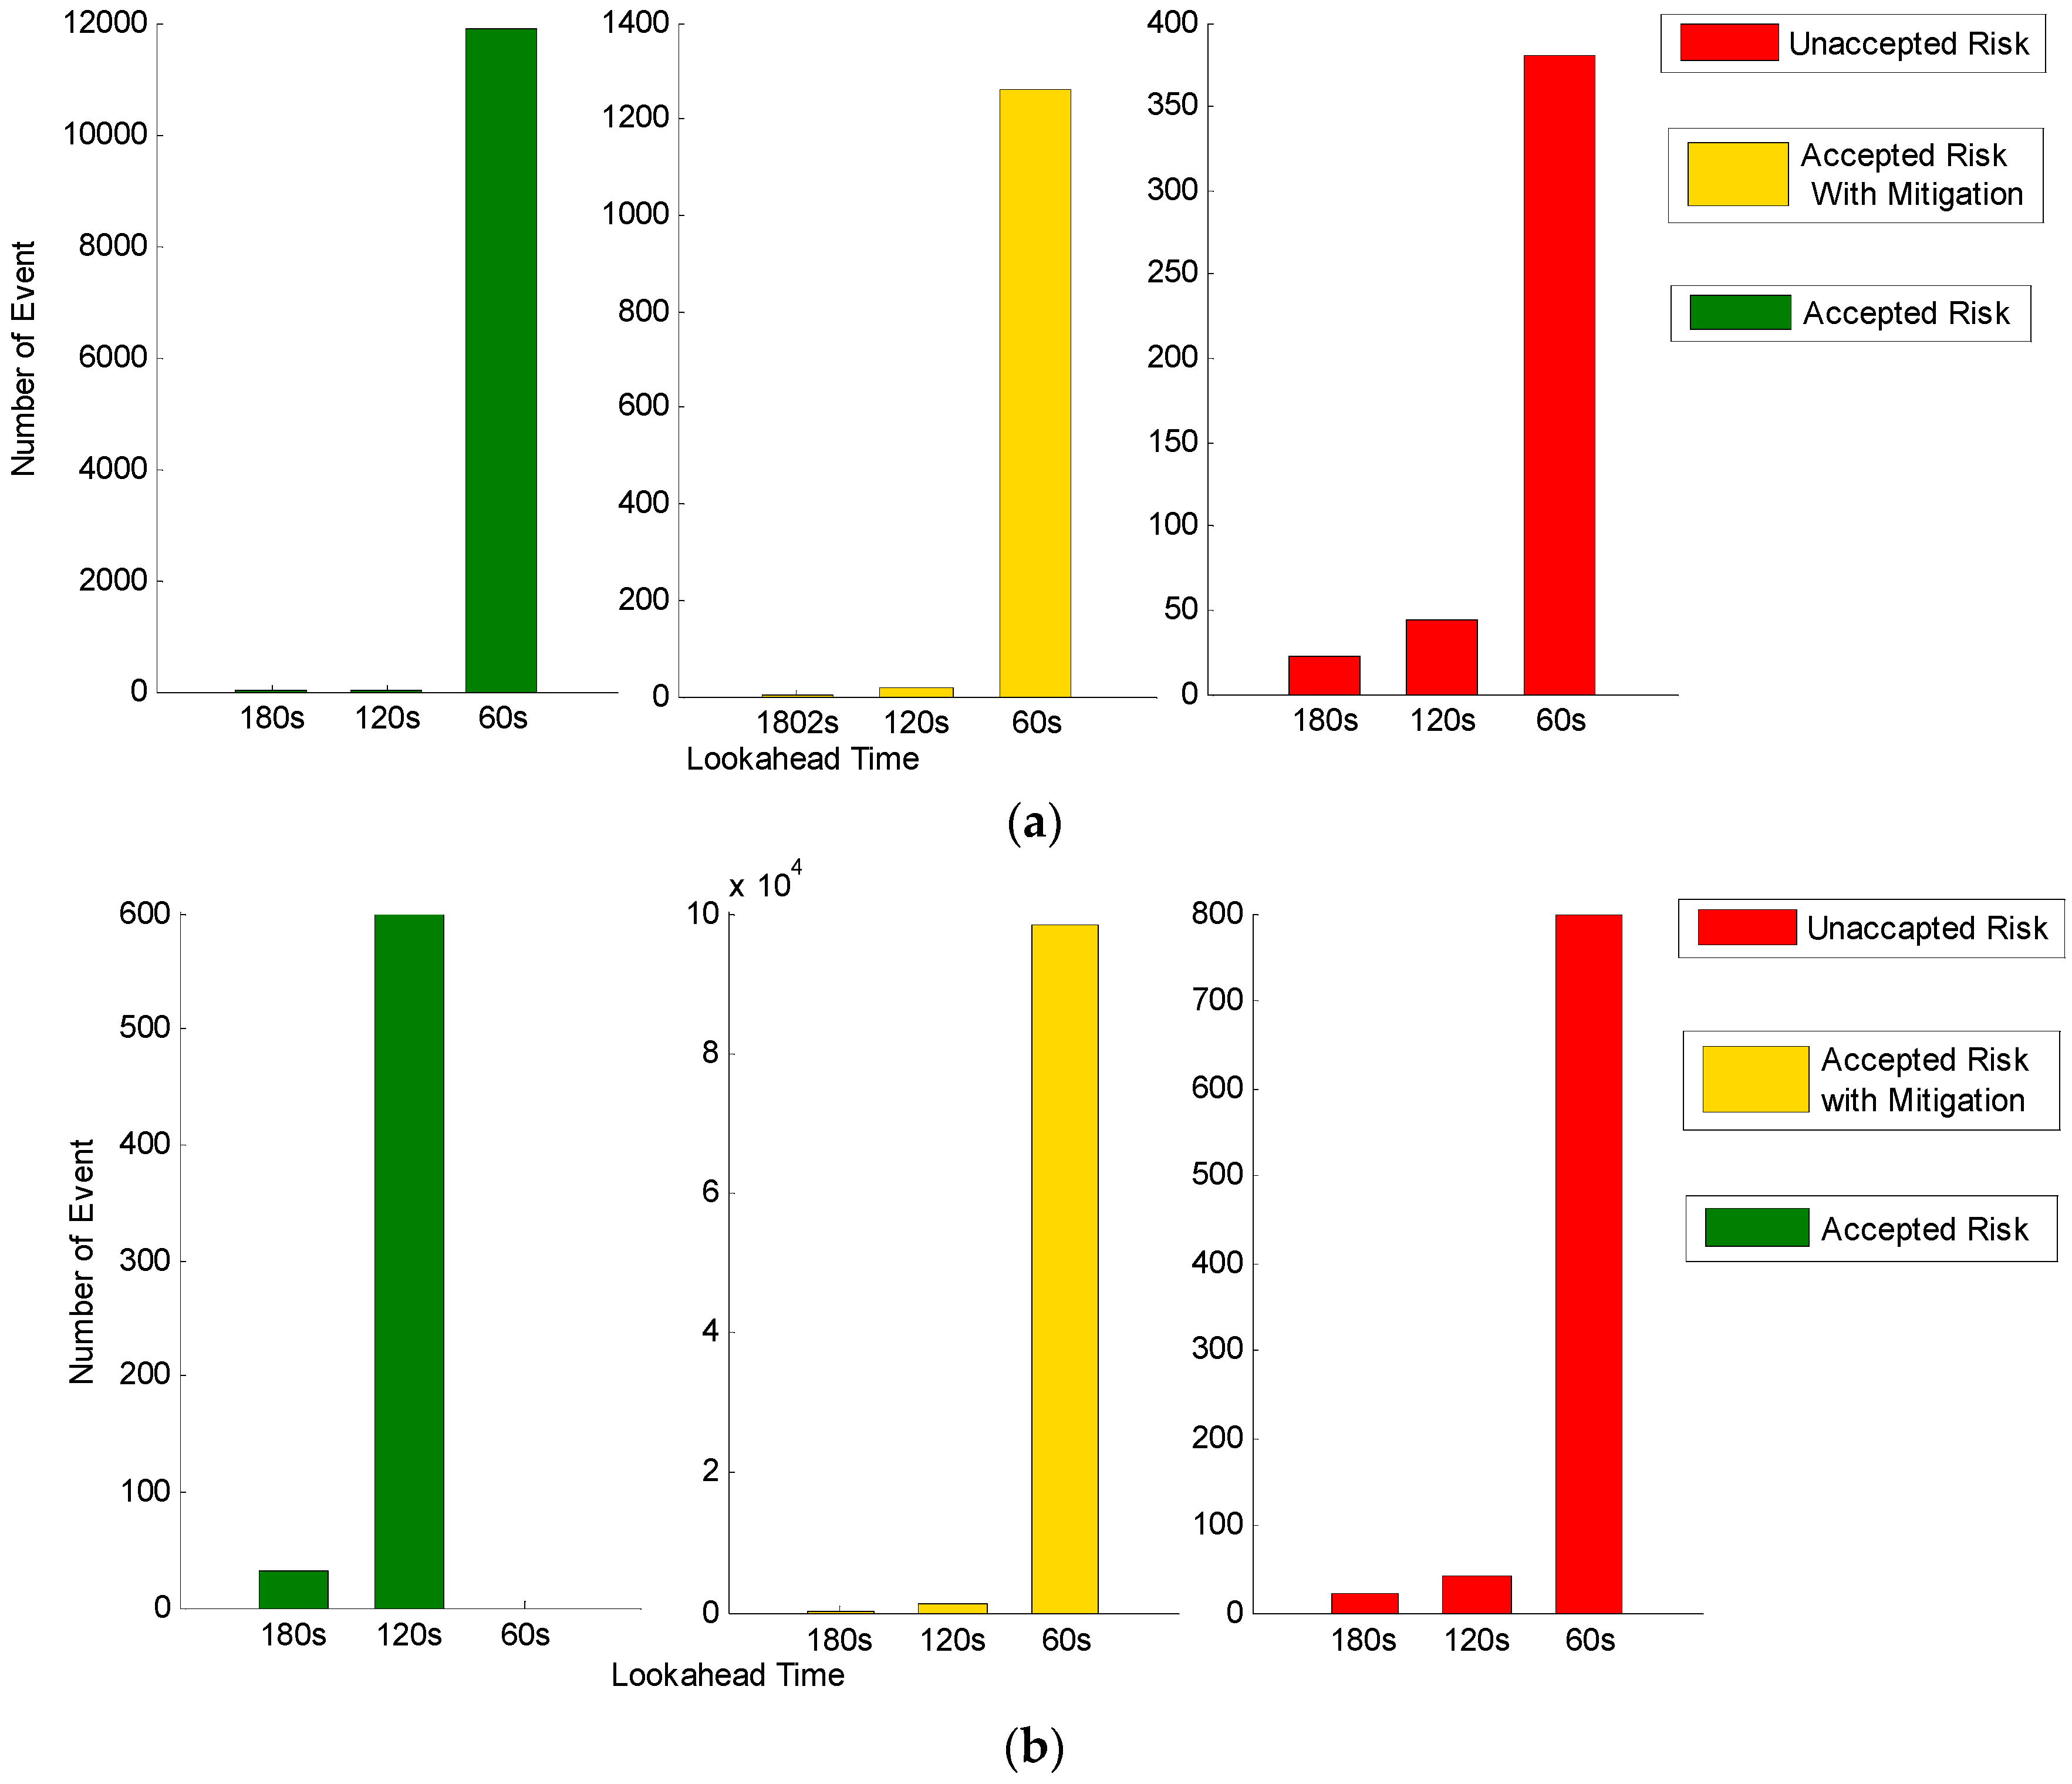
These results are examples of DAA alerting using ADS-B as a single means of surveillance. It should be noted DAA computer discards an aircraft as a potential threat if the data is not updated for a certain time period, and this time is defined by the user. This points to the fact that in the event of drop-out, a potential threat might be excluded and will not be considered as a threat even when the threat may still be present. This might lead to abrupt maneuvers when it reappears and in the worst-case scenario, a near midair collision. The change in risk with look-ahead time is illustrated in bar charts in
Figure 6. It shows that decreasing look-ahead time results in increasing the number of accepted risks with mitigation and unacceptable risk cases.
The highest number of events fall into the category of accepted risk with mitigation. With the provision of ATC interaction and possible multi-sensor fusion, these risk levels can be reduced in these cases. There are some risk events that fall under the category ‘unacceptable’, but the probability of events is in the order of 10−7 i.e., extremely remote.
6. Conclusions
This study made use of hypothetical encounter scenarios to quantify the risk of ADS-B dropout. The risk matrix established is based on simulation scenarios and represents the risk for three different scenarios studied. The results revealed that, with a lower look-ahead time, the severity of dropout increased. As the look-ahead time window decreases, time to loss of well clear changes which in turn changes the type of alert triggered. While a corrective alert needs subsequent action from the pilot in command, a warning alert demands immediate action. Thus, change in alert type caused by surveillance data loss degrades the situational awareness. The risk matrix also indicates, with a longer look-ahead time window, the numbers of unacceptable risk cases were less. A longer duration of dropout produces a higher severity risk than the shorter duration dropout. Results also show that the encounter geometry has a significant role in the alert generation and certain geometries might be more vulnerable. In our study, drop-outs present a greater threat to an overtaking encounter. In the absence of the ‘human eye’ onboard, it is important to have a more robust and effective ADS-B system in terms of continuity, availability, and integrity. This is especially true for the class 1 DAA system, where the surveillance information received from ADS-B is utilized by DAIDALUS to trigger alerts. Although class 1 DAA will have air to air radar for noncooperative traffic along with Mode S surveillance systems to provide control of the airspace, the data ADS-B utilizes necessitates more resilience to signal and message loss to be effective. Further analysis needs to be carried out for varying encounter geometries and incorporating the traffic density. This way, the overall airspace risk due to ADS-B message drop-out can be visualized.
