Article

On Linking of Task Analysis in the HRA Procedure: The Case of HRA in Offshore Drilling Activities

1
Department of Geoscience and Petroleum, Faculty of Engineering, Norwegian University of Science and Technology, NO-7491 Trondheim, Norway
2
Department of Mechanical and Industrial Engineering, Faculty of Engineering, Norwegian University of Science and Technology, NO-7491 Trondheim, Norway
*
Author to whom correspondence should be addressed.
Safety 2018, 4(3), 39; https://doi.org/10.3390/safety4030039
Submission received: 6 July 2018 / Revised: 4 September 2018 / Accepted: 4 September 2018 / Published: 11 September 2018

Abstract

:
Human reliability analysis (HRA) has become an increasingly important element in many industries for the purpose of risk management and major accident prevention; for example, recently to perform and maintain probabilistic risk assessments of offshore drilling activities, where human reliability plays a vital role. HRA experience studies, however, continue to warn about potential serious quality assurance issues associated with HRA methods, such as too much variability in comparable analysis results between analysts. A literature review highlights that this lack of HRA consistency can be traced in part to the HRA procedure and a lack of explicit application of task analysis relevant to a wide set of activity task requirements. As such, the need for early identification of and consistent focus on important human performance factors among analysts may suffer, and consequently, so does the ability to achieve continuous enhancements of the safety level related to offshore drilling activities. In this article, we propose a method that clarifies a drilling HRA procedure. More precisely, this article presents a novel method for the explicit integration of a generic task analysis framework into the probabilistic basis of a drilling HRA method. The method is developed and demonstrated under specific considerations of multidisciplinary task and well safety analysis, using well accident data, an HRA causal model, and principles of barrier management in offshore regulations to secure an acceptable risk level in the activities from its application.

1. Introduction

Human reliability analysis (HRA) is becoming increasingly important as a tool for risk control in activities that have catastrophic potential, such as nuclear power generation and offshore drilling. The main purpose of HRA of activities is to identify and evaluate the key human behaviour-oriented risk factors that concern major accident prevention for any operator-intensive system under different operational modes. An offshore operating company may typically employ HRA during the planning and follow-up of drilling activities to control the blowout risk associated with interactions among service providers [1]. In this case, HRA could be considered critical to assist an operator to maintain two barriers during drilling operations [2], and thereby to provide an acceptable level of safety as stipulated by society [3]. As an example, there are requirements for the driller to manually activate the blowout preventer (BOP), a main well safety barrier, during operations. The need to activate the BOP may occur relatively often, according to data [4]. Therefore, HRA helps to identify and evaluate the influences of human and organisational factors in drilling that nowadays may be considered a prerequisite to risk management.
This article comprises the last part in a trilogy [5] that proposes a new method for probabilistic risk assessment of offshore drilling activities [1]. This final part proposes that further improvements could be made to complete the procedure method; namely, for the procedure to explicitly describe the link in a HRA causal model to the performance of generic task analysis, since every well design is unique from Mother Nature’s side. As such, the objective of this procedure enhancement is to include an explicit link between the collective term of task analysis and HRA method to reduce the tendency for analyst-to-analyst variability, which remains a potential prevailing quality assurance issue in HRA [6,7,8,9,10].
HRA critique points to several factors that may help compromise HRA quality, which are also associated with task analysis and procedure. For example, NUREG-1792 [6] describes many HRA methods as merely quantification methods that need to be tailored to specific activity requirements. Even this may not be straightforward, since task requirements vary between different industries and workplace conditions [9]. Notably, different requirements can also be found within an industry, such as the risk assessment performed on the installation level versus the well system level [5].
The literature also includes discussions related to: (i) adopting knowledge about human behaviour that may be outdated or only applicable to simple tasks; (ii) the ‘black box’ nature of many causal models that make validation difficult; (iii) use of terminology not particularly suited for proactive human failure analysis [9,11,12,13]. Issues related to terminology may presumably also have links to the many knowledge domains found commingled in HRA methods, notably different human factor concepts in methods such as: (i) organisational and normal (sociotechnical) accidents [14,15]; (ii) heuristics and biases [16]; (iii) perceptual cycle and sensemaking [10,17]; and (iv) situation awareness [18,19].
Table 1 summarizes the literature relevant to categorical task analysis and HRA in the oil and gas industry. As shown, the literature may be classified with different causality focuses that, in turn, are organised in influence structures of one to four levels in total. The most popular framework today in task analysis, with adaptations also for oil and gas, are the human factor analysis and classification system (HFACS) [20,21], which is based on the energy defence model ([15], Figure 1 and Figure 6). HFACS is found adapted and demonstrated for several applications in the literature, among others, in oil refinery accident investigations [22]. HFACS represents a further development of Reason’s energy defence hierarchical causal classification scheme that also is adopted in the drilling HRA method [1]. Whereas HFACS also considers that preconditions for unsafe act as an extra level within the hierarchy, the drilling HRA includes a separate checklist developed with elements from social and cognitive psychology.
Interestingly, a keyword search in the Table 1 literature produced limited explicit discussion relevant to important offshore barrier management and failure analysis concepts such as performance influences and performance requirements. For example, in the Norwegian oil and gas industry, the safety authorities emphasise the explicit need for definition of the human, organizational, or technical barrier elements put in place to realise a main safety function in oil and gas activities [2]. The guideline suggests definitions in risk analysis based on a hierarchical breakdown as follows: (i) Main barrier function and subfunctions, which describe what is to be achieved by the barrier. (ii) Barrier elements, which describe equipment, personnel, and operations that are necessary to achieve the functions. (iii) Performance requirements, which describe measureable requirements about element properties. (iv) Performance-influencing factors (PIF), which describe identified conditions that may impair the ability of elements to perform as intended.
The literature review suggests three main practical requirements towards an approach to create a better link between task analyses, i.e., categorical human error analysis, and HRA, i.e., human error probability calculations, as follows:
  • Multidisciplinary. Relevant across popular human factors and engineering domains that study technical, organizational, and human factors in safety management.
  • Generic. Relevant across process control technologies and human behavioural constructs with levels for describing human task performance, i.e., relevant to both generic task analysis and to models of causality adopted in the quantification of human error probabilities in HRA.
  • Compliant. Relevant to governing barrier management principles in offshore regulations. An example is the Petroleum Safety Authority Norway (PSA) guideline to barrier management in the Norwegian offshore industry [2].
This article describes research performed to address the quality assurance issues in drilling HRA that may result from poor integration of task analysis in the drilling HRA procedure. The objective of this research is to improve well system safety through the consistent performance of HRA in probabilistic risk assessments of offshore drilling activities.
The structure of the article is as follows: Section 2 describes the approach developed, which includes selected steps in the procedure for the offshore drilling HRA method proposed [1]. The approach includes clarifications and modifications made to a generic hierarchical task analysis (HTA) framework relevant to the categorical evaluation of human task performance requirements in the HRA procedure. In Section 3, a drilling crew training scenario is used as a case study to realistically demonstrate and discuss an application of the approach. Finally, Section 4 includes concluding remarks from the research and suggestions for further work.

2. Proposed Task Analysis Method in HRA

This article represents the completion of previous work related to developing an explicit integration of generic task analysis within the procedure of the drilling probabilistic risk assessment (DPRA) method, which is proposed for risk control during offshore drilling activities [5]. The boxes shown with greyscale in Figure 1 illustrate the focus of the research presented in this article in the context of the DPRA method procedure [19]. From Figure 1, the task analysis follows a task screening process that identifies critical tasks to be analysed, and where the task analysis results are to be further used to update the DPRA causal model [1,19]. The adaptations are based on recognized concepts: (i) hierarchical task analysis (HTA) [39]; (ii) the structured analysis and design technique (SADT) [40] and basic concepts of failure analysis [41]; and (iii) quality function deployment (QFD) [42] and the analytical hierarchy process (AHP) [43]. A description of the key elements in the approach follows in the next sections.

2.1. Terminology in Task Analysis

A crisp definition of key concepts is crucial to the quality of any multidisciplinary risk analysis. This section introduces the main concepts for task analysis based on the article literature review and previous work on the integration of engineering failure and risk analysis with traditional human factor task analysis [5].
Task analysis may be defined as an analysis of human performance requirements, which if not accomplished in accordance with system requirements, may have adverse effects on system cost, reliability, efficiency, effectiveness, or safety ([44], p. 1). Task analysis aims to describe the manual and mental processes required for one or more operators to perform a required task [45]. The analysis typically results in a hierarchical representation of the steps required to perform a main task for which there is a desired outcome(s) and for which there is some lowest-level action, or interaction, between humans and machines, denoted as the human–machine interface (HMI).
Human (operator) error probability (HEP) and human failure events (HFE) are the main concepts in HRA, which generally refer to basic events in bowtie risk analysis. For example, NUREG/CR-6883 ([7], p. 27), similarly to NUREG/CR-6350 ([29], p. 2–10), states that “HEP is the probability of the HFE”, where HFE is defined as “a basic event that represents a failure or unavailability of a component, system, or function that is caused by human inaction or an inappropriate action”. Table 2 summarizes terms relevant to task analysis for offshore drilling activity.

2.2. HTA in Task Analysis

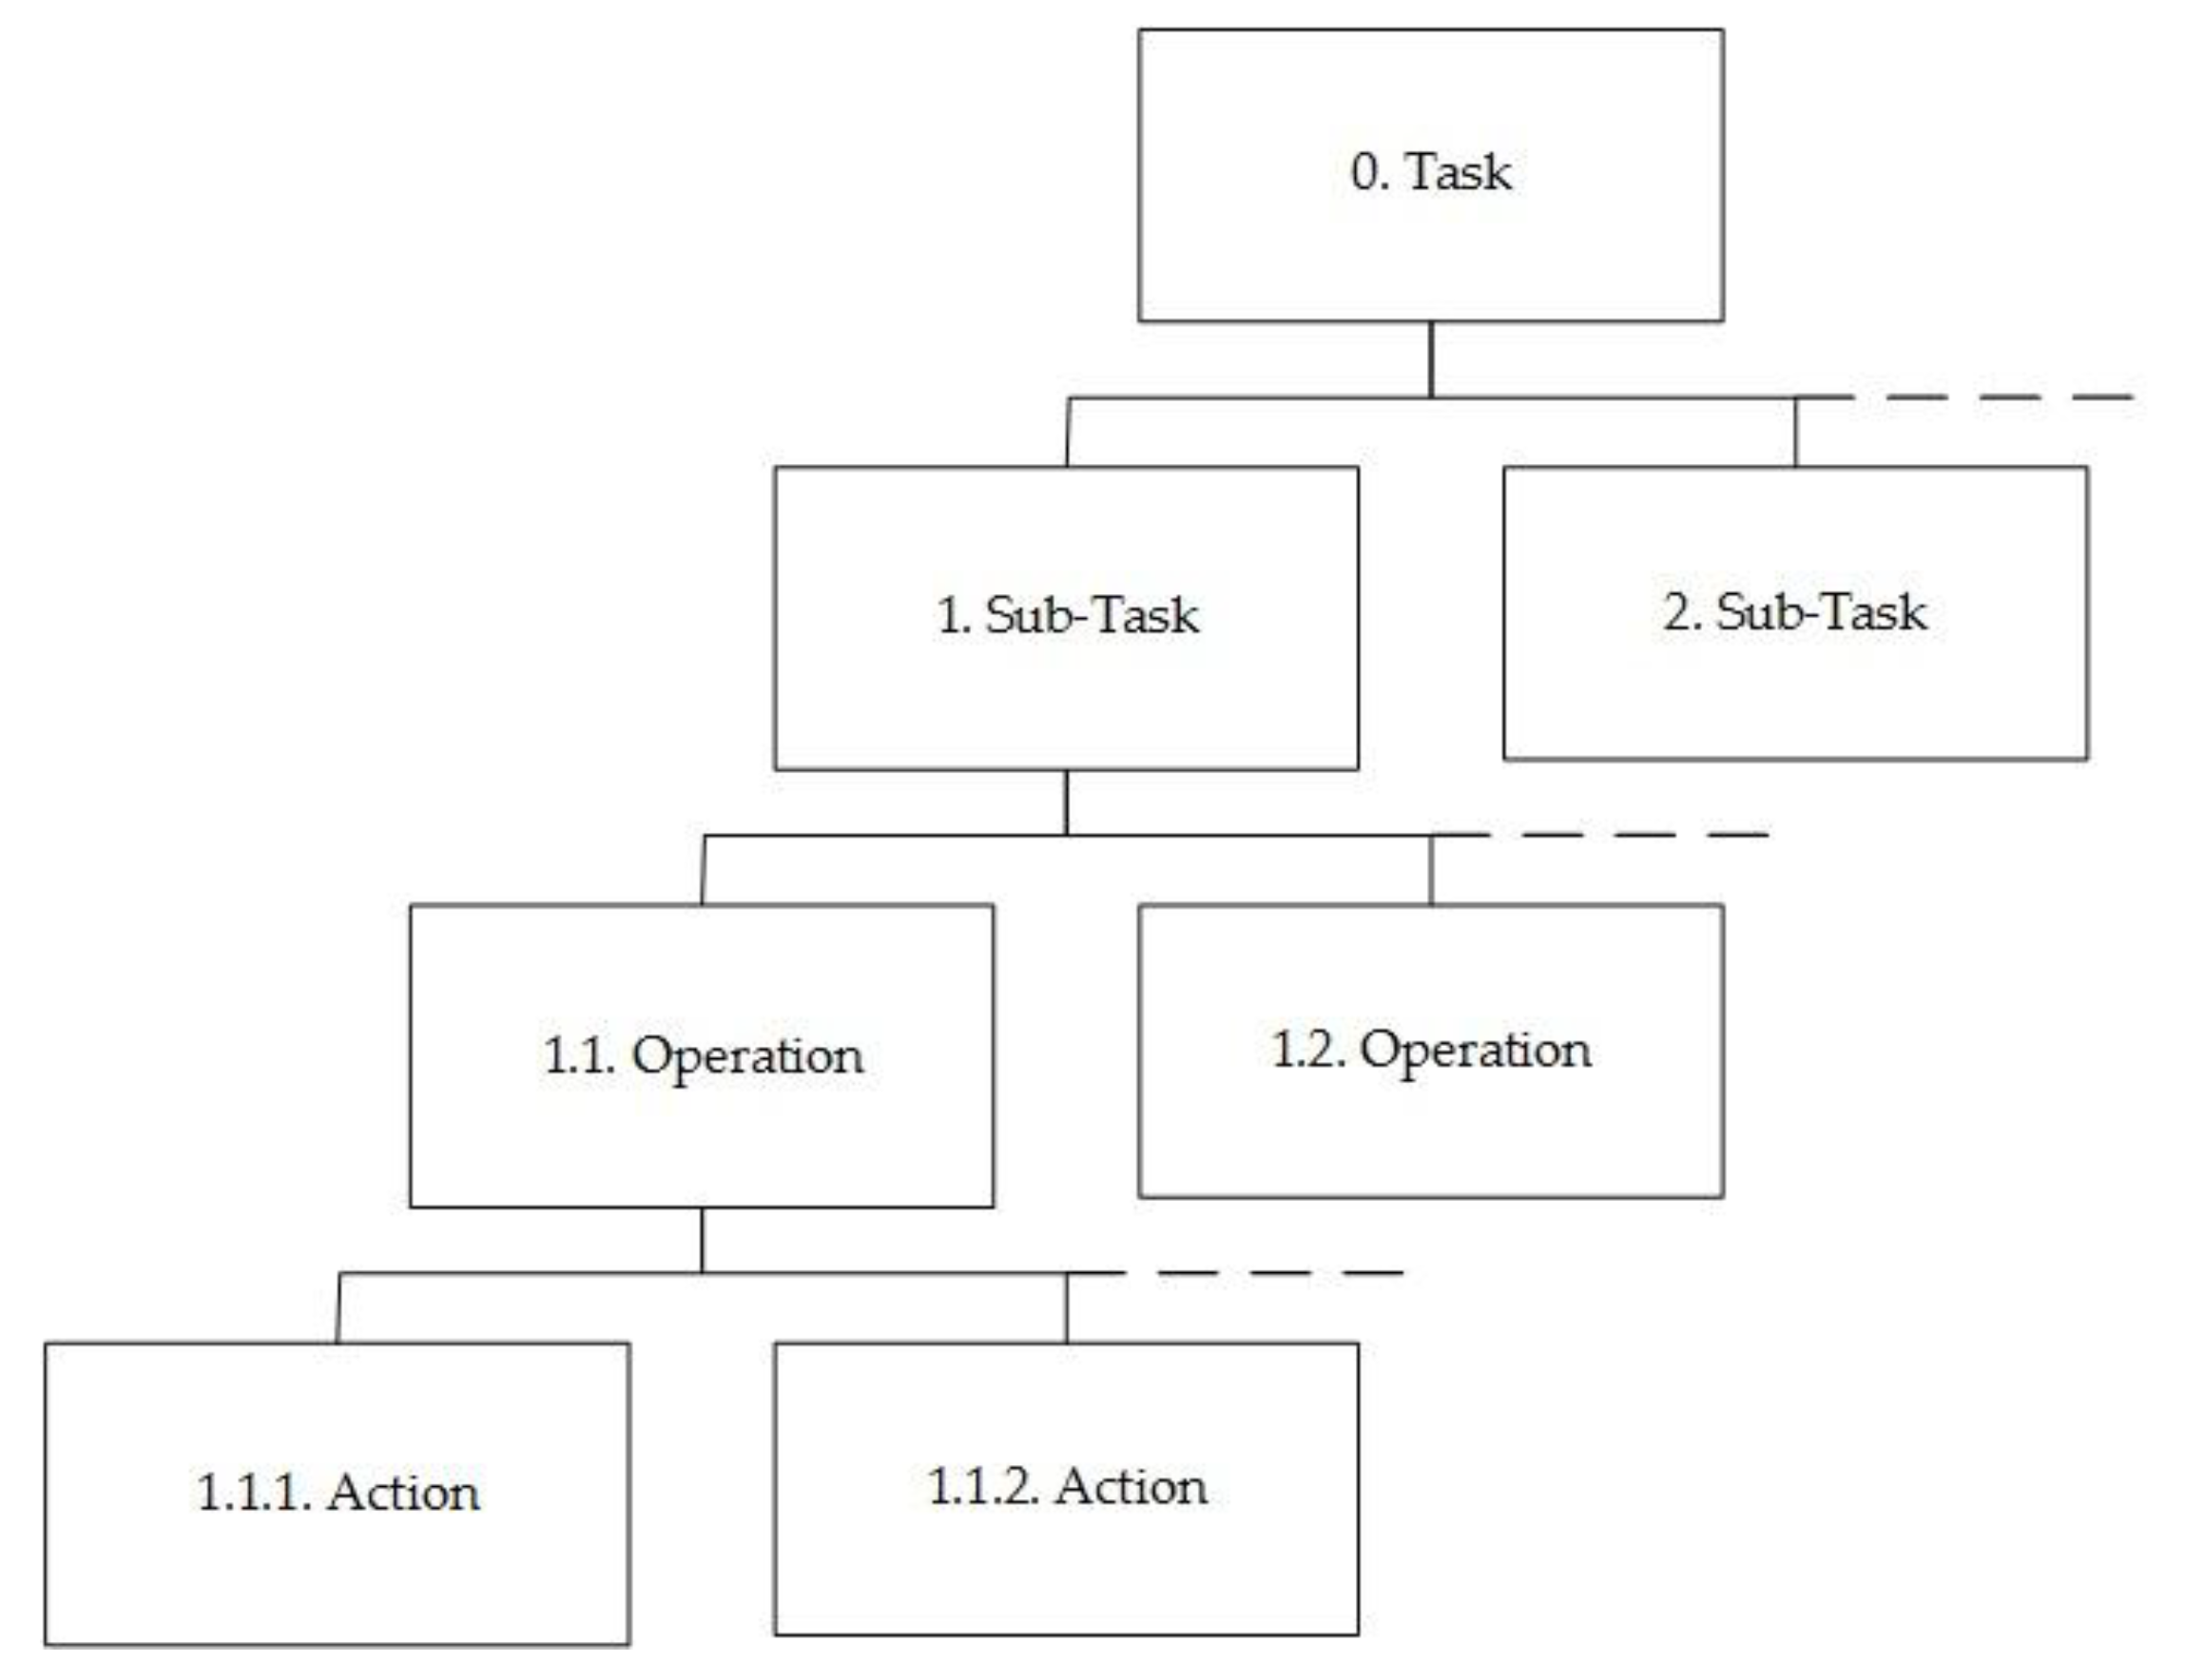
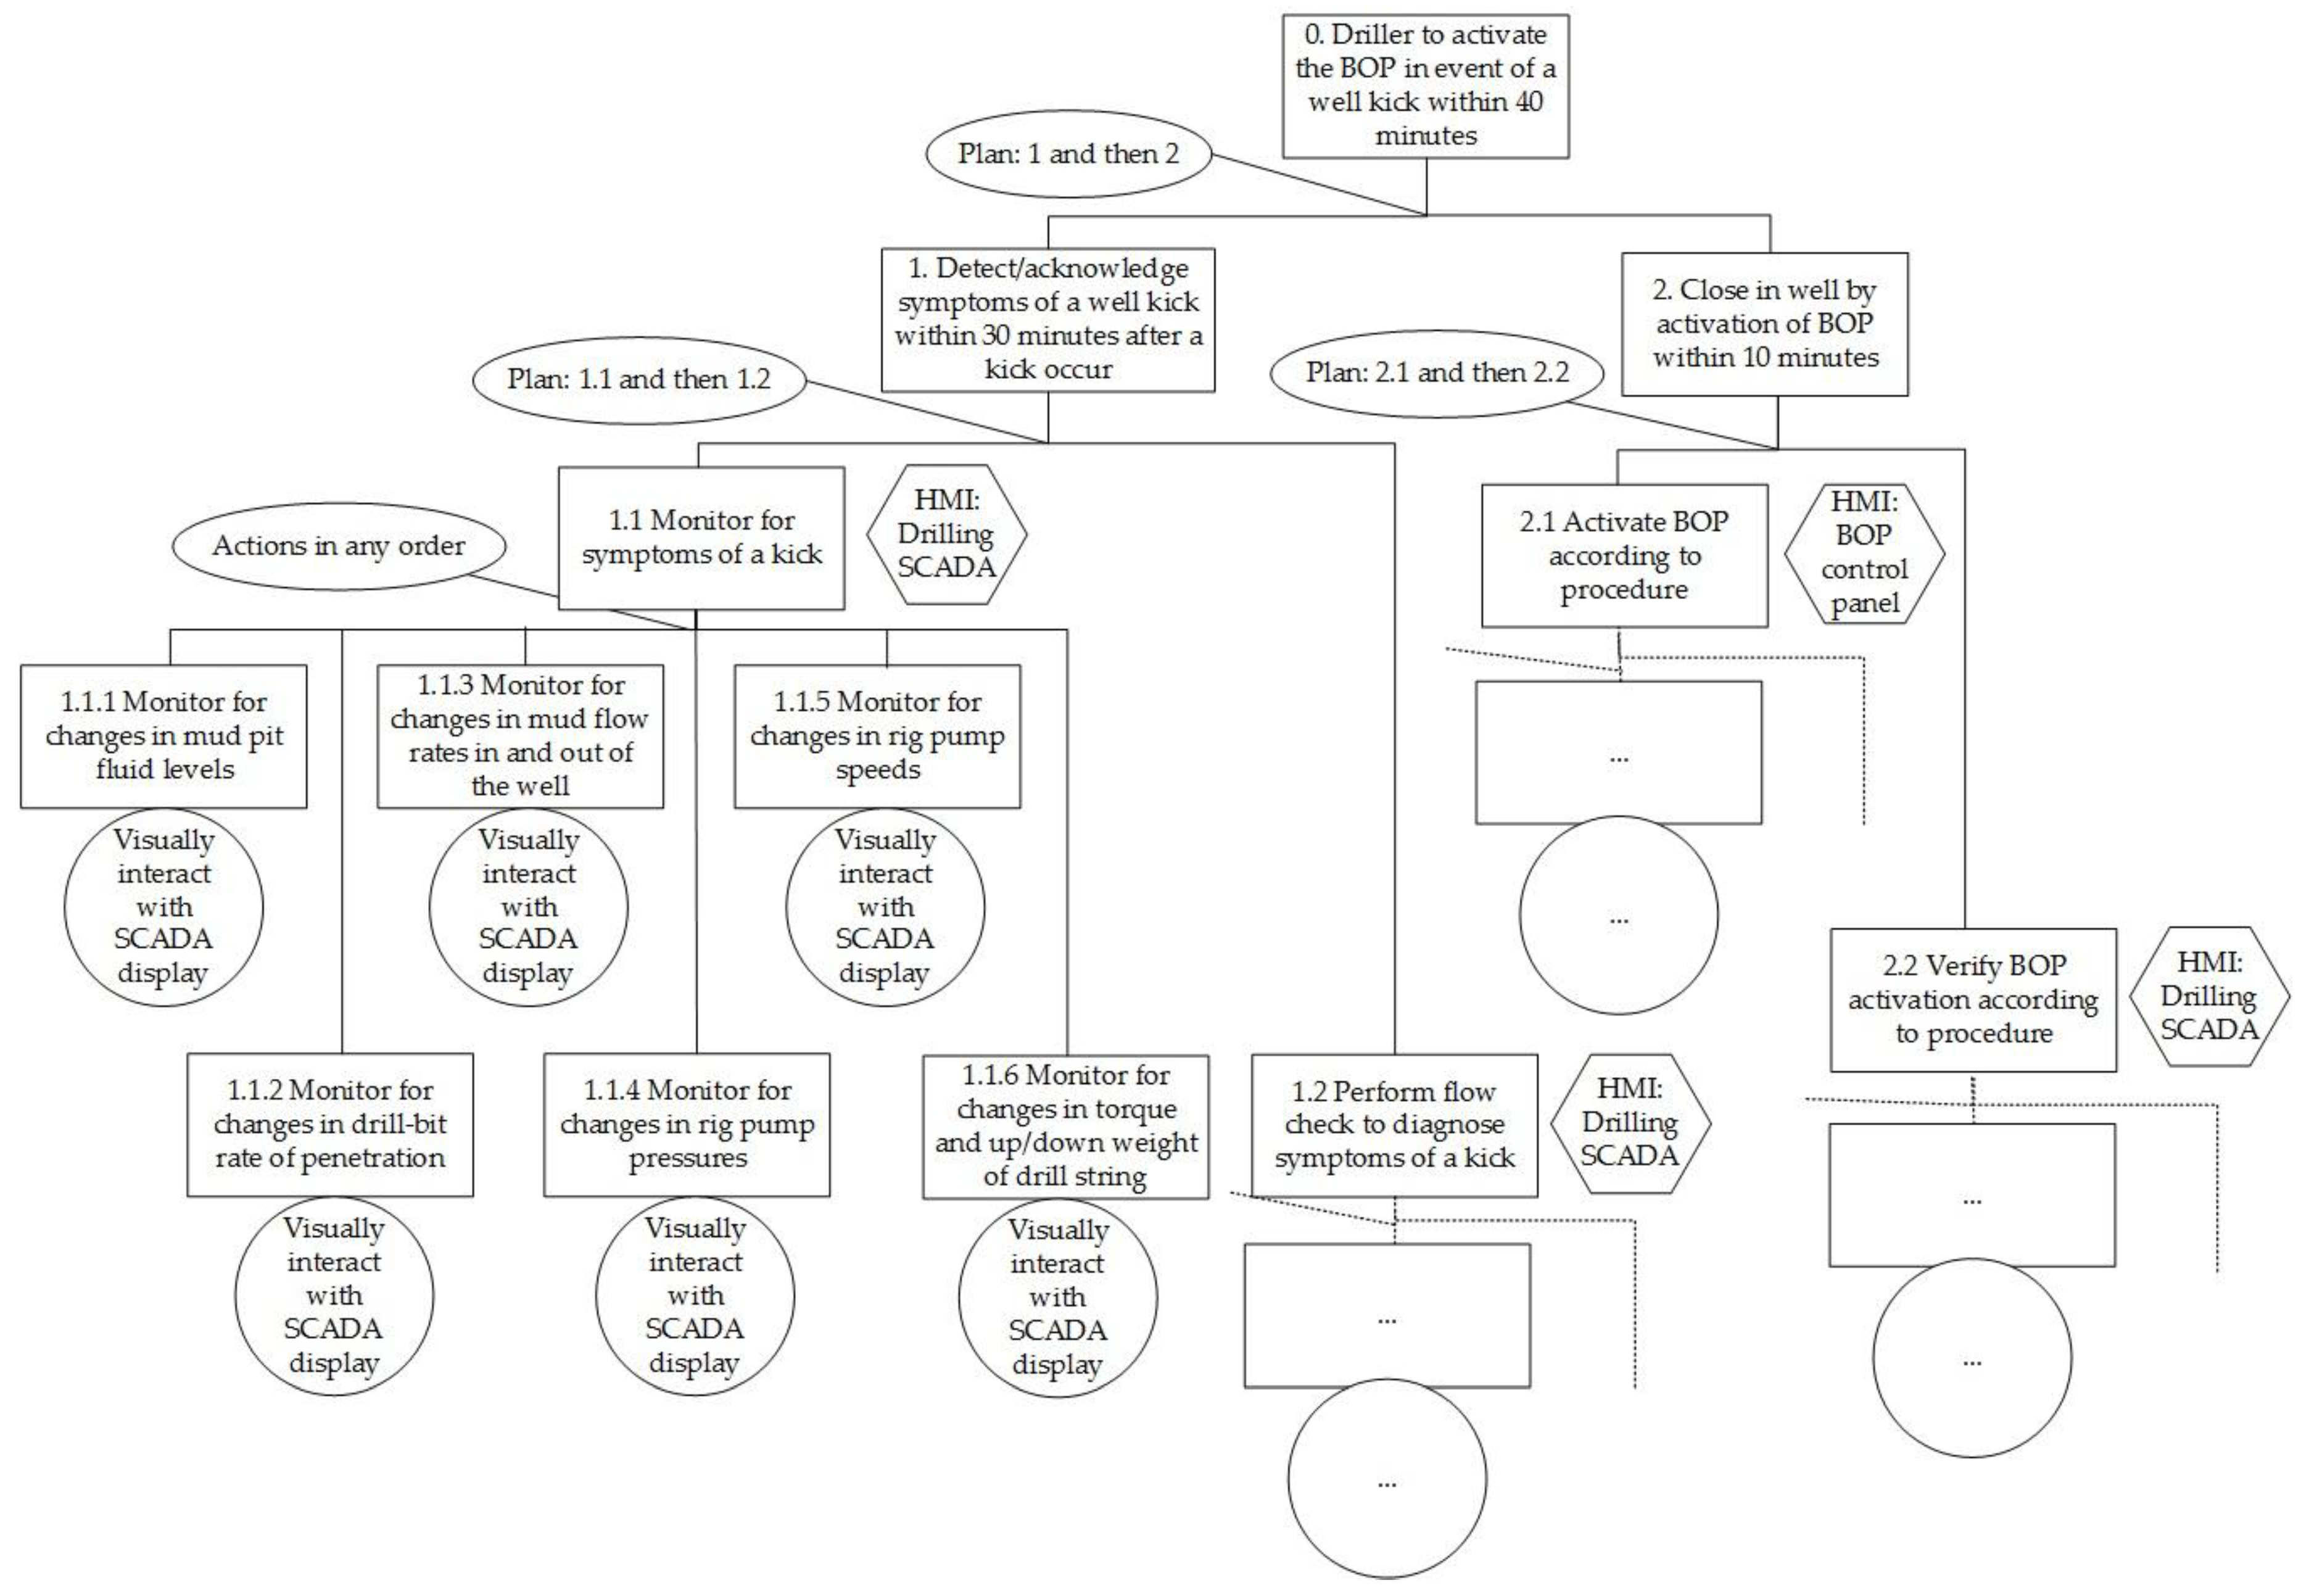
HTA is a popular task analysis technique that is considered a central approach in ergonomic studies [39]. As illustrated in Figure 2, the HTA produces a description of tasks in a hierarchy, beginning with a task at the highest level consisting of objectives expressed by the goals of the sociotechnical system, which in turn are decomposed into operation subobjectives and lower-level actions [39]. Actions are defined as the smallest individual specific operation carried out by operators interacting with a technical system or by the system itself, and are often procedural in nature, with an implied or explicit intended sequence.

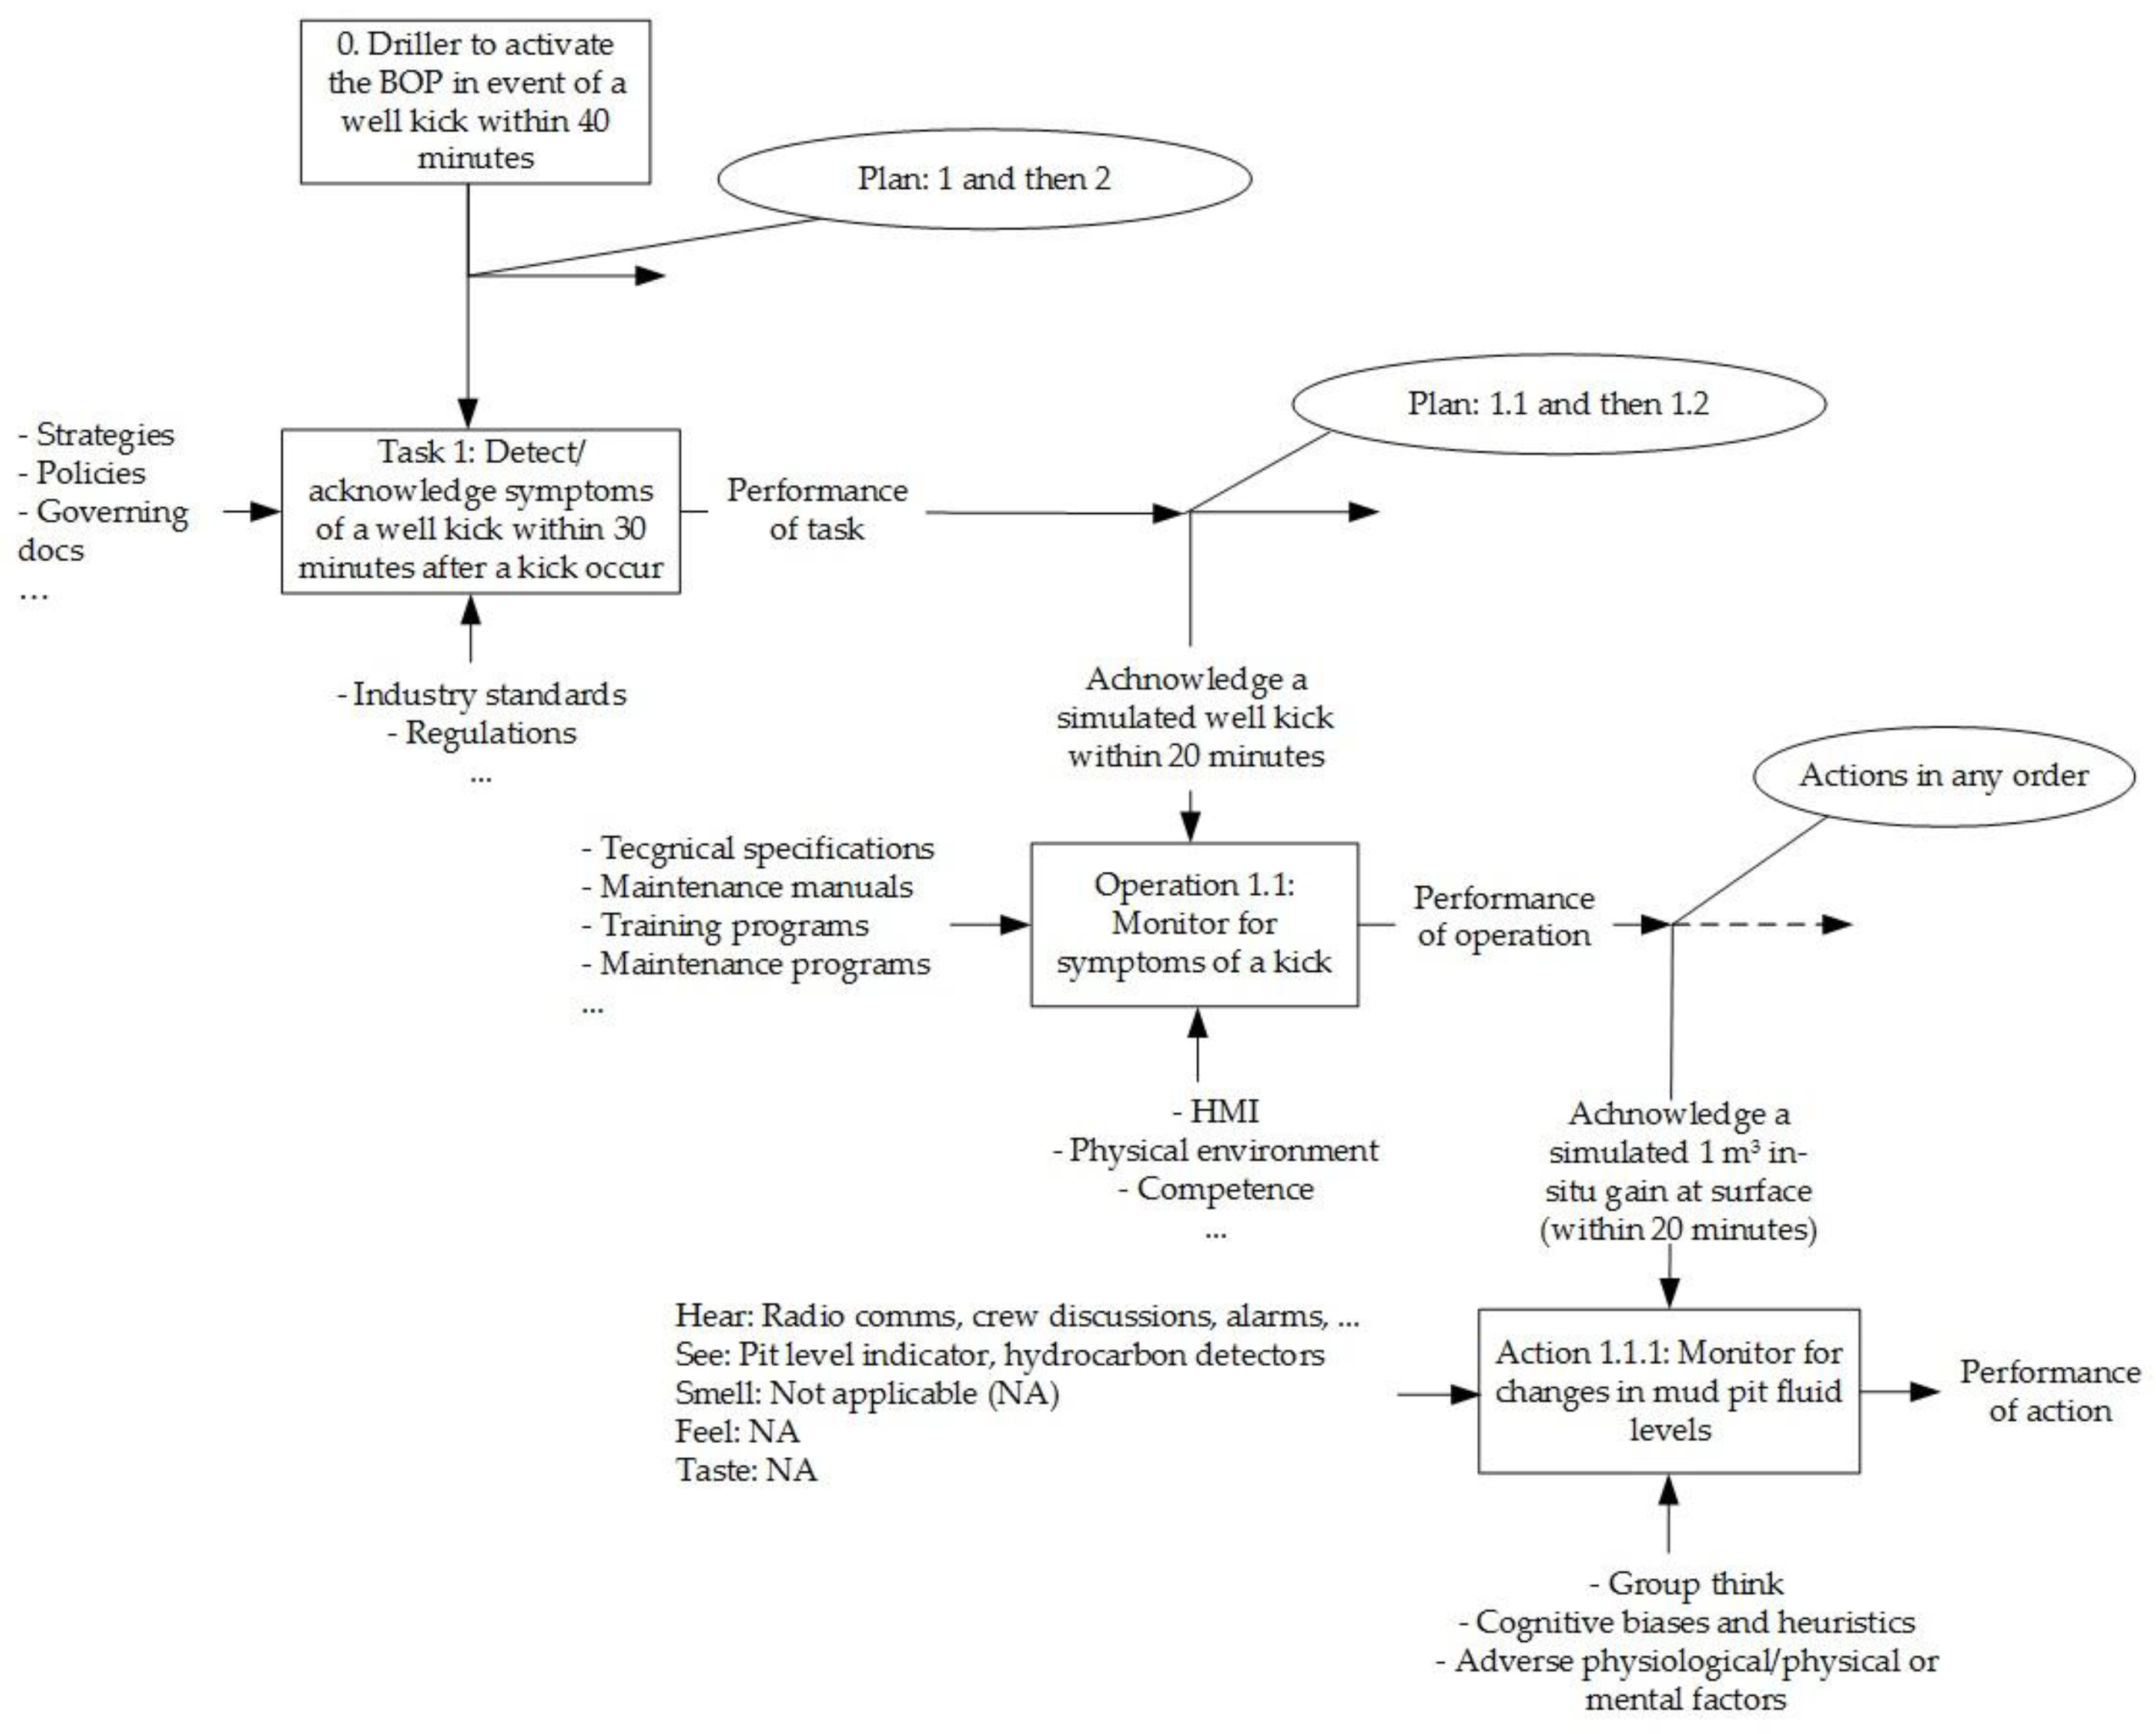
2.3. SADT in Task Analysis

SADT is a popular failure analysis technique that, similarly to HTA, describes technical function objectives at different system breakdown levels. However, the function requirements in SADT are depicted as process blocks, with arrows that describe function level inputs and outputs, as shown in Figure 3 [40]. Input takes the form of the basic energy, materials, and information required to perform the function. Control elements govern or constrain how the function is performed. Mechanism or environment refers to the people, facilities, and equipment necessary to carry out the function.
The HTA in Figure 2 describes three task breakdown levels with parallels in failure analysis [41]: (i) system; (ii) items; and (iii) components. With the structural similarity in mind, we develop the HTA further by adopting concepts from SADT [40] and functional block diagrams [41]. With consideration of the DPRA causal model [1,19], we consider the following HTA-SADT diagram definitions:
  • Task, operation, and action objectives as ‘functions’ stated in the block.
  • Performance requirement standards serve as the ‘control system’.
  • Situational elements provide the ‘inputs’, which may be described in terms of operator perception and focus of attention; for example, a process of hearing, seeing, smelling, tasting, and feeling the vicinity at the action level, and on a higher level as objects, events, people, systems, and environmental factors associated with goals [46].
  • Results from the performance of tasks, operations, and actions are the ‘outputs’.
  • PIFs provide the supporting ‘environment and mechanisms’.
To maintain three levels of coherence in analysis, it is advised to follow the documentation from performance requirement standards identified at action-level plans and procedures, tracing upwards in the organisation via relevant work process objectives. As such, the result from the combination of HTA and SADT is a bottom-up approach to task analysis.
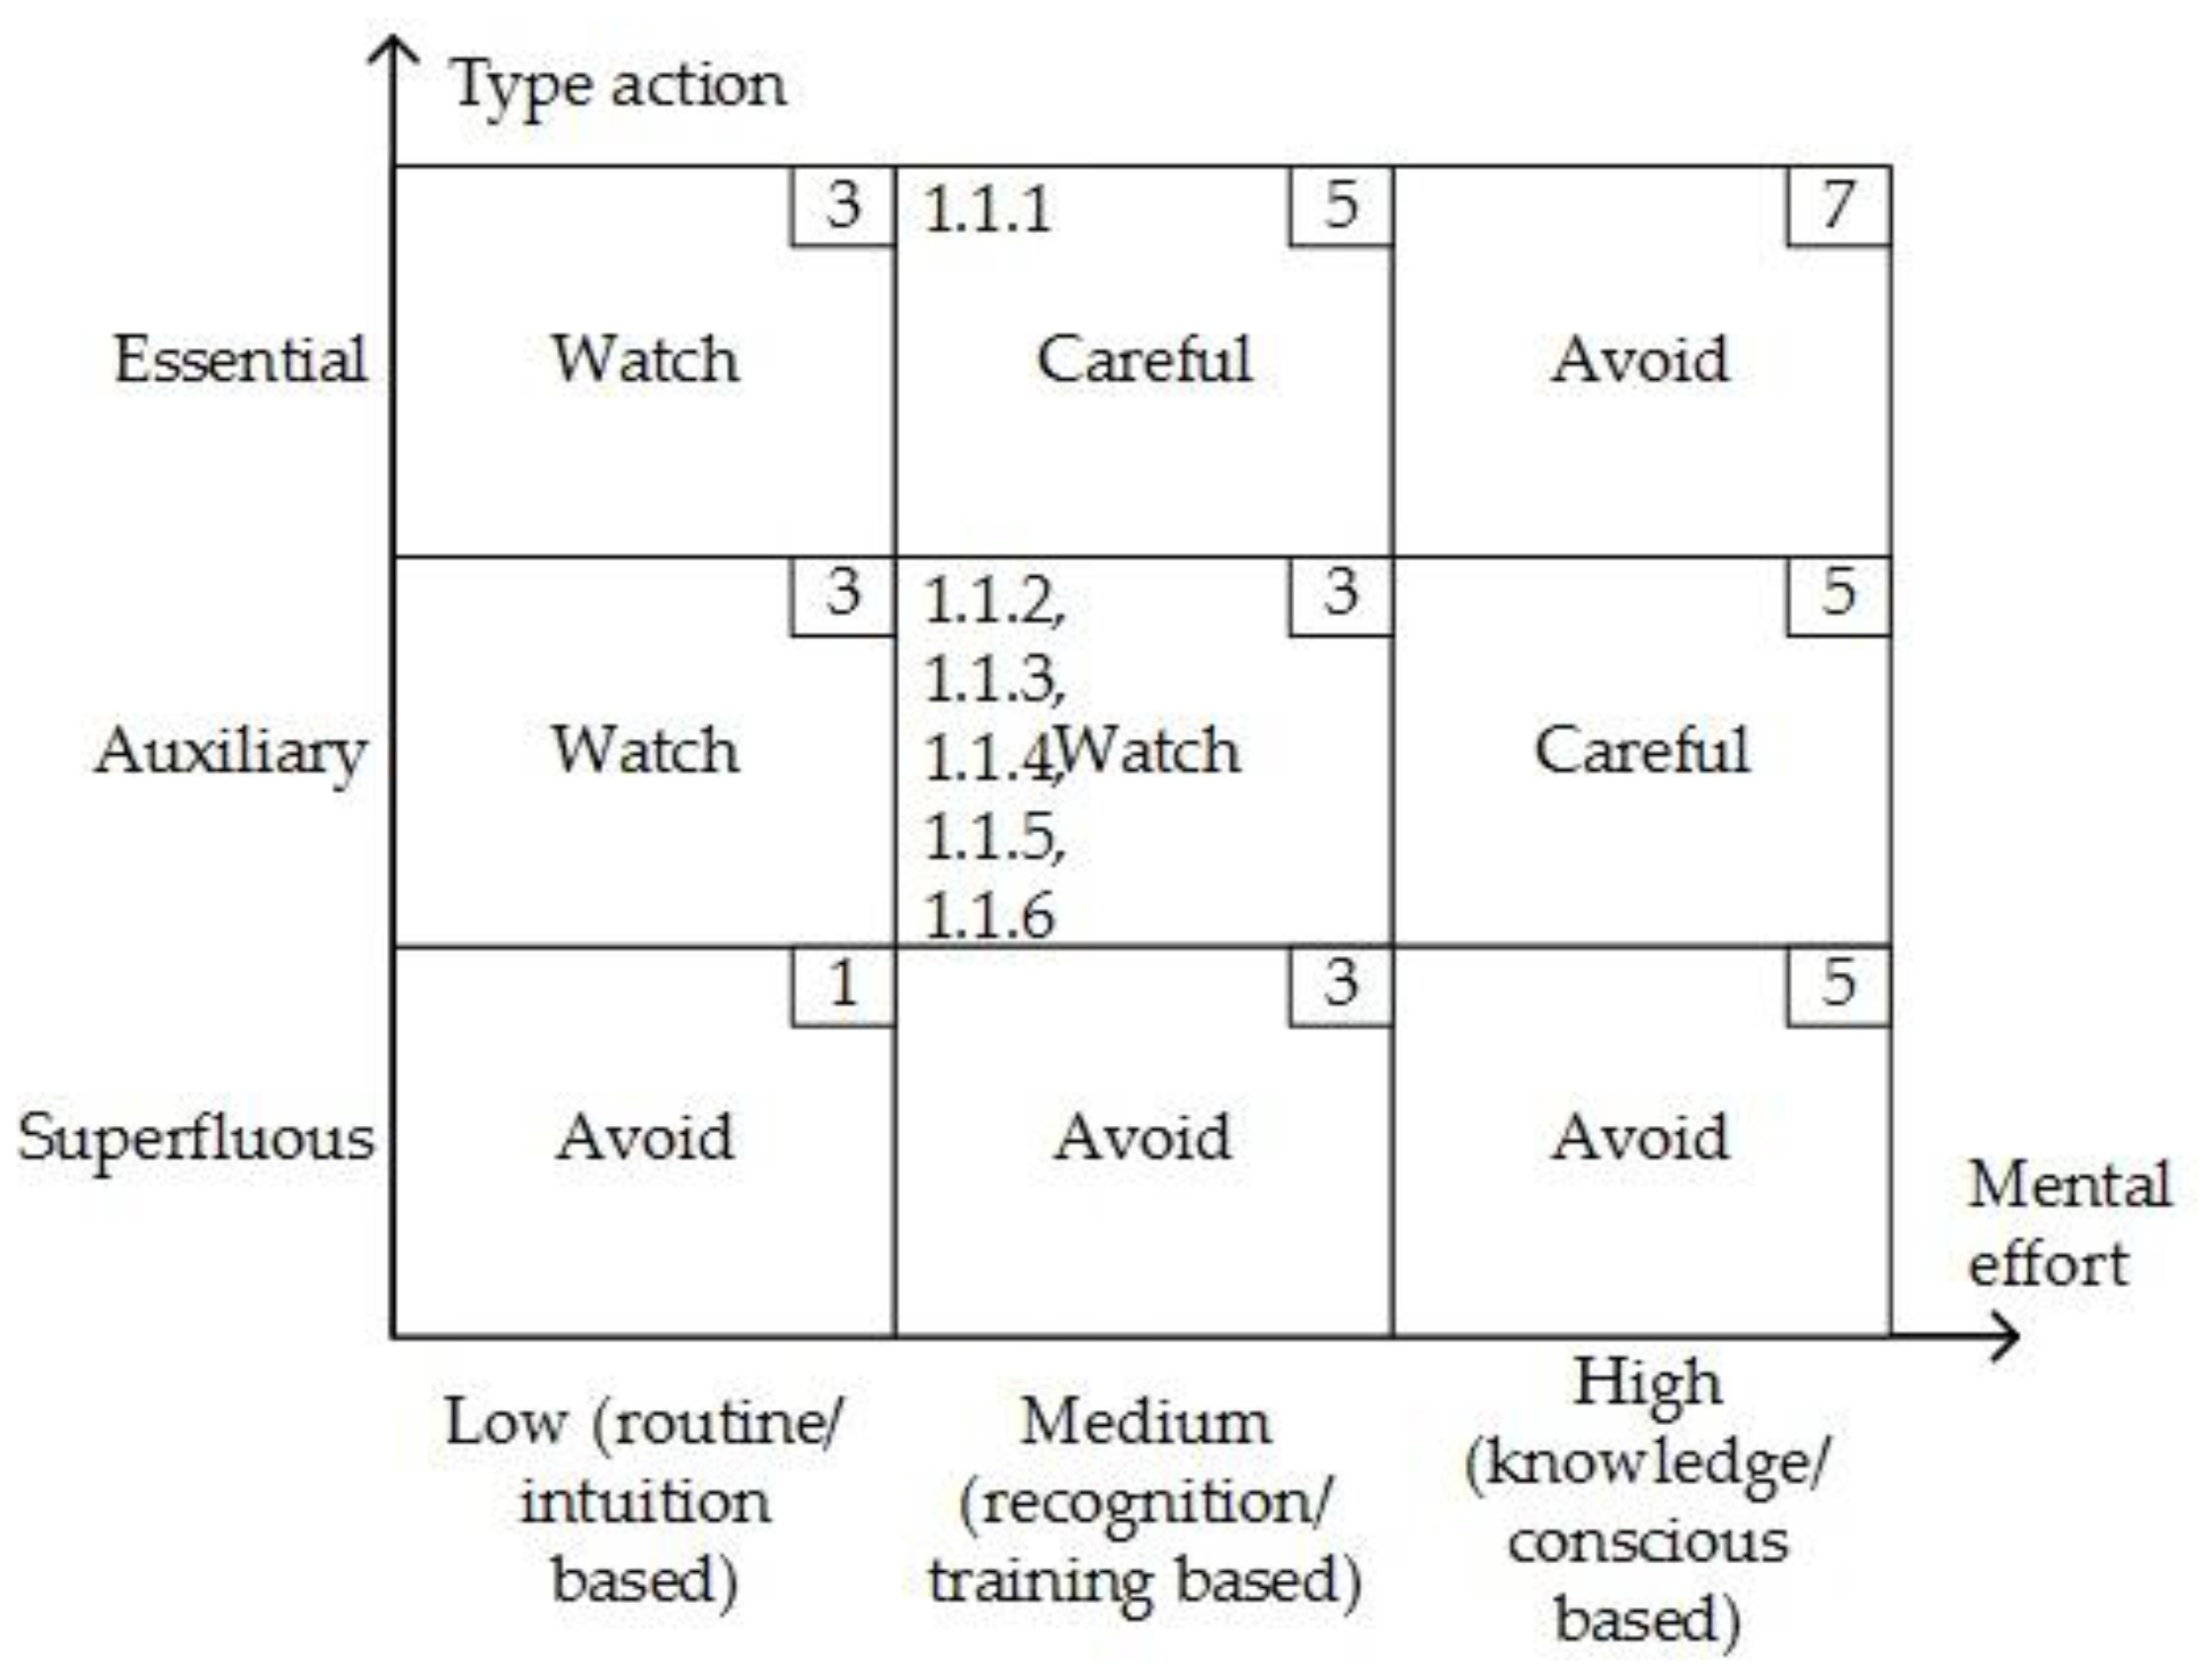
In failure analysis, we assign criticality classifications to actions in the task analysis to help prioritise further efforts according to the matrix shown in Figure 4. For example, monitoring of changes in mud pit levels during drilling is viewed as an essential action in well kick detection. Actions may also be viewed as auxiliary, i.e., introduced in support of essential actions. Examples of auxiliary actions in drilling are typically actions performed to reduce the risk of drilling process upsets, such as stuck pipe incidents. A planned drilling operation may also conceivably include superfluous actions that are actions not required for successful task completion. Superfluous actions are undesired, since they may create a high noise-to-signal ratio [14]. For the purpose of the HRA matrix in Figure 4, we also classify the degree of mental and physical effort involved for the operator or crew to perform actions based on popular levels of human behaviour [47]. Indicated on Figure 4 are the scores assigned to each class (upper right-hand box) and tag numbers relevant to classifications made of the actions considered in the case study in the next section.

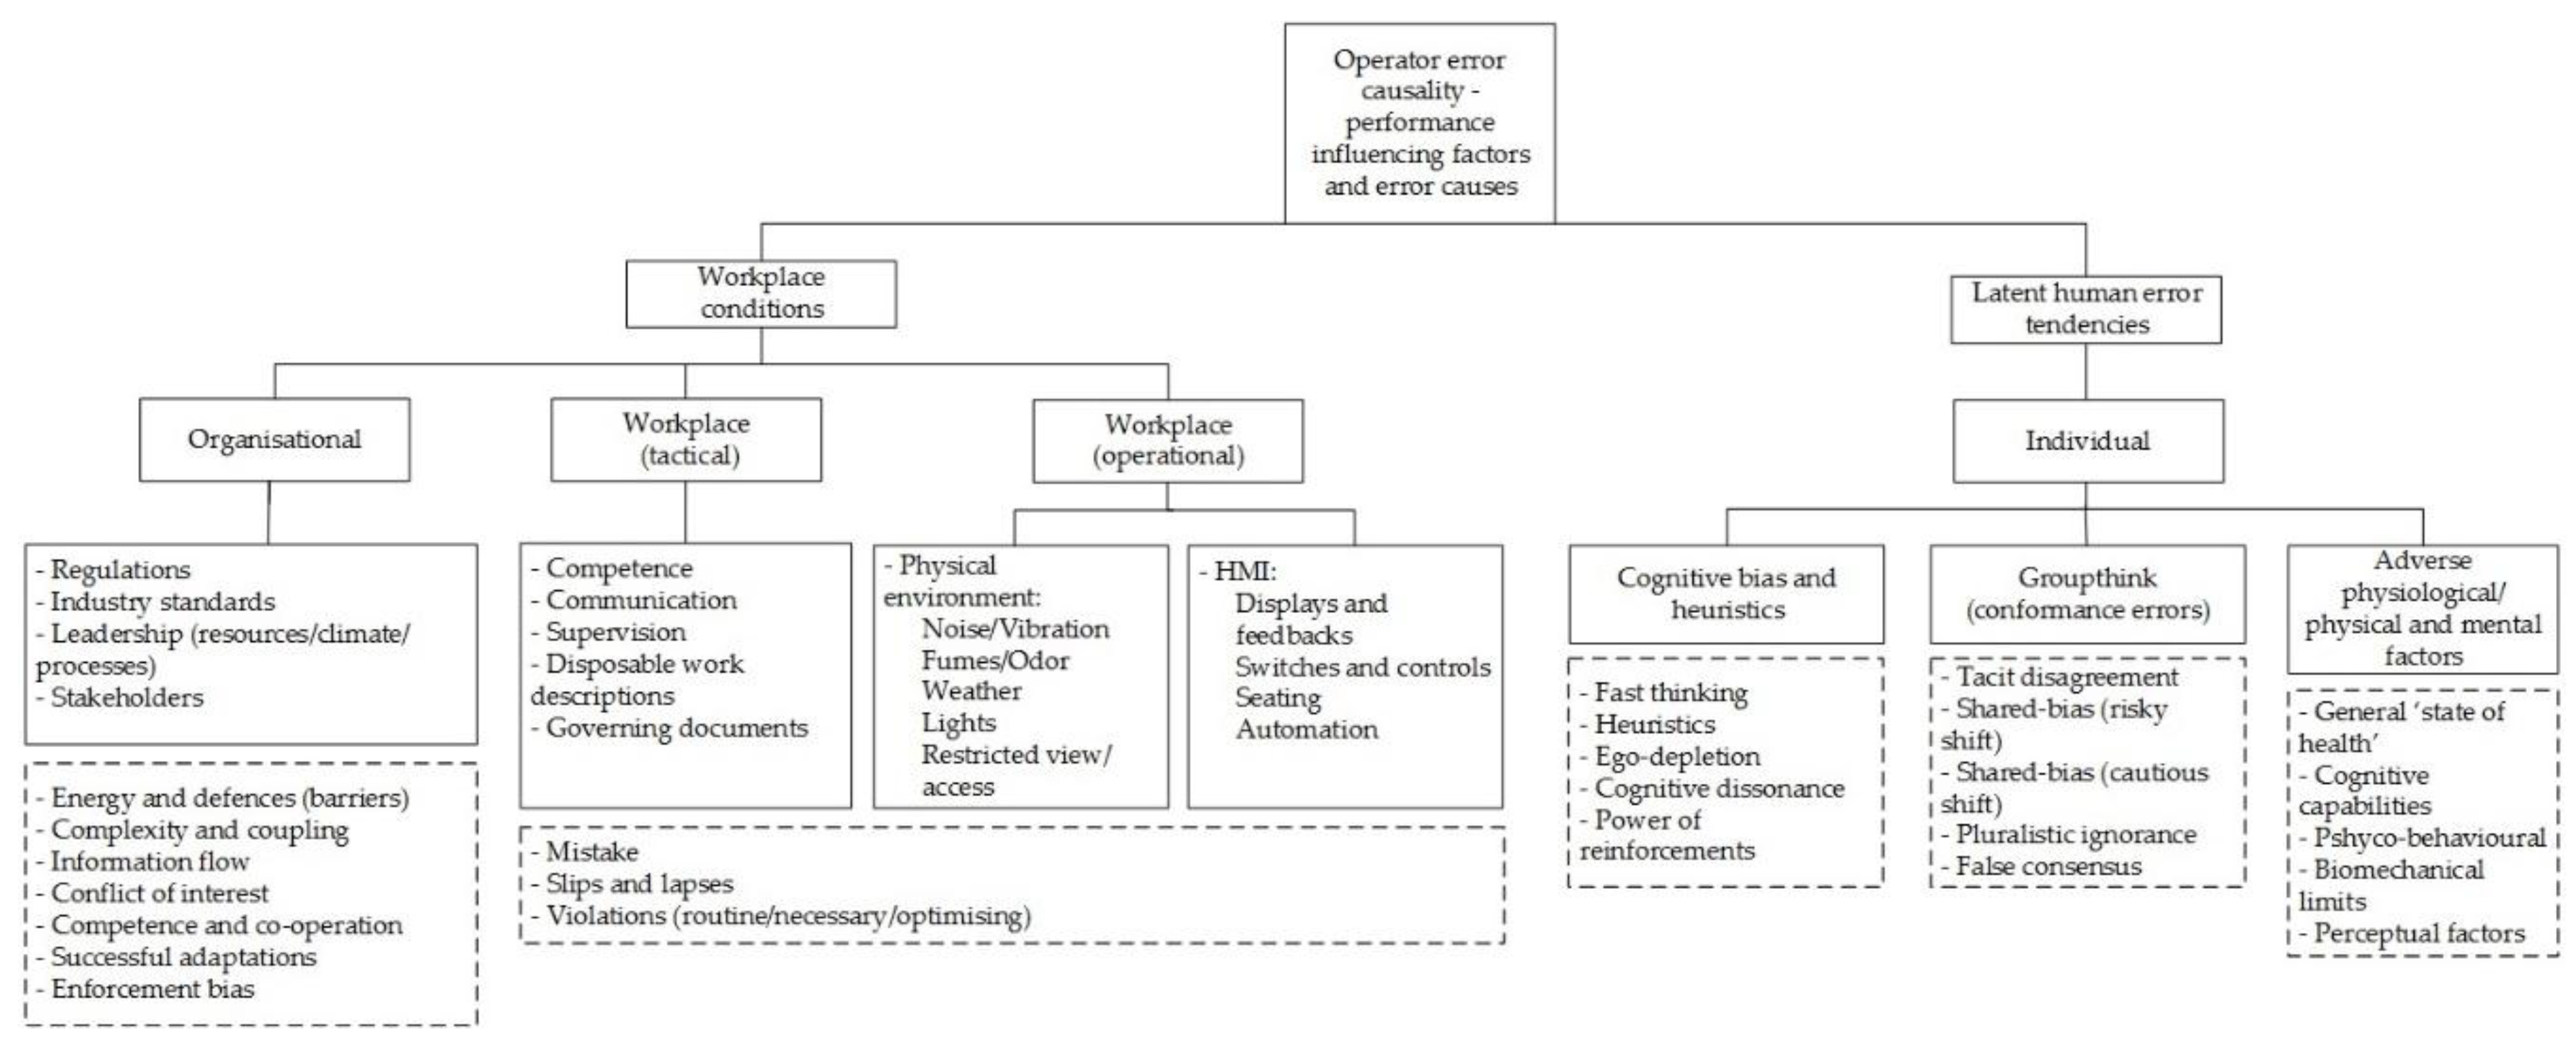
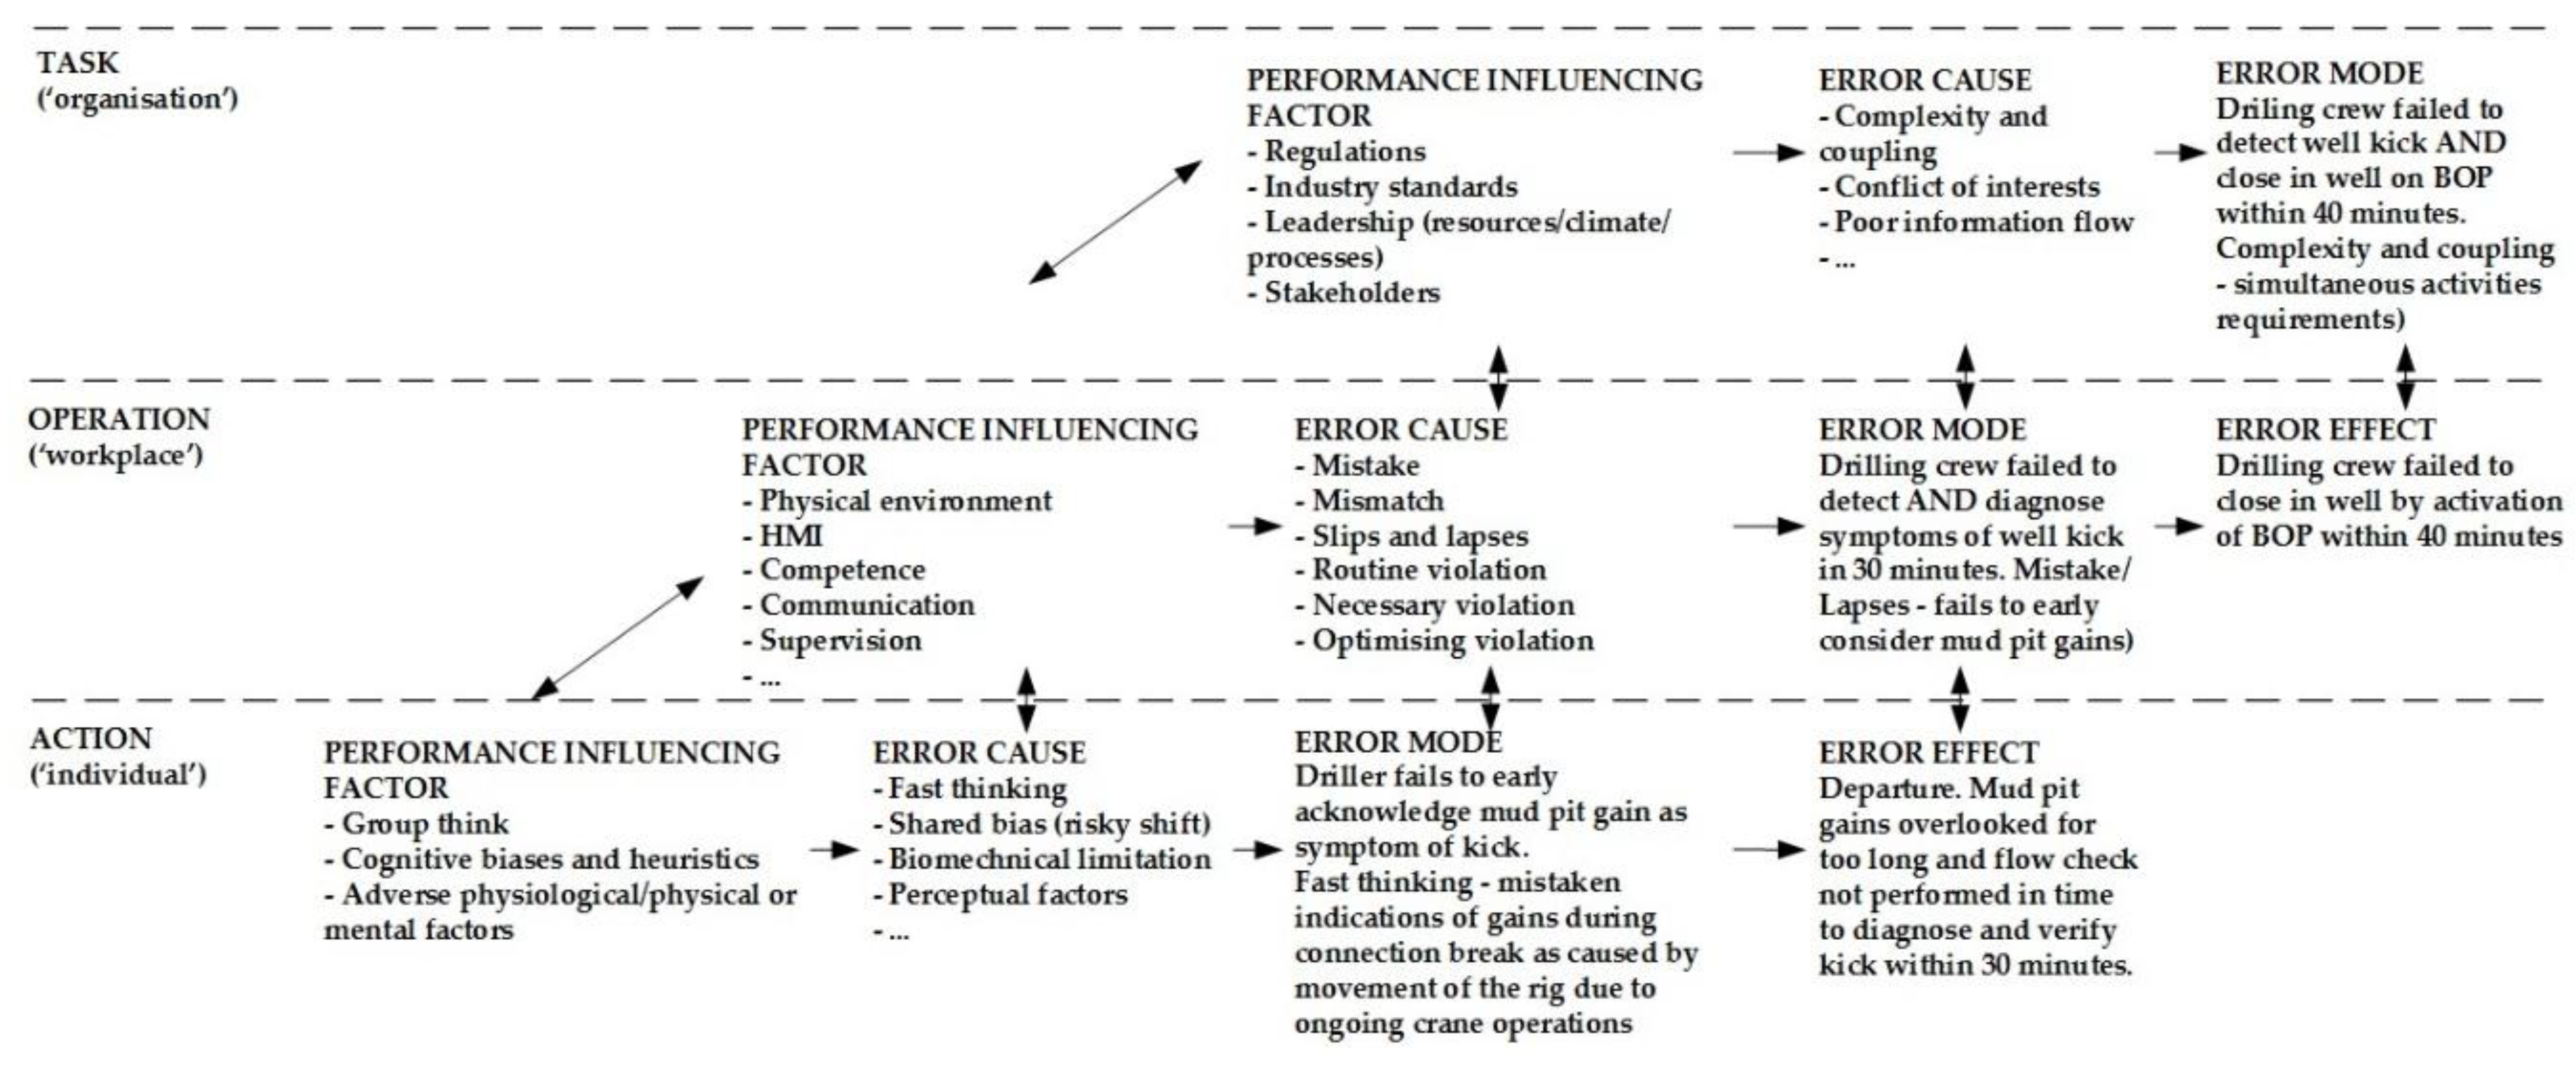
2.4. Causality Classifications in Task Analysis

Figure 5 illustrates the causal classification scheme used for the task analysis. As can be seen, operator error mechanisms are divided into individual, workplace, and organisational PIFs. The PIFs are also associated with other cause categories, shown in boxes with dashed lines below. The scheme reflects operator error as a process of departure that follows as a result of natural exploratory behaviour [47], where PIFs describe an error-forcing context [29] as encountered in a situation with a set of circumstances where workplace factors and latent human error tendencies may easily combine and result in operator error [19].
The categories derive from HFACS and DPRA, which both adopt Reason’s hierarchical energy defence model. The combination in Figure 5 of preconditions from HFACS with existing individual factors defined in DPRA could lead to the introduction of ambiguous terms. We therefore consider the preconditions from HFACS strictly as non-workplace-related error tendencies in the task analysis.
For the purpose of validation, the causal classification scheme has been applied to four well accident sequence descriptions provided in previous work [19]. The results from this exercise are shown in Table 3. The data sources are publicly available reports from well accident investigations. The authors faced challenges in classifying or quantifying explicit contributions from individual causal factors that were documented with limited details.
The Snorre accident may be described as the result of deficient competence, oversight, and information: First, a mistake made by the crew and supervisors in accepting the plan to use the outer casing and openhole as the main barrier. Next, a lack of recovery caused by not noticing the situation and not maintaining the mandatory two well barriers. The Montara accident may be described as the result of deficient governance, competence, oversight, and information: First, a mistake made by the crew and supervisors in agreeing to move the rig (main barrier) from the well without compensation, presumably motivated in part by cost-saving. Next, a lack of recovery caused by not noticing the situation and not maintaining the mandatory two main barriers. The Macondo accident may be described as the result of deficient governance, competence, oversight, and information: First, a mistake/violation made by the crew and supervisors who accepted an inconclusive barrier verification test. Next, a lack of recovery caused by not noticing the situation and not maintaining the mandatory two well barriers. The Gullfaks accident is complex, but may be described as the result of deficient competence and oversight associated with the application of a new technology. First, a mistake/violation made by the crew and supervisors who accepted a revision of the drilling program without formal change management. The intention, presumably, was to follow recognised practices established with older technology, without considering the subtle implications of decisions affecting risk factors such as casing design, casing wear, casing stress, and wellbore stability.

2.5. Apply QFD in Task Analysis

In this section, we apply a familiar formal approach to the task analysis as part of updating the drilling HRA causal model. The approach is based on QFD [42], which is used as a means for generating normalised weights, w j , of operational-level PIFs, denoted RIFIs, in the HRA [1]. The QFD concept, with its application of “quality houses”, includes well-known methods and techniques for stakeholder preference elicitation and evaluation in product or process development ([
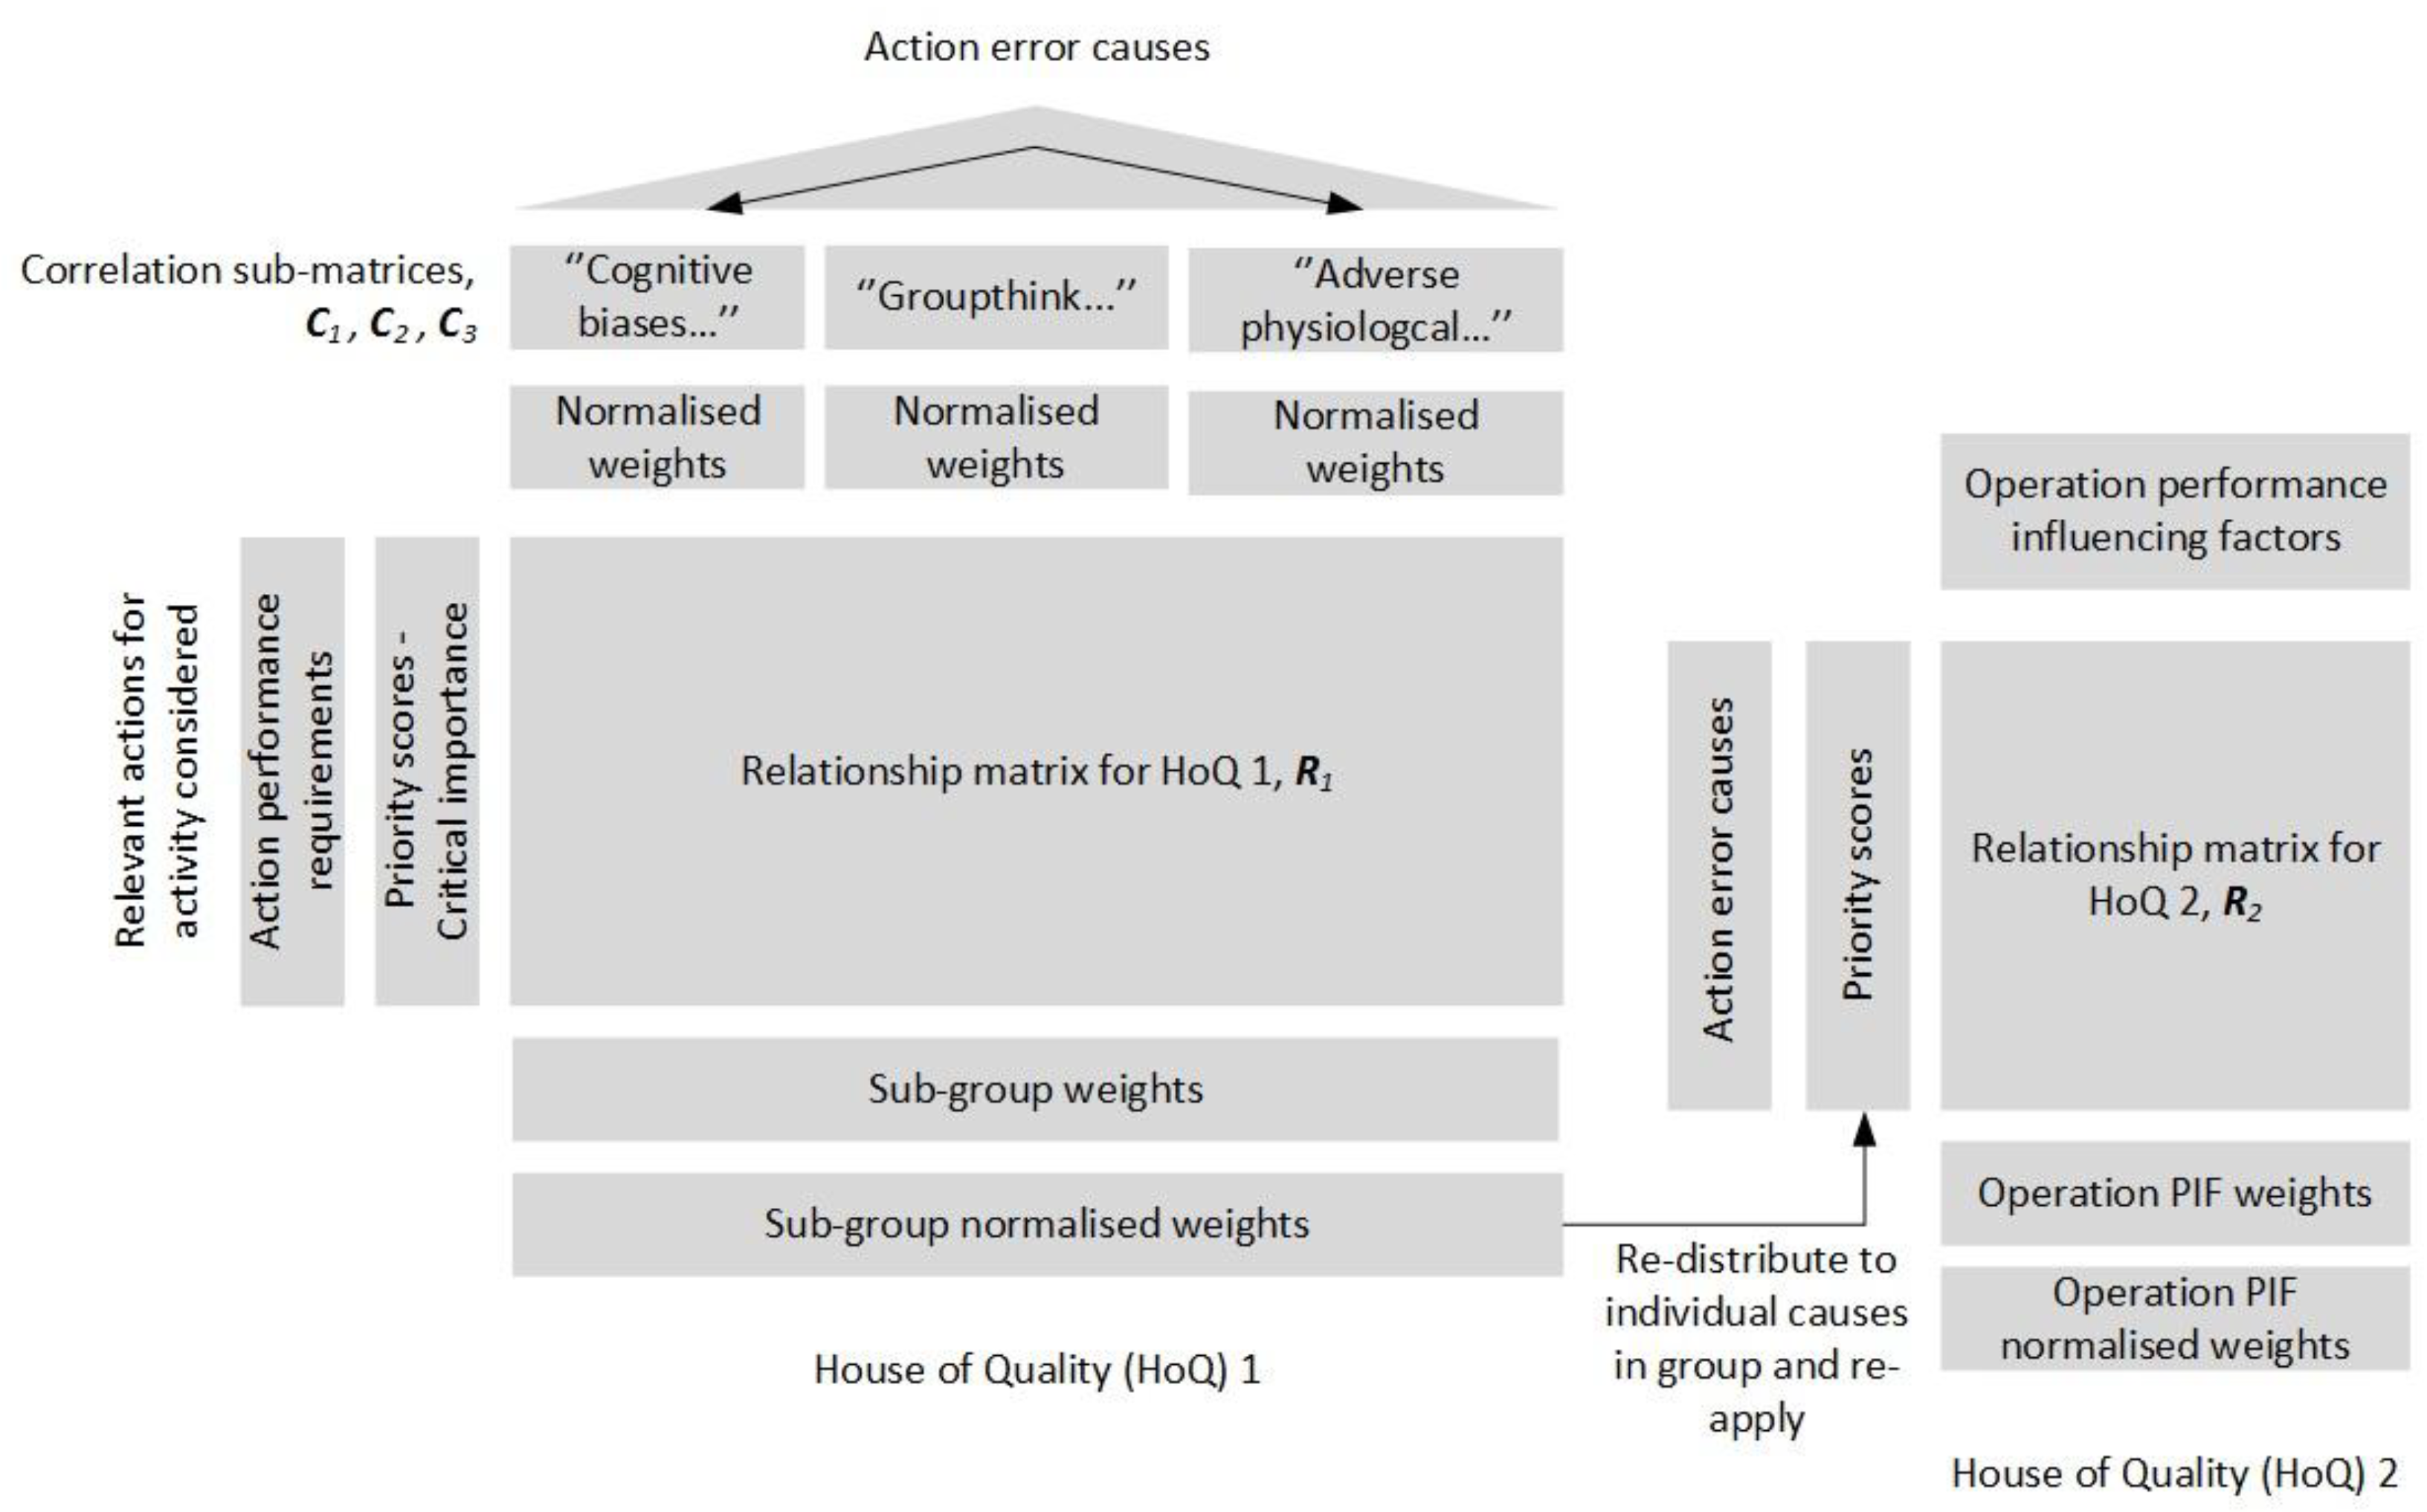
42], Annex A). For example, evaluations may concern relationships between action performance requirements and action error causes, shown with quality house number one to the left in Figure 6. Figure 6 illustrates the QFD approach with use of two quality houses that result in an evaluation of priority weights, w j I I , which corresponds to an evaluation of operation-level PIFs in HTA and HRA. Respectively, these PIFs are recognised as workplace influences in generic causal scheme shown in Figure 5 (see also Table 3).
The proposed QFD-based approach consists of two main stages, described respectively by house of quality (HoQ) number one and two in Figure 6. The first stage covers an evaluation made of action performance requirements versus action error causes identified in the activity HEP/HFE. Next, the action error causes with normalised weights produced in the first stage are reapplied in evaluation of the same action error causes versus relevant operation-level PIFs in the HRA for the same activity. The resulting normalised weights are used directly as updated weights for PIFs in the HRA causal model.
The HoQ 1 is seen to include a roof (correlation matrix) that facilitates the orthogonal treatment of the action-level causes, which similarly are handled by the existing HRA procedure on the operational level of HoQ 2. The HoQ 1 correlation matrix is resolved in the approach with the use of AHP. The action-level causes are treated in AHP as three independent subgroups in the approach to reduce the efforts required for achieving consistent pairwise comparisons. The subgroups are defined according to the classification given for causes under individual influences in Figure 5, and are represented with submatrices C 1 , C 2 , and C 3 . In practice, the QFD is carried out for an activity according to the following procedure:
  • Definition of the list of actions in (1, …, m). Assign each with a priority score, p i I , by adopting the critical importance score assigned in task analysis (Figure 4); i.e., scores are in (1, 3, 5, 7).
  • Evaluate correlation matrices C 1 , C 2 , and C 3 . Use AHP to determine the normalised weights of causes defined in each subgroup, w k C 1 , w k C 2 , and w k C 3 . Evaluate the correlations with scores in (1—weak, 3—moderate, 5—strong). Check that the consistency ratio becomes less than 0.1 to validate judgments made [43].
  • Evaluate the relationship matrix R 1 to determine the normalised priority weight of each subgroup matrix C 1 , C 2 , and C 3 . The relationship between the submatrices and actions is quantified using scores, s i j I , in (1—weak, 3—moderate, 5—strong). The subgroup priority weight is defined as W j I = i = 1 m p i I s i j I , and the submatrix normalised priority weight is defined as w j I = W j I / j = 1 3 W j I .
  • Update weights of action error causes defined within each submatrix. The updating of a weight in submatrix j is defined as w ¯ = k C j w k C j w j I .
  • Define priority scores to the action error causes transferred to HoQ 2. The updated weights from previous step 4 are here reused as priority scores, p i I I , in the listing.
  • Evaluate the relationship matrix R 2 to determine the normalised priority weight of each operational-level PIF in the activity given in (1, …, n). The priority weight for PIF j is defined as W j I I = i = 1 15 p i I I s i j I I , and the normalised priority weight as w j I I = W j I I / j = 1 n W j I I .
A search made of the internet and Scopus indicates that there are few explicit associations made between QFD and HRA in the literature. However, the use of QFD is not new to safety analysis. For example, several basic applications of QFD are found proposed in reliability engineering [49] and to evaluate hazards within occupational safety analysis [49,50,51,52]. The safety analysis literature also includes a more complicated adaption of QFD, with the use of fuzzy set theory to describe uncertainties related to the elicitations and evaluations performed [53]. The implementation of fuzzy set theory or similar to augment uncertainties may also be attractive for further work; for example, the use of triangle-, trapezoid-, or bell-shaped fuzzy numbers may typically be investigated for the various linguistic evaluations. Alternatively, as a first modification to procedure Step 3 and Step 6, we may simply consider that a priority score defines the probability distribution for the random variable S i j . Let p ( s ) = Pr ( S 1 = s 1 , , S n = s n ) represent the joint probability distribution function for n column entries. The updated impacts of the scores on priority weights can then be calculated numerically as
W j = s ( i p i s i j ) p ( s )
where s denotes the sum over all possible values of the vector s . For example, Table 4 simply treats HoQ 1 relationship scores used in the case study in the next section as being representative for independent triangle distributions, defined respectively with: score is 1 (1, 1, 3); score is 3 (1, 3, 5); and score is 5 (3, 5, 5); where (.,.,.) denotes the minimum, peak, and maximum triangle values.
The HoQ approach provides a systematic means for the orthogonal evaluation of PIFs within and between causal levels for the purpose of HRA. However, the potential reliance on the anchored judgment and intuition of single individuals in AHP should be avoided [1]. For example, the Delphi method may be adopted to combine results from multiple expert elicitations [54]. The list of action error causes also should be ordered according to importance in order to reduce any tendency for bias introduced by typical linear evaluations made with AHP. The ordering of the causes in the case study example follows from the validation performed of the causal scheme with accident data in Table 3.

3. Case Study

This section presents a case study that demonstrates the practical application of the task analysis method in HRA. The case study is based on a simulator-training scenario with a focus on simultaneous activities, which augments the need to consider a wide set of performance requirements and causality descriptions in task analysis. The training scenario is relevant to practical application of the method because simulators are an important industry tool for the validation of drilling crews as qualified barrier elements in well operations. Simultaneous activities are defined as [55]: “Activities that are executed concurrently on the same installation, such as production activities, drilling and well activities, maintenance and modification activities, and critical activities”. Critical activity is “any activity that potentially can cause serious injury or death to people, significant pollution of the environment, or substantial financial losses”.
The case study describes a scenario where drilling and crane operations are both occurring on a floating rig. The lifting operations will cause movement and tilting of the rig, which again obviously may affect situational elements on the rig floor and potentially also the behaviour of the drilling crew. As an example used in the case study, the mud circulation breaks during drill pipe connections, which may cause sufficient pressure drop in the wellbore to cause a kick influx. A smaller kick influx relevant to this scenario may be difficult to detect under these circumstances; namely, with a limited number of kick-indicating parameters and with pit level fluctuations occurring naturally due to rig movements.

3.1. HTA and SADT in Task Analysis

‘Driller to activate the BOP in event of a well kick within 40 min’ is the action used as the scenario to be analysed, and the embodiment of a representative HTA diagram is seen in Figure 7. Monitoring for changes in established well footprints and trends is given as the primary means available to the driller in search for indications of a kick. The monitored parameters include mud pit level, indicators of return flow such as flowmeter paddles or trip tank, rig pump pressure, rig pump speed, rate of drill bit penetration, drill bit torque, and the up and down weight of the drill string. If any of these parameters change, this may indicate that the well is kicking. If the driller acknowledges symptoms of a kick, the next step normally entails a diagnosis operation, denoted as a flow check (Operation 1.2). If the flow check confirms a kick, the next steps for the driller are to secure the well by confirmed closure of the BOP as indicated in Figure 7 by Subtask 2 and Operations 2.1 and 2.2.
Figure 8 illustrates the further SADT development of the HTA, which is the next step in the method. Unfortunately, governing documents, plans, and procedures relevant to this case study are not available to the public. The detailed task analysis may also easily become overly labour-intensive for the purpose of an article. Therefore, Figure 8 focuses on the Action 1.1.1 branch. Figure 4 includes the critical importance assigned to respective Action tags 1.1.1–1.1.6 in the case study, and Action 1.1.1 is selected since it is categorized as essential to the operation.

3.2. Causal Classifications in Task Analysis

Figure 9 shows the embodiment of a causal classification scheme made from task analysis with the HFE scenario development and with explicit use of terminology relevant to different task breakdown levels, as in system failure analysis [41]. The concepts follow the structural levels of the HTA-SADT analysis, which provides logical HFE causality descriptions for the task failure scenario. Figure 9 naturally shows an undirected scheme, dislocated from the chain-of-event paradigm, where arrows show how concepts of human behaviour relate on all levels in an organisation.

3.3. Apply QFD in Task Analysis

The QFD approach in task analysis is applied to Operation 1.1 with an error cause of ‘mistake’ in the simulator training scenario. Table 5 and Table 6 show the results produced from the evaluations in procedure Step 2 and Step 3, respectively. The results reflect that the social and cognitive requirements for personnel in crews and command chains should increase with the inaccuracy of the technology used as activity aids. For example, measurements that concern mud returns from the well will often be more irregular and inaccurate than measurements of mud flowing into the well during drilling. Table 7 shows the matrix from the HoQ 1 relationship evaluations.
Table 8 shows that the previous emphasis on social and cognitive action requirements are now reflected at the operation level, as high weights are given to the PIFs relevant to the performance of individuals and teamwork such as competence, communication, and supervision.

4. Discussion

This section includes a discussion of a proposed task analysis method in HRA in terms of its broader application to HRA causal evaluations in the nuclear power industry HRA. NUREG-2199 [10] describes a method developed based on cognitive basis [34] in order to secure more consistent HRA among analysts in the nuclear power industry. The NUREG method delimitations suggest prescriptive application, which is more restrictive than the method proposed, which considers the harsh physical environment and complex interactions among service providers descriptive of offshore drilling activities. The task analysis procedure focuses on specific requirements for team recovery scenarios based on the given initiating events and diagrams of crew response options during internal, at-power situations.
NUREG-2199 ([10], p. 14) describes the HFE probability estimation based on the following procedure:
(i)
Identify the crew failure mode (CFM) of critical tasks part of HFE defined with an internal at-power accident scenario.
(ii)
Deduce the HEP of each CFM; i.e., apply the decision tree provided in the method, which includes appropriate HEP values based on evaluations made of relevant PIF sets. The HEP estimation follows a predefined one-to-many framework:
  • An accident scenario includes HFEs,
  • HFEs include critical tasks,
  • critical tasks include CFMs,
  • each CFM can be linked to a HEP,
  • HEPs are linked to sets of traditional PIFs in HRA.
The PIF sets are adopted from a cognitive basis [34]. NUREG-2114 [34] presents a consolidation of human performance and cognitive research into a framework for human error causal analysis. The framework comprises five macrocognitive functions associated with CFMs. Teamwork is an example of one such function defined that is associated with over forty PIFs. A large PIF list becomes unwieldly in QFD and AHP, but we may note proximate causes defined as a means of grouping the PIFs in an evaluation. This is similar to the grouping of action error causes in the method proposed.
The cognitive basis builds on concepts of perceptual cycle and sensemaking, which may be reasonable for causal analysis by trained experts who diligently follow procedures when performing control room tasks during internal, at-power events. These concepts suggest a causality focused on the long-term strategic and educational purpose of situation assessments, which involve recursive cognitive adaption to familiar control room scenarios ([34], p. 76). Argued differently [18], the situation awareness concept may also consider situation assessments as fast and linear, as a basis for near-future actions directed at a novel, fast-paced, and noisy work environment. This may help explain the different definitions of mental factors noted between cognitive basis and Figure 5, and indicate a potential desire for a different cognitive basis in task analysis tailored to the HRA scope. The implications of workplace conditions in task analysis that follows from different cognitive concepts used in HRA is not addressed here, but could be of interest as further work. This also may concern performance requirements, which only considers a teamwork setting, since no individual can be made responsible for operating such complex power plants alone. For example, NUREG-2199 ([10], p. 16) only briefly discusses general requirements for task analysis, which are described by terms such as success requirements, cognitive requirements, maximum time requirements, task requirements, resource requirements, and physical requirements. Hence, the proposed method is more robust for task analysis for HRA for offshore drilling.

5. Conclusions

This article presents a novel method for explicitly linking the QFD and AHP concepts as systematic tools in task analysis for updating PIF weights in the HRA causal model. The method increases HRA procedure transparency and helps secure the consistent quality and performance of offshore drilling operation risk analysis. The method represents an improved tool for maintaining well control in cases where human task performance is crucial to well system risk.
QFD and AHP are well-known concepts, and the method has been demonstrated for the task analysis of historic well accident data as well as in a realistic case study. However, caution is advised when generalizing results from sector regulations, accident data, and case studies. Future research that may apply to this proposed task analysis method in HRA includes: the use of (i) fuzzy set theory or similar to help augment the uncertainties in task analysis; or (ii) HRA causality descriptions that adopt different type performance requirements and cognitive basis.

Author Contributions

Writing—Original Draft Preparation, G.-O.S.; Writing—Review & Editing, G.-O.S. and C.H.

Funding

This research received no external funding.

Acknowledgments

The opinions expressed in this article are those of the authors and do not reflect any official position by NTNU. We are grateful to anonymous peers for providing valuable suggestions for improvements.

Conflicts of Interest

The authors declare no conflict of interest.

Nomenclature

AHPanalytical hierarchy process
BOPblowout preventer
CFMcrew failure mode
HEPhuman (operator) error probabilities
HFACShuman factor analysis and classification system
HFEhuman failure event
HMIhuman–machine interface
HoQhouse of quality
HRAhuman reliability analysis
HTAhierarchical task analysis
NUREGU.S. nuclear regulatory commission
PIFperformance (risk)-influencing factor
QFDquality function deployment
SADTstructured analysis and design technique
SCADAsupervisory control and data acquisition

References

  1. Strand, G.O.; Lundteigen, M.A. Human Factors Modelling in Offshore Drilling Operations. J. Loss Prev. Process Ind. 2016, 43, 654–667. [Google Scholar] [CrossRef]
  2. Petroleum Safety Authority Norway (PSA). Principles for Barrier Management in the Petroleum Industry; The Petroleum Safety Authority Norway: Stavanger, Norway, 2017. [Google Scholar]
  3. Lootz, E.; Ovesen, M.; Tinmannsvik, R.K.; Hauge, S.; Okstad, E.H.; Carlsen, I.M. Risk of Major Accidents: Causal Factors and Improvement Measures Related to Well Control in the Petroleum Industry; Society of Petroleum Engineers: Galvestone, TX, USA, 2013. [Google Scholar]
  4. Petroleum Safety Authority Norway (PSA). The Trends in Risk Level in the Norwegian Petroleum Activity (Rnnp)—Main Report 2012; The Petroleum Safety Authority Norway: Stavanger, Norway, 2013. [Google Scholar]
  5. Strand, G.O. Well Safety: Risk Control in the Drilling Phase of Offshore Wells. Ph.D. Thesis, The Norwegian University of Science and Technology, Trondheim, Norway, 2017. [Google Scholar]
  6. NUREG-1792. Good Practices for Implementing Human Reliability Analysis (Hra); US Nuclear Regulatory Commission: Washington, DC, USA, 2005.
  7. NUREG/CR-6883. The Spar-H Human Reliability Analysis Method; US Nuclear Regulatory Commission: Washington, DC, USA, 2005.
  8. Health and Safety Executive (HSE). Review of Human Reliability Assessment Methods; Health and Safety Executive: Derbyshire, UK, 2009. [Google Scholar]
  9. Boring, R.L. Adapting Human Reliability Analysis from Nuclear Power to Oil and Gas Applications. In Proceedings of the European Safety and Reliability (ESREL), Zurich, Switzerland, 7–10 September 2015. [Google Scholar]
  10. NUREG-2199. An Integrated Human Event Analysis System (Idheas) for Nuclear Power Plant Internal Events at-Power Application; US Nuclear Regulatory Commission: Washington, DC, USA, 2017; Volume 1.
  11. Schönbeck, M.; Rausand, M.; Rouvroye, J. Human and Organisational Factors in the Operational Phase of Safety Instrumented Systems: A New Approach. Saf. Sci. 2010, 48, 310–318. [Google Scholar] [CrossRef]
  12. Boring, R.L.; Hendrickson, S.M.L.; Forester, J.A.; Tran, T.Q.; Lois, E. Issues in Benchmarking Human Reliability Analysis Methods: A Literature Review. Reliab. Eng. Syst. Saf. 2010, 95, 591–605. [Google Scholar] [CrossRef]
  13. French, S.; Bedford, T.; Pollard, S.J.T.; Soane, E. Human Reliability Analysis: A Critique and Review for Managers. Saf. Sci. 2011, 49, 753–763. [Google Scholar] [CrossRef] [Green Version]
  14. Perrow, C. Normal Accident at Three Mile Island. Society 1981, 18, 17–26. [Google Scholar] [CrossRef]
  15. Reason, J. Managing the Risks of Organisational Accidents; Ashgate: Farnham, UK, 1997. [Google Scholar]
  16. Kahneman, D. Thinking, Fast and Slow; Allen Lane: London, UK, 2011. [Google Scholar]
  17. Stanton, N.A.; Salmon, P.M.; Walker, G.H. Let the Reader Decide: A Paradigm Shift for Situation Awareness in Sociotechnical Systems. J. Cogn. Eng. Decis. Mak. 2015, 9, 44–50. [Google Scholar] [CrossRef]
  18. Endsley, M.R. Situation Awareness Misconceptions and Misunderstandings. J. Cogn. Eng. Decis. Mak. 2015, 9, 4–32. [Google Scholar] [CrossRef] [Green Version]
  19. Strand, G.O.; Lundteigen, M.A. On the Role of Hmi in Human Reliability Analysis of Offshore Drilling Operations. J. Loss Prev. Process Ind. 2017, 49, 191–208. [Google Scholar] [CrossRef]
  20. Shappell, S.A.; Wiegmann, D.A. Applying Reason: The Human Factors Analysis and Classification System (Hfacs). Hum. Factors Aerosp. Saf. 2001, 1, 59–86. [Google Scholar]
  21. DoD. Human Factors Analysis and Classification System (Hfacs)—A Mishap Investigation and Data Analysis Tool. US Department of Defense. Available online: http://www.public.navy.mil/navsafecen/Documents/aviation/aeromedical/DOD_HF_Anlys_Clas_Sys.pdf (accessed on 29 July 2018).
  22. Theophilus, S.C.; Esenowo, V.N.; Arewa, A.O.; Ifelebuegu, A.O.; Nnadi, E.O.; Mbanaso, F.U. Human Factors Analysis and Classification System for the Oil and Gas Industry (Hfacs-Ogi). Reliab. Eng. Syst. Saf. 2017, 167, 168–176. [Google Scholar] [CrossRef]
  23. Rasmussen, J. Human Error Data, Facts or Fiction? In Accident Research; Risø National Laboratory: Rovaniemi, Finland, 1985. [Google Scholar]
  24. Embrey, D.E. Sherpa: A Systematic Human Error Reduction and Prediction. In Proceedings of the International Meeting on Advances in Nuclear Power Systems, Knoxville, TN, USA, 21–24 April 1986. [Google Scholar]
  25. HSE CRR 245/1999. The Implementation of Core-Data, a Computerised Human Error Probability Database; Health and Safety Executive: Bootle, UK, 1999. [Google Scholar]
  26. Stanton, N.A.; Salmon, P.M. Human Error Taxonomies Applied to Driving: A Generic Driver Error Taxonomy and Its Implications for Intelligent Transport Systems. Saf. Sci. 2009, 47, 227–237. [Google Scholar] [CrossRef]
  27. IFE/HR/E-2017/001. The Petro-Hra Guideline; Institute for Energy Technology: Halden, Norway, 2017. [Google Scholar]
  28. Petrillo, A.; Falcone, D.; De Felice, F.; Zomparelli, F. Development of a Risk Analysis Model to Evaluate Human Error in Industrial Plants and in Critical Infrastructures. Int. J. Disaster Risk Reduct. 2017, 23, 15–24. [Google Scholar] [CrossRef]
  29. NUREG/CR-6350. A Technique for Human Error Analysis (Atheana)—Technical Basis and Methodology Description; U.S. Nuclear Regulatory Commission: Washington, DC, USA, 1996.
  30. Sasou, K.; Reason, J. Team Errors: Definition and Taxonomy. Reliab. Eng. Syst. Saf. 1999, 65, 1–9. [Google Scholar] [CrossRef]
  31. Aven, T.; Sklet, S.; Vinnem, J.E. Barrier and Operational Risk Analysis of Hydrocarbon Releases (Bora-Release): Part I. Method Description. J. Hazard. Mater. 2006, 137, 681–691. [Google Scholar] [CrossRef] [PubMed]
  32. Vinnem, J.E.; Bye, R.; Gran, B.A.; Kongsvik, T.; Nyheim, O.M.; Okstad, E.H.; Seljelid, J.; Vatn, J. Risk Modelling of Maintenance Work on Major Process Equipment on Offshore Petroleum Installations. J. Loss Prev. Process Ind. 2012, 25, 274–292. [Google Scholar] [CrossRef]
  33. Hollnagel, E. Chapter 6—CREAM—A Second Generation HRA Method. In Cognitive Reliability and Error Analysis Method (Cream); Elsevier Science Ltd.: Oxford, UK, 1998. [Google Scholar]
  34. NUREG-2114. Cognitive Basis for Human Reliability Analysis; US Nuclear Regulatory Commission: Washington, DC, USA, 2016.
  35. Mosleh, A.; Chang, Y.H. Model-Based Human Reliability Analysis: Prospects and Requirements. Reliab. Eng. Syst. Saf. 2004, 83, 241–253. [Google Scholar] [CrossRef]
  36. Groth, K.M.; Mosleh, A. A Data-Informed Pif Hierarchy for Model-Based Human Reliability Analysis. Reliab. Eng. Syst. Saf. 2012, 108, 154–174. [Google Scholar] [CrossRef]
  37. Pandya, D.; Podofillini, L.; Emert, F.; Lomax, A.J.; Dang, V.N. Developing the Foundations of a Cognition-Based Human Reliability Analysis Model Via Mapping Task Types and Performance-Influencing Factors: Application to Radiotherapy. Proc. Inst. Mech. Eng. 2018, 232, 3–37. [Google Scholar] [CrossRef]
  38. Calvo Olivares, R.D.; Rivera, S.S.; Núñez Mc Leod, J.E. A Novel Qualitative Prospective Methodology to Assess Human Error during Accident Sequences. Saf. Sci. 2018, 103, 137–152. [Google Scholar] [CrossRef]
  39. Stanton, N.A. Hierarchical Task Analysis: Developments, Applications, and Extensions. Appl. Ergon. 2006, 37, 55–79. [Google Scholar] [CrossRef] [PubMed]
  40. Rausand, M.; Høyland, A. System Reliability Theory; Models, Statistical Methods, and Applications; John Wiley & Sons: Hoboken, NJ, USA, 2004. [Google Scholar]
  41. Rausand, M.; Øien, K. The Basic Concepts of Failure Analysis. Reliab. Eng. Syst. Saf. 1996, 53, 73–83. [Google Scholar] [CrossRef]
  42. ISO 16355-1. Application of Statistical and Related Methods to New Technology and Product Development Process—Part 1: General Principles and Perspectives of Quality Function Deployment (Qfd); International Organization for Standardization: Geneva, Switzerland, 2015. [Google Scholar]
  43. Saaty, T.L. The Analytic Hierarchy Process: Planning, Priority Setting, Resource Allocation; McGraw-Hill International Book Company: New York, NY, USA, 1980. [Google Scholar]
  44. DoD. Data Item Description, Di-Hfac-81399b: Critical Task Analysis Report; US Department of Defense: Arlington County, VA, USA, 2013. [Google Scholar]
  45. Kirwan, B.; Ainsworth, L.K. A Guide to Task Analysis; Taylor & Francis; CRC Press: Boca Raton, TL, USA, 1992. [Google Scholar]
  46. Endsley, M.R. Toward a Theory of Situation Awareness in Dynamic Systems. Hum. Factors J. Hum. Factors Ergon. Soc. 1995, 37, 32–64. [Google Scholar] [CrossRef]
  47. Rasmussen, J. Human Errors—A Taxonomy for Describing Human Malfunction in Industrial Installations. J. Occup. Accid. 1982, 4, 311–333. [Google Scholar] [CrossRef]
  48. Rosness, R.; Grøtan, T.O.; Guttormsen, G.; Herrera, I.A.; Steiro, T.; Størseth, F.; Tinmannsvik, R.K.; Wærø, I. Sintef A17034; Organisational Accidents and Resilient Organisations; Six Perspectives (Rev. 2); SINTEF: Trondheim, Norway, 2010. [Google Scholar]
  49. Braglia, M.; Fantoni, G.; Frosolini, M. The House of Reliability. Int. J. Quality Reliab. Manag. 2007, 24, 420–440. [Google Scholar] [CrossRef]
  50. Bas, E. An Integrated Quality Function Deployment and Capital Budgeting Methodology for Occupational Safety and Health as a Systems Thinking Approach: The Case of the Construction Industry. Accid. Anal. Prev. 2014, 68, 42–56. [Google Scholar] [CrossRef] [PubMed]
  51. Fargnoli, M.; Lombardi, M.; Haber, N.; Puri, D. The Impact of Human Error in the Use of Agricultural Tractors: A Case Study Research in Vineyard Cultivation in Italy. Agriculture 2018, 8, 82. [Google Scholar] [CrossRef]
  52. Fargnoli, M.; Lombardi, M.; Haber, N.; Guadagno, F. Hazard Function Deployment: A Qfd-Based Tool for the Assessment of Working Tasks—A Practical Study in the Construction Industry. Int. J. Occup. Saf. Ergon. 2018, 1–22. [Google Scholar] [CrossRef] [PubMed]
  53. Liu, H.T.; Tsai, Y. A Fuzzy Risk Assessment Approach for Occupational Hazards in the Construction Industry. Saf. Sci. 2012, 50, 1067–1078. [Google Scholar] [CrossRef]
  54. Linstone, H.A.; Turoff, M. The Delphi Method: Techniques and Applications; Addison-Wesley: Boston, MA, USA, 1975. [Google Scholar]
  55. NORSOK D-010. Well Integrity in Drilling and Well Operations; Rev. 4, D-010; NORSOK: Oslo, Norway, 2013. [Google Scholar]
Figure 1. Procedure for the drilling probabilistic risk assessment (DPRA) of well-drilling operations (adapted from [5]).
Safety 04 00039 g001
Figure 2. Structure of hierarchical task analysis.
Safety 04 00039 g002
Figure 3. A functional block in a hierarchical task analysis and structured analysis and design technique (HTA-SADT) diagram.
Safety 04 00039 g003
Figure 4. Critical importance matrix of actions in task analysis.
Safety 04 00039 g004
Figure 5. Generic causal classification scheme showing latent human error tendencies and workplace conditions as influencing factors associated with operator error causes (based on [1,19,21,48]).
Safety 04 00039 g005
Figure 6. Quality function deployment for systematic evaluation of performance requirements between action and operation levels in task analysis using two quality houses.
Safety 04 00039 g006
Figure 7. HTA in task analysis of offshore drilling activity.
Safety 04 00039 g007
Figure 8. HTA-SADT in task analysis of offshore drilling activity.
Safety 04 00039 g008
Figure 9. Causal analysis and human failure event (HFE) scenario development in task analysis of offshore drilling activity.
Safety 04 00039 g009
Table 1. Literature overview of causality descriptions popular in oil and gas industry human reliability analysis (HRA).
Application (Year)YearCausality FocusSource and Comment
General. Categorical task analysis and accident investigations (1985)1985Cognitive and sociotechnicalRasmussen ([23], Figure 3). Multifaceted taxonomy for description and analysis of events involving internal and external modes of human malfunctions. Used as a basis and inspiration for several HRA causal models, among others, Embrey [24], HSE CRR 245/1999 [25], Stanton and Salmon [26], IFE/HR/E-2017/001 [27], and Petrillo et al. [28].
Nuclear power industry. HRA (1996)1996CognitiveNUREG/CR-6350 [29]. Introduces quantification of human failure events within an error-forcing context (mental) as an alternative to HRA where events are defined and quantified as the result of being random operator failures (‘Bernoulli trials’).
Categorical task analysis and accident investigations (1997)1997SociotechnicalThree-level hierarchical energy defence model proposed by Reason [15]. Sasou and Reason [30], in the model, describe the causality of team errors as the result of underlying failure to notice, notify, and negate a tendency for unsafe acts. Used as a basis and inspiration for several offshore HRA causal models, among others, Aven et al. [31], Vinnem et al. [32], and Strand and Lundteigen [1].
Nuclear power industry. HRA (1998)1998CognitiveHollnagel [33]. Focused on chaotic mental processes for choice of actions as an alternative to information processing models.
Military aviation. Categorical task analysis and accident investigations (2001)2001Sociotechnical and biomechanical/physiologicalShappell and Wiegmann [20,21], based on Reason [15]. An overview of several civil adaptations is provided by Theophilus et al. ([22], Table 1).
Nuclear power industry. HRA (2005)2005SociotechnicalNUREG/CR-6883 [7], developed as a simple multiplier alternative to more complex approaches such as NUREG/CR-6350 [29]. Used as a basis in IFE/HR/E-2017/001 [27] and Petrillo et al. [28].
Nuclear power industry. HRA (2016)2016CognitiveNUREG-2114 [34], based on Mosleh and Chang [35] and Groth and Mosleh [36]. Flat structure with predefined accident scenario developed to reduce analyst-to-analyst variability, add realisms, and to improve transparency and traceability of nuclear HRA. Applied to HRA in NUREG-2199 [10] and also adapted to radiotherapy by Pandya et al. [37].
Petrochemical industry. Categorical task analysis (2018)2018SociotechnicalCalvo Olivares, et al. [38]. Analysis delimited to human–machine information functions with procedures.
Table 2. Terminology relevant to task analysis of offshore drilling activity (adapted from [5]).
TermDefinition
Human failure eventA collective term for an event that represents a failure or unavailability of a component, system, or function that is attributed to human inaction or an inappropriate action.
Note: A human failure event may include many operator errors consolidated as a defined scenario.
Operator errorFailure of operator to act according to stated performance requirement(s).
Note 1: Operator errors are associated with normative human (individual or team) behaviour or unsafe acts, which are not intended or not desired.
Note 2: Operator errors are associated with a predefined level of departure accepted as conclusive evidence. Departure denotes a discrepancy between a computed, observed, or measured operator performance and the target stated in the performance requirement standard.
Operator performance requirementA stated need or expectation about operator performance considered necessary in order to accomplish a given task objective.
Note: Operator performance requirements may: (i) be an expectation implied from the human–machine interface; (ii) by implication, also cover what the operator should not do.
Operator error modeThe manner of nonconformity in which operator error occurs.
Note: Conformity means that specified requirements relating to product, process, system, person, or body are fulfilled by demonstration.
Operator error causeA set of circumstances that impairs recovery from undesired effects of operator behaviour.
Operator performance influenceA process of departure or recovery described by workplace conditions and latent human error tendencies.
Note: The consolidated description of the departure process in human performance analysis may typically include a set of performance-influencing factors.
Operator error effectObservable consequence of operator error, within or beyond the boundary of a sociotechnical system entity.
Note: Effects of operator actions may be associated with short-term effects on task objectives. For example, an action may be categorised as: (i) recovery; (ii) departure; or (iii) indifferent.
Table 3. Well accident data causal classifications made in validation of task analysis.
Accident Data [19]Organisation InfluenceCauseWorkplace InfluenceCauseHuman InfluenceCause
Snorre
  • Leadership
  • Stakeholders
  • Energy and defences
  • Competence
  • Supervision HMI
  • Governing documents
  • Mistake
  • Lapse
  • Violation
  • Cognitive bias
  • Groupthink
  • Adverse physiological/physical factors
  • Fast thinking (too optimistic)
  • Shared bias (risky shift)
  • Perceptual factors
Montara
  • Leadership
  • Stakeholders
  • Regulations
  • Industry standards
  • Energy and defences
  • Competence and cooperation
  • Conflict of interest
  • Competence
  • Supervision
  • Work descriptions
  • Governing documents HMI
  • Mistake
  • Lapse
  • Violation
  • Cognitive bias
  • Groupthink
  • Adverse physiological/physical factors
  • Fast thinking (too optimistic)
  • Power of reinforcements
  • Shared bias (risky shift)
  • Perceptual factors
Macondo
  • Leadership
  • Stakeholders
  • Regulations
  • Industry standards
  • Energy and defences
  • Complexity and coupling
  • Conflict of interest
  • Competence
  • Supervision HMI
  • Communication
  • Disposable work descriptions
  • Governing documents
  • Mistake
  • Lapse
  • Violation
  • Cognitive bias
  • Groupthink
  • Adverse physiological/physical factors
  • Fast thinking (over-confident)
  • Power of reinforcements
  • Tacit disagreement
  • Pluralistic ignorance
  • Perceptual factors
Gullfaks
  • Leadership
  • Stakeholders
  • Industry standards
  • Complexity and coupling
  • Energy and defences
  • Competence
  • Supervision
  • Governing documents
  • Mistake
  • Violation
  • Adverse mental factors
  • Cognitive bias
  • Groupthink
  • Cognitive capabilities (technical/operational complexity)∙ Fast thinking (over-confident)
  • Shared bias (risky shift)
Table 4. Evaluation of the house of quality 1 (HoQ 1) relationship matrix in a case study when scores represent triangle distributions.
Kick Monitoring ActionsPriority ScoreSubgroup C1Subgroup C2Subgroup C3
Mud pit levels5531
Flow rates3531
Drill bit torque3311
Rate of penetration3111
Stand-pipe pressure3111
Weight of drill string3111
Rig pump speed3111
Priority weights-40.00038.33323.000
Normalised priority weights-0.4440.3470.208
Table 5. Case study: Pairwise correlation of submatrices.
Subgroup MatrixAction Error CauseValues
C1Fast thinking13335
Power of reinforcements0.3331311
Cognitive dissonance0.3330.333111
Heuristics0.3331.0001.00011
Ego depletion0.2001.0001.0001.0001
Total2.2006.3339.0007.0009.000
C2Shared bias (risky shift)11335
Pluralistic ignorance1.0001331
Tacit disagreement0.3330.333131
False consensus0.3330.3330.33311
Shared bias (cautious shift)0.2001.0001.0001.0001
Total2.8673.6678.33311.0009.000
C3Perceptual factors13333
Cognitive capabilities0.3331311
General ‘state of health’0.3330.333131
Biomechanical limits0.3331.0000.33311
Psycho-behavioural0.3331.0001.0001.0001
Total2.3336.3338.3339.0007.000
Table 6. Case study: Normalised correlation of submatrices.
Subgroup MatrixValuesNormalised WeightConsistency Ratio
C10.4550.4740.3330.4290.5560.4490.041
0.1520.1580.3330.1430.1110.179-
0.1520.0530.1110.1430.1110.114-
0.1520.1580.1110.1430.1110.135-
0.0910.1580.1110.1430.1110.123-
C20.3490.2730.3600.2730.5560.3620.085
0.3490.2730.3600.2730.1110.273-
0.1160.0910.1200.2730.1110.142-
0.1160.0910.0400.0910.1110.090-
0.0700.2730.1200.0910.1110.133-
C30.4290.4740.3600.3330.4290.4050.095
0.1430.1580.3600.1110.1430.183-
0.1430.0530.1200.3330.1430.158-
0.1430.1580.0400.1110.1430.119-
0.1430.1580.1200.1110.1430.135-
Table 7. Case study: Evaluation of first relationship matrix.
Kick Monitoring ActionsPriority ScoreSub-Group C1Sub-Group C2Sub-Group C3
Mud pit levels5531
Flow rates3531
Drill bit torque3311
Rate of penetration3111
Stand-pipe pressure3111
Weight of drill string3111
Rig pump speed3111
Priority weights-613923
Normalised priority weights-0.4960.3170.187
Table 8. Case study: Evaluation of the second relationship matrix.
Action Error CausePriority ScoreCompetenceCommunicationSupervisionDisposable Work DescriptionsGoverning DocumentsPhysical EnvironmentHMI
Fast thinking0.2235331133
Power of reinforcements0.0893331133
Cognitive dissonance0.0561111131
Heuristics0.0671151113
Ego depletion0.0611351111
Shared bias (risky shift)0.1153531111
Pluralistic ignorance0.0873331313
Tacit disagreement0.0453331313
False consensus0.0283331311
Shared bias (cautious shift)0.0423331311
Perceptual factors0.0763111133
Cognitive capabilities0.0341111133
General ‘state of health’0.0301113333
Biomechanical limits0.0221113333
Psycho-behavioural0.0251113333
Priority weights-2.8542.6092.7691.1541.5592.1102.395
Normalised priority weights-0.1850.1690.1790.0750.1010.1370.155

