1. Introduction
North Dakota (ND) has observed a significant decrease in the frequency of highway rail grade crossing (HRC) accidents over the past few decades. According to the Bureau of Transportation Statistics (BTS), there are 4723 HRCs in the state of ND [
1]. Among these HRCs, 73.6% are public, 26% are private, and 0.4% are pedestrian. Numerous efforts have been undertaken to improve safety at these HRCs, including improvements under the Federal Highway Administration’s railway-highway crossings program (Section 130) and including HRCs on an annual list of proposed highway safety improvements by the ND Department of Transportation [
2,
3]. In addition, a goal of the Federal Railroad Administration (FRA) includes reducing HRC incidents through multiple dedicated programs such as the Risk Reduction Program [
4] and the Railroad Safety Management Program [
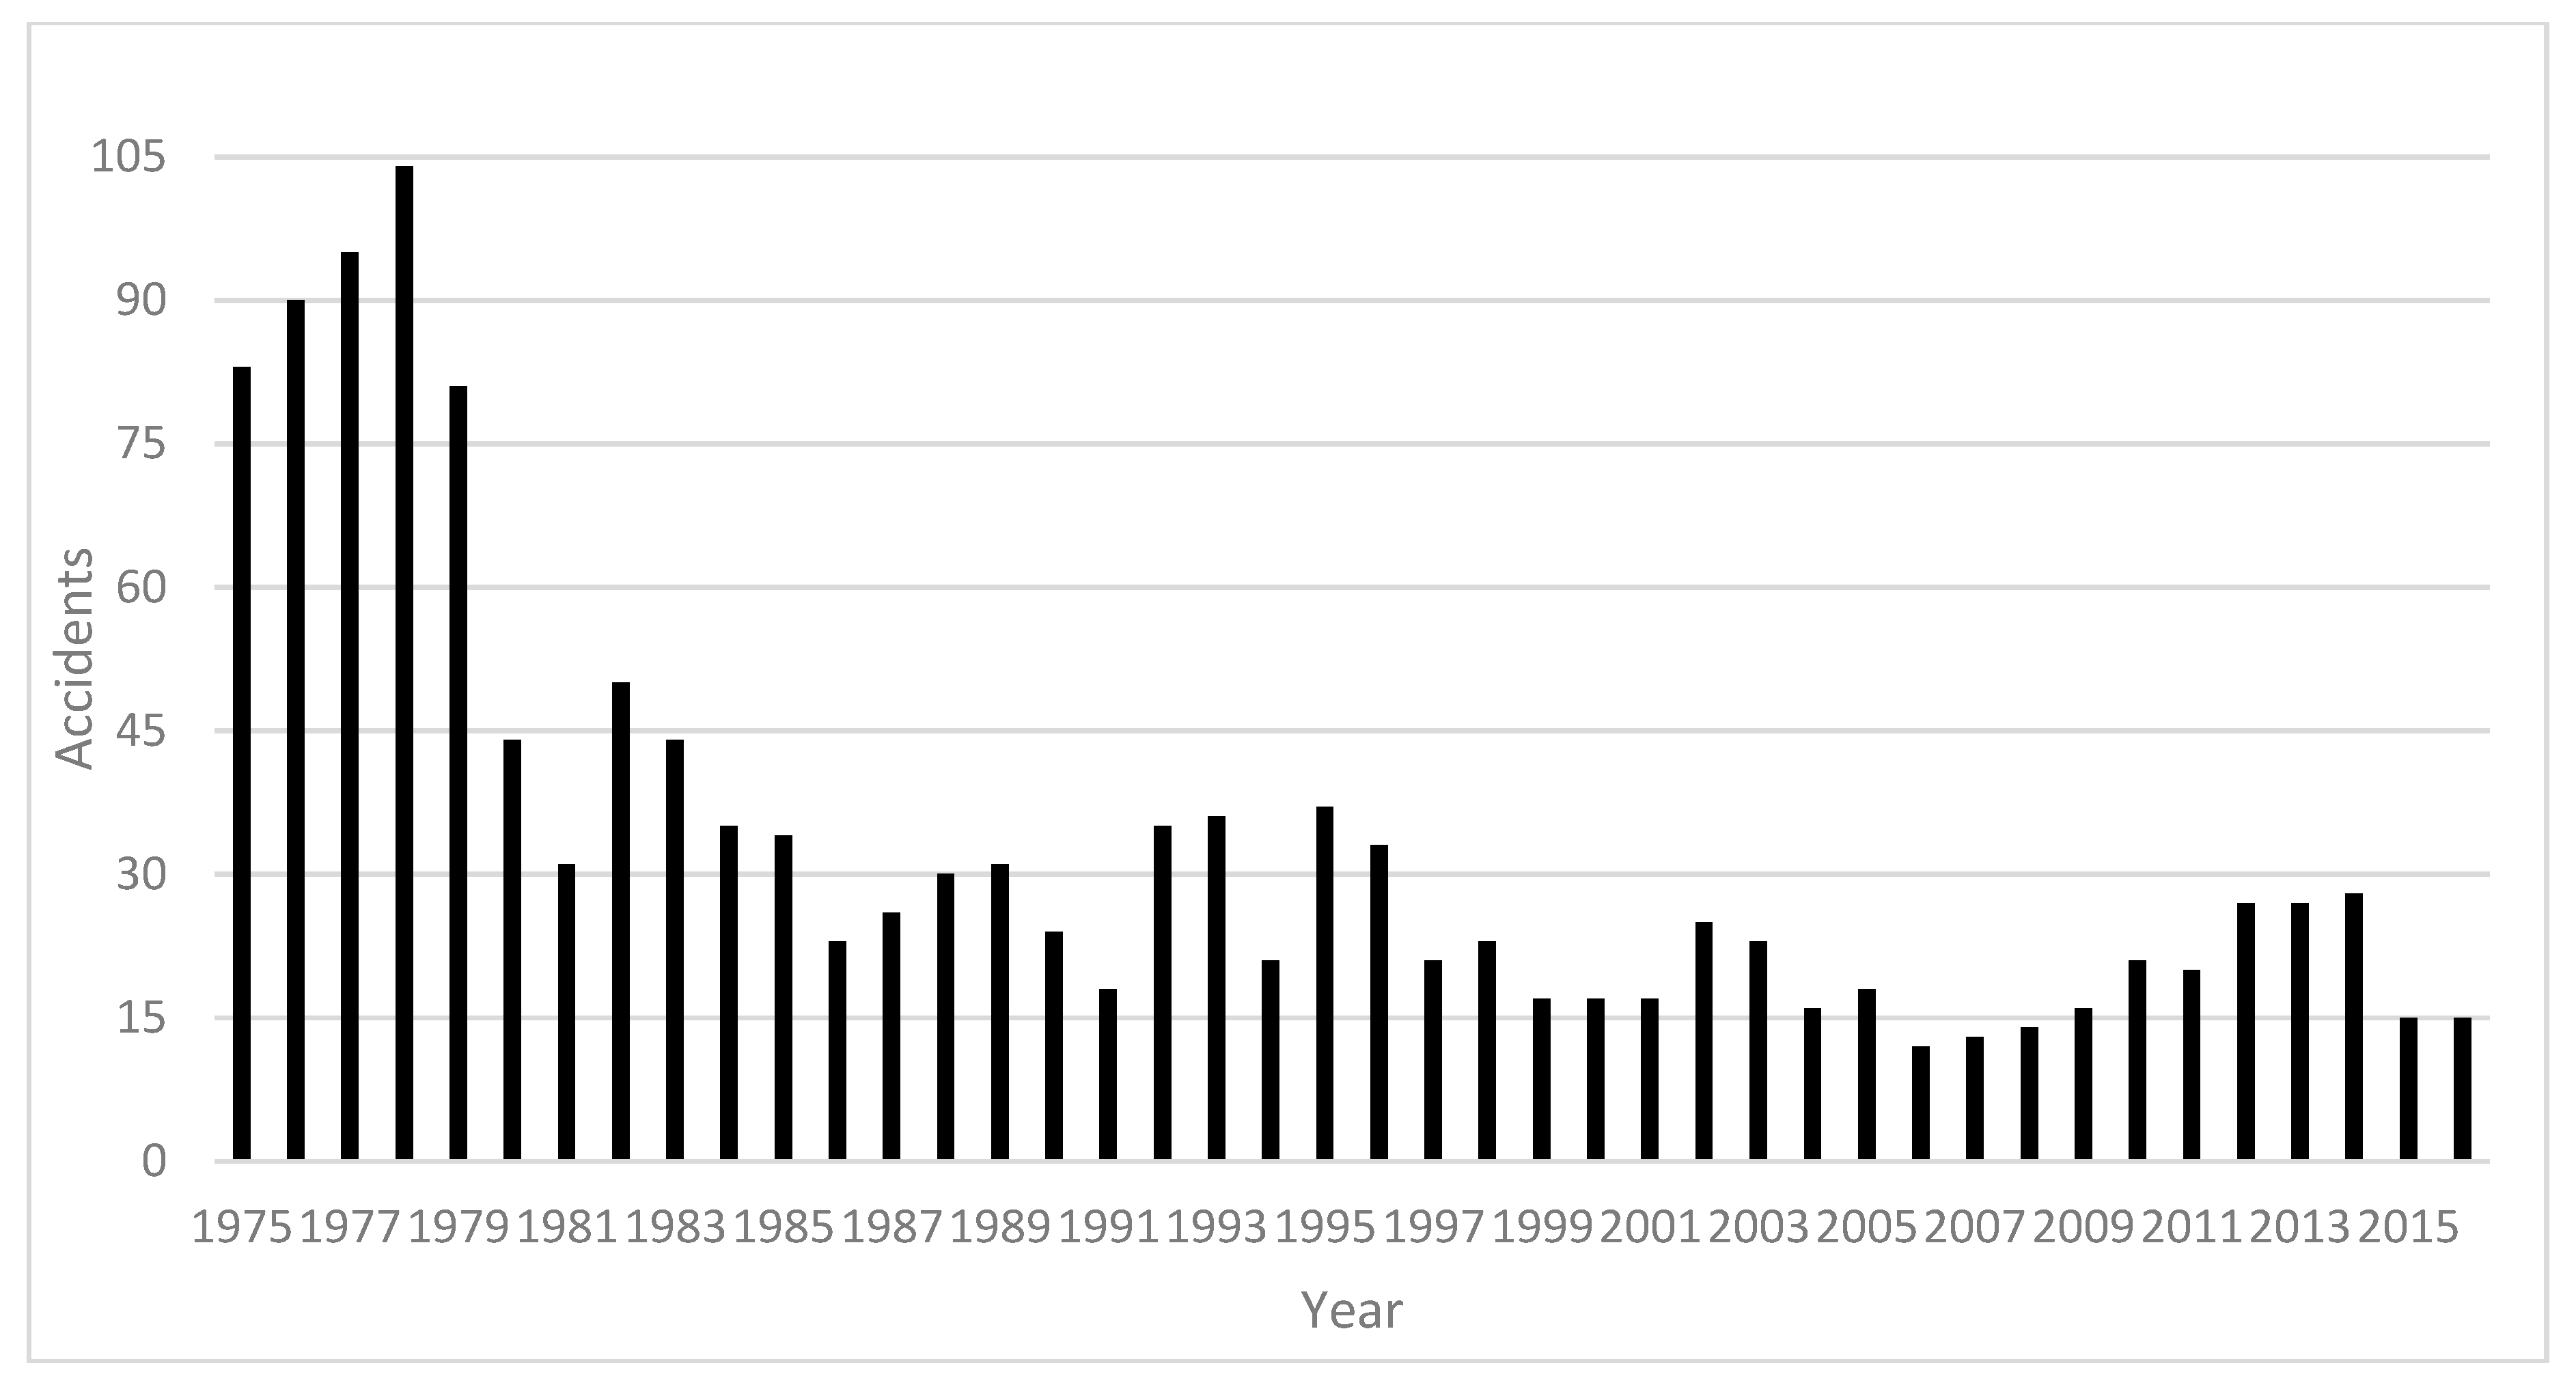
5]. These efforts reduced ND HRC accidents up to 82% between 1975 and 2016, as can be seen in
Figure 1 [
6]. This decrease has been observed despite increases in travel miles and traffic volume on both highways and railroads.
According to the FRA, a motorist is 20 times more likely to die in a crash involving a train compared to a crash between motor vehicles. HRC accidents cause not only injury and death, but also economic loss. The families of people injured or killed in HRC accidents must cope with both suffering and medical costs. Therefore, it is important to conduct a comprehensive study to identify crucial factors that contribute to the occurrence of accidents at HRCs. HRC accidents occur as a result of complex combinations of several contributing factors including roadway and railroad track geometry, rail characteristics, vehicle and traffic characteristics, driver characteristics, time of day, environmental and weather conditions, etc.
Various studies have been carried out to explain the relationship between accident frequency (number of accidents during specific period of time) and associated factors for predicting HRC accident likelihood. Efforts to improve HRC safety have long emphasized an ample understanding of these crash occurrences. Most collisions at HRCs occur as a result of motorists’ actions, while a small number occur due to signal or crossing gate failures. To reduce accidents and further improve safety, the safe operation of vehicles, railroad signals, and safety features at HRCs is necessary.
Current estimates indicate that both highway and railroad infrastructure in the ND are being improved to accommodate greater speeds and a larger traffic volume. With these advancements, further improvements to HRC safety are a huge challenge requiring ongoing research. Engineering improvements alone are only a part of the solution. According to the Transportation Research Board report [
7], there is a significant misperception among a large part of the travelling public regarding grade crossing dangers and confusion about the meaning of various warning signs. Highway users sometimes misjudge approaching train speeds and are tempted to ignore the flashing lights and/or drive around lowered gates. Almost 80% of the fatalities at HRCs occur when drivers ignore warning devices. An increase in educational activities about the safety of HRCs reduces the number of crashes [
8]. To significantly improve the safety of HRCs, a combination of education, engineering, and enforcement approaches must be employed.
According to the ND Department of Transportation, the priority indices incorporated into the HRC improvements ranking procedure include traffic volume, train volume, warning device, number of tracks, sight distance, approach grade, crossing angle, crossing condition, and road/track alignment. However, the ranking procedure does not consider some other important variables such as population and weather. To the best of the authors’ knowledge, there are crash prediction models developed by various researchers with different variables, but very few have used weather (an important factor in the ND), and none used population as contributory factors.
The objective of this paper was to develop a prediction model for HRC accidents that incorporates various contributory factors, particularly population. Statistical relationships between accident likelihood and contributory factors will be developed and examined. Understanding the significant factors that contribute to the occurrence of preventable crashes at HRCs is necessary for developing countermeasures to reduce injuries and fatalities. This study will help both transportation agencies and railroad companies better understand HRCs safety by identifying the major contributory factors. It will also help safety researchers and professionals make decisions for improving safety at HRCs.
2. Literature Review
The subject of HRC safety along with the risks has been widely studied throughout the world over the past years, mostly with an emphasis on user safety. Accident risk can be examined in two ways: accident frequency and accident severity [
9]. As far as the latter is concerned, numerous studies have been conducted by different researchers including [
10,
11,
12,
13,
14,
15]. The Federal Highway Administration (FHWA) asks every state to develop and implement a highway safety improvement program (HSIP) which is comprised of three stages: planning, implementation, and evaluation. According to Ogden [
16], the operation and safety improvements at HRCs include these same three stages and HRCs are often included in states’ HSIPs.
Previously, various models were developed to predict the crash frequency at HRCs. Lu and Tolliver [
17] developed six different models (the Poisson, the Negative binomial (NB), the Gamma, the Conway-Maxwell-Poisson, the Bernoulli, and the hurdle Poisson) by using data from ND for predicting public HRC accidents. They concluded that Bernoulli, hurdle Poisson, and Conway-Maxwell-Poisson are appropriate for analyzing ND HRC accidents because of under-dispersion (when sample mean is greater than sample variance) of the data. Zheng et al. [
18] used a decision tree approach for predicting accidents at ND HRCs and found that train speed, highway, and railroad traffic volume were significant variables. They also found that advance train detecting devices and warning systems are sometimes useful in reducing accident likelihood. Similarly, Warner et al. [
19] developed a new HRC priority formula for Texas by using 12 different variables. They validated the NB regression model with data from 9108 crossing accidents and found that their newly developed formula performed better than the old priority index formula.
According to the Manual on Uniform Traffic Control Devices (MUTCD), at least one crossbuck sign should be present at every HRC where the highway and railroad intersect each other [
20]. Similarly, the use of a stop sign is suggested at those HRCs that are without advance traffic control devices, and if two or more trains use the crossing per day [
16]. A study by Raub [
21], using 10 years (1998–2007) of crash data from the FRA accident database for seven Midwestern states, compared accident rates at four crossing types: gates, flashing lights, stop signs, and crossbucks. The study revealed that crossings with stop signs had much higher collision rates compared to other crossing types, particularly when millions of crossing vehicles were utilized to calculate the collision rate.
In recent years, researchers have developed various generalized linear models (GLM) to analyze the association between accident frequency and contributory parameters. The discrete, random, and nonnegative nature of accident frequency influences the selection of accident prediction models. Because of the non-negativity and discrete nature of accident data, mostly Poisson regression has been used for modeling. According to Zhang et al. [
22], the nonnegative and discrete nature of crash frequency data make it suitable to be modelled using GLM. However, GLM, despite having the necessary components for accident description, faces several data challenges, having a potential error source in the form of specifying incorrect statistical models which may result in erroneous predictions and descriptive variables [
23]. Under- or over-dispersion are the two most conventional issues which crash data possess. Occasionally, crash data exhibit under-dispersion where the sample mean is greater than sample variance [
24]. Most of the time, the crash database shows over-dispersion where the sample mean is smaller than sample variance and arises due to the ambiguity connected with observed and unobserved parameters [
25]. Because of the discrete data modeling approach requirement of the mean being equal to the variance, these problems can be challenging [
23]. In the case of over-dispersion, the available adjustment of the NB model can be made to the Poisson model to accommodate the over-dispersion [
23]. On the other hand, less familiar models like the gamma probability count model can be used for treating under-dispersion [
24].
The literature review reveals that most of the research conducted in the past has focused on identifying and quantifying the relationship between accident likelihood and various factors. To the best of the authors’ knowledge, these contributory factors include traffic conditions, environmental conditions, warning devices, and crossing inventory characteristics, but no researcher has included population. According to FRA and National Highway Traffic Safety Administration (NHTSA) statistics, three out of four accidents at HRCs occur within 25 miles of a person’s home and 50% of the accidents at HRCs within five miles of a person’s home [
26]. Therefore, taking into account the later statistics of NHTSA, this study investigates the effects of population located within a five-mile radius of HRCs along with other contributing factors on accident likelihood.
3. Methodology
3.1. Data Source
Data to support this study were obtained from four major resources:
ND Geographic Information Systems Hub (NDGIS Hub) [
27]
Office of Safety, Federal Railroad Administration (highway-rail crossing inventory)
Office of Safety, Federal Railroad Administration (highway-rail crossing accident/incident database)
United States Census Bureau [
28]
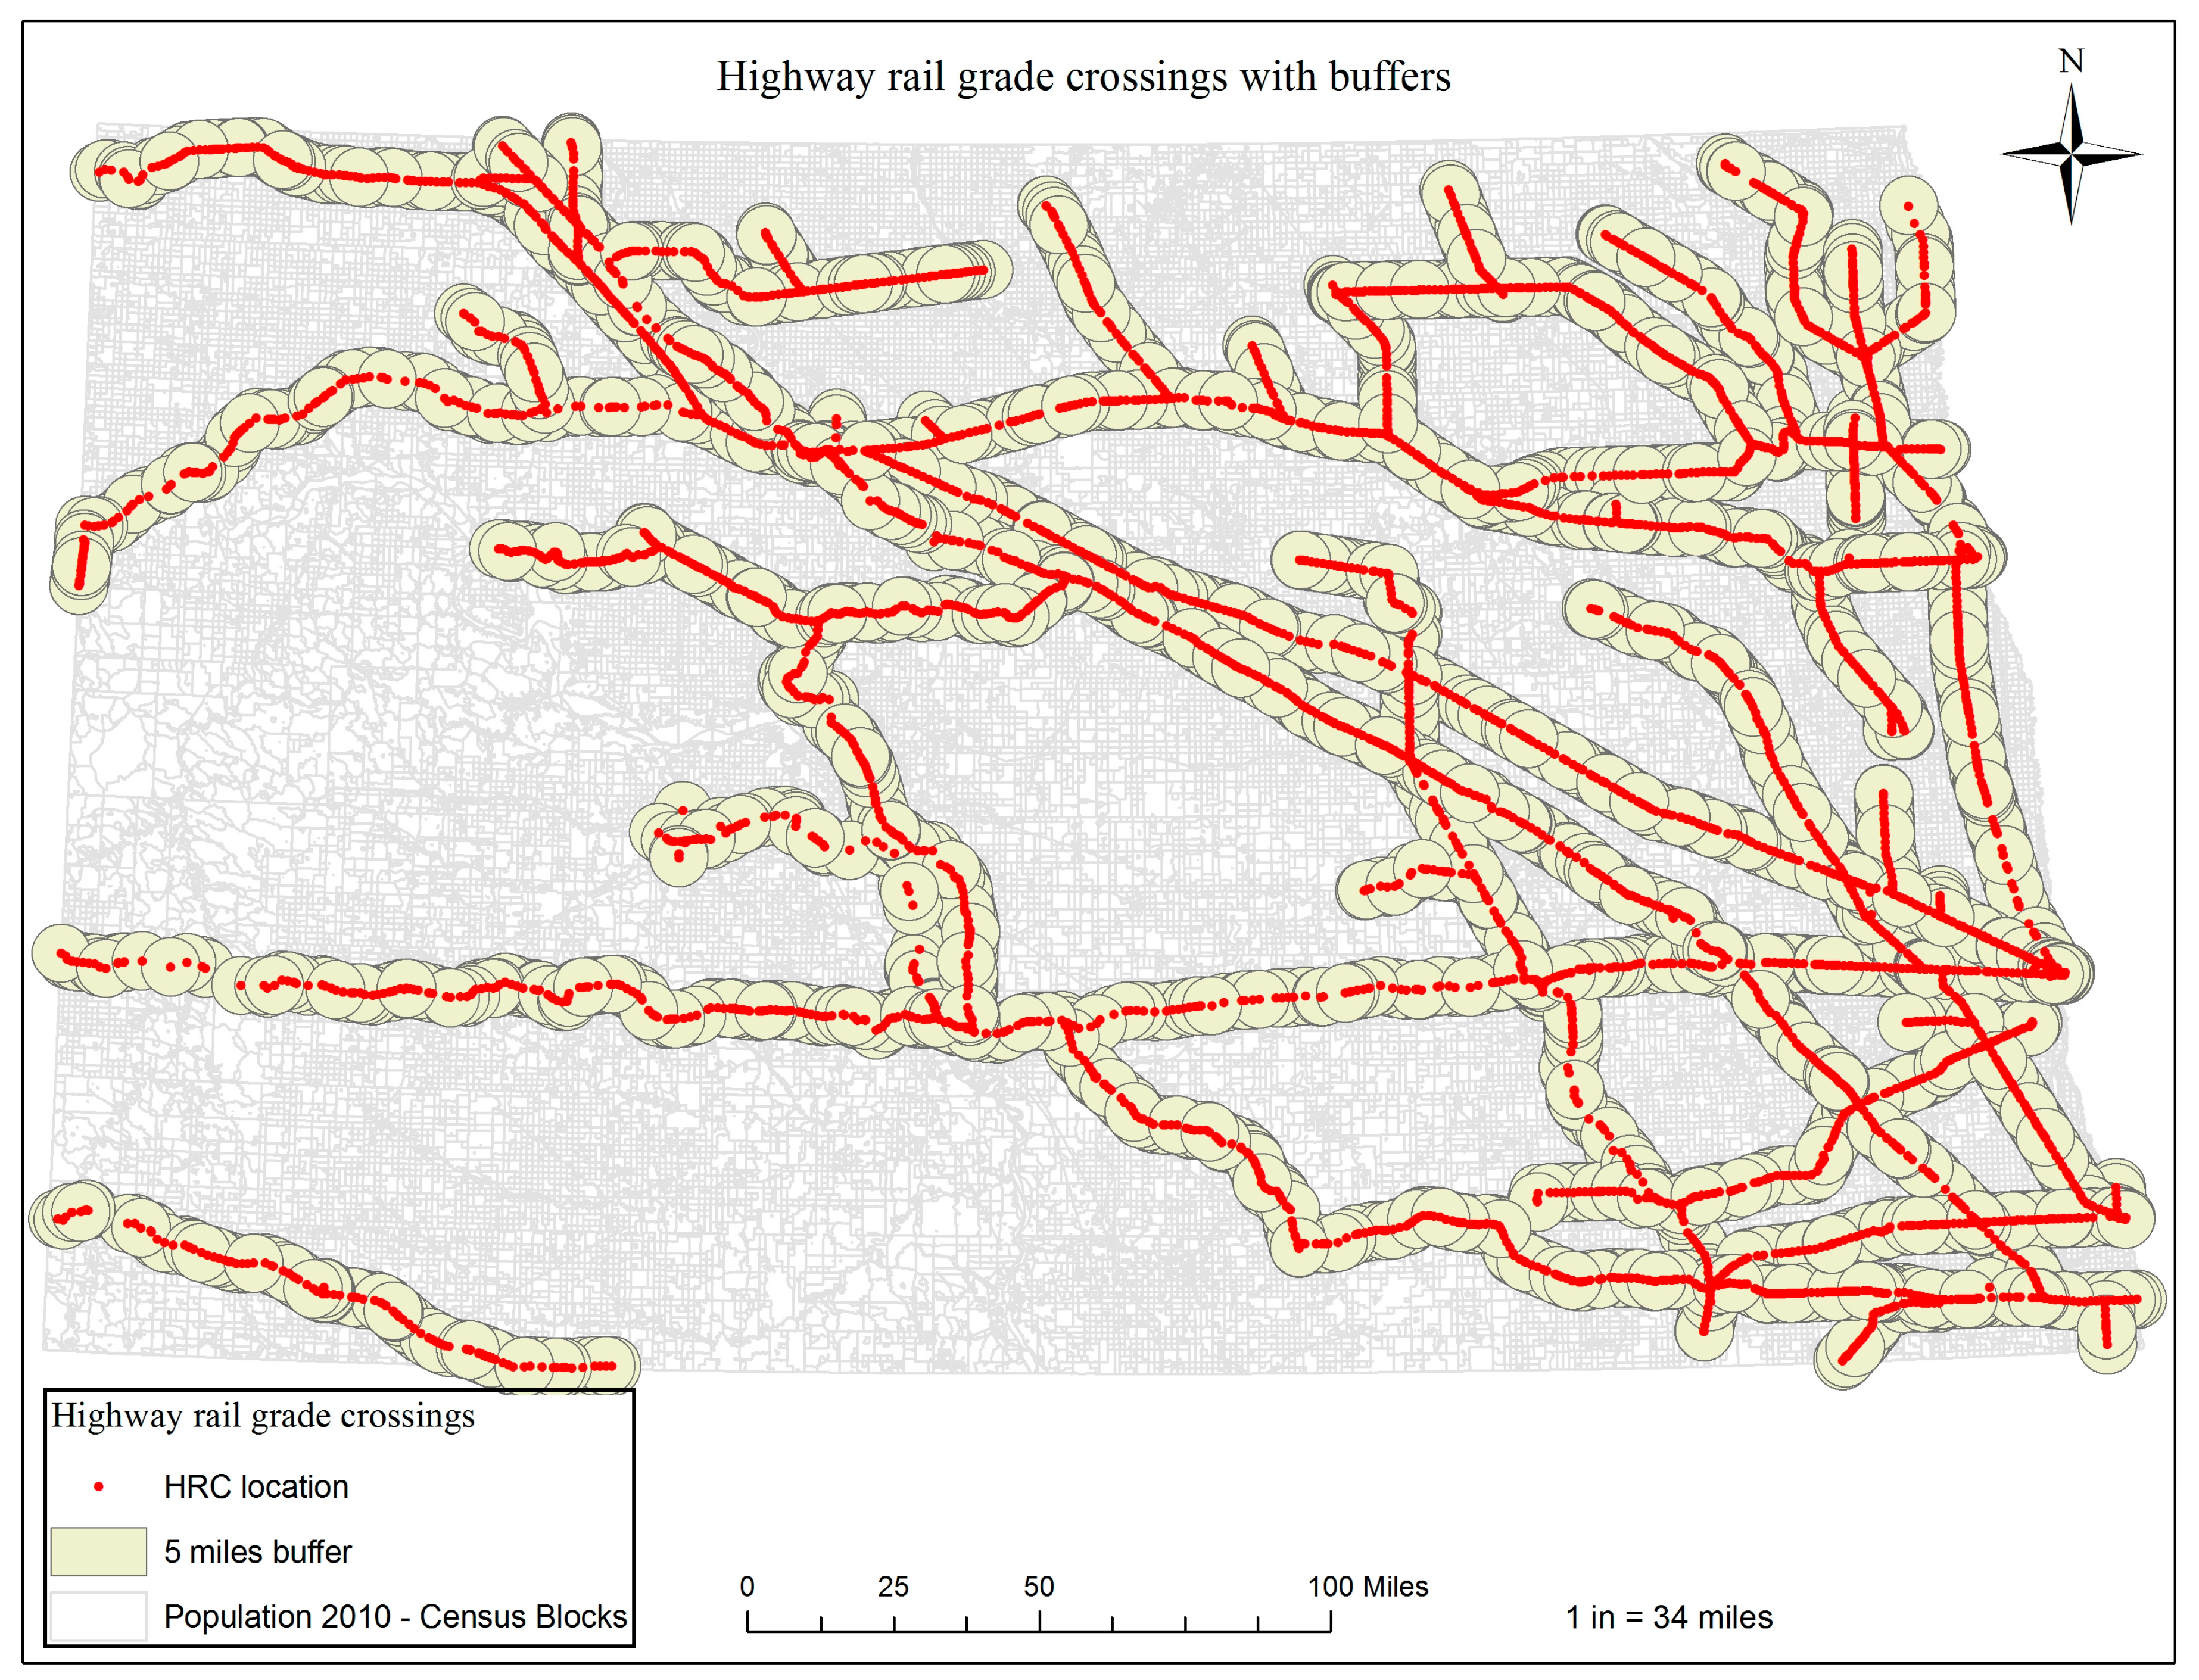
The geographic locations of HRCs were obtained from NDGIS Hub in the form of a point shape file that provided HRC coordinates along with other important information such as the grade crossing identification number. The HRC inventory database provided information about traffic conditions, including annual average daily traffic (AADT) and infrastructure equipment such as stop signs, crossbucks, gates, flashing lights, and bells. The accident/incident database provided information about each accident such as time, location, and conditions of occurrence. Population for the year 2010 was obtained from the U.S. Census Bureau in the form of a census block which is the finest geographic unit for census. One-mile and five-mile buffers were created around each HRC using ArcMap 10.4. The layers containing census blocks (i.e., population) and buffers were intersected with each other to obtain the common area and extract the desired population. Finally, to obtain the total population within two different buffers, the census blocks within a one-mile radius and a five-mile radius of HRCs were dissolved separately.
Figure 2 shows the data extraction process.
The authors carefully examined and filtered the data for possible outliers and missing data. The inter-correlations among explanatory variables were also tested and found to be not severe. During the population data extraction process, an assumption was made that people living near two different HRCs will mostly use the HRC nearest to them. Therefore, based on the assumption made, it may be noted that the census blocks shared by two different HRC buffers were assigned to the closest HRC to avoid the duplication of population. To create a new dataset, common fields of HRC identification numbers were used to include the required information from all the datasets.
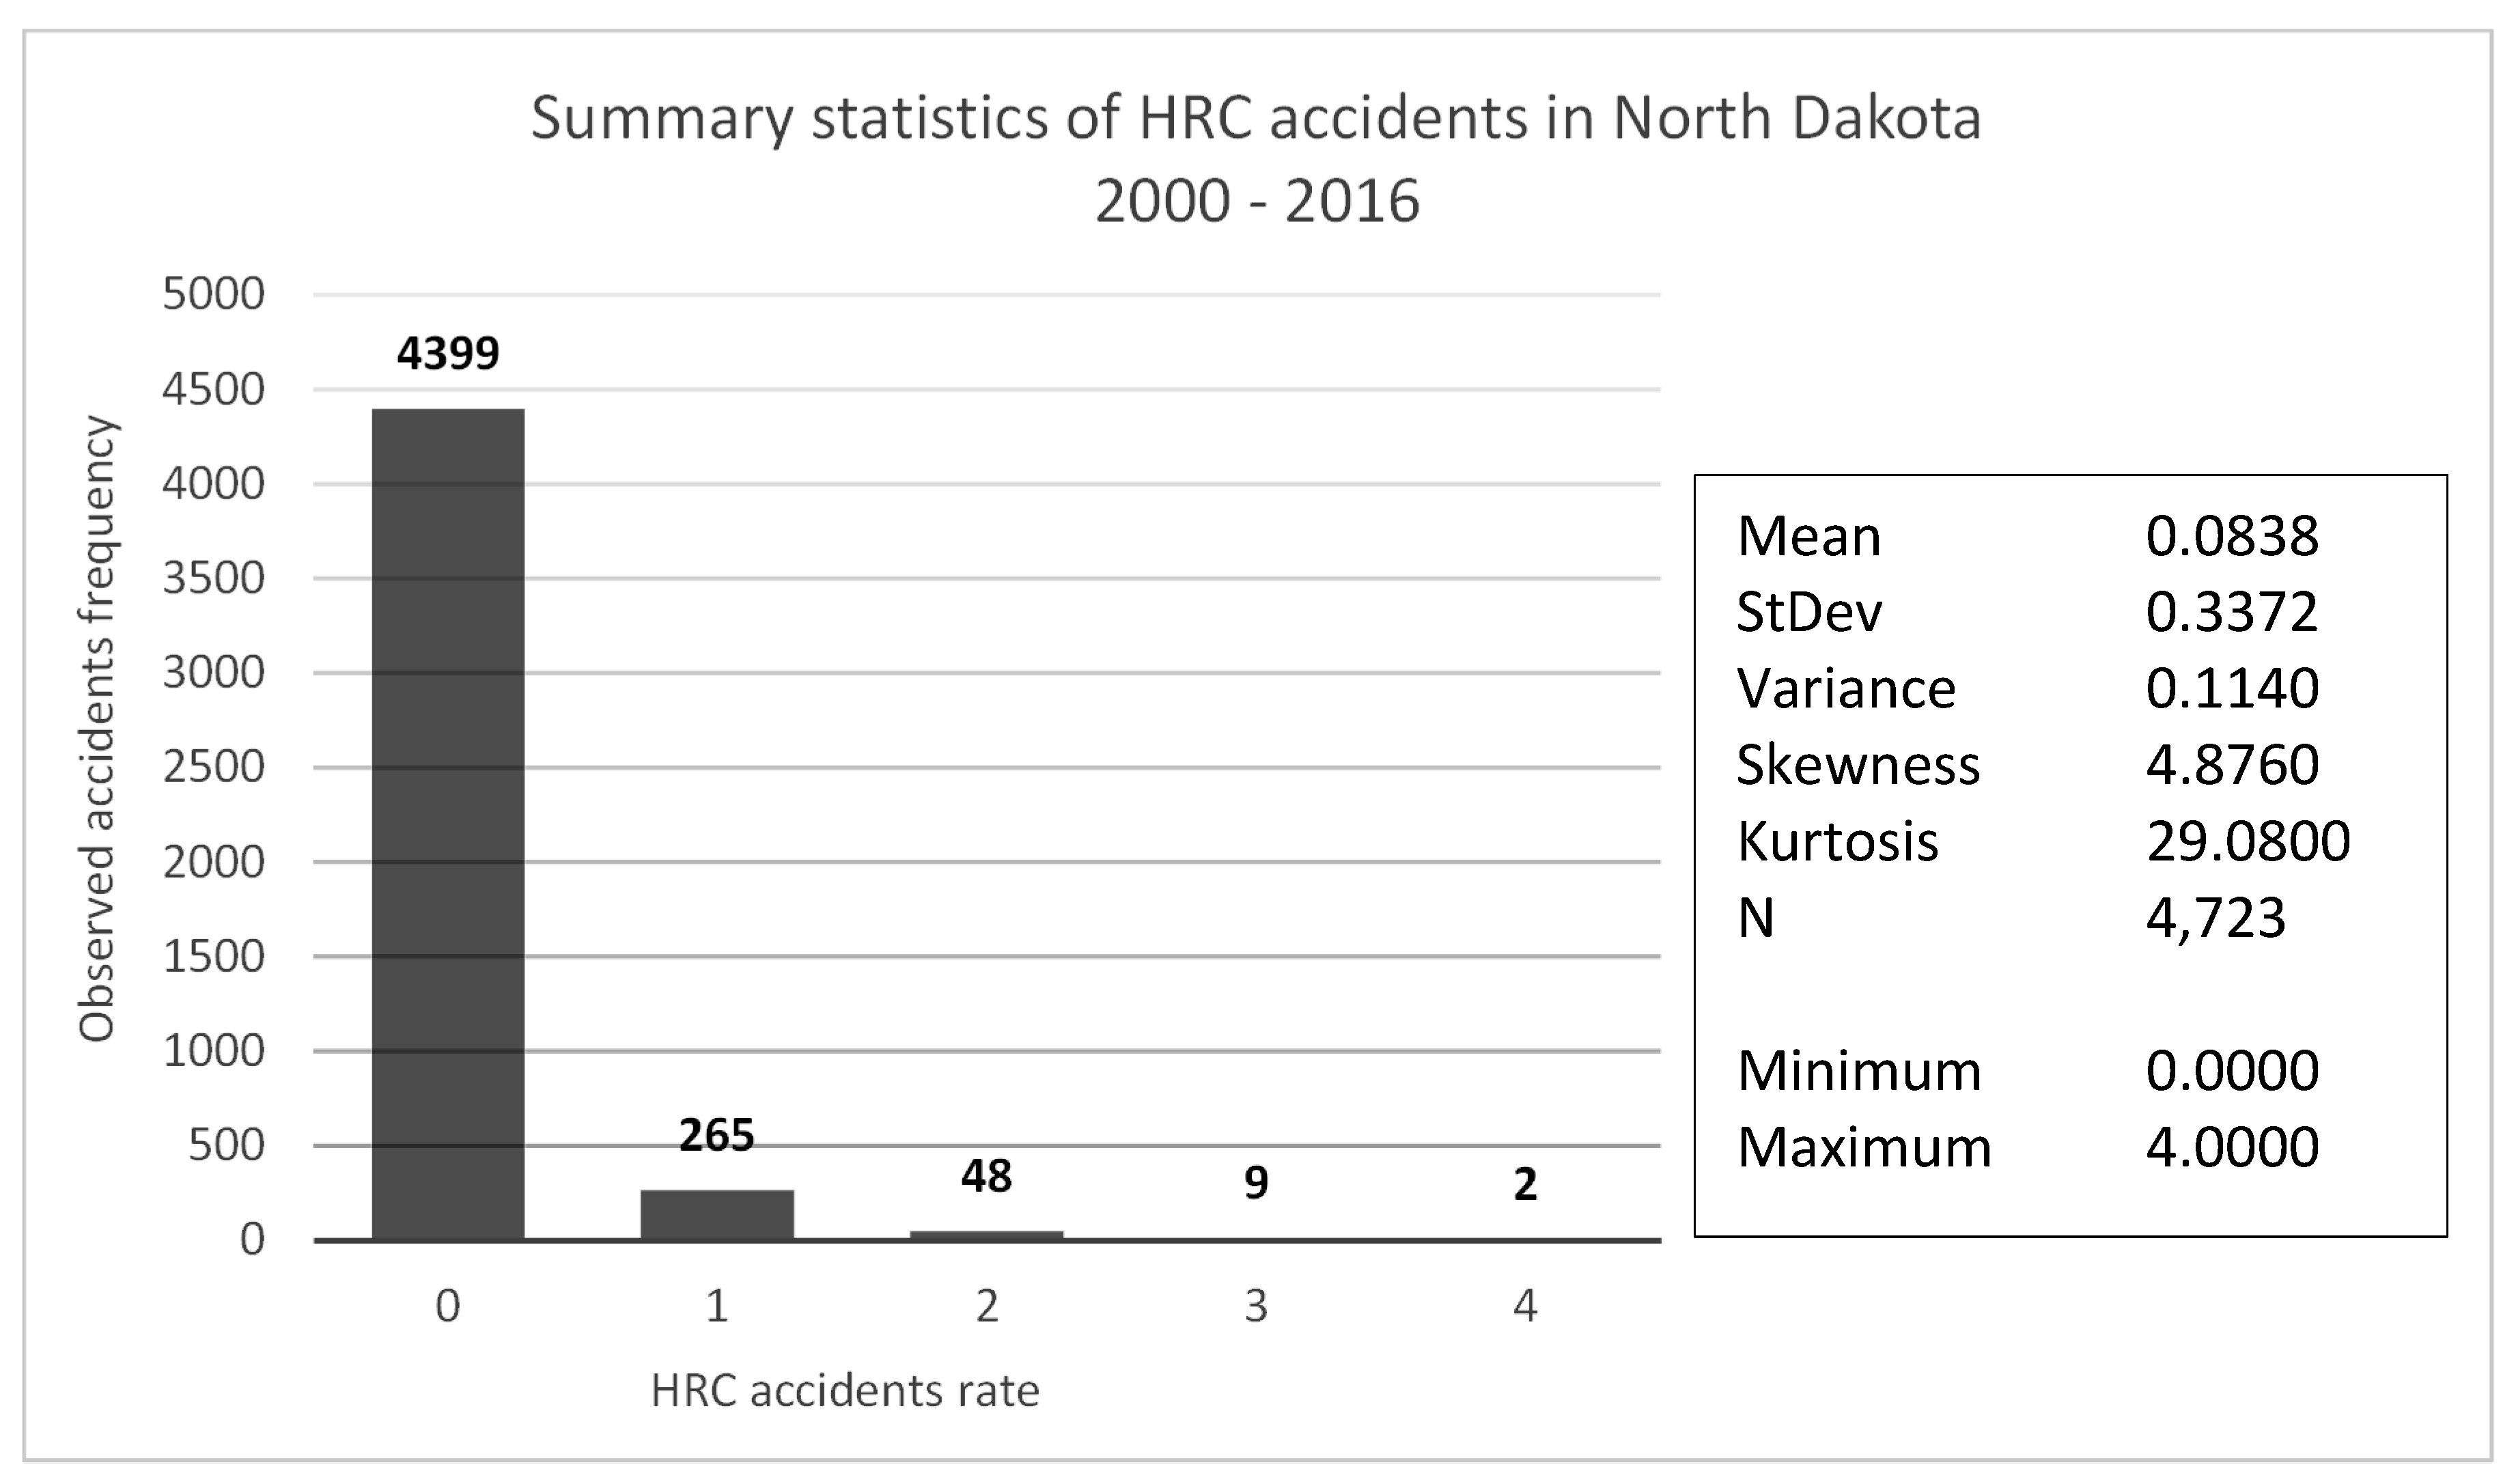
The required information about previous accidents at HRCs in the ND was extracted from years 2000 to 2016. A total of 324 accidents were recorded from a sample of 4723 public and private HRCs. Fifteen predictor variables, including annual average daily traffic (AADT), number of daily total trains (TRAINTRFC), maximum typical train speed (MAXSPD), functional classification of highway (HWYCLASSCD), number of highway lanes (TRAFICLN), number of through railroad tracks (MAINTRK), highway pavement (HWYPVD), pavement markings (PAVMRKID), smallest crossing angle (XANGLE), crossbucks (CROSBUK), stop signs (STOP), bells (BELLS), flashing lights (FLASHLGT), gates (GATES), and population (POP10) were identified and selected (see
Table 1).
Figure 3 shows the statistics for HRC accidents in the ND from years 2000 to 2016. The crash frequency at 4723 HRCs ranges from 0 to 4, while the mean frequency is 0.08. The variance of accidents is 0.11, which is greater than the mean of accidents and makes the data over dispersed. There are 4399 HRCs with a zero crash frequency and two crossings with four crash frequencies.
3.2. Model Development
Once the cleaning of data was complete, the next step was to select the appropriate model form for the prediction of accidents. For this purpose, a review of previous research efforts for modeling accidents frequencies was carried out to help determine the appropriate model form. In the current study, the response (or dependent) variable of accident (1) or no accident (0) is dichotomous using a binary variable. The binary logit model is extensively used in highway safety investigations where the response variable is binary [
29,
30]. The model takes the natural logarithm of the likelihood ratio such that the response variable is 1 (accident) as opposed to 0 (no accident). The resulting probabilities can be easily converted to accidents per year by letting Π
1 and Π
0 represent the probabilities of response variable categories, accident and no accident, respectively. The binary logit model is given as:
where
Y = binary response variable
α = intercept to be calculated
βi = estimated vector of parameters
χi = vector of explanatory variables
In Equation (1), the maximum likelihood estimation technique is used to estimate the parameters. The unit increase in explanatory variable χ
i, while keeping all the remaining factors constant, will increase the likelihood ratio by exp (β
i). This represents the relative magnitude by which the response outcome (accidents) will increase or decrease while considering a unit increase in the explanatory variable. The probability of accident (Π
1) is given by:
Similarly, the probability of no accident (Π
0) is given by:
One of the critical tasks in model development is to identify and select the appropriate factors that may affect the likelihood of accidents at HRCs. While selecting various contributory factors, two approaches were considered. In the first approach, related research was studied where different factors had been tested. In the second approach, more emphasis was on the local settings in ND to help identify additional variables that can possibly influence accident likelihood. Both were considered when choosing factors to investigate.
4. Results and Discussion
The binary logit regression model was used to estimate the relationship between significant explanatory variables and accident frequencies. The software package R was used for model development. For the model, as the input, a total of fifteen explanatory variables were used to predict accident likelihood at HRCs. The input variables show various characteristics of traffic, railroad, roadway, and crossing inventory attributes. The explanatory variables which were tested at different significance levels and became insignificant included annual average daily traffic (AADT), functional classification of highway (HWYCLASSCD), highway pavement (HWYPVD), smallest crossing angle (XANGLE), crossbucks (CROSBUK), stop signs (STOP), flashing lights (FLASHLGT), and gates (GATES).
Table 2 shows the results of the binary logit model, presenting significant explanatory variables, their coefficient estimates, standard errors, and
p-values. Positive values of the coefficient estimates for predictor variables express their positive contribution to the probability of accidents at HRCs. The McFadden pseudo R
2 value, proposed by McFadden, is a statistical measure for testing the goodness of fit of the model, and was 0.12 in this case [
31]. As stated earlier, the maximum likelihood estimation technique is used in the logistic regression for parameter estimates. L
0 is the likelihood function value for a null model (a model without predictor variables or when the values of all predictor variables are zero) and L
M is the likelihood function value for a model to be estimated. The McFadden pseudo R
2 is given as:
where Ln is the natural logarithm. The underlying principle of Ln(L
0) is similar to that of the residual sum of squares in linear regression. Allison [
32] prefers the use of McFadden pseudo R
2 for measuring the goodness of fit over other pseudo R
2 such as Cox and Snell R
2.
The explanatory variables that became significant or contribute to accident likelihood include the number of daily total trains, maximum typical train speed, traffic/highway lanes, number of through railroad tracks, pavement marking, bells, and population within five-mile buffers. There could be several explanations for the positive relationship between number of daily total trains (TRAINTRFC) and accident probability. This is intuitive, as the potential for conflicts at HRCs is directly related to higher train volumes. This positive relationship might be due to the reduced visibility at night or more likely, drivers may be impaired or otherwise fatigued.
The maximum typical train speed (MAXSPD) also became significant. This is expected, because at a higher train speed, the train requires more time and distance to slow down or stop ahead of an HRC when the need arises. At a higher speed, detecting an obstacle on the railroad track becomes difficult due to a decrease in reaction time. On the other hand, at lower speeds, train operators may be able to slow sufficiently to prevent an accident.
The number of highway lanes (TRAFICLN) at crossings has a positive relationship with the probability of accidents. According to the model results, for example, the probability of accidents at a four-lane highway will be 14.3% greater than the probability of accidents at a two–lane highway. Again, this is intuitive because a greater number of highway lanes at crossings will lead to a higher potential for crashes. Similarly, the number of through railroad tracks (MAINTRK) at crossings has a positive relationship with accident likelihood. The greater the number of through railroad tracks, the higher the accident likelihood. This and the earlier findings related to maximum train speed are most likely related because a greater number of through railroad tracks are required for trains to operate at higher speeds. Although, these variables are intuitively correlated, their low standard errors and p-values negate the presence of multicollinearity.
Pavement markings at railroad crossings (PAVMRKID) have a negative relationship with accident probability, i.e., the presence of pavement markings decrease accidents probability. This is directly intuitive because seeing pavement markings (stop lines) will make the drivers more cautious about crossing the HRC. Note that pavement marking is a categorical variable with four different levels, out of which stop lines were found to negatively affect the likelihood of accidents. This might be related to the reason that drivers are more acquainted with stop lines compared to other types of pavement markings.
The presence of bells (BELLS) at the HRCs has a positive relationship with accident likelihood. One of the many purposes of bell installations at HRCs is to alert drivers before crossing HRCs so they can avoid any possible incident. As bells are advanced warning devices, which are installed to improve safety at HRCs that are accident prone. The significance of bells in the current model indicates that either HRCs are accident prone or the bells might have been installed in response to the occurrence of accidents. The populations (POP10) within a five-mile radius of HRCs are significant. This is intuitive because greater populations in the vicinity of HRCs might result in higher trip generation and the greater usage of crossings, increasing the probability of accidents. These trips may be residential trips, i.e., trips originating or ending as a function of economic or social attributes of households.
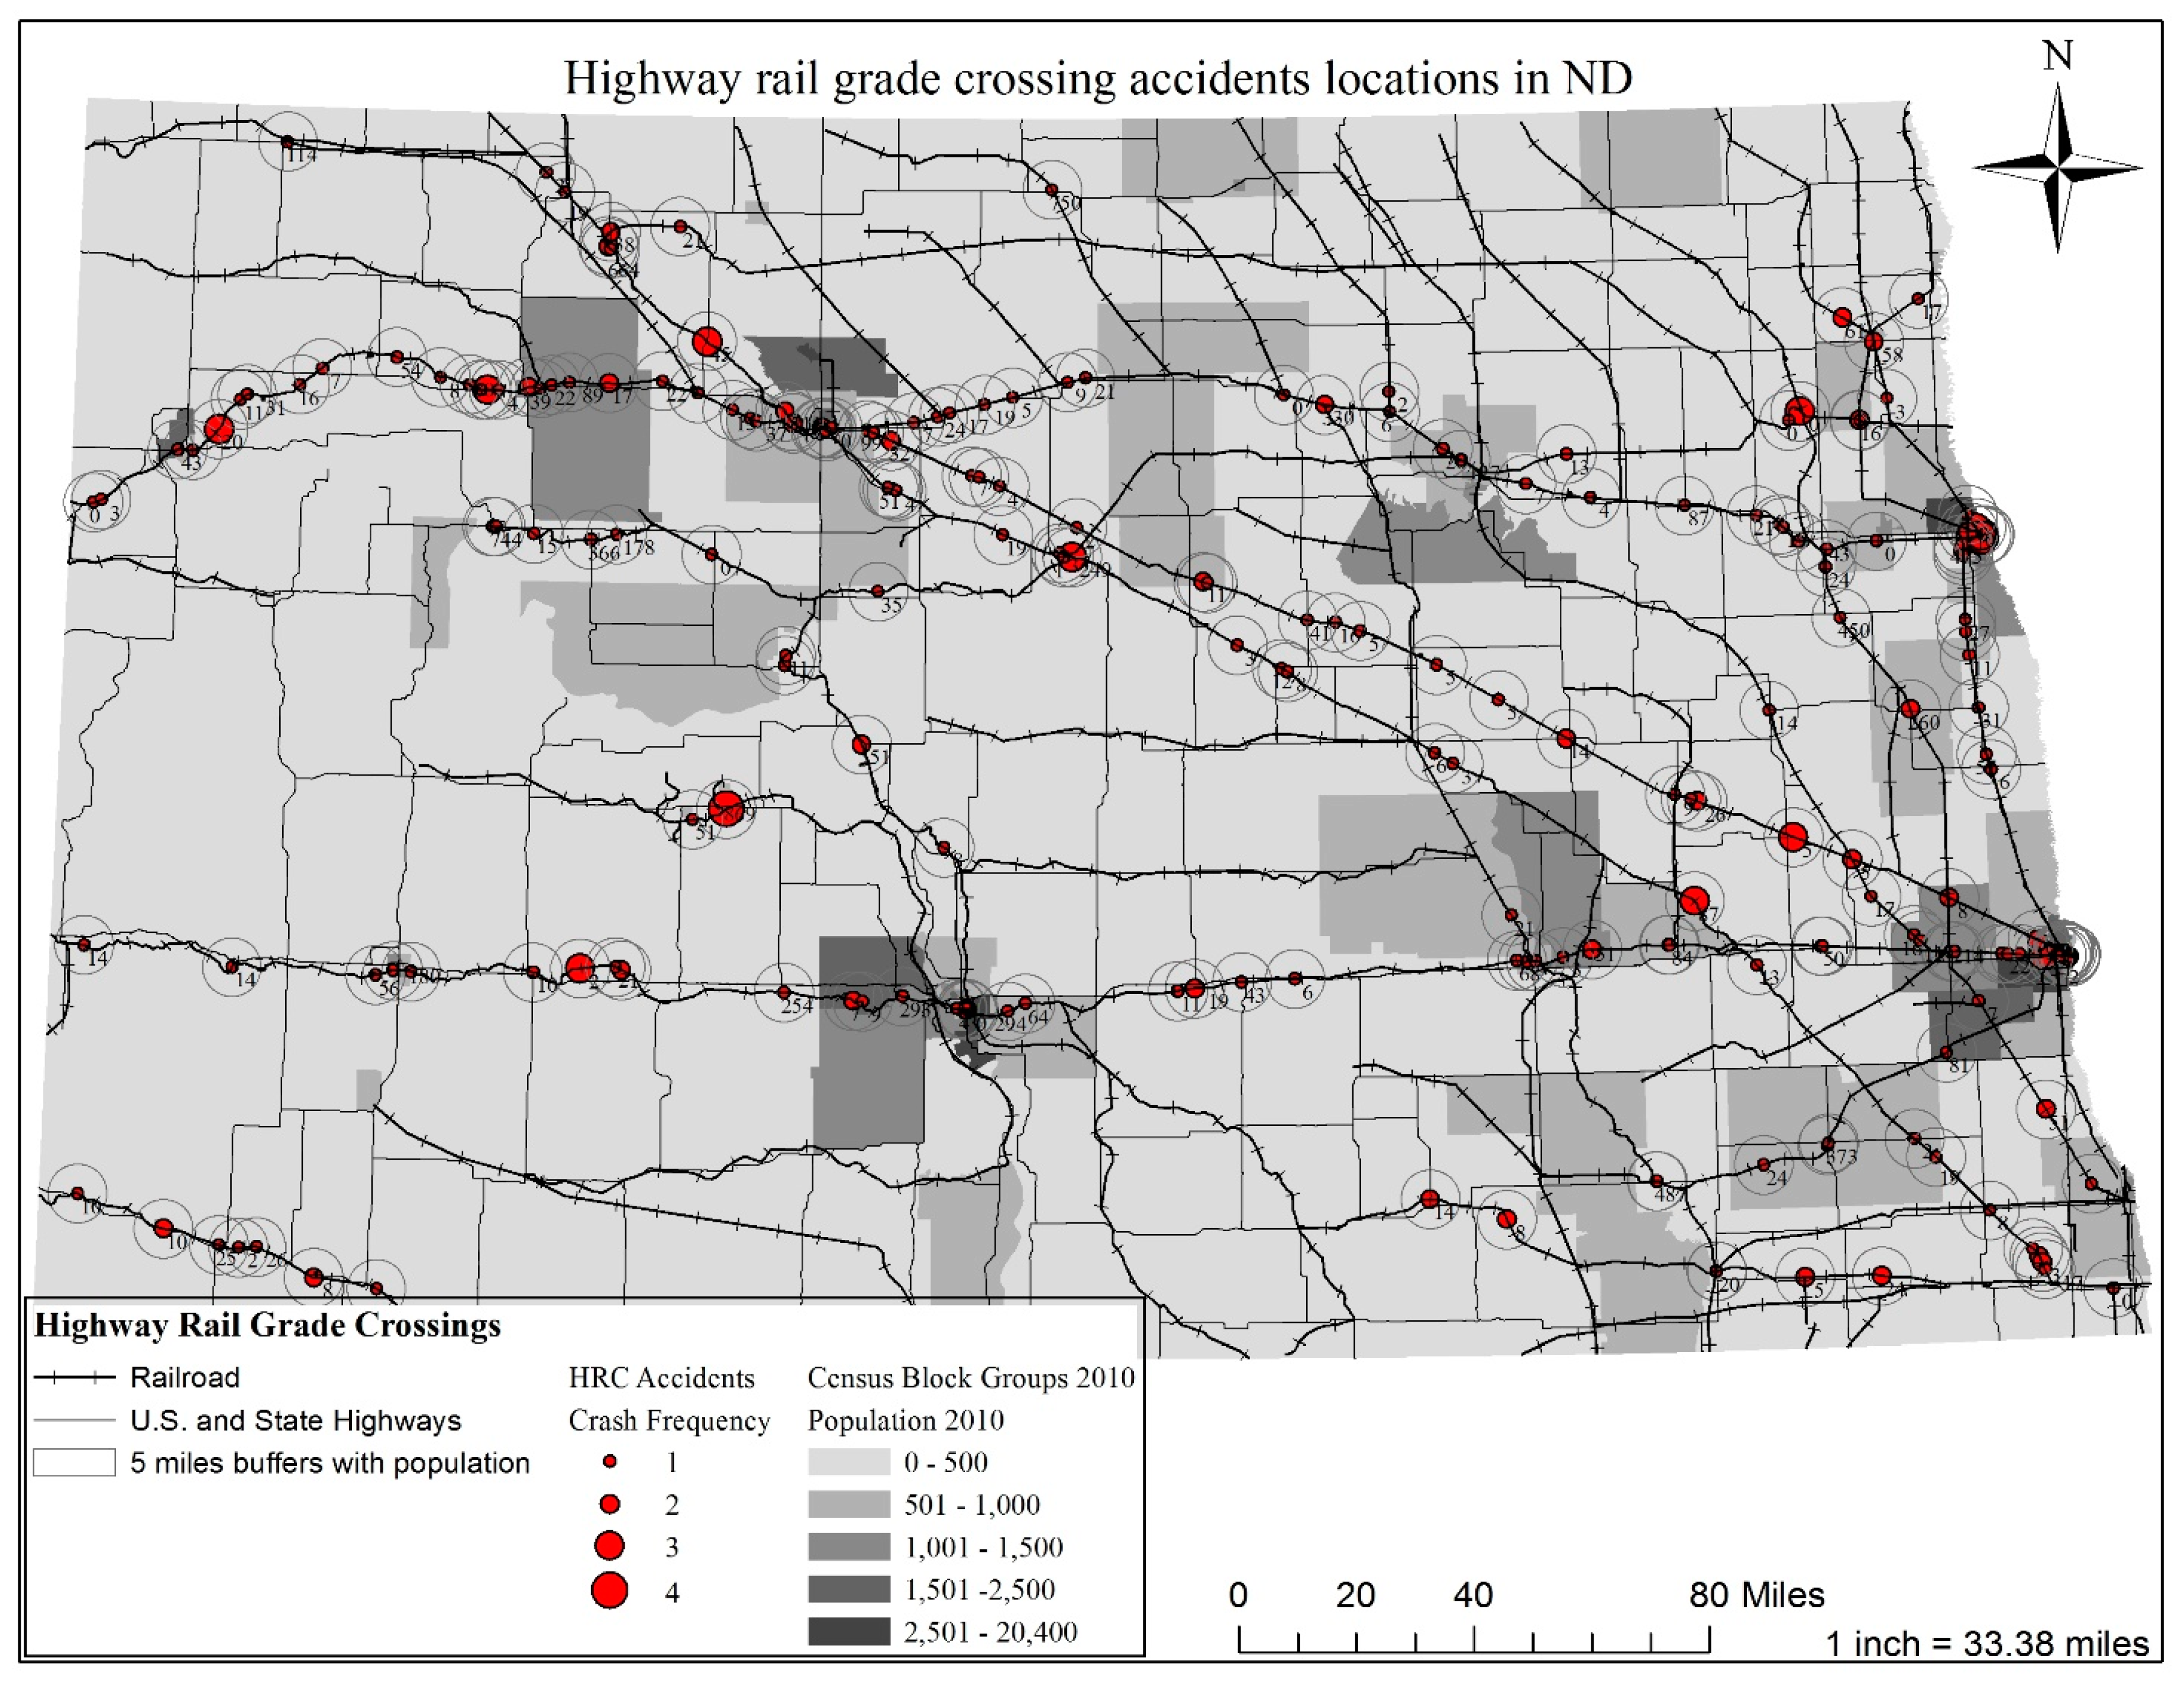
As can be seen in
Figure 4, census block groups are used for better visualization of populations. The census block groups with a black color represent areas that are most populous, having 2501–20,400 persons per census block group. Those with a light grey color represent the least populous areas, with 0–500 persons per census block group. The red points indicate locations of HRCs that had accidents from the years 2000 to 2016, while their sizes show the accident frequencies. For example, the biggest red points represent HRCs that have had four accidents during the aforementioned duration of time. Five-mile buffers around each HRC can also be seen with the population they contain.
Figure 4 shows that most of the HRCs that have had crashes are located close to census blocks with greater populations such as Fargo, Grand Forks, Bismarck, and Minot. Although ND has a lower population than many other states, it is interesting to see the positive relationship between population and accident likelihood at HRCs.
To check the sensitivity of population sizes, the radii of buffers were decreased from five miles to one mile, and populations were extracted again using the aforementioned procedure. The model was rerun by replacing the five-mile buffers with one-mile buffers. However, populations within the one-mile buffers became insignificant by a p-value of 0.2361. This clearly shows that the size of population does affect the accident likelihood at HRCs, i.e., the greater the population around HRCs, the higher the accident probability.
5. Conclusions
Crashes at highway rail grade crossings are economically and socially critical for two modes of transportation. The safety of HRCs has been investigated by numerous researchers in previous years. Various studies have considered different contributing factors to quantify their impact on HRC accidents, but none had considered population within the vicinity of HRCs. According to NHTSA statistics, 50% of accidents at HRCs occur within five miles of a person’s home. The relative scarcity of investigation on this subject motivated our study. Therefore, in the current research, an effort has been made to study the effects of population and other contributing factors on the likelihood of HRC crashes. The development and investigation of the statistical relationship between various variables and the likelihood of crashes at HRCs helped achieve the study objective.
The results of the binary logit regression model revealed seven significant predictor variables, including population, within a radius of five miles of HRCs. The number of daily total trains, maximum typical speed of train, number of highway lanes, and number of through railroad tracks have positive relationships with accident likelihood. The likelihood of crashes at HRCs can be reduced by enforcing safe operating speed limits for trains in populous areas. The presence of pavement markings in the form of stop lines decreases the probability of crashes. Therefore, according to the study results, pavements at HRCs should be marked with stop lines. It has also been observed that most of the accidents occurred at HRCs that are located in populous areas. This shows that the greater the population in the vicinity of HRCs, the higher the likelihood of accidents. Therefore, the positive relationship between population and the probability of HRC accidents supports the NHTSA statistics. The awareness of the dangers of HRCs among people living within their vicinity should be improved through education. On the basis of an assumption made about people using the nearest HRC, this study has a limitation of considering the number of people associated with any one HRC. Keeping in mind the study findings regarding population, priority for safety improvements should be given to the HRCs that are located in highly populous areas. Also, while planning the routes for railroad tracks, populous areas should be avoided as much as possible.
In future studies, the aforementioned assumption can be excluded from the research as people can use any HRC instead of associating them with the closest HRC. Although this research focused on ND, future research can be extended to the national level or other populous states. As the sizes of buffers have a correlation with population densities, it would be interesting to see how the sensitivity of buffer sizes affects HRC crashes in more populous states. This study can help transportation agencies identify accident-prone HRC locations and plan future safety improvements.


