Article

Evaluating the Specificity of Community Injury Hospitalization Data over Time

Centre for Accident Research and Road Safety—Queensland, Queensland University of Technology, 130 Victoria Park Rd, Kelvin Grove 4059, Queensland, Australia
*
Author to whom correspondence should be addressed.
Submission received: 15 September 2015 / Revised: 9 February 2016 / Accepted: 18 February 2016 / Published: 29 February 2016
(This article belongs to the Special Issue Feature Papers)

Abstract

:
This study identified the areas of poor specificity in national injury hospitalization data and the areas of improvement and deterioration in specificity over time. A descriptive analysis of 10 years of national hospital discharge data for Australia from July 2002–June 2012 was performed. Proportions and percentage change of defined/undefined codes over time was examined. At the intent block level, accidents and assault were the most poorly defined with over 11% undefined in each block. The mechanism blocks for accidents showed a significant deterioration in specificity over time with up to 20% more undefined codes in some mechanisms. Place and activity were poorly defined at the broad block level (43% and 72% undefined respectively). Private hospitals and hospitals in very remote locations recorded the highest proportion of undefined codes. Those aged over 60 years and females had the higher proportion of undefined code usage. This study has identified significant, and worsening, deficiencies in the specificity of coded injury data in several areas. Focal attention is needed to improve the quality of injury data, especially on those identified in this study, to provide the evidence base needed to address the significant burden of injury in the Australian community.

1. Introduction

Injury is the leading cause of the fatal burden of disease in Australia for individuals aged 1–44 years of age [1]. In order to target injury prevention policy and practice appropriately, data are needed which accurately identifies the causes of injuries, where injuries are occurring, and what activities people are undertaking at the time when injuries occur [2,3]. Many countries throughout the world use the International Classification of Disease system to capture injury diagnoses and external causes of injury for mortality and morbidity records [4], and Australian hospitalization data uses a modification of the ICD-10 (the ICD-10-AM, which includes additional codes for greater specificity and/or of relevance in the Australian context) to capture external cause, place, and activity for all injury-related hospitalizations [5].
However, there has been limited evaluation of the accuracy and completeness of injury hospitalization data in Australia, or indeed in other parts of the world where external cause of injury coding occurs. A literature review of the accuracy of external cause of injury coding in hospital records published in 2009 by the first author found only five papers internationally [6,7,8,9,10], which had systematically evaluated coding quality with accuracy ranging from between 64% and 85% agreement of coders in the assignment of external cause codes [11]. There appears to have been no improvement in coding accuracy since then, with more recent research in Sweden finding accuracy ranging from only 51% agreement at the fifth character complete code level to 82% agreement at the three character code level [12].
One of the key aspects of accurate coding is the specificity of the codes assigned. The ICD system is designed to enable the capture and classify all diseases and injuries, and in order to do this, residual codes which classify “other” and “unspecified” factors are included in all code blocks. A New Zealand study published in 2007 described the completeness of injury coding by examining the level of specificity of external cause, place, and activity codes in the New Zealand hospital discharge data [13]. This study found the proportion of cases with unspecified codes was 7% for external cause, 23% for place, and 39% for activity, with marked variation across local hospital districts. Work based on Australian data has shown different levels of specificity across intent and mechanism blocks, with assaults and accidents having the poorest specificity (13% and 11% unspecified, respectively) and falls, poisonings, and burns being the mechanisms with the poorest specificity (44%, 38%, and 35% unspecified, respectively) [14]. An Australian study specifically examining the specificity of activity coding for injury-related hospitalizations found that approximately 70% of cases were assigned other or unspecified activity codes, with 44% of these being injury hospitalizations due to a fall [15]. Two other Australian studies have also found an excessive use of other and unspecified codes for activity and place [16,17].
There have been some improvements to the classification system over the last decade with additional external cause, activity and place codes introduced in new editions of the ICD-10-AM [18]. However, there has been no recent research examining the completeness of cause of injury data in Australia and whether there have been any improvements over time in the specificity of the three key injury surveillance elements, external cause, place, and activity. As injury hospitalization data are a critical epidemiological tool for directing injury prevention policy and practice in Australia, it is important to understand the strengths and weaknesses of these data. The aim of this study was to identify the areas of poor specificity in national injury hospitalization data and to identify areas of improvement or deterioration in specificity of injury data over time.

2. Methodology

A descriptive analysis of 10 years of data obtained from the National Hospital Morbidity Database (NHMD) for Australia from July 2002–June 2012 was performed. The NHMD records all public and private hospitalisations in Australia and is maintained by the Australian Institute of Health and Welfare. This research study was approved by the Queensland University of Technology University Human Research Ethics Committee (Approval number: 1300000849). Informed consent was not required from participants as data was de-identified. Hospital separation records with a principal diagnosis of an injury (ICD-10-AM S00-T98) and an external cause code indicating the injury was either the result of an accident (V00–X59), intentional self-harm (X60–X85), assault (X85–Y09), or undetermined intent (Y10–Y34) were included. Legal interventions and war operations (Y35–Y36) and Complications of medical and surgical care (Y40–Y84) were not included as this study focused on the specificity of data regarding community injuries.
The ICD classification system is hierarchical and the external causes chapter (Chapter 20) is organized into intent blocks at the broadest level (e.g., Accidents, Intentional Self Harm, Assault, Undetermined Intent), with each of these intent blocks including residual codes (e.g., “X58–X59 Accidental exposure to other and unspecified factors”) to capture cases unable to be classified to more defined categories within the block. Within each of these intent blocks, at the next level of the hierarchy, codes are organized into mechanism blocks (e.g., Falls, Accidental drowning, and Submersion etc.), with each of these mechanism blocks also including residual codes (e.g., “W19 Unspecified Fall”) to capture cases unable to be classified to more defined mechanism codes (e.g., “W11 Fall on or from ladder”). Separate variables were created to categorize external cause codes as either Defined (NOT an “Other” or “Unspecified” code) or Undefined (“Other” or “Unspecified” code) at both the broad intent levels and at the mechanism levels. Summary variables were created to indicate whether the patient was assigned a defined or undefined mechanism code (by aggregating across the individual mechanism variables) and to indicate whether the patient was assigned a defined/undefined code overall (by aggregating across the major intent level block and minor mechanism level blocks). Table 1, in the results section, provides the details of the categorization of external cause codes as defined or undefined.
Place of occurrence and activity at the time of injury are arranged hierarchically within the ICD-10-AM classification system, with broad residual codes provided to enable the classification of cases with no information available (e.g., “Y92.9 Unspecified place of occurrence”, “U73.9 Unspecified activity”) or which are unable to be assigned to a specified place or activity code (e.g., “Y92.88 Other specified place of occurrence”, “U73.8 Other specified activity”). At the next level down in the hierarchy, place and activity blocks also include residual categories (e.g., “Y92.09 Other and unspecified place in home”, “U70–U71 Other or unspecified sport and exercise activity” etc.). Separate variables were created to categorize place and activity codes as either defined (NOT an “Other” or “Unspecified” code) or undefined (“Other” or “Unspecified” code) at both the broad level and at the specific levels. An aggregate variable was also created to summarize across the place and activity blocks to indicate whether the patient was assigned a Defined or Undefined place and Defined or Undefined activity code. Table 2, in the results section, provides the details of the categorization of place and activity codes as Defined or Undefined.
Residual codes such as “other specified” and “unspecified” provide insights into two aspects of data quality. A case assigned an “Other specified” code indicates that there is further information in the medical record about the cause but the classification system does not have an appropriate code to classify the particular cause. A case assigned an “Unspecified” code indicates that there is no information in the medical record to enable coding of more specific information. These two types of residual codes are grouped together for the purposes of this paper however, as it focuses on identifying how defined injury hospitalization data is overall and examines whether there has been an improvement or deterioration in the specificity of injury data over time.
Descriptive statistics are provided for the broad and specific code blocks for external cause, place, and activity including the frequency of injury presentations within each category and the proportion of undefined codes. Overall proportions of defined/undefined over time are also provided by hospital (e.g., sector, location) and patient characteristics (e.g., age, gender). Percentage change in the proportion of undefined cases/defined cases in the earliest year compared to the most recent year was calculated for each of the broad and specific code blocks for external cause, place, and activity. Kendall‘s tau was used to examine the significance and magnitude of the change in case specificity (defined/undefined) over time from the earliest year to the most recent year of injury data.

3. Results and Discussion

Over the 10 year period from July 2002 to June 2012 there were 4,228,393 injury separations recorded in Australia, growing from 356,594 separations per annum in the earliest year July 2002–June 2003) up to 490,567 separations per annum in the most recent year (July 2011–June 2012).

3.1. Specificity of External Cause Codes

Table 1 provides the frequency of separations for the intent and mechanism blocks, as well as the proportion of undefined categories for each block and the change over time in the proportion of undefined cases. At the intent block level, accidents and assault are the most poorly defined with 11.4% of cases in both intent blocks being assigned an undefined code.
At the mechanism block level, the accidental mechanisms most poorly defined were: falls and poisoning by noxious substances (both of which had almost 42% of cases categorized into undefined codes), accidental drowning and submersion (28% undefined), water transport (27% undefined), air and space transport (23% undefined), pedal cyclists (23%), and motorcyclists (20%). The intentional self-harm mechanisms most poorly defined were firearms (26% undefined), sharp objects (26% undefined), and motor vehicle crashes (20% undefined). Assault mechanisms which were poorly defined also included firearms (45% undefined), and sharp objects (25% undefined). Finally, in the cases where intent was undetermined, the mechanisms which were poorly defined included firearms (51% undefined), sharp objects (37% undefined), and poisoning by noxious substances (18% undefined).

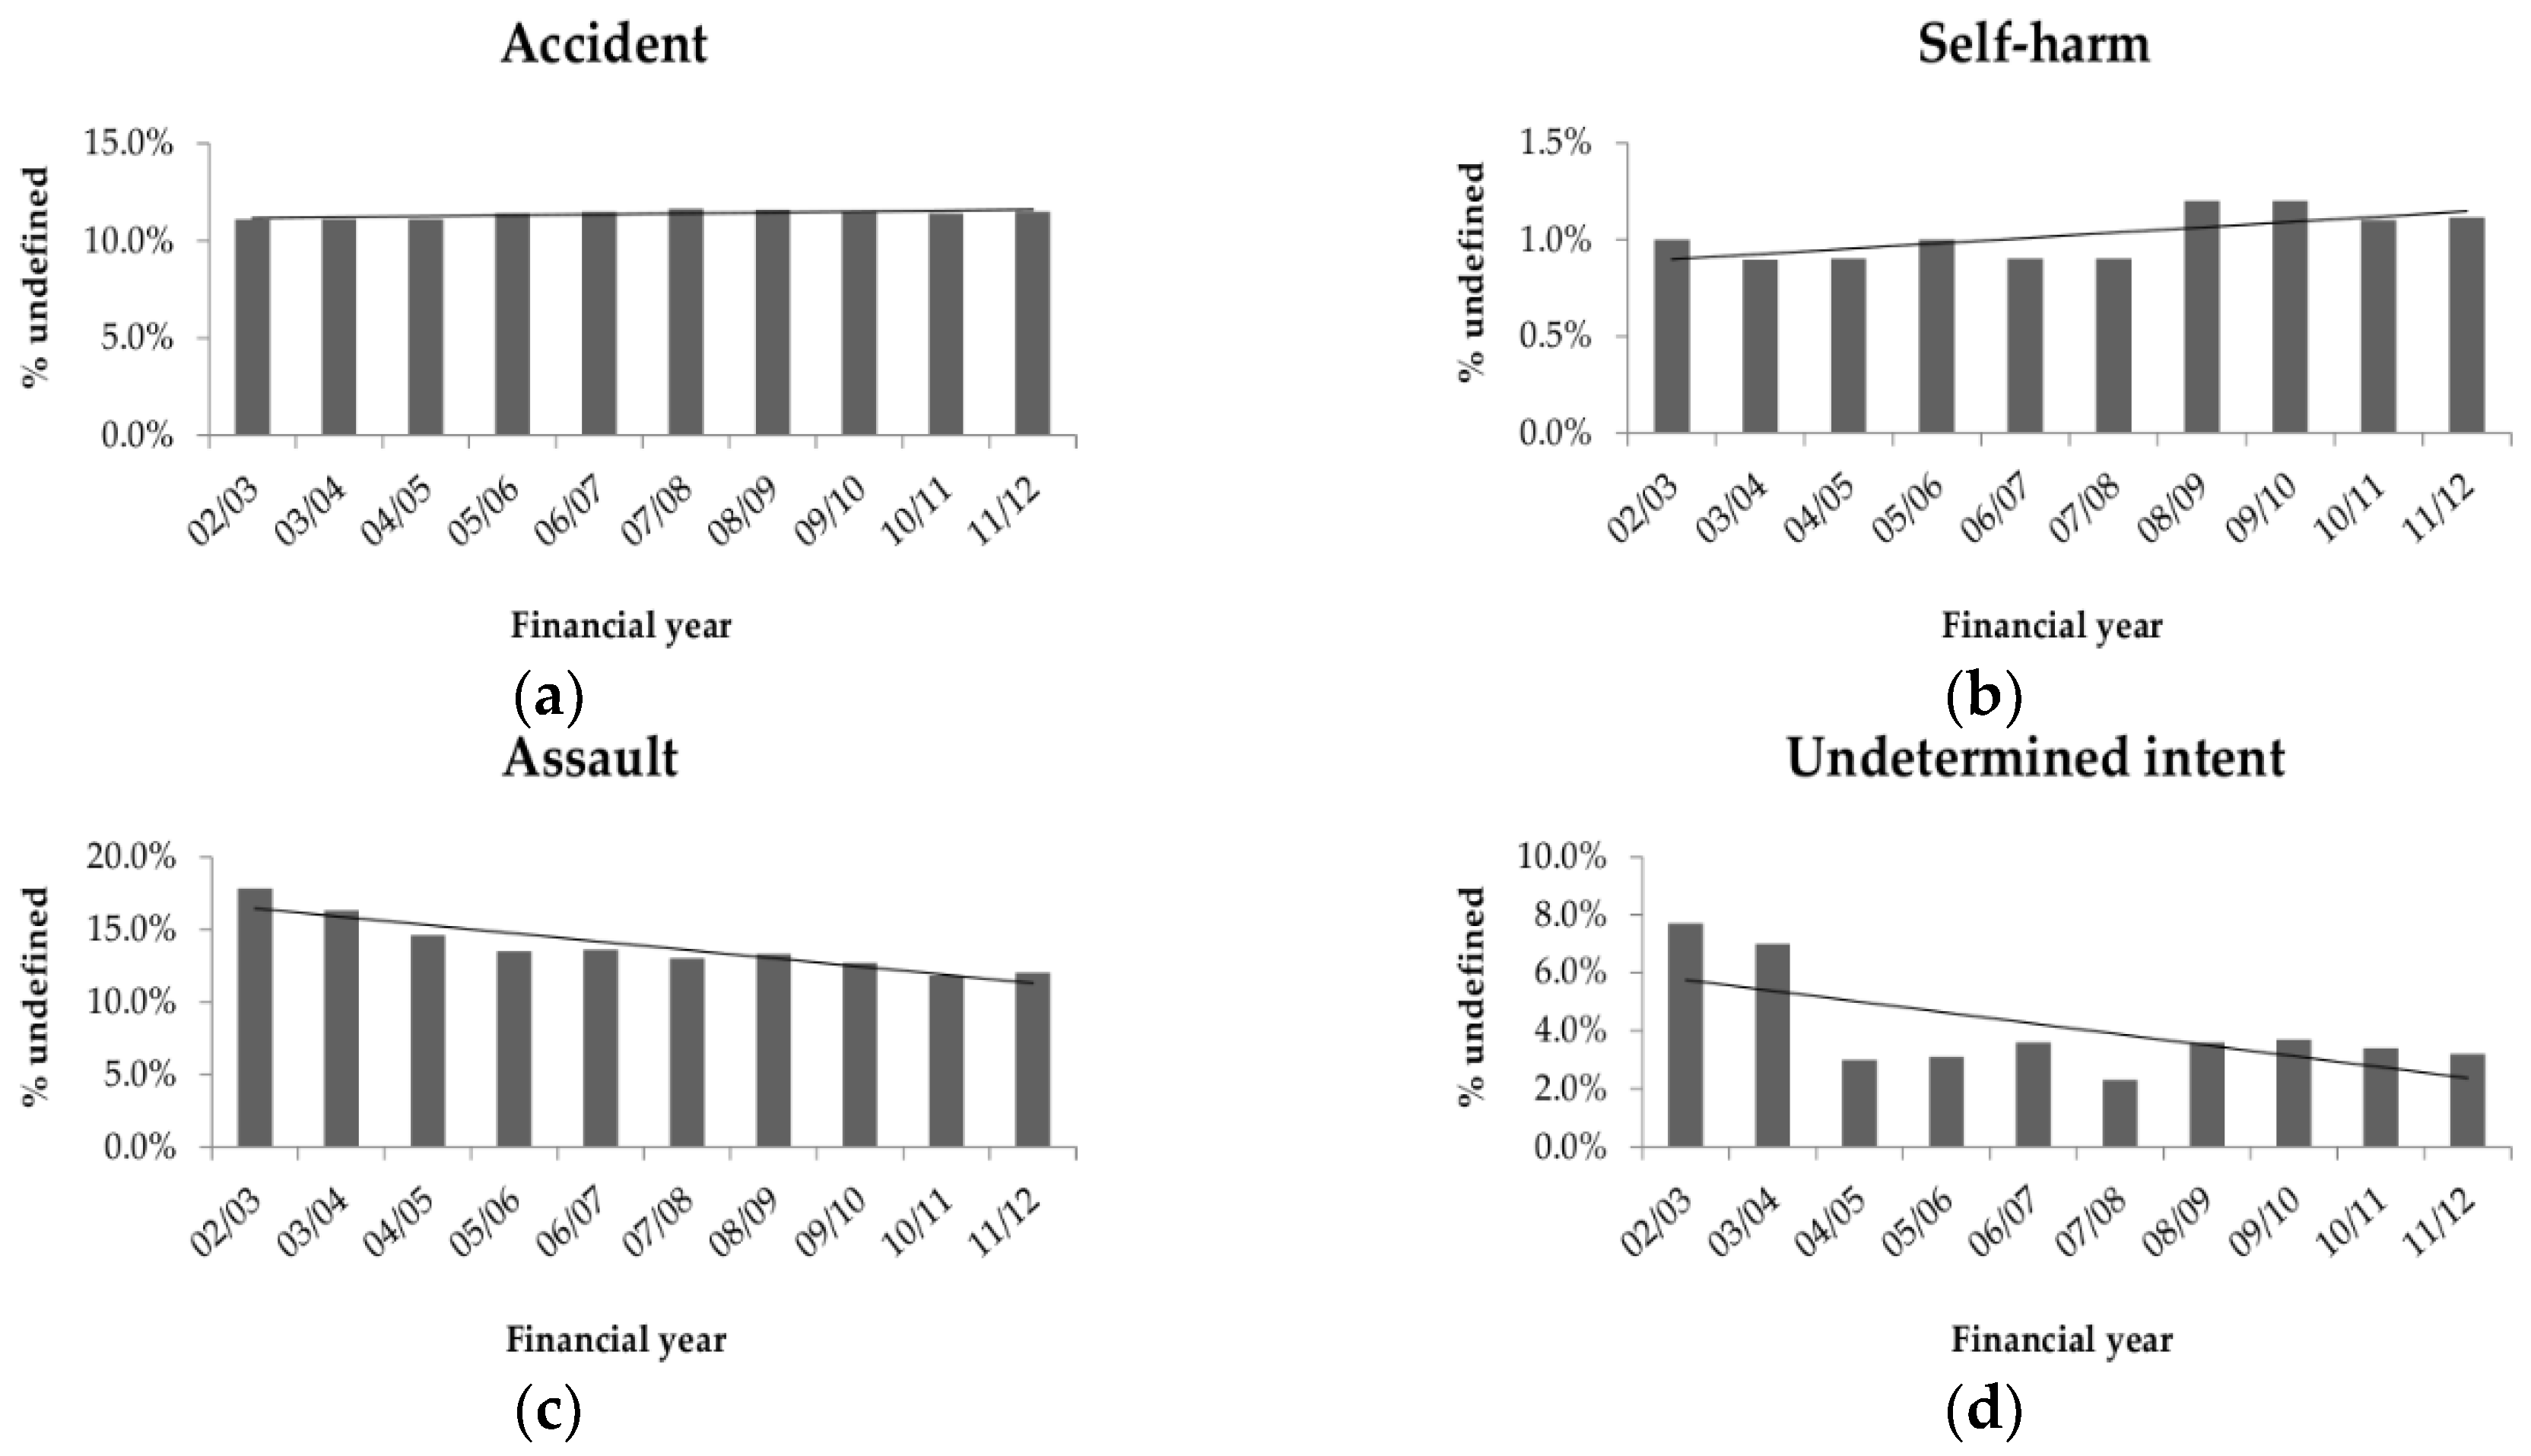
3.2. Changing Specificity of External Cause Codes

The association between the proportion of undefined cases in the earliest year of data and the most recent year of data was examined to identify whether there were any improvements or deterioration in the specificity of external cause data across intent and mechanism blocks.
There was a significant improvement in specificity over time in the assault block (with the proportion of undefined codes reducing from 18% in July 2002–June 2003 to 12% in July 2011–June 2012), and the undetermined intent block (8% to 3%). All transport codes (except other land transport, water transport, and air transport) improved, with substantial improvements in the specificity for pedestrians (with the proportion of undefined codes reducing from 13% in July 2002–June 2003 to 7% in July 2011–June 2012), pedal cyclists (27% to 16%), heavy transport occupants (21% to 9%), and bus occupants (26% to 14%).
However, there were several categories where there was a marked deterioration in the specificity, identified by an increasing use of undefined codes over time. The most substantial increase in the use of undefined codes over time was for cases of accidental drowning and submersion, with an increase in undefined codes from 17% in July 2002–June 2003 to 37% in July 2011–June 2012. Other mechanisms for which there was a significant increase in the proportion of undefined codes over time were forces of nature (with the proportion of undefined codes increasing from 3% in July 2002–June 2003 to 15% in July 2011–June 2012), assault-related firearms (34% to 52%), and undetermined intent sharp objects (29% to 43%). Furthermore, poisoning by noxious substances showed a substantial increase in the use of undefined codes across most intent blocks, with accidental poisoning increasing from 37% undefined in July 2002–June 2003 to 42% in July 2011–June 2012, assault-related poisoning increasing from 21% undefined in July 2002–June 2003 to 29% in July 2011–June 2012), and poisoning where intent was undetermined increasing from 13% undefined in July 2002–June 2003 to 21% in July 2011–June 2012).
Overall, the aggregate mechanism blocks for accidents and undetermined intent showed a significant deterioration in specificity over time, with the use of undefined codes increasing from 26% in July 2002–June 2003 to almost 30% in July 2011–June 2012 for accidents, and 14% to 19% for undetermined intent codes over the same time period. There was a marginal improvement in the aggregate mechanism block for intentional self-harm, and no change in the specificity of mechanism block codes for assaults. This pattern of results is further reflected in Figure 1 showing the rate of undefined cases over these years.

3.3. Specificity of Place Codes

Table 2 provides the frequency of separations for place of occurrence and activity at the time of injury blocks, as well as the proportion of undefined categories for each block and the change over time in the proportion of undefined cases. Place was poorly defined at the broad block level, with almost 43% of cases assigned an undefined place code. Within the specific place blocks, the most poorly defined subcategories over the 10 year period were home (80% undefined), industrial and construction area (27% undefined), and street and highway (24% undefined).

3.4. Changing Specificity of Place Codes

There was a significant improvement in specificity over time in the home category (with the proportion of undefined codes reducing from 98% in July 2002–June 2003 to 51% in July 2011–June 2012) due to an increased number of defined subcategories to indicate places within the home in ICD-10-AM sixth edition (implemented in July 2008).
However, there was a marked deterioration in the specificity of place codes, identified by an increasing use of undefined codes over time for the street and highway category, which increased from 11% undefined in July 2002–June 2003 to 86% in July 2011–June 2012. This was due to ICD-10-AM seventh edition changes (implemented in July 2010) to inactivate the subcategory for Y92.40 roadway and include this as an inclusion term under the unspecified category Y92.49 Unspecified public highway, street, or road.

3.5. Specificity of Activity Codes

Activity is the most poorly defined element at the broad block level, with 72% of cases assigned an undefined activity code. Within the specific activity blocks, sports and leisure activities were undefined for almost 24% of cases and work-related activities were undefined for almost 56% of cases.

3.6. Changing Specificity of Activity Codes

There was a significant decrease in the specificity of sports and leisure activity codes and work-related activity codes over time. The proportion of undefined sports or leisure activity codes increased from 24% in July 2002–June 2003 to 30% in July 2011–June 2012. The proportion of undefined work-related activity codes increased from 52% in July 2002–June 2003 to 59% in July 2011–June 2012.

3.7. Changing Specificity by Hospital and Patient Characteristics

Table 3 provides the frequency of separations by hospital characteristics (jurisdiction, location, and sector) and patient characteristics (age, sex, and external cause) and the proportion of defined/undefined codes (aggregating across the intent and mechanism specific variables as described in the methods). Changes over time in the proportion of undefined cases for each category are displayed.
Overall, the jurisdictions where the highest proportions of undefined external cause of injury codes were used were South Australia, Victoria, and New South Wales, but Western Australia had the largest increase in the proportion of undefined codes used with 5% more cases being undefined in July 2011–June 2012 compared to July 2002–June 2003. Hospitals in very remote locations and hospitals in the private sector recorded the highest proportion and largest increases of undefined external cause of injury codes increasing by almost 6% and 9% respectively over the 10 year period. Those aged over 60 years and females had the higher proportion of undefined code usage of all age groups, with almost 45% and 35% respectively assigned an undefined code, both increasing significantly over time. The proportion of cases with undefined codes reduced for those aged 14 years and younger, with 2% fewer undefined codes in July 2011–June 2012 compared to July 2002–June 2003. When examining external causes overall, accidents had the highest proportion overall with undefined codes, with almost 35% of cases overall assigned an undefined accident code, and this proportion increased significantly over the time period. There was an improvement overall in the specificity of intentional self-harm and assault codes, with a decrease of 2% and almost 6% respectively in the proportion of undefined codes.

4. Discussion

This study examined the specificity of national injury hospitalization data for key injury surveillance elements and identified several areas of improvement and deterioration over the last decade. There were around 11% of accidents and assaults respectively where there was no information regarding the mechanism causing the injury in the 10 year dataset, which amounts to over 450,000 injury cases for which we know nothing more than the fact it was due to an accident or an assault. This is a significant deficit in our understanding of the magnitude of different mechanisms of injury, limiting the evidence-base from which to establish both unintentional injury prevention and violence prevention initiatives in Australia. The key areas where there was considerably poor specificity and/or where there was a highly significant reduction in the level of specificity of codes over time are described below.
Fall prevention is a national injury priority area [19], yet two out of five patients who were hospitalized due to a fall had no further information about the cause of the fall recorded in the data and there was no improvement in the specificity of falls information over time despite the resources which have been devoted to the falls area. Without information about the main causes of hospitalized fall cases, we are unable to appropriately allocate resources to the falls prevention areas where there is the most need.
The specificity of information regarding firearm-related injuries was poor across all intent types and deteriorated significantly across the time period under investigation. The deteriorating specificity of types of firearms in coded injury hospitalization data warrants further attention to identify whether there has been a reduction in the information recorded in medical records over time regarding firearms, or whether there is a larger range of firearms which are not well captured by the current classification system, or whether coders are not receiving sufficient training in coding of certain injury mechanisms [20].
Similarly, the specificity of types of sharp objects causing injury was poor across intent blocks, especially cases of undetermined intent. The use of sharp objects in assaults has received considerable attention over the last few years, particularly in relation to “glassings” (i.e., assault with broken glass) and knife attacks. As such, the decreasing specificity of types of sharp objects involved in injury hospitalizations needs investigation and improvement to accurately monitor changing patterns of violence-related hospitalizations over time.
The specificity of drowning codes was particularly poor with significant decreases in specificity over time. Drowning prevention programs particularly need accurate data regarding the number of drownings occurring in pools, bathtubs, and open water for example, and if over one-third of cases do not specify the body of water in which the person drowns, there is a significant underestimation of one or more of these drowning locations.
Forces of nature specificity reduced over time. The forces of nature which are defined in this block include: excessive natural heat/cold, sunlight, lightning, earthquake, volcanic eruption, avalanche/landslide/earth movement, storm, and flood, yet almost 15% of patients injured due to forces of nature are assigned an undefined code. This suggests that either there has been a reduction in the information recorded in medical records over time regarding forces of nature or there are an increased range of forces of nature which are not well captured by the current classification system, or that coders are not receiving sufficient training in coding of certain injury mechanisms. With the different climates and weather events across Australia, further investigation to examine whether there are differences across jurisdictions in the specificity of forces of nature injury coding may assist to identify reasons for the decreased specificity.
Poisoning by noxious substance coding decreased in specificity across all intent blocks except intentional self-harm and accidental poisonings showed the poorest specificity of all intent blocks. It is likely that for cases of intentional self-harm, recording of the chemical substance that has been consumed is well documented as part of a comprehensive mental health treatment plan, hence explaining the smaller proportion of undefined codes (10%) for this intent block. Furthermore, a broad array of substances are included within the undefined “other and unspecified” code, including glues and adhesives, poisonous foodstuffs and plants, paints and dyes, antibiotics and hormones, and synthetic substitutes to name a few. While the Chapter 19 Injury and Poisoning chapter also captures details on substances involved in injury events, this too is inadequate to cover the range of substances causing harm. Future revisions of the ICD-10-AM should consider expansion to better capture the range of specified substances causing poisonings.
Place and activity were both very poorly defined, with two out of five cases not having a place of injury coded and three quarters of cases not providing an activity of the injured party. To target injury prevention and know which organizations to engage in the prevention initiatives, place and activity are critical factors. In order to provide useful data to stakeholders, (e.g., Workplace Health and Safety, sport safety advocates, education providers) who may wish to engage in prevention initiatives, an accurate estimate of magnitude of the problem for their domain, the place and activity code deficit needs urgent attention.
This study also identified discrepancies in the specificity of data by jurisdiction, sector, location, age, sex and intent, suggesting certain subgroups may require more attention to improve external cause data quality overall. Particularly problematic subgroups where data quality was poorest were private hospitals, hospitals in very remote locations, and injuries in patients aged over 60 years of age, all of which were becoming significantly less defined over time. Further investigation is needed to uncover the reasons for poor quality (e.g., untrained coding staff, poor documentation of clinicians, poor information systems for recording data) in order to target interventions appropriately. It is likely that a multi-pronged approach to improve the quality of injury data is needed, which includes a stronger emphasis on documentation and coding of external causes in both medical and health information management training programs, hospital data audit and feedback mechanisms which include external cause data (not just diagnostic codes), and incorporation of external cause data in information system designs to ensure clinicians and coders are prompted to accurately record and code such information.

5. Conclusions

With injury being a leading cause of the fatal burden of disease in Australia, specific data about the causes, places, and activities surrounding injury are critical for informing injury prevention policy and practice. This study has identified significant, and worsening, deficiencies in the specificity of coded injury data in several areas. Focal attention is needed to improve the quality of injury data, especially on those identified in this study, to provide the evidence base needed to address the significant burden of injury in the Australian community.

Key Messages

What is already known on this subject:
  • The specificity of injury data describing causes of injuries, where injuries occur and what activities people are undertaking at the time when injuries occur affects our ability to appropriately target injury prevention policy and practice.
  • Previous Australian research quantified the level of specificity in injury hospitalization data with considerably poor specificity for some major intent categories (unintentional injuries and assaults), mechanisms (falls, burns, and poisonings), and for activity and place codes.
  • As injury hospitalization data are a critical epidemiological tool for directing injury prevention policy and practice in Australia, it is important to understand the strengths and weaknesses of these data and identify any improvements or deteriorations in these data over time.
What this study adds:
  • This research identified the key areas where there was considerably poor specificity and/or where there was a highly significant reduction in the level of specificity of codes over time.
  • Discrepancies in the specificity of data by subgroups was identified, including by jurisdiction, sector, location, age, sex, and intent, suggesting certain subgroups may require more attention to improve external cause data quality overall.
  • Key focal areas where there was significant and worsening deficiencies in data specificity included the mechanisms of falls, firearms, sharp objects, drowning, forces of nature, and poisonings, and the subgroups of private hospitals, remote hospitals, and patients over 60 years of age.

Acknowledgments

This work was supported by the Australian Research Council Future Fellowship under Grant FT120100202.

Author Contributions

K.V. designed the study, conducted the analysis, and drafted the manuscript. A.W. assisted in the analysis of the data and drafting of the manuscript. All authors read and approved the final manuscript.

Conflicts of Interest

The authors declare no conflict of interest.

References

  1. Australian Institute of Health and Welfare. Australian Burden of Disease Study: Fatal Burden of Disease 2010; Australian burden of disease study series No. 1. Cat. No. Bod 1.; AIHW: Canberra, Australia, 2015.
  2. World Health Organisation. Who Injury Surveillance Guidelines; World Health Organisation: Geneva, Switzerland, 2001. [Google Scholar]
  3. Annest, J.L.; Fingerhut, L.A.; Gallagher, S.S.; Grossman, D.C.; Hedegaard, H.; Johnson, R.; Kohn, M.; Pickett, D.; Thomas, K.E.; Trent, R.B. Strategies to improve external cause-of-injury coding in state-based hospital discharge and emergency department data systems: Recommendations of the cdc workgroup for improvement of external cause-of-injury coding. MMWR 2008, 57, 1–15. [Google Scholar] [PubMed]
  4. McKenzie, K.; Fingerhut, L.; Walker, S.; Harrison, A.; Harrison, J. Classifying external causes of injury: History, current approaches, and future directions. Epidemiol. Rev. 2012, 34, 4–16. [Google Scholar] [CrossRef] [PubMed]
  5. National Centre of Classification in Health (NCCH). The International Statistical Classification of Diseases and Related Health Problems, 10th Revision, Australian Modification (ICD-10-AM), 9th ed.; University of Sydney: Sydney, Australia, 2015. [Google Scholar]
  6. Langley, J.; Stephenson, S.; Thorpe, C.; Davie, G. Accuracy of injury coding under icd-9 for new zealand public hospital discharges. Inj. Prev. 2006, 12, 58–61. [Google Scholar] [CrossRef] [PubMed]
  7. LeMier, M.; Cummings, P.; West, T.A. Accuracy of external cause of injury codes reported in washington state hospital discharge records. Inj. Prev. 2001, 7, 334–338. [Google Scholar] [CrossRef] [PubMed]
  8. MacIntyre, C.R.; Ackland, M.J.; Chandraraj, E.J. Accuracy of injury coding in victorian hospital morbidity data. Aust. N. Z. J. Public Health 1997, 27, 779–783. [Google Scholar]
  9. Langlois, J.A.; Buechner, J.S.; O’Connor, E.A.; Nacar, E.Q.; Smith, G.S. Improving the E coding of hospitalizations for injury: Do hospital records contain adequate documentation? Am. J. Public Health 1995, 85, 1261–1265. [Google Scholar] [CrossRef] [PubMed]
  10. Smith, S.M.; Colwell, L.S.; Sniezek, J.E. An evaluation of external cause-of-injury codes using hospital records from the indian health service, 1985. Am. J. Public Health 1990, 80, 279–281. [Google Scholar] [CrossRef] [PubMed]
  11. McKenzie, K.; Enraght-Moony, E.; Walker, S.; McClure, R.; Harrison, J. Accuracy of external cause of injury coding in hospital records. Inj. Prev. 2009, 15, 60–64. [Google Scholar] [CrossRef] [PubMed] [Green Version]
  12. Bergstrom, M.F.; Byberg, L.; Melhus, H.; Michaelsson, K.; Gedeborg, R. Extent and consequences of misclassified injury diagnoses in a national hospital discharge registry. Inj. Prev. 2011, 17, 108–113. [Google Scholar] [CrossRef] [PubMed]
  13. Langley, J.; Davie, G.; Simpson, J. Quality of hospital discharge data for injury prevention. Inj. Prev. 2007, 13, 42–44. [Google Scholar] [CrossRef] [PubMed]
  14. McKenzie, K.; Harding, L.F.; Walker, S.M.; Harrison, J.E.; Enraght-Moony, E.L.; Waller, G.S. The quality of national data on injuries requiring hospitalisation. Med. J. Aust. 2006, 185, 526. [Google Scholar] [PubMed]
  15. Soo, I.; Lam, M.; Rust, J.; Madden, R. Do we have enough information? How ICD-10-AM activity codes measure up. Health Inf. Manag. J. 2009, 38, 22–34. [Google Scholar]
  16. Finch, C.; Boufous, S. Do inadequacies in ICD-10-AM activity coded data lead to underestimates of the population frequency of sports/leisure injuries? Inj. Prev. 2008, 14, 202–204. [Google Scholar] [CrossRef] [PubMed]
  17. Finch, C.F.; Boufous, S. Activity and place—Is it necessary both to identify sports and leisure injury cases in icd-coded data? Int. J. Inj. Control Saf. Promot. 2008, 15, 119–121. [Google Scholar] [CrossRef] [PubMed]
  18. National Casemix and Classification Centre. ICD-10-AM/ACHI/ACS Chronicle: Chronicle of Changes, 1st ed.–8th ed.; University of Wollongong: Wollongong, Australia, 2013. [Google Scholar]
  19. National Public Health Partnership (NPHP). The National Injury Prevention and Safety Promotion Plan: 2004–2014; NPHP: Canberra, Australia, 2004.
  20. McKenzie, K.; Enraght-Moony, E.; Harding, L.; Walker, S.; Waller, G.; Chen, L. Coding external causes of injuries: Problems and solutions. Accid. Anal. Prev. 2008, 40, 714–718. [Google Scholar] [CrossRef] [PubMed]
Figure 1. Rate of undefined cases for each intent classification from July 2002 to June 2012. (a) Accident; (b) Self-harm; (c) Assault; (d) Undetermined intent.
Safety 02 00006 g001
Table 1. Specificity of major and minor code blocks for external cause for injury separations between July 2002 and June 2012.
ICD-10-AM CodeICD-10-AM DescriptionNumber of SeparationsPercent of InjuriesUndefined CodesUndefined Codes NUndefined Codes %Percent Change 1
Major intent blocks
V00–X59Accidents3,688,53787.2%X58, X59420,22711.4%0.4% *
X60–X84Intentional self-harm257,7886.1%X83, X8426451.0%0.1%
X85–Y09Assault233,3415.5%Y08, Y0932,13211.4%−5.8% *
Y10–Y34Event of undetermined intent48,7271.2%Y33, Y3418133.7%−4.5% *
Accident mechanism blocks
V00–V99Transport (all)574,56713.6%V98, V9951870.9%−0.9% *
V00–V09Transport: Pedestrians42,5871.0%V09444710.4%−6.8% **
V10–V19Transport: Pedal cyclist96,2132.3%V1922,50923.4%−11.6% **
V20–V29Transport: Motorcycle rider142,9843.4%V2928,99320.3%−6.1% *
V30–V39Transport: Three-wheeled occupant7670.02%V3915319.9%−4.6%
V40–V49Transport: Car occupant196,8304.6%V4914,8137.5%−4.2% *
V50–V59Transport: Pick up truck/van occupant54560.1%V5979514.6%−6.6% *
V60–V69Transport: Heavy transport occupant83290.2%V69134216.1%−12.3% **
V70–V79Transport: Bus occupant49780.1%V7998819.8%−12.4% **
V80–V89Transport: Other land transport59,4641.4%V87.7–V87.9, V88.7–V88.9, V89726112.2%4.1% *
V90–V94Transport: Water transport99400.2%V94273027.5%4.5%
V95–V97Transport: Air and space transport18320.04%V95.8, V95.9, V96.80, V96.9, V97.0, V97.842323.1%17.6% **
W00–W19Falls1,590,97437.6%W17.8, W17.9, W18.8, W18.9, W19665,12341.8%1.5% *
W20–W49Inanimate mechanical forces617,36114.6%W4935,8685.8%4.2% *
W50–W64Animate mechanical forces150,0883.6%W6423451.6%−0.3%
W65–W74Drowning and submersion52360.1%W73, W74144527.6%20.1% **
W75–W84Threats to breathing78590.2%W83, W845416.9%3.9%
W85–W99Electricity, radiation, temperature10,1220.2%W99260.3%0.2%
X00–X09Smoke, fire, flames24,2080.6%X08, X09682928.2%−4.2% *
X10–X19Heat and hot substances39,7650.9%X1931197.8%0.2%
X20–X29Venomous animals and plants34,6680.8%X27.8, X28, X296101.8%1.3% *
X30–X39Forces of nature71880.2%X394516.3%11.4% **
X40–X49Poisoning by noxious substances102,0952.4%X44, X47.8, X47.9, X4942,80241.9%5.0% *
X50–X57Overexertion, travel, privation104,1792.5%X57670.1%0.0%
W00–X57Non-transport Accident (minor code blocks)2,693,74363.7%All of above759,22628.2%3.6% *
Intentional self-harm blocks
X60–X69Poisoning by noxious substances212,4815.0%X64, X67.8, X67.9, X6922,43310.6%−1.6% *
X71Drowning and submersion2130.01%X71.8, X71.94219.7%−12.6%
X72–X74Firearms4730.01%X74.912125.6%12.0%
X78Sharp object32,5960.8%X78.8, X78.9855126.2%−5.9% *
X82Motor vehicle occupant7000.02%X82.2, X82.3, X82.8, X82.914220.3%9.0%
X60–X82Intentional self-harm (minor code blocks)255,1436.0%All of above31,28912.3%−2.0% *
Assault blocks
X85–X90Poisoning by noxious substances7810.02%X89, X9015519.8%8.1% *
X92Drowning and submersion190.00%X92.8, X92.915.3%0.0%
X93–X95Firearms11650.03%X95.952144.7%18.0% **
X99Sharp object28,2700.7%X99.8, X99.9713325.2%1.8%
Y03Motor vehicle occupant2720.01%Y03.2, Y03.3, Y03.8, Y03.923787.1%−9.1%
X85–Y07Assault (minor code blocks)201,2094.76%All of above80474.0%0.2%
Undetermined intent blocks
Y10–Y19Poisoning by noxious substances38,3520.9%Y14, Y17.8, Y17.9, Y19709218.5%8.0% *
Y21Drowning and submersion800.00%Y21.8, Y21.92227.5%15.9%
Y22–Y24Firearms4300.01%Y24.922151.4%−2.2%
Y28Sharp object28370.07%Y28.8, Y28.9104136.7%13.8% **
Y32Motor vehicle occupant170.00%Y32.2, Y32.3, Y32.8, Y32.9529.4%0.0%
Y10–Y32Undetermined intent (minor code blocks)46,9141.1%All of above838117.9%4.3% *
Notes: 1 Change describes the increase or decrease (as signified by “–” symbol) in use of undefined codes comparing July 2002–June 2003 to July 2011–June 2012. * A single asterisk indicates whether the difference is significant at p < 0.01 level; ** a double asterisk indicates a Kendall’s tau-b correlation value of >0.10.
Table 2. Specificity of major and minor code blocks for activity and place for injury separations between July 2002 and June 2012.
ICD-10-AM CodeICD-10-AM DescriptionNumber of SeparationsPercent of InjuriesUndefined CodesUndefined Codes NUndefined Codes %Percent Change 1
Place
Y92Place (major code block)4,224,439Y92.88, Y92.91,800,72542.6%2.0% *
Y92.0Home1,118,68326.5%Y92.09890,06279.6%−46.7% **
Y92.1Residential institution207,2034.9%Y92.18, Y92.1995154.6%−1.3% *
Y92.2School, other institution, and public admin area133,9933.2%Y92.2912,9129.6%−1.4% *
Y92.3Sports and athletic area218,0955.2%Y92.38, Y92.3924,68511.3%2.1% *
Y92.4Street and highway422,69110.0%Y92.48, Y92.49102,77224.3%75.3% **
Y92.5Trade and service area125,9153.0%Y92.58, Y92.5924,39219.4%4.5% *
Y92.6Industrial and construction area66,4201.6%Y92.68, Y92.6917,71926.7%−6.7% *
Y92.0–Y92.7Place (minor code blocks)2,423,714All of the above1,082,05744.6%−9.7% *
Activity
U50–U73Activity(major code block)4,221,759U73.8, U73.93,043,97372.1%−2.1% *
U50–U72Sports or leisure529,92112.5%U70–U72124,93723.6%6.6% *
U73.0Working262,2696.2%U73.08,U73.09146,69955.9%7.1% *
U50–U73.2Activity (minor code blocks)1,177,786All of the above271,63623.1%3.4% *
Notes: 1 Change describes the increase or decrease (as signified by “–” symbol) in use of undefined codes comparing July 2002–June 2003 to July 2011–June 2012. * A single asterisk indicates whether the difference is significant at p < 0.01 level; ** a double asterisk indicates a Kendall’s tau-b correlation value of >0.10.
Table 3. Overall specificity by hospital/patient/external cause characteristics for injury separations between July 2002 and June 2012.
CharacteristicNumber of SeparationsPercent of InjuriesUndefined Codes NUndefined Codes %Change 1
Hospital jurisdiction
ACT60,6731.4%16,93327.9%−5.1% *
NSW1,344,25432.0%438,91032.7%2.2% *
NT61,6061.5%13,15921.4%3.2% *
Qld882,38121.0%277,68531.5%2.0% *
SA317,1827.5%105,28133.2%1.6% *
Tas67,6521.6%16,95925.1%0.1%
Vic1,056,83225.0%349,43033.1%1.5% *
WA412,7779.8%130,31831.6%4.7% *
Hospital location
Major cities2,366,88465.7%630,77026.6%2.1% *
Inner regional729,18020.2%203,58327.9%0.8% *
Outer regional399,93911.1%112,78828.2%0.1%
Remote58,1971.6%17,05629.3%1.2%
Very remote46,8801.3%16,97936.2%5.7% *
Hospital sector
Public3,601,08085.2%981,17627.2%1.5% *
Private627,31314.8%381,10460.8%8.6% *
Patient age
0–14years637,51215.1%166,39726.1%−2.0% *
15–29 years1,004,69923.8%264,22226.3%0.5%
30–44 years758,93517.9%204,08926.9%1.9% *
45–60 years589,39813.9%175,55029.8%2.0% *
60+ years1,237,82129.3%552,01544.6%1.1% *
Patient gender
Female1,790,46342.3%631,56435.3%2.3% *
Male2,437,88057.7%730,70430.0%1.7% *
External cause
Accidents3,688,53787.2%1,277,97334.6%2.5% *
Intentional self-harm257,7886.1%33,93413.2%−2.0% *
Assault233,3415.5%40,17917.2%−5.6% *
Event of undetermined intent48,7271.2%10,19420.9%0.3%
Notes: 1 Change describes the increase or decrease (as signified by “–” symbol) in use of undefined codes comparing July 2002–June 2003 to July 2011–June 2012. *A single asterisk indicates whether the difference is significant at p < 0.01 level; ** a double asterisk indicates a Kendall’s tau-b correlation value of >0.10.

