Article

Semi-Quantitative Risk Assessment of Occupational Back Pain and Its Associated Risk Factors Among Electronics Assembly Workers

by
Sunisa Chaiklieng
* and
Pornnapa Suggaravetsiri
Department of Occupational Safety and Environmental Health, Faculty of Public Health, Khon Kaen University, Khon Kaen 40002, Thailand
*
Author to whom correspondence should be addressed.
Safety 2025, 11(4), 104; https://doi.org/10.3390/safety11040104
Submission received: 9 May 2025 / Revised: 23 October 2025 / Accepted: 28 October 2025 / Published: 1 November 2025

Abstract

Electronics manufacturing workers engaged in material handling are susceptible to occupational back pain. This cross-sectional study aimed to develop a semi-quantitative risk assessment matrix and evaluate ergonomic risk factors contributing to back pain among workers in this industry. A total of 354 electronics assembly workers participated in the study. Data collection involved the use of the Musculoskeletal Disorders (MSDs) Severity and Frequency Questionnaire (MSFQ), the Rapid Upper Limb Assessment (RULA), and workstation lighting intensity measurements. The risk assessment matrix for back pain prediction was applied, and associated factors were analyzed using multiple logistic regression. Results indicated that lighting intensity at 76.52% of inspection stations was below the standard requirements. Furthermore, 57.63% of workstations exhibited high- to very high-risk postures, necessitating ergonomic intervention. The risk matrix predicted that 62.44% of workers were at moderate to very high risk of occupational back pain. Statistical analysis identified manual lifting (ORadj = 2.48; 95% CI = 1.13–5.44), shift work (ORadj = 2.21; 95% CI = 1.11–4.40), and inappropriate workstation design (ORadj = 3.45; 95% CI = 1.42–8.42) as significant contributors to elevated back pain risk. These findings underscore the importance of ergonomic interventions and the application of a semi-quantitative risk assessment matrix for the prevention of occupational back pain in industrial workers.

1. Introduction

Musculoskeletal disorders (MSDs), the most common work-related disease globally, are a major problem in occupational health, particularly in occupations that involve improper work postures and poor conditions. They are a leading cause of physical disability and a key contributor to the global burden of noncommunicable disease-related disability [1]. The Thai Workers’ Compensation Fund, Social Security Office, reported work-related musculoskeletal disorders (WMSDs) as the leading work-related illness in terms of severity, and the leading disease occurring due to the nature or conditions of the work [2]. In 2024, WMSDs caused by work characteristics or risk factors associated with working conditions accounted for the highest number of cases among the Thai population, totaling 78,020 [3]. The most common of all WMSDs was back pain caused by ergonomic factors in heavy physical work, such as lifting, forceful movements, and awkward postures (e.g., bending, twisting, and static or prolonged standing postures) [4,5]. According to complaints recorded, back pain was most prevalent among electronics manufacturing workers engaged in repetitive work and prolonged standing, leading to these disorders [5,6].
Ergonomic risk assessment is widely used in the observation and analysis of work-related postural risk from repetitive movement of the upper limbs, which can cause back pain among electronic assembly workers over the long term [6]. Previous developments in risk assessment tools have used reliable techniques, such as work posture observation or objective assessments. For example, the Rapid Upper Limb Assessment (RULA) is used to evaluate upper limb movements in static postures for industrial workers [7], while the Rapid Entire Body Assessment [REBA] is employed to assess lower limb postural movements [8]. These tools are appropriate for mono-task jobs but less effective for multitask jobs, where continuous risk with a high workload can lead to musculoskeletal fatigue over an 8 h workday [9,10]. As mentioned, recent assessment tools that rely on a single approach are not suitable for all multitasking occupations. Previous studies have found that the levels of ergonomic risk for back pain are very high among electronics assembly and industry workers, specifically those who perform standing operations [6,11]. Moreover, sitting without back support during electronics product inspection has also been identified as a risk factor for back pain caused by repetition and awkward postures [11,12]. Manual handling, specifically frequent lifting of materials, has previously been shown to pose a high ergonomic risk [6]. This task was identified as a contributing factor to back pain in molding workers of the semiconductor industry [11] and was statistically significant in the development of back pain among multitasking operators in the electronics industry [12].
Subjective assessment is another method used to screen for musculoskeletal health problems through the Musculoskeletal Disorders (MSDs) Severity and Frequency Questionnaire (MSFQ) [12,13]. A 1-month prevalence of back pain has previously been reported in a cross-sectional study [12], but it remains unclear how much of the back pain can be predicted by semi-quantitative risk assessment or how much is caused by the physical nature of work in the electronics assembly process versus other individual tasks performed during work operations. It was clearly shown that electronics assembly workers faced problems due to repetitive tasks requiring them to sit continuously for more than 2 h a day or stand for more than 2 h a day [6,12]. The characteristic of work involves high-precision, small-component assembly activities and fast-paced automatic machine operations that require sustained visual focus on workpieces. However, sustained visual attention (eye focusing) on inspection pieces during the 8 h shift has not previously been identified as a significant risk factor [12].
Since previous cross-sectional studies have not clearly identified work factors affecting back pain among electronic workers, this study aimed to assess the potential risk of back pain using a semi-quantitative risk assessment matrix. The matrix incorporates a perception-based approach to back discomfort levels and postural ergonomic risk levels. Additionally, the study seeks to predict occupational risk factors correlated with risk levels of back pain among electronics workers. The identified risk levels and factors will be useful for implementing improvements in industrial processes within electronics work or other similar industries.

2. Materials and Methods

2.1. Population and Sample Size

An analytical cross-sectional study was conducted to investigate the health risks of back pain and the factors associated with its risk levels. The study was conducted between August and December 2016. The population consisted of employees from medium-sized electronics companies with up to 200 workers per shift work, located in the northeast of Thailand.
The sample size was calculated using the formula for an analytical cross-sectional study employing logistic regression for risk factor identification [14]. Working posture factors associated with back pain in industrial workers were considered in relation to the proportion of employees experiencing back pain. According to a study by Widanarko et al. [15], the proportion of workers with back pain who had undesirable working postures was 0.57. Based on this, the final sample size requirement in this study was 354 participants who met the inclusion and exclusion criteria. The inclusion criteria were as follows: (1) being a full-time employee in the production assembly department of the electronics industry for at least 1 year, and (2) volunteering to participate in the study. The exclusion criteria were as follows: (1) having a history of back pain treatment within the past month; (2) having a chronic musculoskeletal disease or injury affecting the cervical, thoracic, or lumbar spine, diagnosed by a physician; or (3) being pregnant.
This study obtained ethical approval from the Khon Kaen University Ethics Committee in Human Research, Thailand (Approval No. HE582213). All participants provided informed consent prior to participation.

2.2. Research Tools

2.2.1. Work Characteristics Questionnaire and the Musculoskeletal Disorders (MSDs) Severity and Frequency Questionnaire (MSFQ)

A structured questionnaire previously used among electronics industrial workers [12] was employed to collect personal characteristics and work characteristics, including workload. Additionally, the Musculoskeletal Disorders (MSDs) Severity and Frequency Questionnaire (MSFQ) [13] was used. The MSFQ consists of two components: (1) frequency of symptoms, rated on no pain and a 4-point scale, i.e., 1–2 times per week, 3–4 times per week, once daily or every day, and several times every day, and (2) severity of pain, also rated on no pain and a 4-point scale, i.e., mild (annoying, interfering little with work), moderate (short-lasting pain which interferes significantly with posture adaptation), severe (persistent, disabling pain affecting work ability), and very severe (persistent pain leading to inability to perform work and affecting quality of life). Both anatomical regions of the back (upper and lower back) from the MSFQ were considered for self-reported back discomfort over the past month. Discomfort scores were calculated by multiplying the ranked frequency (four levels) by the ranked severity (four levels), resulting in a total score ranging from 0–16. These scores were then classified into five levels of discomfort for the back region, as follows:
Level 0 (score 0) = no discomfort;
Level 1 (score 1–2) = mild;
Level 2 (score 3–4) = moderate;
Level 3 (score 5–8) = severe;
Level 4 (score 9–16) = very severe.

2.2.2. Ergonomic Risk

The Rapid Upper Limb Assessment (RULA) tool [7] was used to assess ergonomic risk at all workstations where workers performed tasks, based on observations of their work postures. The RULA evaluates the working posture of the upper limbs (forearms, wrists), neck, trunk, and legs. Final scores were derived and categorized into four levels of ergonomic risk, as follows: level 1 (score 1–2), acceptable posture; level 2 (score 3–4), further investigation needed and changes may be required; level 3 (score 5–6), correction required as soon as possible; and level 4 (score 7), immediate implementation of changes required.
The assessment of workers’ standing and walking postures during work was conducted using the Rapid Entire Body Assessment (REBA) tool [8]. The final scores were derived and categorized into four levels of ergonomic risk, as follows: level 1 (score 1) = acceptable, level 2 (score 2–3) = moderate, level 3 (score 4–7) = high, and level 4 (score 8–11) = very high.

2.2.3. Semi-Quantitative Matrix of Health Risk Assessment for Predicted Occupational Back Pain

A health risk assessment matrix (Table 1) was created to categorize the health risk based on scores derived from multiplying the back discomfort level by the ergonomic risk level assessed using RULA or REBA. The final scores and corresponding health risk levels among the workers were categorized as follows:
Level 0 (score 0) = acceptable risk;
Level 1 (score 1–2) = low risk;
Level 2 (score 3–6) = moderate risk;
Level 3 (score 8–9) = high risk;
Level 4 (score 12–16) = very high risk.

2.2.4. Measurement of Lighting Intensity

The lighting intensity at workstations was measured using a lux meter (Extech Instruments, Nashua, NH, USA), with serial number Q431675. The equipment was approved after calibration, and the recorded measurements were corrected in accordance with the regulations of the Ministry of Labor, B.E. 2561 [16].
Lighting measurements were conducted at the workstations of electronic assembly workers during day shifts using spot measurements, in accordance with the regulations of the Ministry of Labor, Thailand [16]. The spot measurements were performed at the worker’s table or workstation, which included areas with a computer monitor and documents, as well as under a lamp or microscope. Measurements were also taken within the inner-arm and outer-arm range areas, following a three-area method [17], or at the spot where the worker’s eyes were focused while working. The results were compared to the standards outlined by the Department of Labor Protection and Welfare [18], considering the following task characteristics:
  • The tasks involving machine operation and material input/handling into machines that used elastomers, which were block molding, cutting, stamping, bending, pressing, and plastic forming, were measured and compared to the lighting intensity standard of 200–300 lux.
  • The tasks related to materials assembly, which included gluing, marking, packing, taping, and soldering, were measured and compared to the lighting intensity standard of 400–500 lux.
  • General inspection tasks involving a computer monitor or profile projector were measured by performing 1–2 spot measurements. The average of these measurements was representative of the lighting intensity at the stations where workers focused their eyes. These results were then compared to the lighting standard of 500–600 lux. In addition, inspections conducted with a lamp were measured in the inspection area and compared to the medium fine work standard of 500–600 lux.
  • Inspection with a microscope depends on the lighting intensity adjustment. The lighting intensity was compared with the standard of fine work (800 to 1000 lux) in zone 1 (the eye-focusing work zone). If the lighting intensity in zone 1 reached a value higher than 1000 lux, it meant that further measurements in zone 2 and zone 3 were carried out [17,18].
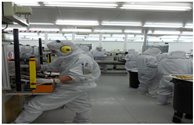
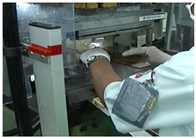
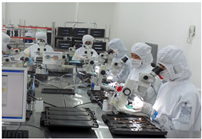
Photographic examples of tasks for each workstation (A–D) are shown in Table 2.

2.3. Statistical Analysis

STATA version 10.1 (College Station, TX, USA, 2007) was used to analyze the data. Descriptive statistics, which were minimum, maximum, number, and percentage, were used to summarize work characteristics and health risk levels. Simple linear regression and Pearson’s correlation coefficient were used to analyze the correlation between subjective and objective assessments of back pain risk levels, and the correlation between tasks and risk levels of back pain or lighting conditions.
Risk factors of predicted back pain were identified by employing inferential statistics, namely, univariate analysis and multiple logistic regression analysis. These statistics were used to find the correlation between the studied work factors and predicted back pain. All variables with a p-value < 0.20 from univariate analysis were entered into the multiple logistic regression model to calculate adjusted odds ratios (ORadj) and 95% confidence intervals (95% CI). Factors that indicated significant correlation were those with p-values < 0.05.

3. Results

3.1. Personal and Work Characteristics

Of the 354 workers, most of them were female (81.36%), aged between 20 and 29 years (63.84%), worked in an operating position (92.09%), had work experience of less than 5 years (75.71%), worked overtime greater than or equal to 3 h a day (99.70%) and worked 6 days a week (90.11%). Most of the workers were primarily responsible for product quality inspection (n = 187). The most commonly performed inspection task was inspection through a microscope (44.63%), followed by inspection under a lamp through a visual screen (15.26%). The survey found that the most commonly used types of equipment were microscopes and lamps. As a result, most employees used eye focusing to perform tasks (52.54%) and performed repetitive work in prolonged postures (83.62%). The three main postures were sitting, standing, and standing with occasional walking.

3.2. Lighting Intensity

Lighting intensity was measured at the workstations of all 354 workers, covering four different workstation types: (1) handling/lifting materials for machine input, (2) operating assembly machines, (3) inspection of products using a lamp or magnifier, and (4) inspection of products using a microscope. The results showed that 36.44% of workstations did not meet the lighting standards of the Thai Ministry of Labor, regardless of the type of task performed (Table 2).
Regarding the types of work, the highest proportion of workstations that failed to meet the lighting standards of the Ministry of Labor were those used for inspection using a microscope (76.52%). This type of work requires adequate lighting at the primary focal point under the microscope (zone 1) and in the surrounding areas within the inner-arm range and outer-arm range (zone 2 or zone 3), where workers have to hold the workpiece or device. The second most inadequate lighting intensity was found at workstations used for handling and lifting materials for machine input (35.85%).

3.3. Workload and Ergonomic Risk

The results showed that the tasks involved a relatively high workload, with 60.73% of jobs requiring skill or expertise. However, most of the workers had relatively low decision-making control over all tasks (n = 202). Nearly all workers (99.70%) worked more than 8 h a day. Ergonomic risk, as calculated using the RULA, indicated that most workers were at high risk (level 3), which required prompt ergonomic intervention (47.46%), followed by moderate risk (level 2, 42.37%) and very high risk (level 4), which required immediate correction (10.17%). When considering the nature of work, it was found that 71.70% of employees who picked up workpieces for machine input were exposed to a high level of risk (see Table 3). There was a significant association between high ergonomic risk levels and the four different tasks, i.e., handling/lifting materials for machine input, part assembly with machine control, inspection under a lamp, and inspection under a microscope (p-value < 0.05), as shown in Table 3.
REBA was used to assess workers who alternated between standing and walking while operating machines (n = 56). The assessment indicated medium risk in 51.8% of cases, high risk in 35.7%, and very high risk in 8.9% of working postures. These risk levels showed a significant linear association with the RULA scores. The highest-risk postures were associated with handling and lifting materials for machine input, as shown by the RULA.

3.4. Potential Health Risk of Predicted Back Pain

Among the 354 workers, 266 (75.14%) reported back discomfort at varying levels of severity. Of these, 221 workers (62.43%) reported discomfort at a moderate level of severity.
Based on the predicted back pain assessment using the semi-quantitative risk matrix (5 × 4), which is composed of four levels of ergonomics risk and five levels of back discomfort severity (including asymptomatic persons, as shown in Table 4), it was found that the highest proportion of workers were at a moderate level of risk (176 workers, 48.58%), followed by those at a low risk level (129 workers, 37.56%), high risk level (36 workers, 10.16%), and very high risk level (13 workers, 3.67%), respectively. The health risk levels derived from this matrix showed a strong linear correlation with back discomfort levels, with a high correlation coefficient (r = 0.810). Linear regression analysis also revealed a significant correlation between the semi-quantitative risk levels and ergonomic risk levels (p-value < 0.001), with a correlation coefficient of r = 0.456. Additionally, having an inappropriate workstation (defined as an uncomfortable workstation height and limited workspace), performing manual lifting tasks, and engaging in eye-focusing tasks were all significantly correlated with predicted risk levels for back pain, as shown in Table 5.

3.5. Factors Correlated with Predicted Back Pain According to Multiple Logistic Regression Analysis

For risk factor analysis, the health risk matrix indicated that 13.83% of workers were classified as having a high to very high risk of predicted back pain. In the univariate analysis, the occupational factors that significantly correlated with a high risk of predicted back pain were eye-focusing tasks, inappropriate workstation, manual lifting, overtime work, and high workload, as shown in Table 6.
After adjusting for confounding variables in the model, the factors significantly associated with a high risk of predicted back pain were shift work (ORadj = 2.21; 95% CI = 1.11–4.40), manual lifting (ORadj = 2.48; 95% CI = 1.13–5.44), and an inappropriate workstation (ORadj = 3.45; 95% CI = 1.42–8.42). The data are presented in Table 7.

4. Discussion

4.1. Occupational Health Risk of Predicted Back Pain

Most of the workers in this study were female, worked in operating positions, and were primarily responsible for product inspection in the electronics assembly industry. The most frequently performed inspection task was inspection through a microscope. As a result, many workers engaged in prolonged eye focusing and repetitive work in static postures, either sitting or standing, for extended periods. Ergonomic risk assessments showed that most workers were at a high risk of musculoskeletal issues. The highest risk levels were observed among workers whose tasks involved picking up workpieces and manually handling or lifting materials for machine input. Three main postures were identified for the specific task of each individual, i.e., sitting, standing, and a combination of standing and occasional walking. These combination postures of workers who picked up workpieces for machine input manually were significantly associated with high ergonomic risk levels, which is consistent with previous findings on ergonomic risks among electronics industry workers [6,12]. The ergonomic risk was reliably confirmed by the analyses using RULA by REBA for the multitasking (combined) posture identified in this study and the previous report [12].
Back discomfort of varying severity and frequency was a common complaint among workers. The prevalence of medium-level back discomfort was 58.47%, which is consistent with findings from a previous study of sewing workers in Shanghai, China [19]. An investigation on the occupational health risk of back pain, assessed using the semi-quantitative risk matrix, showed that most workers were at a potential risk ranging from moderate to very high levels. The health risk level was linearly correlated with both the severity of back discomfort and ergonomic risk levels. These findings are consistent with a previous study on industrial potato-chip workers, which found that most workers were at moderate to high risk levels [13].

4.2. Factors Correlated with Back Pain

4.2.1. Personal Factors

Although this study did not find any significant correlation between personal factors and back pain risk among electronic workers, many previous studies have reported such associations. Less work experience has been linked to a higher risk of back pain [19], and chronic diseases have been associated with MSDs in electronic workers [6]. However, those studies focused on chronic diseases, while our study aimed to develop a predictive model of back pain risk. Therefore, although not directly assessed in our analysis, exercise—which has previously been found to be correlated with back pain [12]—could be recommended as a preventive measure.

4.2.2. Work Characteristics and Work Stress Factor

High workload was found to be associated with higher risk levels of back pain among electronic workers in this study. While their tasks required practical skills, workers reported having low levels of decision-making authority in their tasks. This finding aligns with previous research, which showed that high workload was significantly correlated with neck, shoulder, and back pain [20]. It has also been found that high workload and low work control cause stress, which is a recognized risk factor for musculoskeletal disorders (MSDs) [5,6]. Moreover, high workload has been reported as a risk factor for MSDs in another study [21]. This study confirms once again the correlation between high workload and predicted back pain, as evaluated through risk assessment. A meta-analysis of 40 studies involving various groups of workers found a significant association between shift work and low back pain in healthcare workers (OR = 1.4, 95% CI = 1.2–1.63). This association was particularly evident among night shift workers (OR = 1.49, 95% CI = 1.24–1.82) [22]. Our study also identified that shift work was a significant risk factor for back pain.

4.2.3. Work Environment and Ergonomic Factors

This study found that inappropriate seating or workspace was significantly correlated with a high risk of back pain. This finding supports previous reports on environmental risk factors for WMSDs [23] and low back pain among electronics workers [6].
The measurement of light intensity revealed that most areas not meeting the standards of the Ministry of Labor [18] were those used for inspection with a microscope. Poor lighting at workstations had a statistically significant correlation with specific tasks. For tasks involving inspection under a microscope, the work requires an especially high intensity of lighting, which might create a contrast between the lighting at the focusing point (zone 1) and the surrounding areas, where the worker has to hold the workpiece or device in the arm range area. The method of measurement, which involved three working areas, revealed that the lighting intensity in the outer-arm range did not meet the required standards. A previous study had shown that lighting levels lower than the standard had a statistically significant correlation with upper limb disorders among hospital workers [24] and can cause stress at work [25]. This is a warning sign that exposure to inappropriate working environment conditions could play a role in long-term MSDs [6]. Implementation by workstation improvements with sufficient lighting could reduce musculoskeletal complaints and increase productivity, as previously reported [26,27,28].
In this study, it was found that eye focusing and working in an inappropriate environment were factors significantly associated with the risk level of back pain. Workers engaged in eye-focusing work had a significantly higher risk of back pain development compared to those who did not perform such work. Moreover, repetitive work posture and limited workspace were found to be causes of musculoskeletal disorders, including those of the shoulders, wrists, and lower back, in a previous study of electronics workers in Malaysia [23].
Prolonged standing has been found to cause back pain in electronic workers [6], which is consistent with another study that identified it as a cause of musculoskeletal disorders in the lower back, wrists/hands, and neck [29]. Forceful and repetitive hand and arm movements combined with a standing work posture might cause musculoskeletal disorders in the long term [29]. Working postures that require frequent neck twisting and bending throughout the working period, along with the need to complete tasks quickly, can cause neck pain. Workers who frequently move their necks and heads are at a higher risk than those who do not. Additionally, workers who need to work quickly are at a higher risk than those who do not have to work fast [21].
This study found that handling heavy materials and the frequency of lifting were more significantly correlated with a higher risk of back pain than tasks without manual handling. This is consistent with a study that found that handling or lifting workpieces, as well as pushing or pulling workpieces for 4 h or more, could lead to musculoskeletal disorders of the hands, wrists, back, lower legs, shoulders, upper legs, and neck [4,30].
It is important to consider the current findings in the context of a cross-sectional study using RULA or REBA as ergonomic risk assessment tools. It should be noted that the data used in the semi-quantitative risk matrix were based on workers’ self-assessments of back discomfort and observed ergonomic risks at different levels, as assessed by RULA or REBA. Therefore, other specific ergonomic risk assessment techniques could be applied in the matrix in future studies of MSD risk assessment [31,32] and implementation of ergonomics principles for improvement in work environments and MSD prevention [33]. Despite this limitation, the present study identified risk factors significantly correlated with predicted back pain through multiple logistic regression analysis, which are useful for guiding ergonomic intervention strategies. A recommendation for further research is to use a cohort study design to identify new cases of back pain and examine the predicted risk factors over time. In addition, other specified ergonomic risk assessment techniques could be applied in subsequent studies.

5. Conclusions

The application of the semi-quantitative risk matrix in this study indicates that 13.83% of workers are at high risk for occupational back pain. RULA and REBA indicated high to very high ergonomic risk, which means that changes must be implemented soon at electronic workstations, particularly for workers involved in tasks such as picking up and placing workpieces into machines (71.70%). Lighting intensity at the material handling station (35.85%) and at the inspection stations using a microscope (76.52%) did not meet the required lighting standards. Inappropriate workstations, manual lifting tasks, and eye-focusing tasks were correlated with the risk levels of back pain. Multiple logistic regression analysis identified shift work, manual lifting, and inappropriate workstations as significant risk factors associated with predicted cases of back pain. The identification of risk factors could be useful for implementing ergonomic interventions and for guiding health surveillance programs aimed at preventing back pain among electronics workers. Improvement of workstations to create a more suitable work environment, such as reducing heavy loads with supported instruments, ensuring sufficient lighting according to occupational standards, and managing ergonomics through work rotations and scheduled breaks during shift work, can help mitigate these risks.

Author Contributions

Conceptualisation, S.C.; methodology, S.C.; validation, S.C. and P.S.; formal analysis, P.S.; investigation, S.C. and P.S.; data curation, P.S.; writing—original draft preparation, S.C.; writing—review and editing, S.C. and P.S.; visualisation, S.C.; project administration, S.C.; funding acquisition, S.C. All authors have read and agreed to the published version of the manuscript.

Funding

This research received no external funding.

Institutional Review Board Statement

The study was conducted in accordance with the Declaration of Helsinki and approved by the Institutional Human Research Ethics Committee of Khon Kaen University (protocol code HE 582213 and date of approval 1 September 2015).

Informed Consent Statement

Informed consent was obtained from all subjects involved in the study before participation.

Data Availability Statement

Data will be made available upon request due to privacy or ethical restrictions.

Conflicts of Interest

The authors declare no conflicts of interest.

References

  1. Meisha, D.E.; Alsharqawi, N.S.; Samarah, A.A.; Al-Ghamdi, M.Y. Prevalence of work-related musculoskeletal disorders and ergonomic practice among dentists in Jeddah, Saudi Arabia. Clin. Cosmet. Investig. Dent. 2019, 11, 171–179. [Google Scholar] [CrossRef]
  2. Social Security Office. Compensation Fund Statistics. 2024. Available online: https://www.sso.go.th/wpr/main/privilege (accessed on 12 December 2024).
  3. Health Data Center. Ministry of Public Health. Occupational Diseases 2024. Available online: https://hdc.moph.go.th/center/public/search (accessed on 12 December 2024).
  4. Yang, F.; Di, N.; Guo, W.W.; Ding, W.B.; Jia, N.; Zhang, H.; Li, D.; Wang, D.; Wang, R.; Zhang, D.; et al. The prevalence and risk factors of work-related musculoskeletal disorders among electronics manufacturing workers: A cross-sectional analytical study in China. BMC Public Health 2023, 23, 10. [Google Scholar] [CrossRef]
  5. Inoue, G.; Uchida, K.; Miyagi, M.; Saito, W.; Nakazawa, T.; Imura, T.; Shirasawa, E.; Akazawa, T.; Orita, S.; Inage, K.; et al. Occupational characteristics of low back pain among standing workers in a Japanese manufacturing company. Workplace Health Saf. 2020, 68, 13–23. [Google Scholar] [CrossRef] [PubMed]
  6. Chaiklieng, S.; Suggaravetsiri, P. Low back pain (LBP) incidence, ergonomics risk and workers’ characteristics in relations to lbp in electronics assembly manufacturing. Ind. J. Occup. Environ. Med. 2020, 24, 183–187. [Google Scholar] [CrossRef] [PubMed]
  7. McAtamney, L.; Corlett, E.N. RULA: A survey method for the investigation of work-related upper limb disorders. Appl. Ergon. 1993, 24, 91–99. [Google Scholar] [CrossRef]
  8. Hignett, S.; McAtamney, L. Rapid Entire Body Assessment (REBA). Appl. Ergon. 2000, 31, 201–205. [Google Scholar] [CrossRef] [PubMed]
  9. Kee, D. Comparison of OWAS, RULA and REBA for assessing potential work-related musculoskeletal disorders. Int. J. Ind. Ergon. 2021, 83, 103140. [Google Scholar] [CrossRef]
  10. Kee, D.; Na, S.; Chung, M.K. Comparison of the ovako working posture analysis system, rapid upper limb assessment, and rapid entire body assessment based on the maximum holding times. Int. J. Ind. Ergon. 2020, 77, 102943. [Google Scholar] [CrossRef]
  11. Chee, H.L.; Rampal, K.G.; Chandrasakaran, A. Ergonomic risk factors of work processes in the semiconductor industry in Peninsular Malaysia. Ind. Health 2004, 42, 373–381. [Google Scholar] [CrossRef]
  12. Chaiklieng, S.; Suggaravetsiri, P.; Pruktharathikul, V. Risk factors for developing occupational back pain in electronics industry workers: A cross-sectional study. Safety 2024, 10, 90. [Google Scholar] [CrossRef]
  13. Chaiklieng, S. Health risk assessment on musculoskeletal disorders among potato-chip processing workers. PLoS ONE 2019, 14, e0224980. [Google Scholar] [CrossRef]
  14. Hsieh, F.Y.; Bloch, D.A.; Larsen, M.D. A simple method of sample size calculation for linear and logistic regression. Stat. Med. 1998, 17, 1623–1634. [Google Scholar] [CrossRef]
  15. Widanarko, B.; Legg, S.; Devereux, J.; Stevenson, M. Gender differences in work related risk factor associated with low back pain symptoms. Ergonomic 2012, 55, 327–342. [Google Scholar] [CrossRef]
  16. Department of Labor Protection and Welfare, Ministry of Labor, Thailand. Notification of Rules, Procedures of Measurement and Condition Analysis, Analysis of Working Condition Related Hot, Light or Noise Including Period and Type of Business that Must Be Performed B.E. 2561 (A.D.2018); Royal That Gazette; 2018; Volume 135, p. 11, Special Episode 57. Available online: https://ratchakitcha.soc.go.th/documents/2135198.pdf (accessed on 28 October 2025).
  17. Chaiklieng, S. Lighting intensity monitoring at inspection workstations in electronics assembly and manufacturing. Univ. J. Public Health 2023, 11, 954–960. [Google Scholar] [CrossRef]
  18. Department of Labor Protection and Welfare, Ministry of Labor, Thailand. Notification of Light Intensity Standard, B.E.2561 (A.D.2018); Royal Thai Gazette; 2018; Volume 135, p. 15, Special Episode 39. Available online: https://ratchakitcha.soc.go.th./pdf (accessed on 21 February 2018).
  19. Kezhi, J.; Gary, S.S.; Theodore, C.K. Prevalence of low back pain in three occupational groups in Shanghai, people’s Republic of China. J. Saf. Res. 2004, 35, 23–28. [Google Scholar] [CrossRef]
  20. Maimaiti, N.; Wanga, J.; Jin, X.; Wang, S.; Qin, D.; He, L.; Wang, F.; Zhang, Z.; Forsman, M.; Yang, L.; et al. Cervical musculoskeletal disorders and their relationships with personal and work-related factors among electronic assembly workers. J. Saf. Res. 2019, 71, 79–85. [Google Scholar] [CrossRef] [PubMed]
  21. Hashempour, F.; Abarghouei, N.S. Evaluation, identification & control of ergonomic risk factors in electronics companies (case study engineering company Behpajooh). J. Ergon. 2018, 5, 1–8. [Google Scholar] [CrossRef]
  22. Chen, H.-M.; Huang, P.-Y.; Chuang, H.-Y.; Wang, C.-L.; Yang, C.-C.; Huang, P.-J.; Ho, C.-K. Association of low back pain with shift work: A meta-analysis. Int. J. Environ. Res. Public Health 2023, 20, 918. [Google Scholar] [CrossRef]
  23. Yahya, N.M.; Zahi, Z.M.N. Work-related musculoskeletal disorders (WMSDs) risk assessment at core assembly production of electronic components manufacturing company. IOP Conf. Ser. Mater. Sci. Eng. 2018, 319, 012036. [Google Scholar] [CrossRef]
  24. Magnavita, N.; Elovainio, M.; De Nardis, I.; Heponiemi, T.; Bergamaschi, A. Environmental discomfort and musculoskeletal disorders. Occup. Med. 2011, 3, 196–201. [Google Scholar] [CrossRef]
  25. Idkhan, A.M.; Baharuddin, F.R. Comfort temperature and lighting intensity: Ergonomics of laboratory room machine tools. Int. J. Environ. Eng. Educ. 2019, 1, 53–58. [Google Scholar] [CrossRef]
  26. Wulandari, S.; Hasan, M. Evaluation of ergonomic risk factors in pcb soldering workstations. J. Ind. Technol. Manag. 2022, 13, 292–299. [Google Scholar] [CrossRef]
  27. Setiawan, A.; Utami, P.; Wijono, S. Anthropometric Analysis and Workstation Design for Female Workers in the Electronics Industry. J. Ind. Eng. Res. 2022, 16, 132–138. [Google Scholar]
  28. Nasution, W.I.A.; Chaniago, S.N.; Tambunan, R.F.; Hasibuan, A. Evaluation of ergonomic risk factors in electronics factory and its impact on productivity: Literature study. J. Adv. Multidiscip. Stud. (JAMS) 2025, 1, 186–194. [Google Scholar]
  29. Kee, D.; Kamalinia, M.; Oliaee, M.; Daneshmandi, H. An ergonomic intervention to relieve musculoskeletal symptoms of assembly line workers at an electronic parts manufacturer in Iran. Work 2018, 61, 515–521. [Google Scholar] [CrossRef]
  30. Rampal, K.; Chee, H.L. The prevalence of musculoskeletal problems and risk factors among women assembly workers in the semiconductor industry. Med. J. Malays. 2013, 58, 657–666. [Google Scholar]
  31. Yazdanirad, S.; Khoshakhlagh, A.H.; Habibi, E.; Zare, A.; Zeinodini, M.; Dehghani, F. Comparing the effectiveness of three ergonomic risk assessment methods-RULA, LUBA, and NERPA-to predict the upper extremity musculoskeletal disorders. Ind. J. Occup. Environ. Med. 2018, 22, 17–21. [Google Scholar] [CrossRef]
  32. Tidaoon, P.; Chaiklieng, S. Health risk predicted matrix of MSDs risk assessment in electronic industrial workers of winding process. Ind. J. Occup. Environ. Med. 2025, 29, 124–129. [Google Scholar] [CrossRef]
  33. Hussain, F.; Uzair, M.; Islam, M.A.; Shafiq, M. Implementation of ergonomics and lean manufacturing principles to improve work environment and performance of soccer ball production line. J. Appl. Res. Technol. Eng. 2024, 5, 13–22. [Google Scholar] [CrossRef]
Table 1. Semi-quantitative health risk assessment matrix for predicted back pain.
Back Pain RiskLevel of Ergonomic Risk
1234
Level of back discomfort4481216
336912
22468
11234
0001 *2 *
Applied from Chaiklieng S. (2019) [13] * notice low risk of back pain when workers rated no discomfort, and RULA or REBA indicated high to very high risk. The background colors red, orange, yellow, green, and light green correspond to very high, high, moderate, low and acceptable risk levels, respectively.
Table 2. Lighting intensity at different types of workstations (n = 354).
WorkstationExample TasknMeet the Standard
n (%)
Poor Lighting
n (%)
A. Handling materials for machine input and operationSafety 11 00104 i0015334 (64.15)19 (35.85)
B. Operating a machine for assemblySafety 11 00104 i002114103 (90.35)11 (9.65)
C. Inspection of products using a lamp/magnifierSafety 11 00104 i0037261 (84.72)11 (15.28)
D. Inspection of products using a microscope Safety 11 00104 i00411527 (23.48)88 (76.52)
Total 354225 (63.56)129 (36.44)
Remark: There were significant associations (p-value < 0.001) between different kinds of workstations and whether they met the standard requirements of lighting intensity.
Table 3. Postural risk assessed by RULA at different types of workstations (n = 354).
WorkstationErgonomic Risk Levels [Number (%)]
12343–4
Handling materials for machine input and operation015 (28.30)21 (39.62)17 (32.08)38 (71.70) 1
Operating a machine for assembly056 (49.12)48 (42.11)10 (8.77)58 (50.88)
Inspection of products using a lamp/magnifier024 (33.33)42 (58.33) 6 (8.33)48 (66.66) 2
Inspection of products using a microscope055 (47.83)57 (49.57) 3 (2.61)60 (52.18) 3
Remark: Significant associations were found at p-value = 0.001 between different kinds of workstations and ergonomic risk levels by Pearson’s chi-square test. 1, 2, 3 represent the first-, second-, and third-highest rankings in the number (%) of workers at risk, respectively.
Table 4. Occupational health risk in predicting back pain among electronics workers.
Back Pain Risk Ergonomic Risk Level; n (%)Total
1234
Back discomfort405 (1.41)5 (1.41)4 (1.13)14 (3.95)
3014 (3.95)18 (5.08)4 (1.13)36 (10.17)
2048 (12.42)52 (14.69)13 (3.67)113 (31.92)
1083 (24.57)47 (13.28)15 (4.24)145 (40.09)
00046 (12.99)046 (12.99)
Remark: The background colors red, orange, yellow, and green correspond to very high, high, moderate, and low risk levels, respectively.
Table 5. Associations of eye-focusing task, manual lifting, and inappropriate workstation with risk levels of predicted back pain (n = 354).
Occupational FactorRisk Level of Predicted Back Pain (n, %)p-Value
1234
Position 0.584
   Leader/Supervisor3 (33.33)6 (66.67)0 (0.0)0 (0.0)
   Operator130 (37.68)166 (48.12)36 (10.43)13 (3.77)
Eye-focusing task 0.003 *
   No58 (34.52)96 (57.14)12 (7.14)2 (1.19)
   Yes75 (40.32)76 (40.86)24 (12.90)11 (5.91)
Manual lifting 0.001 *
   No88 (37.13)127 (53.59)18 (7.59)4 (1.69)
   Yes45 (38.46)45 (38.46)18 (15.38)9 (7.69)
Workstation 0.020 *
   Appropriate120 (37.62)160 (50.16)30 (9.40)9 (2.82)
   Inappropriate13 (37.14)12 (34.29)6 (17.14)4 (11.43)
* Significant at p-value < 0.05.
Table 6. Personal and occupational factors correlated with high and low risk of predicted back pain assessed by univariate analysis (n = 354).
FactorPredicted Back Pain; [n (%)]OR (95% CI)p-Value
High RiskLow Risk
Gender
 Female12 (18.18)54 (81.82)1.50 (0.74–3.08)0.260
 Male37 (12.85)251 (81.15)
Age
 ≥30 years22 (18.33)98 (81.67)1.72 (0.93–3.17)0.082
 <30 years27 (11.54)207 (88.46)
Work experience
 <5 years27 (16.46)137 (83.54)1.50 (0.82–2.76)0.186
 ≥5 years22 (11.58)168 (88.42)
Shift work
 Yes18 (19.15)76 (80.85)1.75 (0.93–3.31)0.085
 No 31 (11.92)229 (88.08)
Eye focusing
 Yes35 (18.82)151 (81.18)2.55 (1.31–4.92)0.005 *
 No 14 (8.33)154 (91.67)
Workstation
 Inappropriate10 (28.57)25 (71.43)2.87 (1.28–6.43)0.010 *
 Appropriate39 (12.23)280 (87.77)
Manual lifting
 Yes27 (23.08)90 (76.92)2.93 (1.59–5.42)0.001 *
 No22 (9.28)215 (90.72)
Overtime work
 No7 (31.12)15 (68.18)3.22 (1.24–8.36)0.016 *
 Yes42 (12.65)290 (87.35)
Workload
 High36 (17.56)169 (82.44)2.22 (1.14–4.37)0.020 *
 Low13 (8.72)136 (91.28)
Work control/decision making
 Low33 (16.34)169 (83.66)1.66 (0.87–3.14)0.120
 High16 (10.53)136 (89.47)
* Significant at p-value < 0.05.
Table 7. Occupational factors correlated with a high risk of predicted back pain assessed by multiple logistic regression (n = 354).
FactorPredicted Back Pain [n, (%)]ORadj (95% CI)p-Value
High RiskLow Risk
Shift work
 Yes18 (19.15)76 (80.85)2.21 (1.11–4.40)0.024 *
 No31 (11.92)229 (88.08)
Eye focusing
 Yes35 (18.82)151 (81.18)1.62 (0.71–3.66)0.250
 No14 (8.33)154 (91.67)
Manual lifting
 Yes27 (23.08)90 (76.92)2.48 (1.13–5.44)0.023 *
 No22 (9.28)215 (90.72)
Workload
 High36 (17.56)169 (82.44)1.96 (0.96–3.99)0.065
 Low13 (8.72)136 (91.28)
Workstation
 Inappropriate10 (28.57)25 (71.43)3.45 (1.42–8.42)0.006 *
 Appropriate39 (12.23)280 (87.77)
* Significant difference at p-value < 0.05; factors of gender, age, and work experience were adjusted to the model.
Disclaimer/Publisher’s Note: The statements, opinions and data contained in all publications are solely those of the individual author(s) and contributor(s) and not of MDPI and/or the editor(s). MDPI and/or the editor(s) disclaim responsibility for any injury to people or property resulting from any ideas, methods, instructions or products referred to in the content.