Article

Association by Age Groups Between Retrofitting Home Heating and Insulation and Subsequent Hospitalised Home Fall Rates: A Natural Experiment

1
He Kāinga Oranga/Housing and Health Research Programme, Department of Public Health, University of Otago, Wellington 6242, New Zealand
2
Department of Geography and the Lived Environment, University of Edinburgh, Edinburgh EH3 9EF, UK
*
Author to whom correspondence should be addressed.
Safety 2025, 11(3), 81; https://doi.org/10.3390/safety11030081
Submission received: 4 April 2025 / Revised: 26 June 2025 / Accepted: 19 August 2025 / Published: 26 August 2025

Abstract

Insulating homes has been shown to provide health benefits, but benefits for home safety have not been studied. The current study analyses hospitalised falls rates, making use of a large New Zealand cohort initially set up to study health benefits. This cohort consists of just under half a million people (n = 469,666; 53.3% female; mean age 35.7), half in an intervention group (n = 236,040; 53.6% female; mean age 36.2) who had their homes retrofitted with insulation early in the study period and half in a control group (n = 233,626; 52.9% female; mean age 35.3) with homes retrofitted later. We found that retrofitting programme was associated with changes in fall rates that varied in a non-linear way with age. Cubic splines were used to estimate a non-linear but continuous relationship between age and changes in fall rates. Although other research has indicated that home insulation and heating have a positive influence on older people’s wellbeing and ability to live independently, the current analysis indicated a safety benefit only for under-70-year-olds, not for older people; the population-wide change in fall hospitalisation rates associated with the programme estimated was null. The study highlights the importance of considering the benefits of home improvements, particularly for older people, in a holistic way that encompasses wellbeing as well as health and safety outcomes.

1. Introduction

The World Health Organization recommends minimum indoor temperatures of 18 °C [1]. Many houses in Aotearoa, New Zealand (NZ) fall short of this recommendation due to poor heating and inadequate insulation [2]. Prior to a 1977 amendment to the building code (NZS 421P: 1977), there was no requirement to insulate homes. Since then, regulations have required that new homes and renovations be insulated; however, retrofitting insulation into existing homes is at the discretion of the homeowner, apart from rental housing more recently. From 2017, rental housing has been subject to regulations requiring minimum standards of insulation and provision of a heating system [3].
To address health and energy inefficiency concerns, subsidised retrofitted home insulation was provided under two government-funded EECA WUNZ programmes (Heat Smart and Healthy Homes) between July 2009 and June 2014. Under the two schemes, depending on practicalities such as access to spaces requiring insulation, homes were provided with ceiling insulation, underfloor insulation, and top-ups of existing ceiling insulation where this was insufficient. A small number of houses (12% of all homes in the scheme) had a clean heating device also installed [4]. These were mainly (78%) heat pumps; 20% were energy efficient log burners, and the remaining 2% were wood pellet burners and flued gas heaters, and no underfloor heating was installed [4]. In a study of the same cohort as analysed in the current paper, these programmes overall were found to be associated with reduced hospital admissions for acute hospital admissions (excluding maternity and injury related hospital admissions) and cold-associated respiratory and cardiovascular diseases [4,5], consistent with the benefits found in a community randomised controlled trial of retrofitted insulation [6].
New Zealanders’ use of home heating is typically restricted to the main living area and not used to heat the home more generally. Older social housing tenants in NZ described strategies for coping with cold homes, including: wearing more clothing; staying in bed; or sleeping in the single heated room in the house [7]. In terms of the benefits of newly installed heating and insulation, UK social housing residents reported improved perceived safety generally and being less anxious specifically about falling [8]. Housing remediations leading to increased warmth have also been associated with increased usable space, increased privacy, and improved social relationships, along with reduced absences from work or school due to illness [9], lowered levels of anxiety and higher subjective wellbeing [10].
The relationship between the home environment and falls has been studied extensively. A Cochrane review summarised the research findings regarding fall injuries prevented by modifying the homes of older community-dwelling people [11]. Their meta-analysis of 12 studies internationally found that for older adults at a higher risk of having a fall, removing environmental fall hazards in the home can reduce the number of falls by 38% [11]. Included in that review was a NZ randomised controlled trial, which found a reduction in home fall injury rates for the general population (not just older people) of 26% (95% CI 6–42%) due to a package of home modifications retrofitted to homes [12]. Specifically for Māori (the Indigenous people of NZ), a randomised controlled trial of the same modifications found a 31% reduction in the rate of fall injuries at home per year [13]. Both these studies found greater safety benefits from home modification for people who had already suffered a recent home fall injury.
In contrast, we are not aware of any studies of the relationship between fall injuries and home warmth, although the relationship between outdoor temperatures and falls has received some attention. When the weather is cooler, the rate of fall injuries resulting in hip fractures for older people has been shown by Australian research to be higher [14] and higher rates of syncope (fainting—loss of consciousness for a short period of time) have also been found during winter [15]. Aetiological pathways leading to higher rates of fall injuries for older people in colder conditions feasibly include higher rates of nocturia (getting up during the night to urinate) related to colder conditions [16] and greater difficulty during colder conditions in regulation of blood pressure [17].
An indirect way that home warmth could affect fall rates is via changes in exposure, such as an increase in physical activity levels leading to increased opportunities for falls to occur [18]. Warmer indoor temperatures could feasibly lead to changed behaviours within the home that in turn change (either increase or decrease) opportunities for falls.
The current study makes use of an established natural experiment to explore the relationship between retrofitting home insulation and heating systems (under two government subsidy programmes) and outcomes in terms of fall injuries for residents, particularly how this relationship may vary with age.

2. Materials and Methods

2.1. Study Design

The retrospective cohort study using previously linked data [4] forms the basis of the current retrospective cohort study design, although the hospitalised outcomes studied are for home falls rather than for the acute hospital admissions excluding maternity and injury-related hospital admissions studied previously. The cohort studied consisted of all household members (n = 469,666) of homes (n = 174,058) that had insulation retrofitted through either of two subsidy programmes for both owner-occupied homes and rental properties (Heat Smart and Healthy Homes) between July 2009 and June 2014, with at least some time residing in one of the study addresses in both the baseline and follow-up periods (see Figure 1). Sensitivity analyses were conducted with a larger population consisting of all occupants of the study addresses, including people resident during one of the periods studied (baseline or follow-up), but not the other (totalling 994,317 people in 204,405 addresses).
Heat Smart, which started in July 2009, was available for all privately owned properties irrespective of who the occupants were. Healthy Homes, started in August 2013, was made available for all privately owned properties where at least one resident held a community service card, which is provided to people receiving government payments such as pensions, unemployment benefit, sickness benefit and full-time students. The current study used an existing address-match between the EECA WUNZ dataset of retrofitted homes (including the timing and scope of the retrofit) and encrypted national health information (NHI) numbers for residents of the addresses studied, although addresses and names were stripped from the analysis dataset so that participants could not be identified. As illustrated in Figure 1, baseline injury data were analysed for houses over a 3-year period prior to insulation being retrofitted for the intervention group. For the control group, baseline injury data were analysed for houses also over a 3-year period, but between 6 and 3 years prior to insulation being retrofitted. Follow-up rates of hospitalisations for home falls were then compared to rates for the same period post retrofit for the intervention group, or for the 3-year period prior to insulation being retrofitted for the control group. Any changes between the rates for the two periods were then compared to changes in home fall hospitalisation rates for a matched cohort of people in homes that also received the retrofit intervention, but during the subsequent 3-year period (see Figure 1). This design ensured that the two populations being compared were as similar as possible. As fall rates were compared over identical time periods for the intervention and control groups, the design also averted analytical problems in comparing rates subject to different hospitalisation admissions policies or injury coding practices, which can change over time.

2.2. Injury Outcomes and Duration of Exposure

Approximately 98% of the NZ population have address records linked to their national health information (NHI) code [19], and also have address records with the Primary Health Organisation (PHO), updated every quarter (3 months). Once a link had been made between the patient address records and the retrofitted addresses, a start date for participation in the study was taken to be the earliest PHO record linked to the retrofit address and an end date by the latest PHO record linked to the address. Hospital admissions for home fall injuries for the cohort were tracked over time and the exposure duration was set to be the length of time they were recorded as having lived at one of the retrofit addresses. Some people died during the study period and the end date for the baseline or follow-up periods was set to the date of death.
Hospitalisation data with encrypted identifiers were provided by the Ministry of Health for home fall injuries as recorded by publicly funded hospital discharges from July 2006 to June 2015 where the injury was coded as occurring at home; the activity codes included leisure activity, while resting, sleeping, eating or engaging in other vital activities, while engaged in other specified activities, during unspecified activity; the ICD-10-AM code included fall on same level from slipping, tripping, and stumbling, unspecified fall, other same level fall, fall on and from stairs and steps, fall involving bed, fall involving chair. To avoid double-counting of fall injuries, pairs of distinct admissions that happened within one day of one another were counted as single events, using an approach recommended by Langley et al. [20].

2.3. Analysis

We fitted negative binary generalised linear mixed models to the counts of falls using the SAS® (version 9.4, SAS Institute Inc., Carey, NC, USA) procedure GLIMMIX. To obtain rates of falls per unit of time, we specified an offset defined to be the log of the counts of quarters (3-month periods) representing the exposure time. The main analysis of age-related fall rates associated with the intervention involved using cubic splines to estimate a non-linear but continuous relationship between age and relative fall rates [21]. The splines are estimated using piecewise cubic polynomials to facilitate an exploration of non-linear associations being modelled: in our analysis, between age and relative fall rates. The splines enabled us to explore our main research question, which was to describe for different age groups how hospitalised fall rates might change associated with warmer indoor temperatures.
Although there were repeated measures (for different time periods) for individuals, this structure could not be accommodated specifically in the cubic spline model used as this was too demanding of the software algorithms and the computing environment (SAS generated error messages regarding excessive processing time). Extra-Poisson variation was instead accommodated more generally by negative binary models [22]. To check that this approach was reasonable and would not produce misleading standard errors, we fitted models with age terms defined as a dichotomous range rather than as splines and compared the standard errors estimates of repeated measures models with negative binary models. There was reasonable correspondence, suggesting that the negative binary models should also be adequate for setting confidence intervals in the models used that included the estimation of splines.
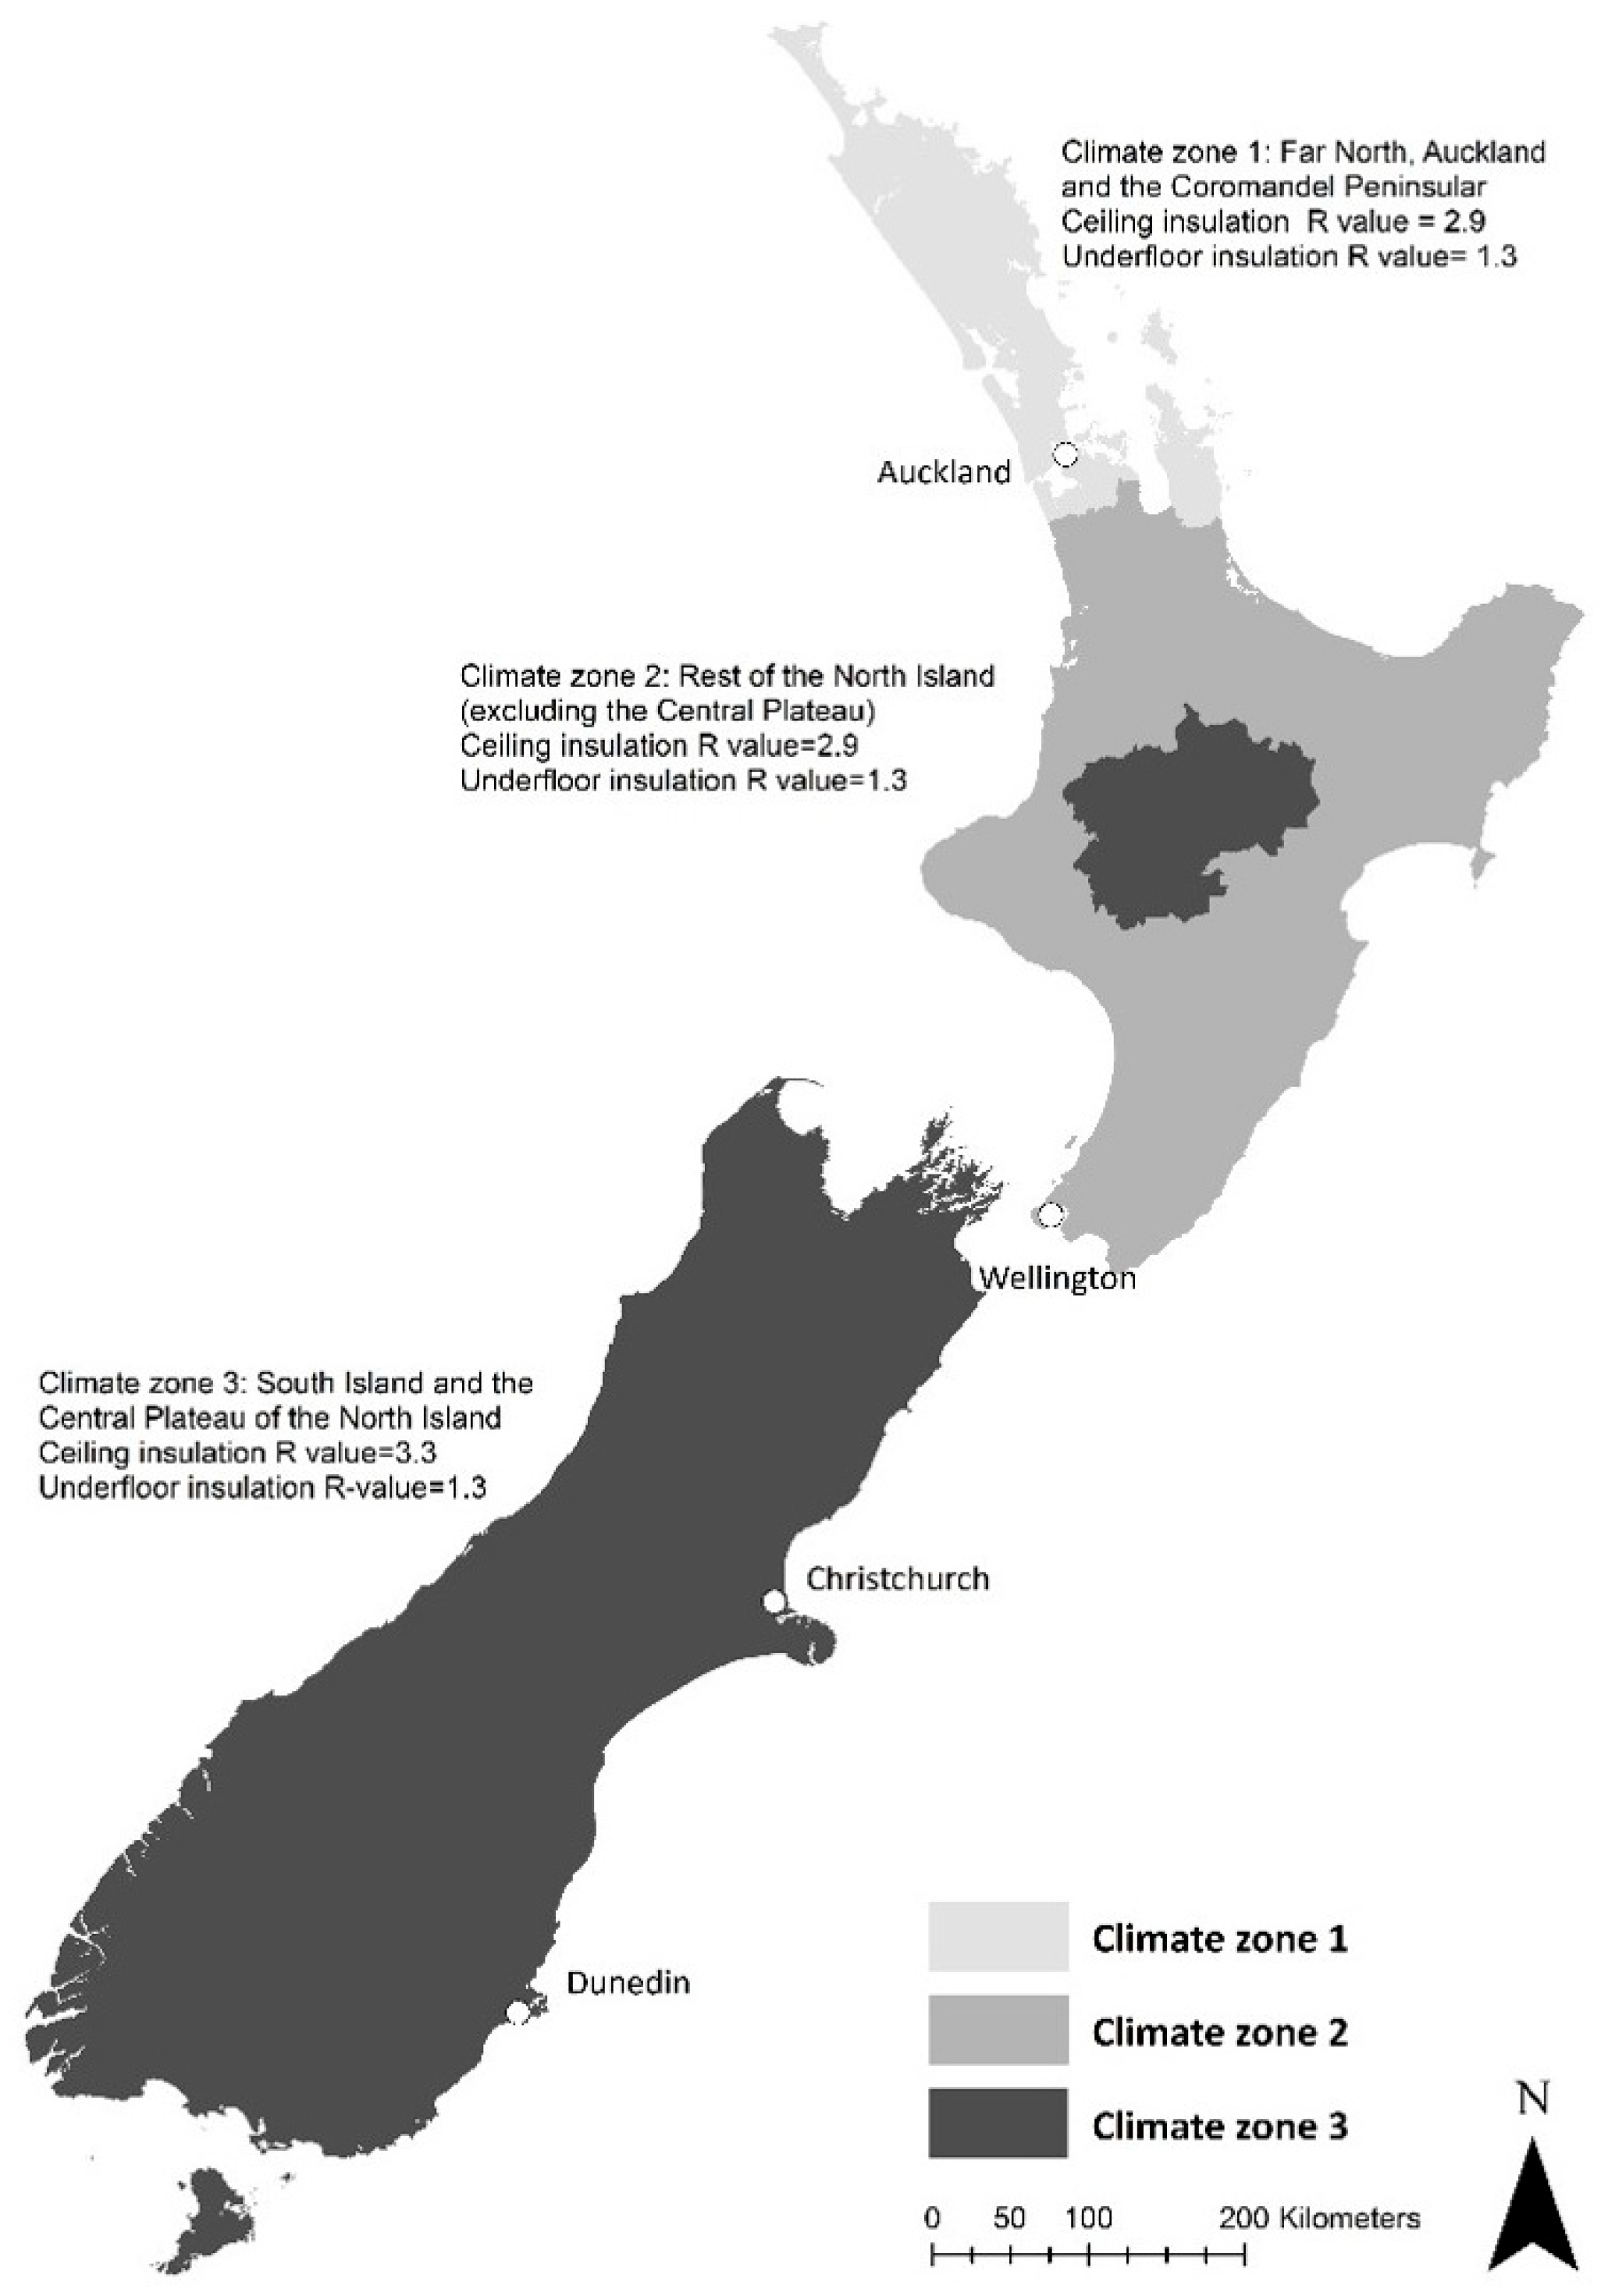
As a first step, we estimated crude relative rate ratios by estimating rate ratios (fall rate in the after period divided by fall rate in the after period) for each of the intervention and control groups and then dividing the intervention rate ratio by the control rate ratio (providing us with a difference-in-difference estimator of the association between the fall outcomes and the exposures). We classified the areas where the homes were situated using an area-level measure of level of socioeconomic deprivation (NZDep) [23]. As climate also affects thermal comfort, we classified the homes according to New Zealand’s climate zones as represented in Figure 2. The R values shown in the figure represent the thermal resistance of insulation specified by the 2007 insulation standard (New Zealand Building Code clause H1/AS1) [24] used for the insulation retrofits under the programmes.

3. Results

3.1. Crude Relative Rate Ratios

The third and fourth columns of Table 1 show the numbers of people studied who were resident in studied addresses according to group (intervention or control) for the cohort of individuals with observations in at least some of both time periods. Shown in brackets is the proportion of people with each characteristic shown. The second part of the table shows counts (and percentages) of cohort members. The table shows a generally good correspondence between the characteristics of the intervention and control groups, although the controls had a higher proportion in higher socio-economic deprivation areas and a lower proportion in the cooler climate zone of the South Island and Central Plateau of the North Island (see map of climate zones, Figure 2).
The RHS of Table 1 shows the numbers of hospital admissions for indoor falls by people at the study addresses (classified according to exposure and time period—baseline or follow-up), along with crude (unadjusted) relative rate ratios of hospitalised falls per person per year living at the exposed address, with 95% confidence intervals. These crude relative rate ratios are rate ratios (rates for follow-up divided by the rates at baseline) for the intervention group divided by the control group. As the age shown here is age at baseline, for the older age groups, the falls occurring in the follow-up period tend to be higher as the propensity to fall and liability to be injured when falling increases with advancing age beyond late middle-age. The crude relative rate ratios show no change in home fall hospitalisation rates associated with the intervention overall (0.99 with 95% CI 0.89–1.09 and 1.03 with 95% CI 0.95–1.11 for the cohort and for all residents, respectively). The relative rate ratios do show a general pattern of being lower for age under 70 and generally elevated for the older age groups.

3.2. Adjusted Relative Rate Ratios

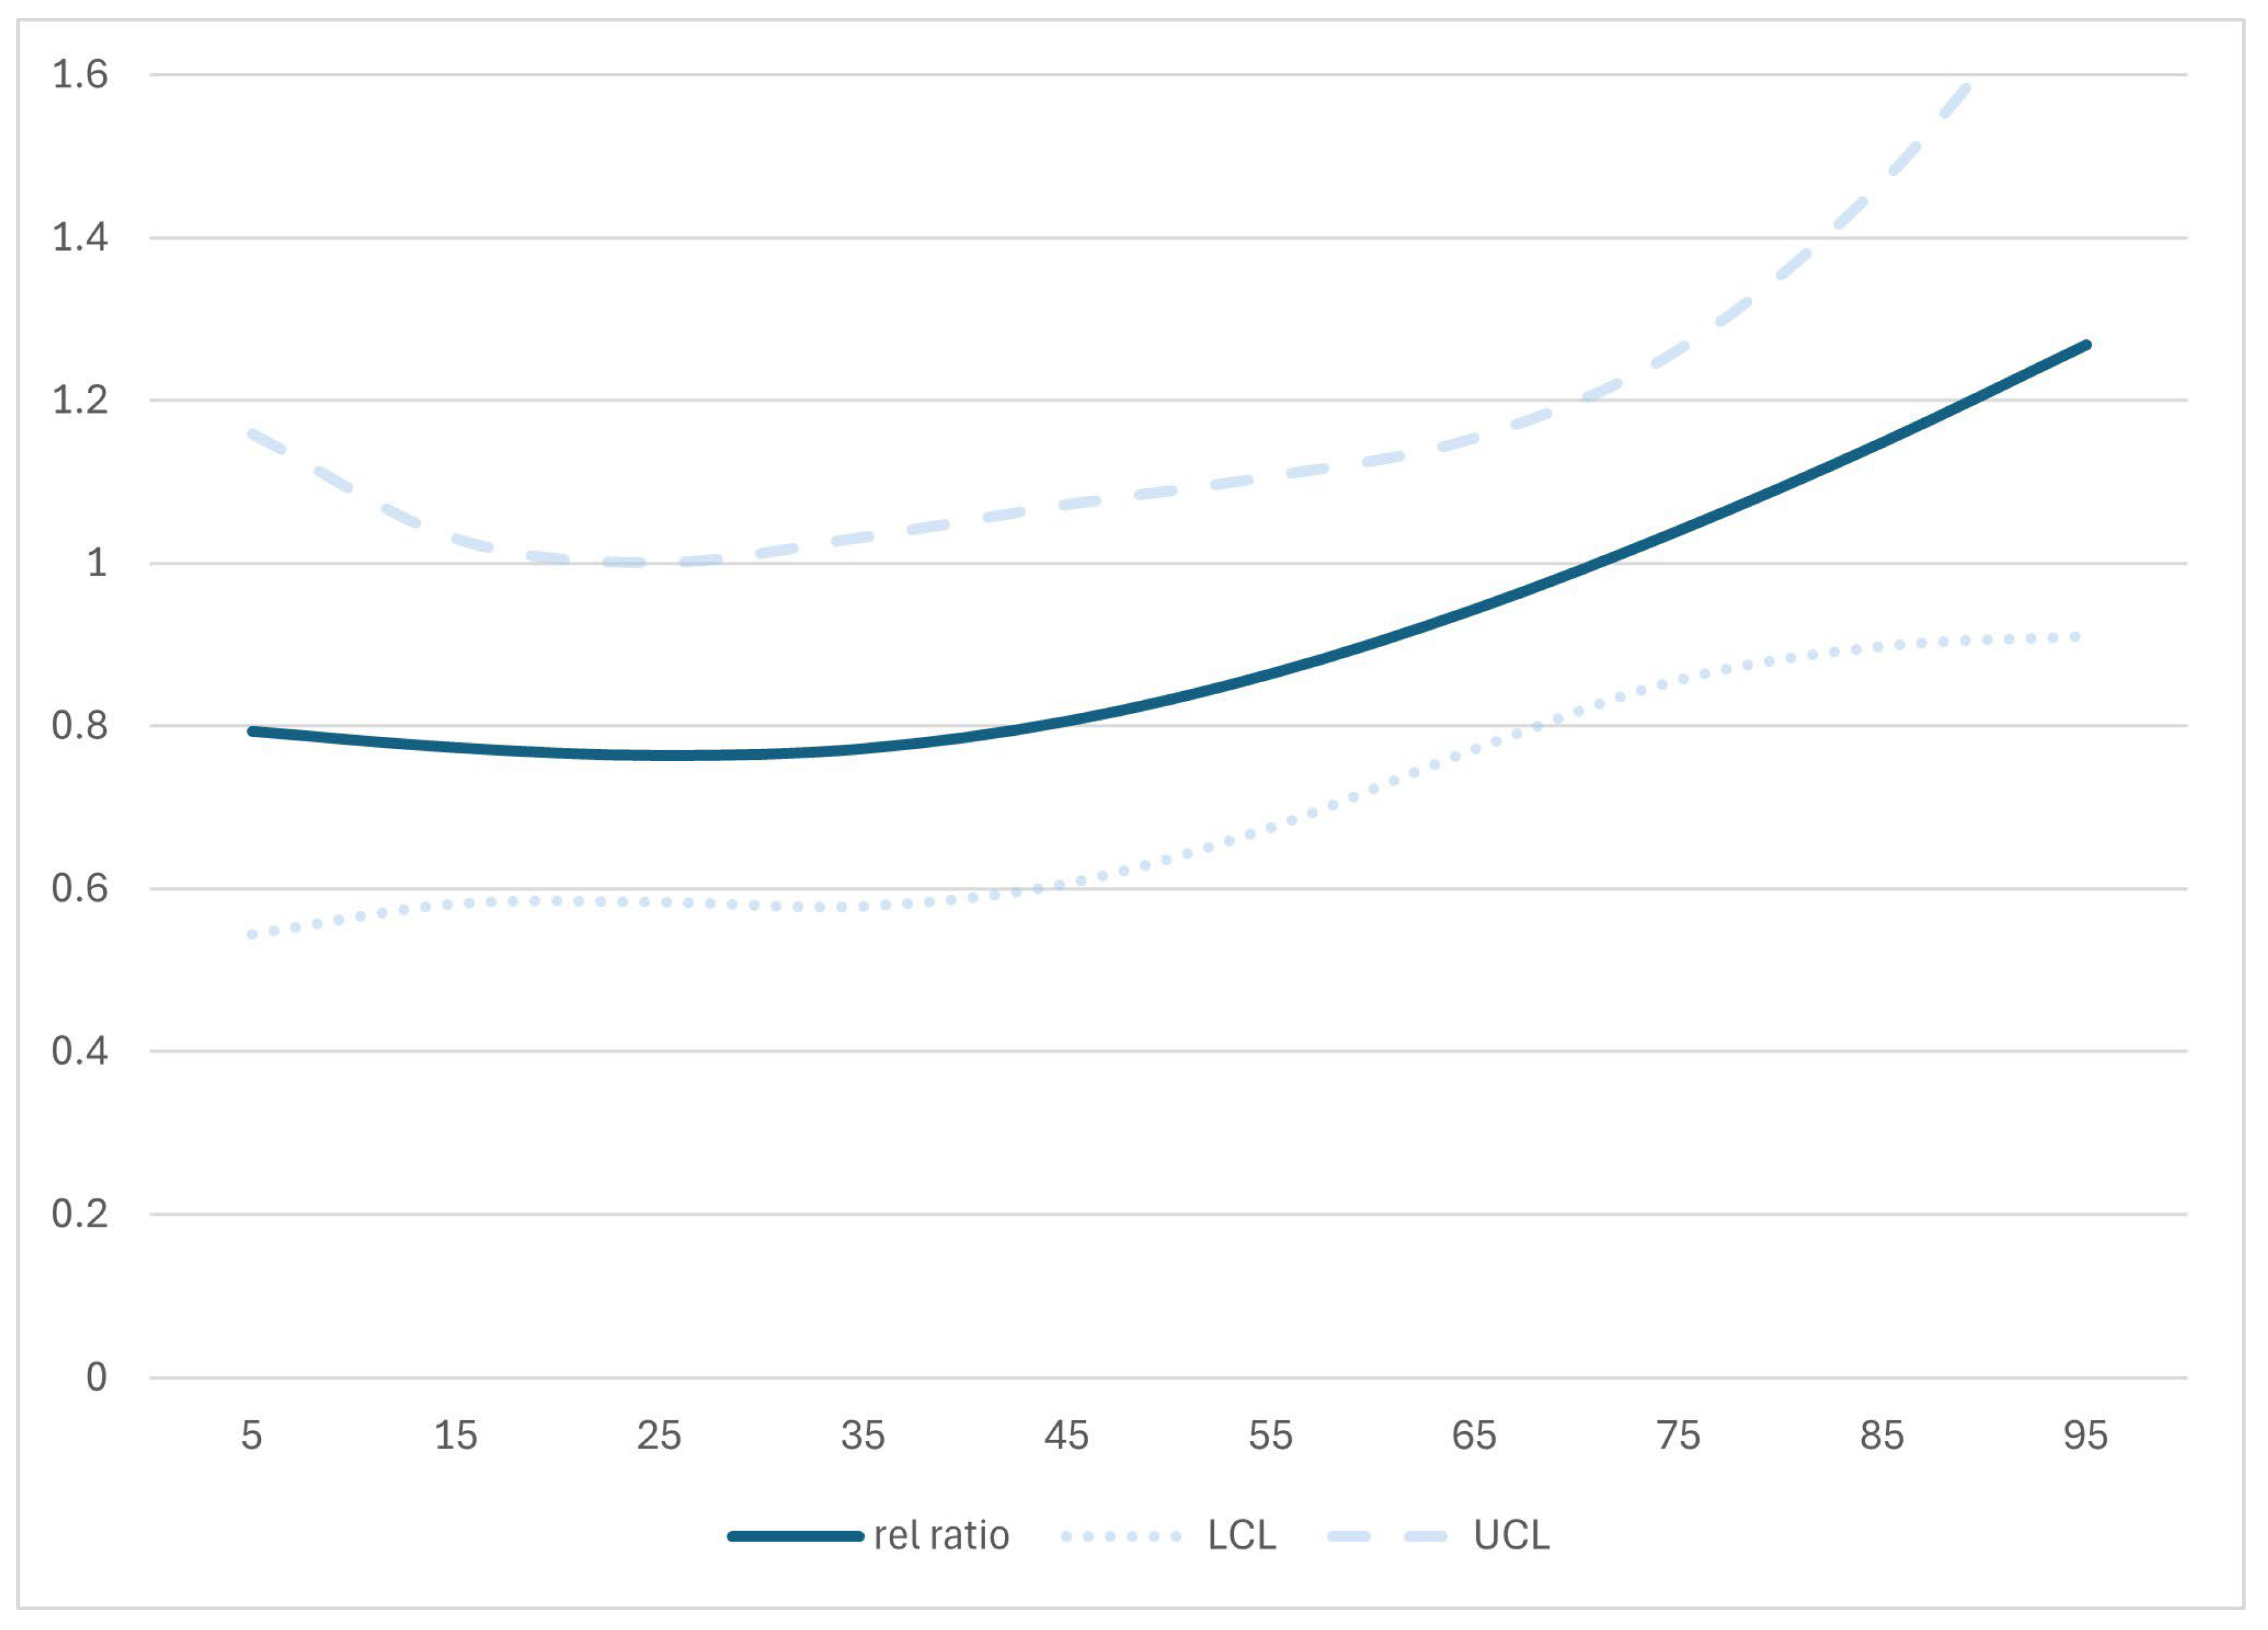
A generalised linear mixed model was fitted to the data, with factors as shown in Table 2, but with age represented as a continuous variable via cubic splines, as described above. Shown in Figure 3 are resultant estimates of relative rate ratios, with 95% CI upper and lower limits (dotted lines). Associated with the home insulation programme, Figure 3 shows generally lower rates for ages below about 75 and potentially elevated rates for older ages, although with a high degree of statistical uncertainty.
Table 2 shows estimated relative hospitalised fall rates adjusted for levels of other factors in the table, with a relative rate ratio in the final row, representing an interaction between age group and the intervention. The model applied Generalised Estimating Equations to fit a repeated measures model to the data, where repeated measures were made for each member of the cohort studied. Notable features of the table include the adjusted elevated fall rates for higher levels of (geographic area) socio-economic deprivation, elevated rates for females relative to males, elevated fall rates for climate zones 1 and 3 relative to climate zone 2 and lower fall rates for ages 0–64 relative to older people associated with the insulation programme (bottom row of the table). The fall hospitalisation relative rate ratio for people aged under 65 vs. those aged 65 and over was 0.74 with 95% CI 0.58–0.96. The crude (unadjusted) relative rate ratio for people aged under 65 was 0.81 with 95% CI 0.68–0.97, which was calculated as the follow-up rate divided by the baseline rate for the intervention cohort divided by that for the control cohort. For all age groups combined (top line of Table 1), however, the intervention was not associated with any change in fall rates (relative rate ratio overall of 0.99, 95% CI 0.89–1.09).

3.3. Sensitivity Analyses

We fitted models to the population of residents of the studied addresses without the requirement that people were resident for at least some time during both the baseline and follow-up periods. This included people who moved in or out of the addresses studied, as well as babies born during follow-up and (mainly older) people who died before the follow-up period started. Very similar results were obtained, with similarly shaped association with age as represented by Figure 3 and similar values of rate ratios for levels of each factor, as shown in Table 2.
Our analysis was of falls, excluding those whose ecodes implied the fall occurred outdoors (e.g., falls from ladders, playground equipment, etc.). The rationale for the exclusion was that warmer indoor temperatures should not affect the occurrence of outdoor falls. As expected, when these excluded falls were included in the analysis, the patterns of associations shown here did not change. This is unsurprising as the excluded falls constituted only 2% of all the home fall hospitalisations, and ranged from a maximum of 7% of all home fall hospitalisations for age group 10–19 and diminished with age to a minimum of 0.2% for ages 90 plus.

4. Discussion

This study explored the association between a programme of retrofitting insulation into homes and the hospitalised fall rates of occupants, particularly in relation to occupant age. Although we described mechanisms potentially leading to a greater safety benefit for older people, our analysis suggested a safety benefit for people younger than around 70 years of age, and potentially a disbenefit for those older, although the latter association had large statistical uncertainty.
Strengths of our analysis include coverage of a cohort of half a million people. Although the validity of natural experimental evaluations is often limited by poorly matched control groups, our analysis used a difference-in-difference approach and a control group defined to be similar to the intervention group because the control houses also benefited from an insulation retrofit scheme, although at a later date than the intervention group. Natural experiments can have the advantage of large sample sizes and a study of outcomes from real-world implementation, but compared to randomised controlled trials, natural experimental designs are subject to limitations and some of those specific to our study are listed below. Nevertheless, in many situations natural experimental studies are the only way to quantify health impacts of policies affecting large numbers of people [25], despite limitations due to the study design.
A limitation of basing our analysis on PHO records was that our measures of length of exposure relied on residents informing their family doctor of a change of address. Inaccurately timed changes of address, either into or out of a studied address would have introduced some added variability to the analysis, although this would have been unlikely to have been systematic (affecting intervention or control exposure estimates but not the other).
Another limitation is that the analysis assumed that length of exposure (time living at the address) was not affected by the intervention. The previous study looking at acute hospitalisation rates (excluding maternity and injury-related admissions) in the same cohort found statistically significant reductions of 11% in the intervention group compared to the controls [4]. Associations with reduced rates of new prescriptions of chronic respiratory disease medication indicated that chronic respiratory disease incidence was significantly lower in the intervention group at follow-up, with an odds ratio of 0.90 (95% CI: 0.86–0.94) [5]. Given these results, it is possible that, for example, older people in recently insulated homes as a result of warmer indoor temperatures and/or improved health, night have remained living independently at an address longer than they might have otherwise. Consequently, they may have had longer exposure to risk of falls while living independently than same-aged people in control homes (that were not insulated) due to improved cardiovascular health. It is also possible that the nature of exposure to fall risk and attitudes to falling could change in response to the intervention. As mentioned in the Introduction, qualitative research with older people indicates that those in better insulated and heated homes may make more use of indoor space [9] and experience lowered levels of fear of falling [8]. Reduced fear of falling and making more extensive use of indoor space are both consistent with increased wellbeing, but there is also potential for fall rates to increase as a consequence. Although we can only speculate on reasons for the increased relative rate ratios hinted at for older people in Figure 3, natural experiments can be subject to systematic effects that cannot be controlled for, even with very careful design.
Finally, the analysis presented here is exploratory. We did not have firm prior hypotheses regarding patterns of association with the insulation programme. The age dichotomisation was decided on a priori, but with an expectation that it would be the older people who might benefit most in terms of reduced fall rates, rather than the reverse association indicated here. As has been noted in numerous studies, e.g., [26], older people lack the ability to compensate for, or adapt to, adverse environmental exposures, so insulating and heating homes would be expected to provide greater health and safety benefits for older people than for younger age groups. Home environmental improvements via safety modifications show this pattern of benefit for fall injuries [11]. The current study did not find a statistically significant safety disbenefit for older people associated with the home heating and insulation programme, but the age interaction in a direction contrary to expectations deserves further research. As analysis by age groups indicated the association between the relative rate ratios and age was clearly non-linear, expressing age in terms of cubic splines was more informative than a dichotomisation as it described the non-linear nature of the association.

5. Conclusions

Energy efficiency measures, such as improved home insulation, have been shown to be highly cost beneficial. Insulating NZ houses was estimated to have a benefit–cost ratio of around two, with the benefits being mainly in the health sector, but also including energy savings, avoided days off school and work, and emission reductions [27]. An Australian modelling study estimated substantial health gains, improvements inequalities, health sector savings, and gains in productivity that would accompany the eradication of cold housing in South-eastern states of Australia [28]. Although the previous study of hospitalisation rates omitted injury hospitalisations in the cohort we studied [4], as these were thought to be aetiologically unrelated to home insulation, the current study prompts a reconsideration of this assumption, particularly if policy is being developed in a way that has different coverage for different age groups. A potential safety decrement for older people should be explored further. If, as speculated above, the insulation has a positive influence on their ability to live independently, such benefits would need to be evaluated further via qualitative interviews with older people and their families. At present, such benefits can only be speculated on. Although the current study is consistent with a safety benefit for people under 70, the considerably elevated fall hospitalisation rate for older people generally combined with a statistically non-significant increase in rates for this group means that the population-wide safety benefit associated with the programme estimated here was null.

Author Contributions

Conceptualization, all authors; methodology, M.D.K. and C.F.; formal analysis, M.D.K.; data curation, C.F. and M.D.K.; writing—original draft preparation, M.D.K.; writing—review and editing, all authors; funding acquisition, N.P., P.H.-C. and M.D.K. All authors have read and agreed to the published version of the manuscript.

Funding

The study was funded as part of a programme grant “Research to maximise the health and wellbeing gains from housing” by the Health Research Council of New Zealand (HRCNZ).

Institutional Review Board Statement

Ethical approval was provided by the University of Otago Human Ethics Committee (reference HD24/022) on 12 April 2024.

Informed Consent Statement

Participant consent was waived due to data analysis being conducted using administrative data that had been anonymized.

Data Availability Statement

Data were provided for this study on condition that we did not share individual level data with other parties.

Acknowledgments

Thanks to Lucy Telfar-Barnard for assistance in data access.

Conflicts of Interest

The authors declare no conflicts of interest. The funder had no role in the design of the study; in the collection, analyses, or interpretation of data; in the writing of the manuscript; or in the decision to publish the results.

Abbreviations

The following abbreviations are used in this manuscript:
EECA WUNZEnergy Efficiency and Conservation Authority Warm Up New Zealand scheme
PHOPrimary Health Organisation
NHINational Health Index number: a unique identifier assigned to everyone who uses health and disability support services
NZNew Zealand

References

  1. World Health Organization. WHO Housing and Health Guidelines; World Health Organization: Geneva, Switzerland, 2018. [Google Scholar]
  2. Statistics New Zealand. Housing in Aotearoa: 2020; Statistics New Zealand: Auckland, New Zealand, 2020. [Google Scholar]
  3. New Zealand Government. Healthy Homes Guarantee Act 2017; New Zealand Government: Wellington, New Zealand, 2017. [Google Scholar]
  4. Fyfe, C.; Telfar-Barnard, L.; Howden-Chapman, P.; Douwes, J. Association between home insulation and hospital admission rates: Retrospective cohort study using linked data from a national intervention programme. BMJ 2020, 371, m4571. [Google Scholar] [CrossRef]
  5. Fyfe, C.; Barnard, L.T.; Douwes, J.; Howden-Chapman, P.; Crane, J. Retrofitting home insulation reduces incidence and severity of chronic respiratory disease. Indoor Air 2022, 32, e13101. [Google Scholar] [CrossRef] [PubMed]
  6. Howden-Chapman, P.; Matheson, A.; Crane, J.; Viggers, H.; Cunningham, M.; Blakely, T.; Woodward, A.; Saville-Smith, K.; O’Dea, D.; Kennedy, M.; et al. Effect of insulating existing houses on health inequality: Cluster randomised study in the community. Br. Med. J. 2007, 334, 460–464. [Google Scholar] [CrossRef] [PubMed]
  7. O’Sullivan, K.C. Gee My Account Is in Credit! Qualitative Component of the Warm Homes Pilot Study. Unpublished Master’s Thesis. 2008. Available online: http://ourarchive.otago.ac.nz/handle/10523/367 (accessed on 15 April 2025).
  8. Sowden, S.; White, M. High-rise health: A qualitative study of the effect of social housing improvements on the health and wellbeing of residents in high-rise flats. Lancet 2014, 384, S76. [Google Scholar] [CrossRef]
  9. Thomson, H.; Thomas, S.; Sellstrom, E.; Petticrew, M. Housing improvements for health and associated socio-economic outcomes. Cochrane Database Syst. Rev. 2013, 28, CD008657. [Google Scholar] [CrossRef]
  10. Sawyer, A.; Sherriff, N.; Bishop, D.; Darking, M.; Huber, J.W. “It’s changed my life not to have the continual worry of being warm”—Health and wellbeing impacts of a local fuel poverty programme: A mixed-methods evaluation. BMC Public Health 2022, 22, 786. [Google Scholar] [CrossRef]
  11. Clemson, L.; Stark, S.; Pighills, A.C.; Fairhall, N.J.; Lamb, S.E.; Ali, J.; Sherrington, C. Environmental interventions for preventing falls in older people living in the community. Cochrane Database Syst. Rev. 2023, 3, CD013258. [Google Scholar] [CrossRef]
  12. Keall, M.D.; Pierse, N.; Howden-Chapman, P.; Cunningham, C.; Cunningham, M.; Guria, J.; Baker, M.G. Home modifications to reduce injuries from falls in the home injury prevention intervention (HIPI) study: A cluster-randomised controlled trial. Lancet 2015, 385, 231–238. [Google Scholar] [CrossRef]
  13. Keall, M.D.; Tupara, H.; Pierse, N.; Wilkie, M.; Baker, M.G.; Howden-Chapman, P.; Cunningham, C. Home modifications to prevent home fall injuries in houses with Maori occupants (MHIPI): A randomised controlled trial. Lancet Public Health 2021, 6, e631–e640. [Google Scholar] [CrossRef]
  14. Turner, R.; Hayen, A.; Dunsmuir, W.; Finch, C.F. Air temperature and the incidence of fall-related hip fracture hospitalisations in older people. Osteoporos. Int. 2011, 22, 1183–1189. [Google Scholar] [CrossRef]
  15. Du Fay De Lavallaz, J.; Badertscher, P.; Nestelberger, T.; Flores, D.; Miró, Ò.; Salgado, E.; Geigy, N.; Christ, M.; Cullen, L.; Than, M. Circadian, weekly, seasonal, and temperature-dependent patterns of syncope aetiology in patients at increased risk of cardiac syncope. Ep Eur. 2019, 21, 511–521. [Google Scholar] [CrossRef]
  16. Nakagawa, H.; Niu, K.; Hozawa, A.; Ikeda, Y.; Kaiho, Y.; Ohmori-Matsuda, K.; Nakaya, N.; Kuriyama, S.; Ebihara, S.; Nagatomi, R. Impact of nocturia on bone fracture and mortality in older individuals: A Japanese longitudinal cohort study. J. Urol. 2010, 184, 1413–1418. [Google Scholar] [CrossRef] [PubMed]
  17. van Dijk, N.; Boer, M.C.; De Santo, T.; Grovale, N.; Aerts, A.J.; Boersma, L.; Wieling, W. Daily, weekly, monthly, and seasonal patterns in the occurrence of vasovagal syncope in an older population. Europace 2007, 9, 823–828. [Google Scholar] [CrossRef] [PubMed]
  18. Wijlhuizen, G.J.; Chorus, A.M.; Hopman-Rock, M. The FARE: A new way to express FAlls Risk among older persons including physical activity as a measure of exposure. Prev. Med. 2010, 50, 143–147. [Google Scholar] [CrossRef] [PubMed]
  19. Telfar Barnard, L.F.; Baker, M.G.; Hales, S.; Howden-Chapman, P. Novel use of three administrative datasets to establish a cohort for environmental health research. BMC Public Health 2015, 15, 246. [Google Scholar] [CrossRef]
  20. Langley, J.; Stephenson, S.; Cryer, C.; Borman, B. Traps for the unwary in estimating person based injury incidence using hospital discharge data. Inj. Prev. 2002, 8, 332–337. [Google Scholar] [CrossRef]
  21. Gauthier, J.; Wu, Q.V.; Gooley, T.A. Cubic splines to model relationships between continuous variables and outcomes: A guide for clinicians. Bone Marrow Transplant. 2020, 55, 675–680. [Google Scholar] [CrossRef]
  22. Gardner, W.; Mulvey, E.P.; Shaw, E.C. Regression analyses of counts and rates: Poisson, overdispersed Poisson, and negative binomial models. Psychol. Bull. 1995, 118, 392. [Google Scholar] [CrossRef]
  23. Salmond, C.; Crampton, P.; King, P.; Waldegrave, C. NZiDep: A New Zealand index of socioeconomic deprivation for individuals. Soc. Sci. Med. 2006, 62, 1474–1485. [Google Scholar]
  24. Isaacs, N. Thermal insulation. Build Mag. 2007, 110–111. [Google Scholar]
  25. Craig, P.; Cooper, C.; Gunnell, D.; Haw, S.; Lawson, K.; Macintyre, S.; Ogilvie, D.; Petticrew, M.; Reeves, B.; Sutton, M. Using natural experiments to evaluate population health interventions: New Medical Research Council guidance. J. Epidemiol. Community Health 2012, 66, 1182–1186. [Google Scholar] [CrossRef] [PubMed]
  26. Geller, A.M.; Zenick, H. Aging and the environment: A research framework. Environ. Health Perspect. 2005, 113, 1257–1262. [Google Scholar] [CrossRef] [PubMed]
  27. Chapman, R.; Howden-Chapman, P.; Viggers, H.; O’Dea, D.; Kennedy, M. Retrofitting houses with insulation: A cost-benefit analysis of a randomised community trial. J. Epidemiol. Community Health 2009, 63, 271–277. [Google Scholar] [CrossRef]
  28. Mishra, S.R.; Wilson, T.; Andrabi, H.; Ait Ouakrim, D.; Li, A.; Akpan, E.; Bentley, R.; Blakely, T. The total health gains and cost savings of eradicating cold housing in Australia. Soc. Sci. Med. 2023, 334, 115954. [Google Scholar] [CrossRef] [PubMed]
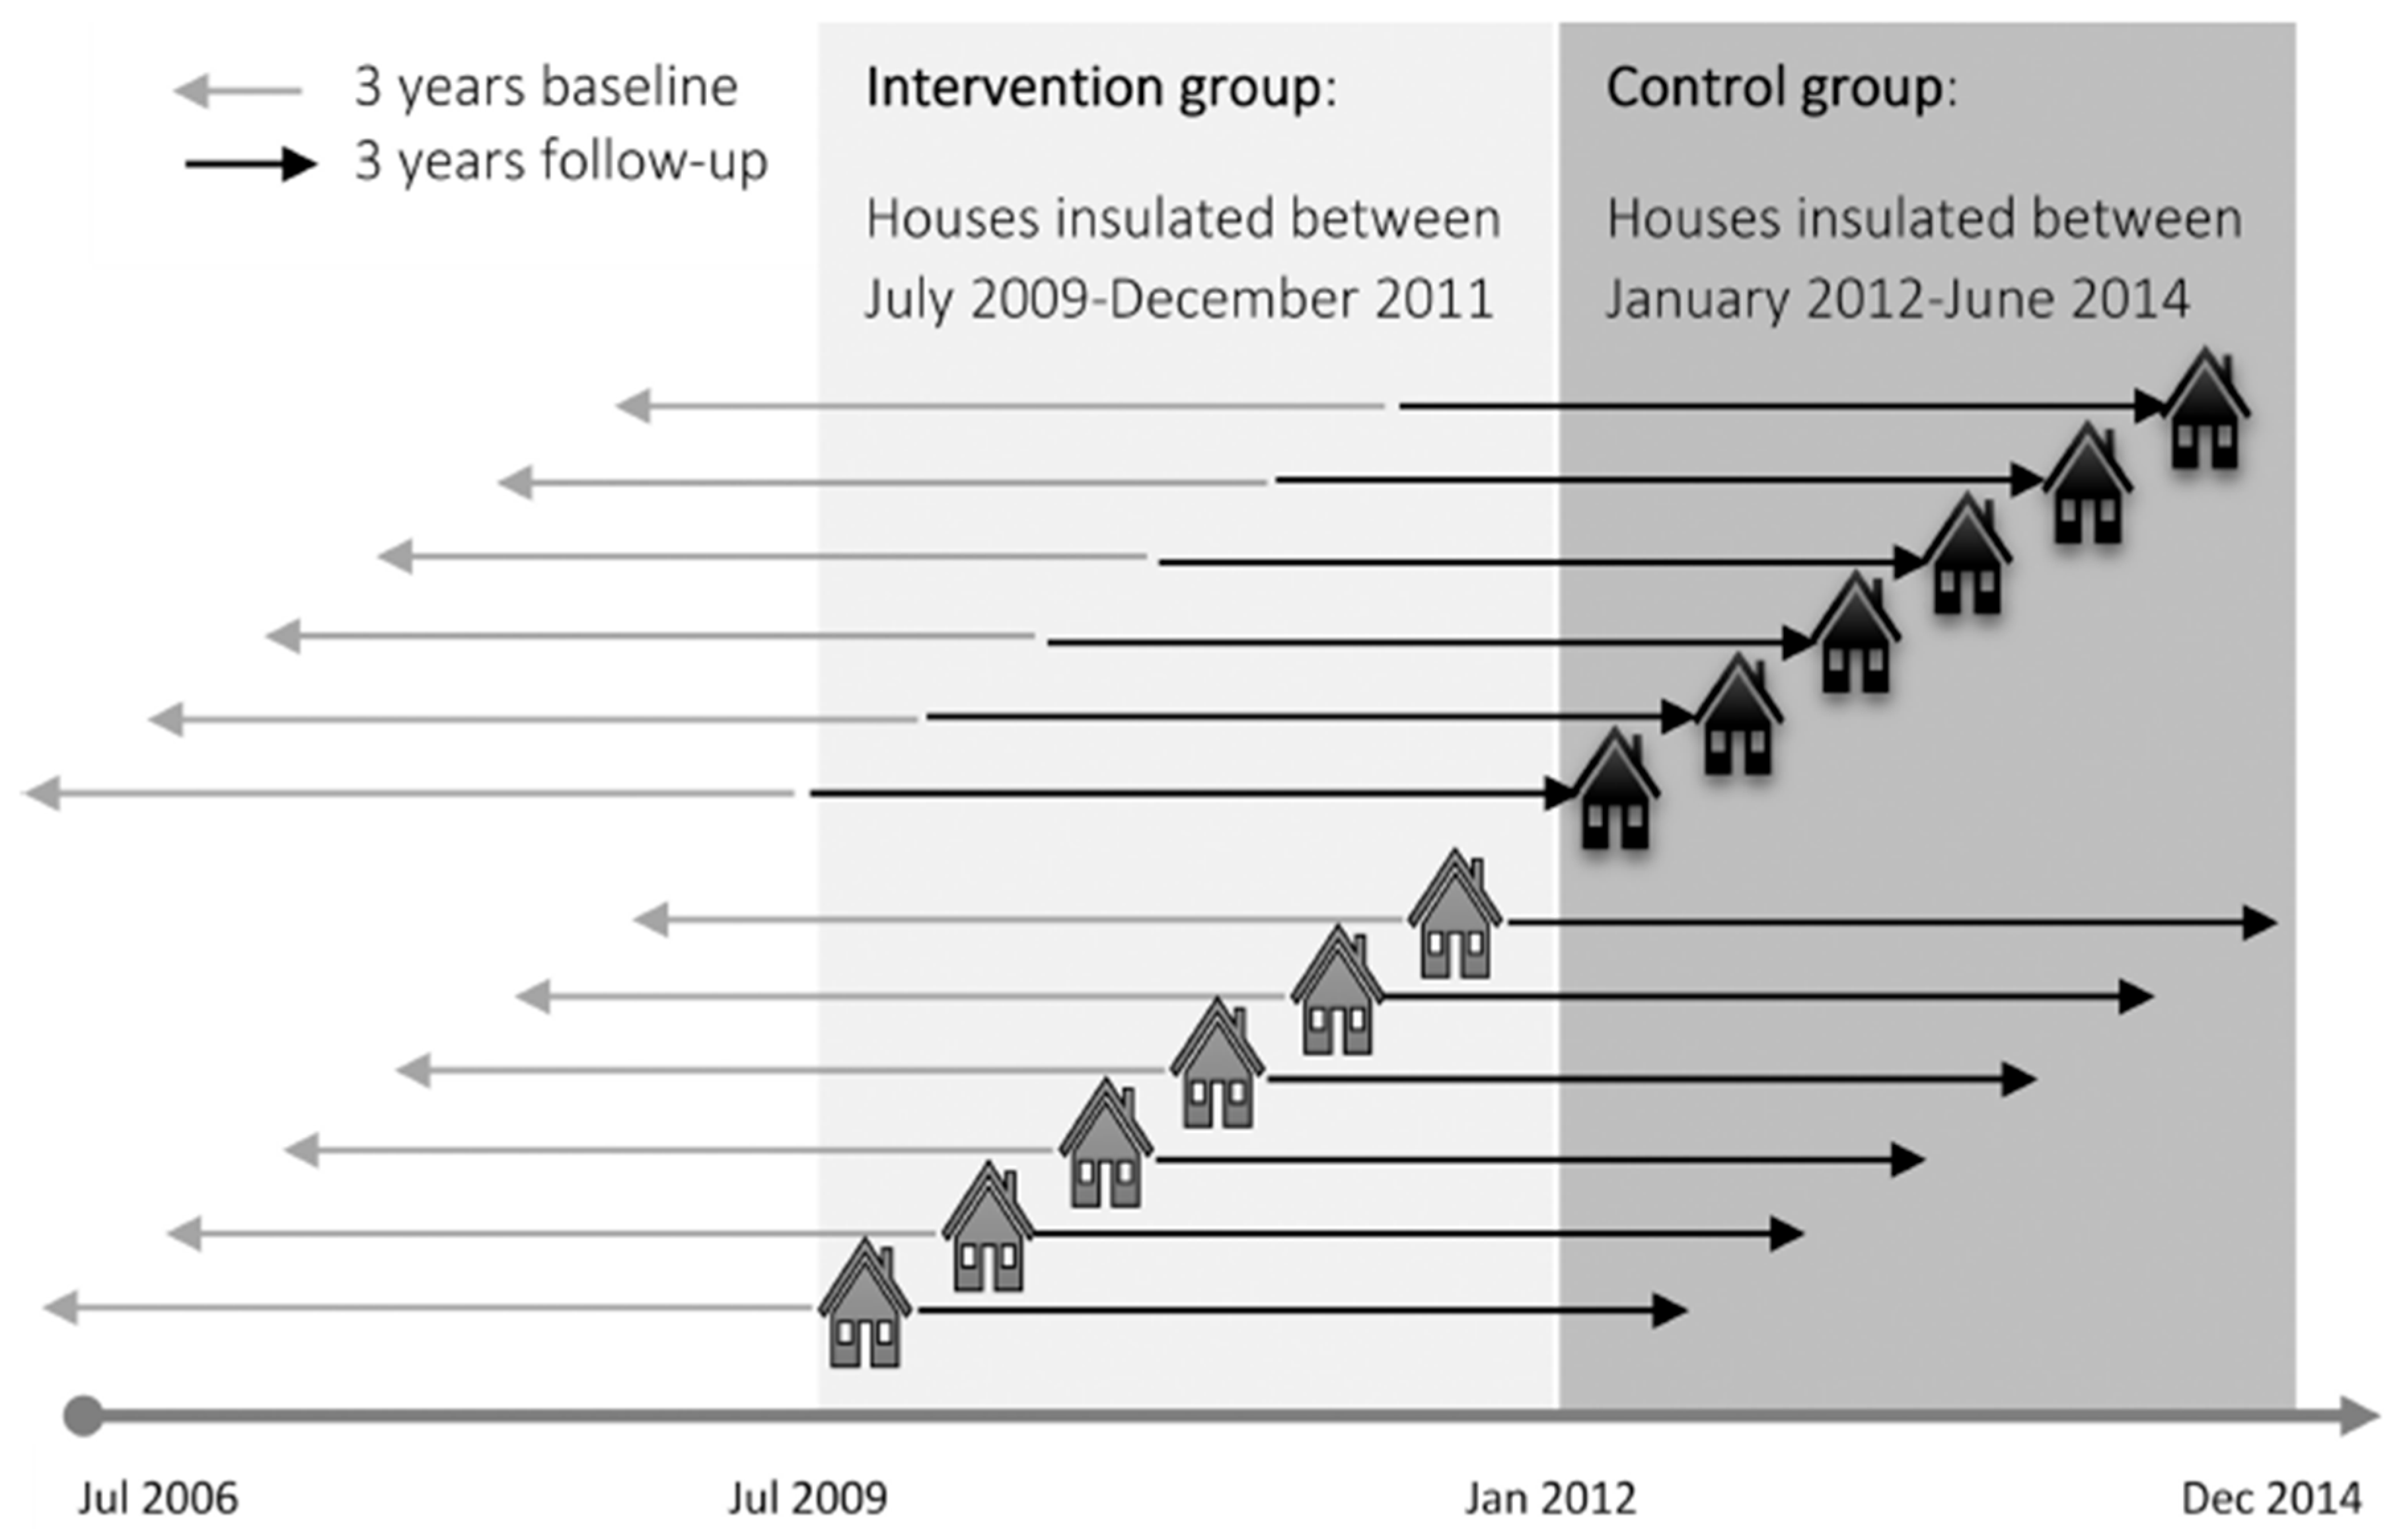
Figure 1. Diagram of natural experimental design defining intervention homes, control homes, and baseline/follow-up periods (from [4]).
Safety 11 00081 g001
Figure 2. Map of New Zealand climate zones as used in the study. The R value is the thermal resistance of insulation used for the insulation retrofits.
Safety 11 00081 g002
Figure 3. Relative rate ratios for home fall injury hospitalisation associated with the insulation programme according to age as modelled by cubic splines, with 95% CI upper and lower limits (dotted lines).
Safety 11 00081 g003
Table 1. Numbers in cohort studied who were resident in studied addresses according to group (intervention or control) and numbers of hospital admissions for indoor falls according to the group (intervention or control) and study period (baseline or follow-up), along with crude relative rate ratios of falls per year living at the exposed address, with 95% confidence intervals.
CharacteristicsValueIntervention n (%)Control n (%)Intervention Falls Baseline/Follow-UpControl Falls Baseline/Follow-UpRelative Rate Ratio (95% CI)
Overall 236,040 (100)233,626 (100)1288/25351075/21150.99 (0.89, 1.09)
SexFemale126,453 (53.6)123,682 (52.9)870/1638709/14220.92 (0.82, 1.04)
Male109,587 (46.4)109,944 (47.1)418/897366/6931.12 (0.94, 1.33)
Age at start of study0–941,608 (17.6)39,303 (16.8)120/99101/930.83 (0.57, 1.23)
10–1930,721 (13.0)33,771 (14.5)36/4531/470.79 (0.42, 1.48)
20–2927,758 (11.8)30,118 (12.9)38/3443/530.77 (0.42, 1.43)
30–3933,778 (14.3)32,141 (13.8)58/4943/490.71 (0.41, 1.24)
40–4931,176 (13.2)31,848 (13.6)70/7951/770.71 (0.44, 1.15)
50–5924,667 (10.5)25,998 (11.1)97/13699/1351.04 (0.72, 1.50)
60–6923,914 (10.1)22,223 (9.5)177/260119/2100.88 (0.66, 1.18)
70–7916,404 (6.9)13,266 (5.7)298/629256/4931.12 (0.92, 1.38)
80–895683 (2.4)4677 (2.0)344/932295/7561.04 (0.87, 1.25)
90 plus331 (0.1)281 (0.1)50/27237/2020.87 (0.55, 1.37)
Age dichotomised0–64200,152 (84.8)203,927 (87.3)494/529407/5280.81 * (0.68, 0.97)
65 plus35,888 (15.2)29,699 (12.7)794/2006668/15871.10 (0.97, 1.24)
EthnicityEuropean159,261 (67.5)147,956 (63.3)1052/2214876/17791.01 (0.91, 1.13)
Māori36,698 (15.5)42,675 (18.3)134/185109/1890.79 (0.57, 1.09)
Other40,081 (17.0)42,995 (18.4)102/13690/1470.82 (0.57, 1.18)
Deprivation (NZDep) quintile1 least deprived35,632 (15.1)31,911 (13.7)180/345148/2781.00 (0.76, 1.31)
242,570 (18.0)37,748 (16.2)187/422164/3121.18 (0.91, 1.52)
348,633 (20.6)45,328 (19.4)267/510217/4011.02 (0.82, 1.27)
455,909 (23.7)55,358 (23.7)347/643271/5560.89 (0.73, 1.08)
5 most deprived53,296 (22.6)63,281 (27.1)307/615275/5680.95 (0.78, 1.16)
Climate zone (see Figure 2)CZ1: Far North, Auckland and Coromandel Peninsula)64,335 (27.3)71,336 (30.5)384/700332/6150.97 (0.80, 1.16)
CZ2: rest of North Island (excluding Central Plateau)114,293 (48.4)121,470 (52.0)594/1113524/10460.93 (0.80, 1.07)
CZ3: South Island and Central Plateau57,412 (24.3)40,820 (17.5)310/722219/4541.10 (0.89, 1.36)
* indicates that the unadjusted rates for intervention and control groups were statistically significantly different.
Table 2. Exponentiated coefficients from a model + fitting hospitalised fall counts for the cohort, estimating relative hospitalised fall rates adjusted for levels of other factors in the table.
FactorFactor LevelAdjusted Relative Rate
(95% CI)
p-Value
age dichotomised0–640.12 (0.11, 0.14)<0.0001
65+reference
ethnicityEuropean2.23 (1.97, 2.52)<0.0001
Māori1.74 (1.49, 2.02)<0.0001
Otherreference
sexF1.57 (1.47, 1.68)<0.0001
Mreference
deprivation quintile1 least deprived0.72 (0.65, 0.81)<0.0001
20.71 (0.64, 0.79)<0.0001
30.80 (0.73, 0.89)<0.0001
40.90 (0.82, 0.98)0.02
5 most deprivedreference
climate zoneCZ1: Far North, Auckland and Coromandel Peninsula)1.39 (1.29, 1.50)<0.0001
CZ2: rest of North Island (excluding Central Plateau)reference
CZ3: South Island and Central Plateau1.10 (1.01, 1.19)0.03
cohortIntervention0.96 (0.83, 1.10)0.54
Controlreference
periodFollow-up1.96 (1.74, 2.21)<0.0001
Baselinereference
cohort × periodIntervention, follow-up1.09 (0.93, 1.28)0.29
cohort × ageIntervention, age 0–641.25 (1.02, 1.52)0.03
period × ageFollow-up, age 0–640.65 (0.54, 0.78)<0.0001
cohort × period × ageIntervention, follow-up, age 0–640.74 (0.58, 0.96)0.02
+ All the factors in the model (apart from the intercept) are listed in the first column.
Disclaimer/Publisher’s Note: The statements, opinions and data contained in all publications are solely those of the individual author(s) and contributor(s) and not of MDPI and/or the editor(s). MDPI and/or the editor(s) disclaim responsibility for any injury to people or property resulting from any ideas, methods, instructions or products referred to in the content.