1. Introduction
The rapid proliferation of e-scooters in urban environments has transformed contemporary mobility paradigms, offering a sustainable and convenient alternative to traditional modes of transportation. However, this shift toward micromobility has been accompanied by growing concerns about safety. In Texas, reported e-scooter crashes began near zero and rose quickly with the rollout of scooter sharing. For example, only 24 e-scooter collisions were officially recorded statewide in 2021 [
1], but a detailed Austin case study identified 153 police-reported e-scooter crashes in that city from 2018 to 2021 [
2]. By 2023, annual crash counts remained elevated—one Austin scooter operator alone reported 342 collisions over 2022–2023 [
3]—reflecting sustained growth in e-scooter use. Crucially, most crashes result in injury but not death. In Austin’s data, over 98% of e-scooter crashes led to non-fatal injuries (predominantly minor injuries), and 0% led to fatalities [
2]. Severe outcomes, while comparatively rare, have occurred (Austin has averaged roughly one rider death per year since 2018 [
3]). National statistics echo these trends. E-scooter-related injuries treated in U.S. emergency departments increased by about 22% from 2021 to 2022 [
4], totaling an estimated 169,300 e-scooter injuries between 2017 and 2022 [
5]. At least 111 e-scooter rider fatalities were reported nationwide in 2021–2022 [
5], with the majority involving collisions with motor vehicles. In summary, e-scooter crashes have surged in frequency since 2018, especially in Texas’s urban centers, although severe injuries and deaths remain a relatively small fraction of all incidents. Recent studies have documented a rise in e-scooter crashes, prompting researchers and policymakers to question the adequacy of existing urban infrastructure in accommodating this new mode of transport safely [
6,
7]. The inherent variability in crash rates across different urban contexts suggests that traditional safety assessments—often based on aggregated metrics—fail to capture the complex interplay between urban form, demographic characteristics, and local exposure to micromobility. In response, spatially explicit modeling approaches have emerged as a powerful tool for uncovering heterogeneous risk patterns in urban settings [
8,
9].
In this study, we develop a Bayesian hierarchical spatial Poisson model to quantify e-scooter crash risk at the census block-group level in Texas. Our approach integrates a comprehensive set of covariates—including demographic factors (e.g., the percentage of the working-age population), household vehicle ownership, multiple density measures (e.g., gross population and employment densities), and detailed employment and land-use metrics (e.g., retail and entertainment employment densities, walkability, and street intersection density)—with spatial and regional random effects. Notably, we omit region-level effects for observations with missing community statistical area (CSA) identifiers, thereby ensuring that all data are retained while recognizing the differential influence of urban versus non-urban areas on crash risk.
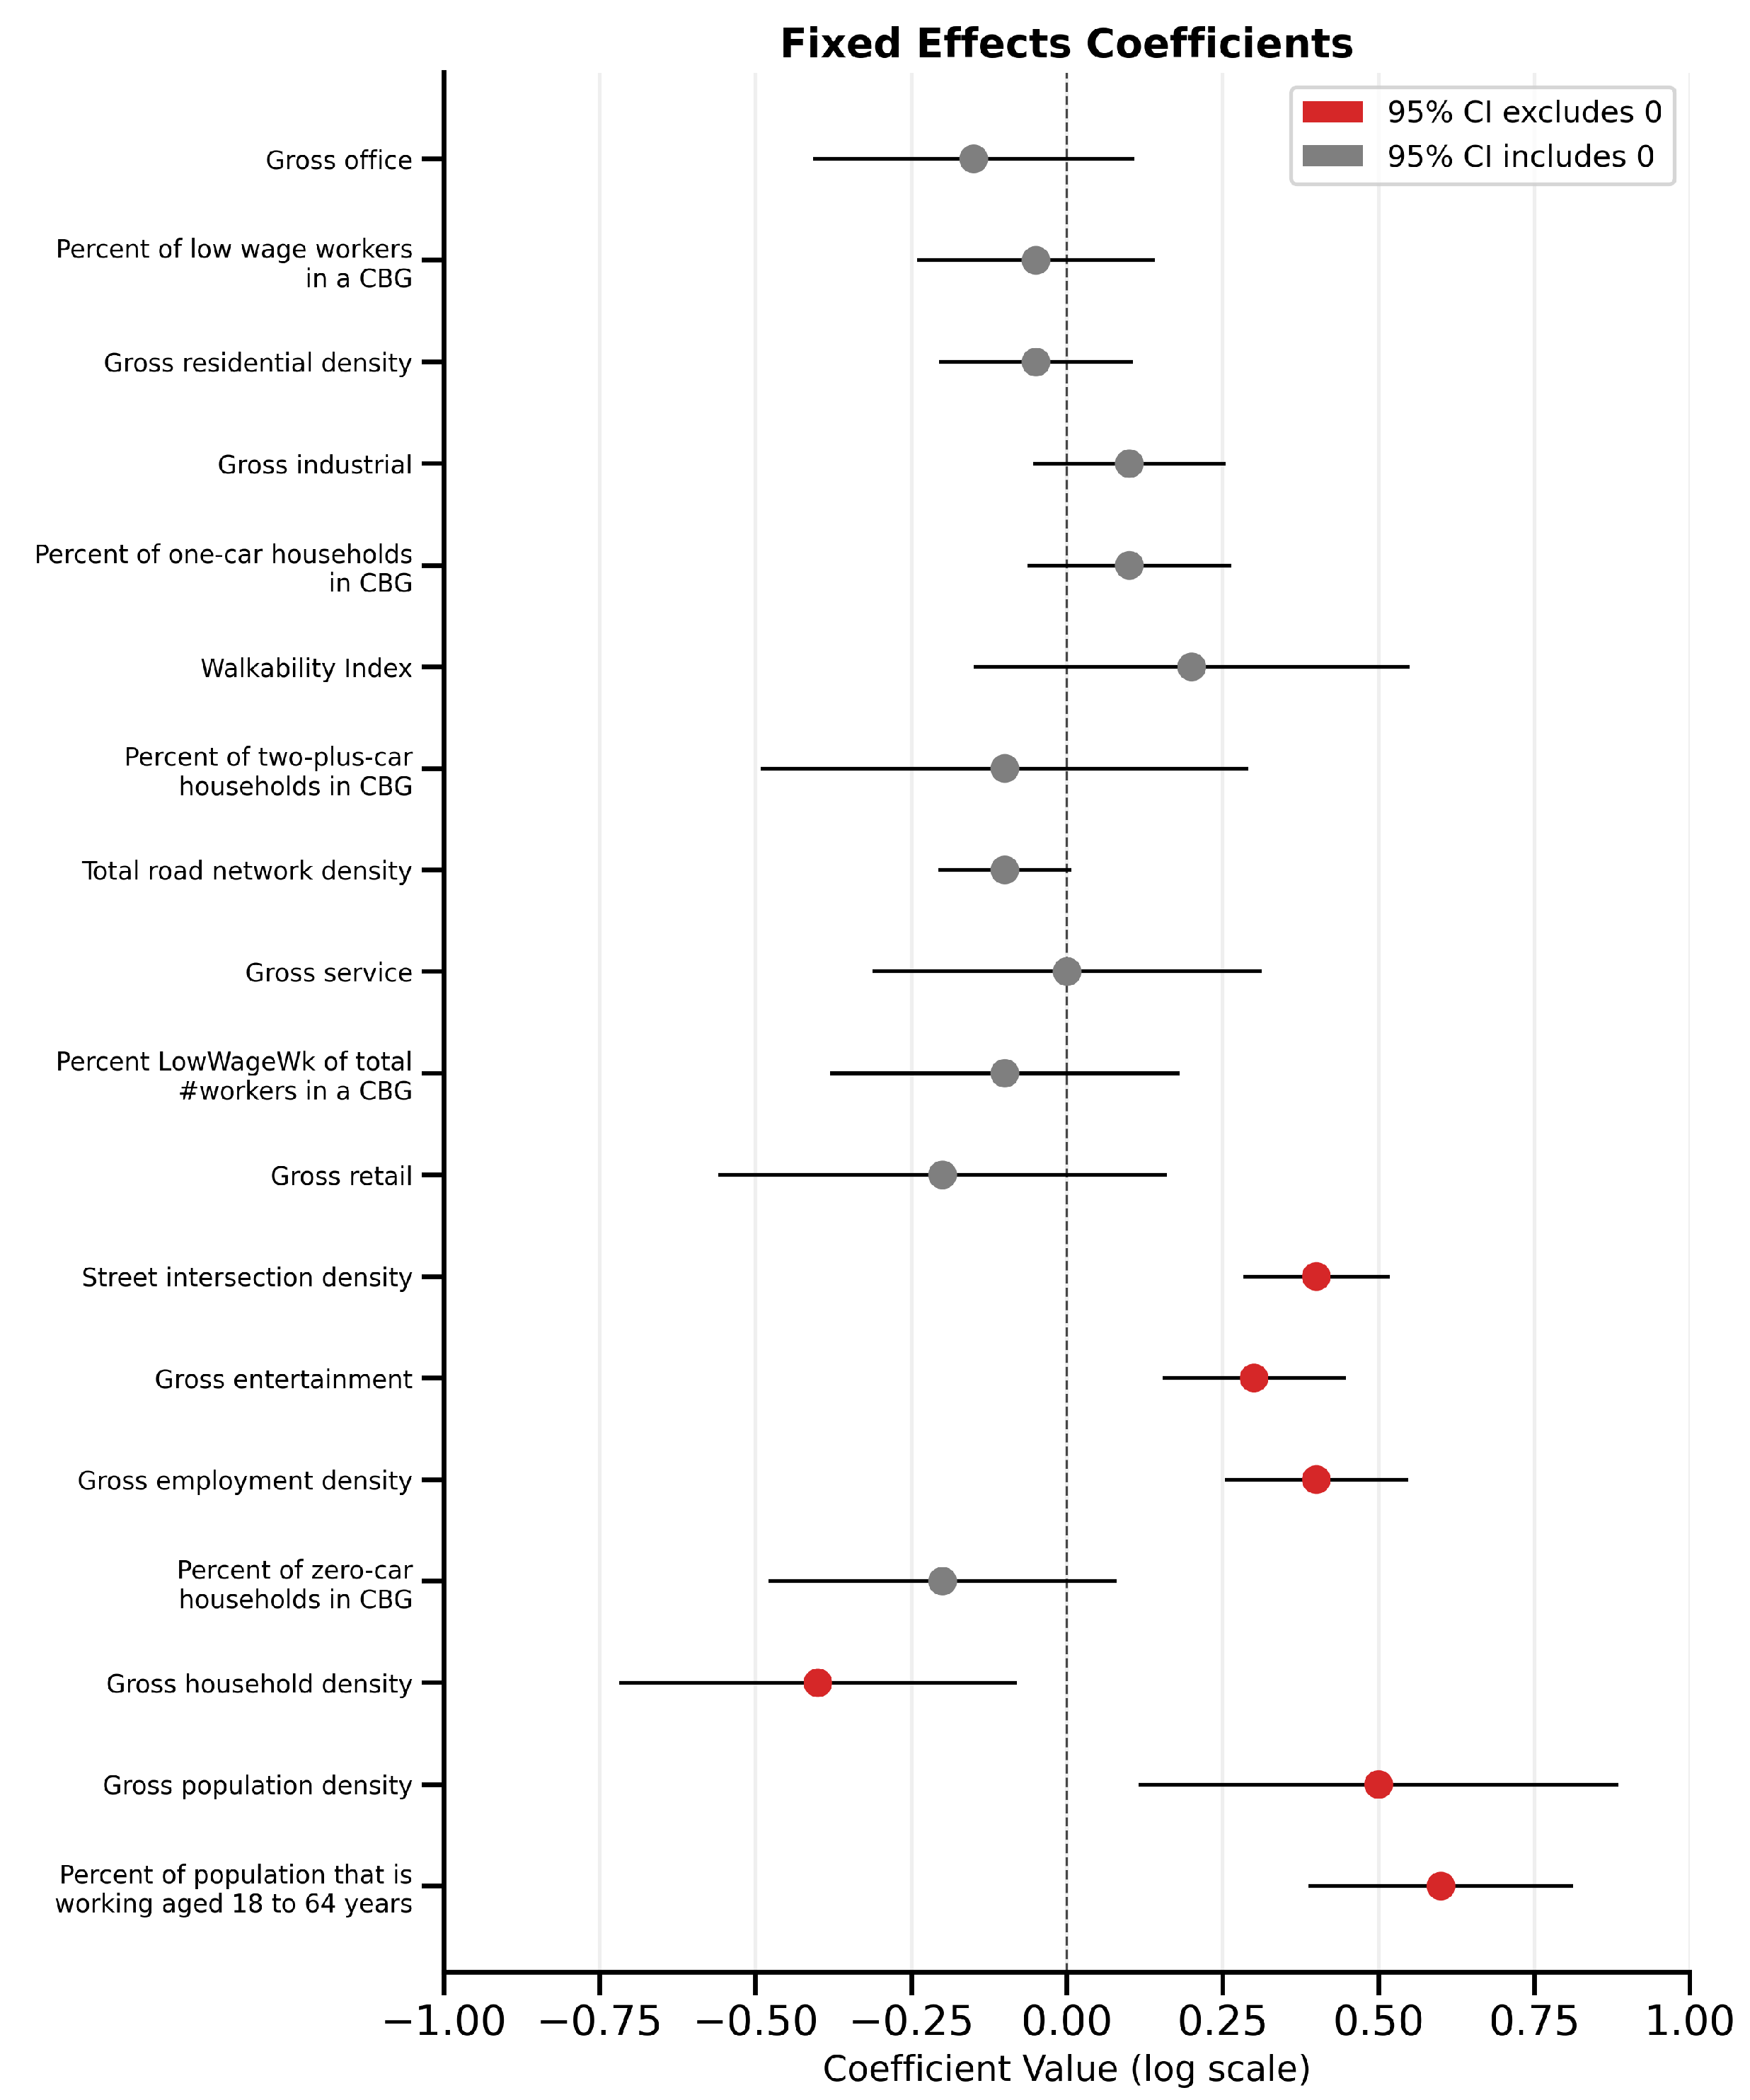
The expanded set of predictors allows us to explore a range of potential influences on safety outcomes. For instance, our preliminary findings indicate that block groups with higher proportions of working-age residents, greater employment density, and elevated entertainment employment density exhibit significantly higher e-scooter crash risk. Conversely, areas with higher household density and more robust multimodal infrastructure may experience lower relative risk. By capturing both global trends and localized spatial heterogeneity, our model provides actionable insights for urban planners and policymakers. The results suggest that targeted interventions, such as developing protected micromobility lanes in high-density, mixed-use neighborhoods, could effectively mitigate crash risk while supporting sustainable urban mobility.
The remainder of this paper is organized as follows:
Section 2 reviews relevant literature on micromobility safety and Bayesian spatial modeling.
Section 3 describes the data sources and methodological framework.
Section 4 presents the empirical results, including model diagnostics and the identification of key risk factors.
Section 5 discusses policy implications and offers recommendations for enhancing e-scooter safety. Finally,
Section 6 concludes with suggestions for future research.
2. Literature Review
The rapid expansion of shared micromobility services, particularly electric scooters (e-scooters), has prompted extensive research into the safety implications of these emerging modes of transportation in U.S. cities. Since their widespread introduction post 2018, e-scooters have been associated with a notable increase in crash incidents and injuries, although the majority of these incidents tend to be of minor severity [
10]. Early investigations revealed that most e-scooter injuries result from single-vehicle events—primarily falls or loss-of-control incidents—rather than multi-vehicle collisions [
11]. For instance, analyses of hospital records from metropolitan areas such as Los Angeles and Washington, D.C., have consistently shown that while a substantial number of riders present with injuries, the rate of hospitalization remains relatively low [
12]. Nevertheless, the high frequency of head injuries among e-scooter riders, compounded by the low incidence of helmet use, remains a critical public health concern [
10].
In parallel with crash outcome studies, researchers have examined the role of the built environment in shaping micromobility safety. The physical infrastructure available to riders, ranging from dedicated bike lanes and well-designed intersections to overall street connectivity, plays a pivotal role in determining the likelihood and severity of e-scooter crashes. Empirical evidence suggests that intersections are frequent sites of conflict. In Nashville, for example, a majority of e-scooter crashes occur at intersections, where the interplay between vehicular traffic and pedestrian movement creates complex conflict points [
7]. Moreover, poor lighting conditions and the absence of protected infrastructure further exacerbate crash risks during nighttime riding [
13]. Conversely, investments in dedicated infrastructure, such as protected bike lanes, have been associated with reduced crash frequency and severity [
14]. Such findings underscore the importance of incorporating safe design principles into urban planning to accommodate micromobility better.
Socioeconomic and demographic factors also play a role in understanding e-scooter crash patterns. Numerous U.S.-based studies have found that neighborhoods with higher proportions of working-age adults tend to exhibit increased e-scooter usage, which, in turn, correlates with higher crash rates [
15]. This relationship is further complicated by household vehicle ownership; areas with a higher percentage of zero-car households—often indicative of urban, transit-dependent communities—tend to experience an elevated crash risk, likely due to an increased reliance on alternative transportation modes such as e-scooters [
16]. However, the evidence regarding the effect of one-car and two-plus-car households remains mixed, suggesting that the association between vehicle ownership and e-scooter safety may be nuanced and context-dependent [
15]. Furthermore, the proportion of low-wage workers in both residential and work locations has been examined, with some studies suggesting that higher percentages may be associated with increased exposure and crash risk. However, these relationships are often statistically weak [
17].
Density measures serve as robust indicators of exposure in urban safety analyses. Higher gross population density and employment density are consistently linked with increased e-scooter crash risk [
18]. Dense areas, particularly downtown zones with mixed land use, not only attract more riders but also present a greater number of potential conflict points between e-scooters, pedestrians, and motor vehicles. In this context, land-use diversity—or employment entropy—has emerged as a significant predictor of crash frequency. A balanced mix of commercial, residential, and entertainment uses tends to correlate with elevated crash counts, reflecting both high exposure and the complex interplay of differing traffic flows [
19]. These findings suggest that while dense, vibrant neighborhoods offer numerous mobility benefits, they also necessitate more sophisticated safety interventions.
Spatial heterogeneity in crash data is a critical aspect that traditional regression models often overlook. Bayesian hierarchical spatial models have increasingly been employed in transportation safety research to address this limitation. These models incorporate spatial random effects—often via a conditional autoregressive (CAR) prior—to account for the tendency of crash risk to cluster geographically [
8,
9]. Such approaches enable “borrowing strength” from neighboring areas, yielding more stable risk estimates, even for block groups with sparse data. Although widely used in pedestrian and bicycle safety studies, the application of Bayesian spatial models to e-scooter safety remains relatively novel. Recent work has demonstrated that these models can uncover significant local variations in risk that are obscured in aggregated analyses, thereby providing more actionable insights for urban planning [
20,
21].
Despite the advances in modeling, notable gaps persist in the literature. Most studies on e-scooter safety have been descriptive, focusing on crash counts and injury severity at broad geographic levels (e.g., cities or census tracts), without leveraging fine-scale spatial variation [
11,
15]. This study seeks to address these gaps by modeling crash risk at the census block-group level, thereby capturing localized effects that are crucial for targeted safety interventions. Moreover, while previous studies have considered a limited set of covariates, our model integrates a comprehensive suite of predictors—including demographic, socioeconomic, and built environment measures—to disentangle their relative contributions to crash risk. By doing so, we aim to identify modifiable factors that can inform policy decisions aimed at enhancing e-scooter safety.
In summary, the existing literature highlights that a combination of rider characteristics, built environment factors, and socioeconomic conditions influences the safety of e-scooters. Recent U.S.-based research highlights that high exposure—driven by dense population, mixed land use, and heavy employment—is associated with increased crash risk. At the same time, protective infrastructure such as bike lanes and improved intersection design can mitigate these risks [
7,
14]. However, there remains a pressing need for fine-scale spatial analyses that incorporate a broad array of risk factors within a unified modeling framework. The present study addresses this need by applying a Bayesian hierarchical spatial Poisson model to block group–level data in Texas, providing nuanced insights into the determinants of e-scooter crash risk and laying the groundwork for evidence-based urban safety interventions.
3. Data Sources and Methodological Framework
This study integrates crash records with socioeconomic and built environment data at the census block-group level. Crash data were obtained from the Texas Crash Records Information System (CRIS) maintained by the Texas Department of Transportation [
22]. CRIS provides geocoded crash incident data, which we aggregated by census block group (a geographic unit roughly akin to a neighborhood). Socioeconomic and demographic variables were derived from the American Community Survey (ACS) 5-year estimates [
23]. Additional built environment measures, such as walkability and network metrics, were collected from regional planning GIS datasets. The census block group was chosen as the unit of analysis because it offers fine-grained resolution and comes with readily available data on population and housing from ACS, enabling a consistent linkage of crash counts with local characteristics.
For each block group, a set of explanatory variables was compiled to characterize the resident population and built environment:
Working-Age Population: The percentage of the population aged 18–64 years in the block group [
24,
25,
26];
Vehicle Ownership: Household vehicle availability, measured as the proportion of households with zero vehicles, one vehicle, and two or more vehicles [
27,
28];
Low-Wage Employment: The count of jobs or workers in the block group that are classified as low-wage (below a given earnings threshold), representing economic characteristics of the area [
16,
26];
Population and Household Density: Residents per square mile and households per square mile, reflecting residential density [
16,
29];
Employment Density by Sector: Jobs per square mile in specific sectors such as entertainment and office employment, capturing the concentration of certain land uses and employment centers in the area [
16,
24,
26];
Walkability Index: An index reflecting the pedestrian-friendliness of the urban form (e.g., based on land-use mix, street connectivity, and sidewalk availability), obtained from planning datasets [
24,
25];
Road Network Density and Intersection Density: The length of roadways per unit area and the count of intersections per unit area within the block group, indicating the intensity of the transportation network [
16,
18,
24].
These variables were selected based on the literature that links demographics, car access, employment characteristics, and built environment features to traffic safety outcomes. By incorporating both population-related and infrastructure-related measures, the model can account for exposure (e.g., increased population or vehicle traffic in an area), as well as risk factors associated with road layout and urban design.
3.1. Crash Reporting Limitations
The crash data analyzed in this study are derived from the Texas Department of Transportation’s Crash Records Information System (CRIS), which, by design, includes only crashes that were investigated by or reported to law enforcement. In practice, this means that only incidents meeting official reporting criteria (e.g., occurring on public roadways and involving an injury, a fatality, or significant property damage above a defined threshold) are recorded. Consequently, very minor e-scooter mishaps—such as isolated falls that do not result in injury or notable property damage—are unlikely to be captured in the dataset. This reporting threshold introduces a limitation: the recorded crash sample is inherently biased toward higher-severity events, since trivial incidents typically go unreported. To acknowledge and partially mitigate this bias, we employ a severity-weighted crash index as the outcome variable in our risk modeling. This index assigns greater weight to crashes with serious injuries or fatalities, thereby emphasizing more consequential outcomes while de-emphasizing minor ones. For example, if
and
denote the numbers of fatal, serious-injury, minor-injury, and no-injury e-scooter crashes in a given spatial unit, we define the composite risk metric as follows:
with weight factors of
,
,
, and
chosen to place proportionally more emphasis on crashes involving severe outcomes. This severity-weighted formulation ensures that more serious crashes contribute more heavily to the risk measure, aligning the model with the data’s emphasis on high-severity incidents. It is important to note, however, that truly uneventful e-scooter incidents—for instance, a rider’s uneventful dismount or a self-corrected loss of balance that averts a crash—remain unobservable in police records. As a result, our analysis is inherently limited to crashes that exceed the reporting threshold, and care should be taken when generalizing findings to all e-scooter riding events.
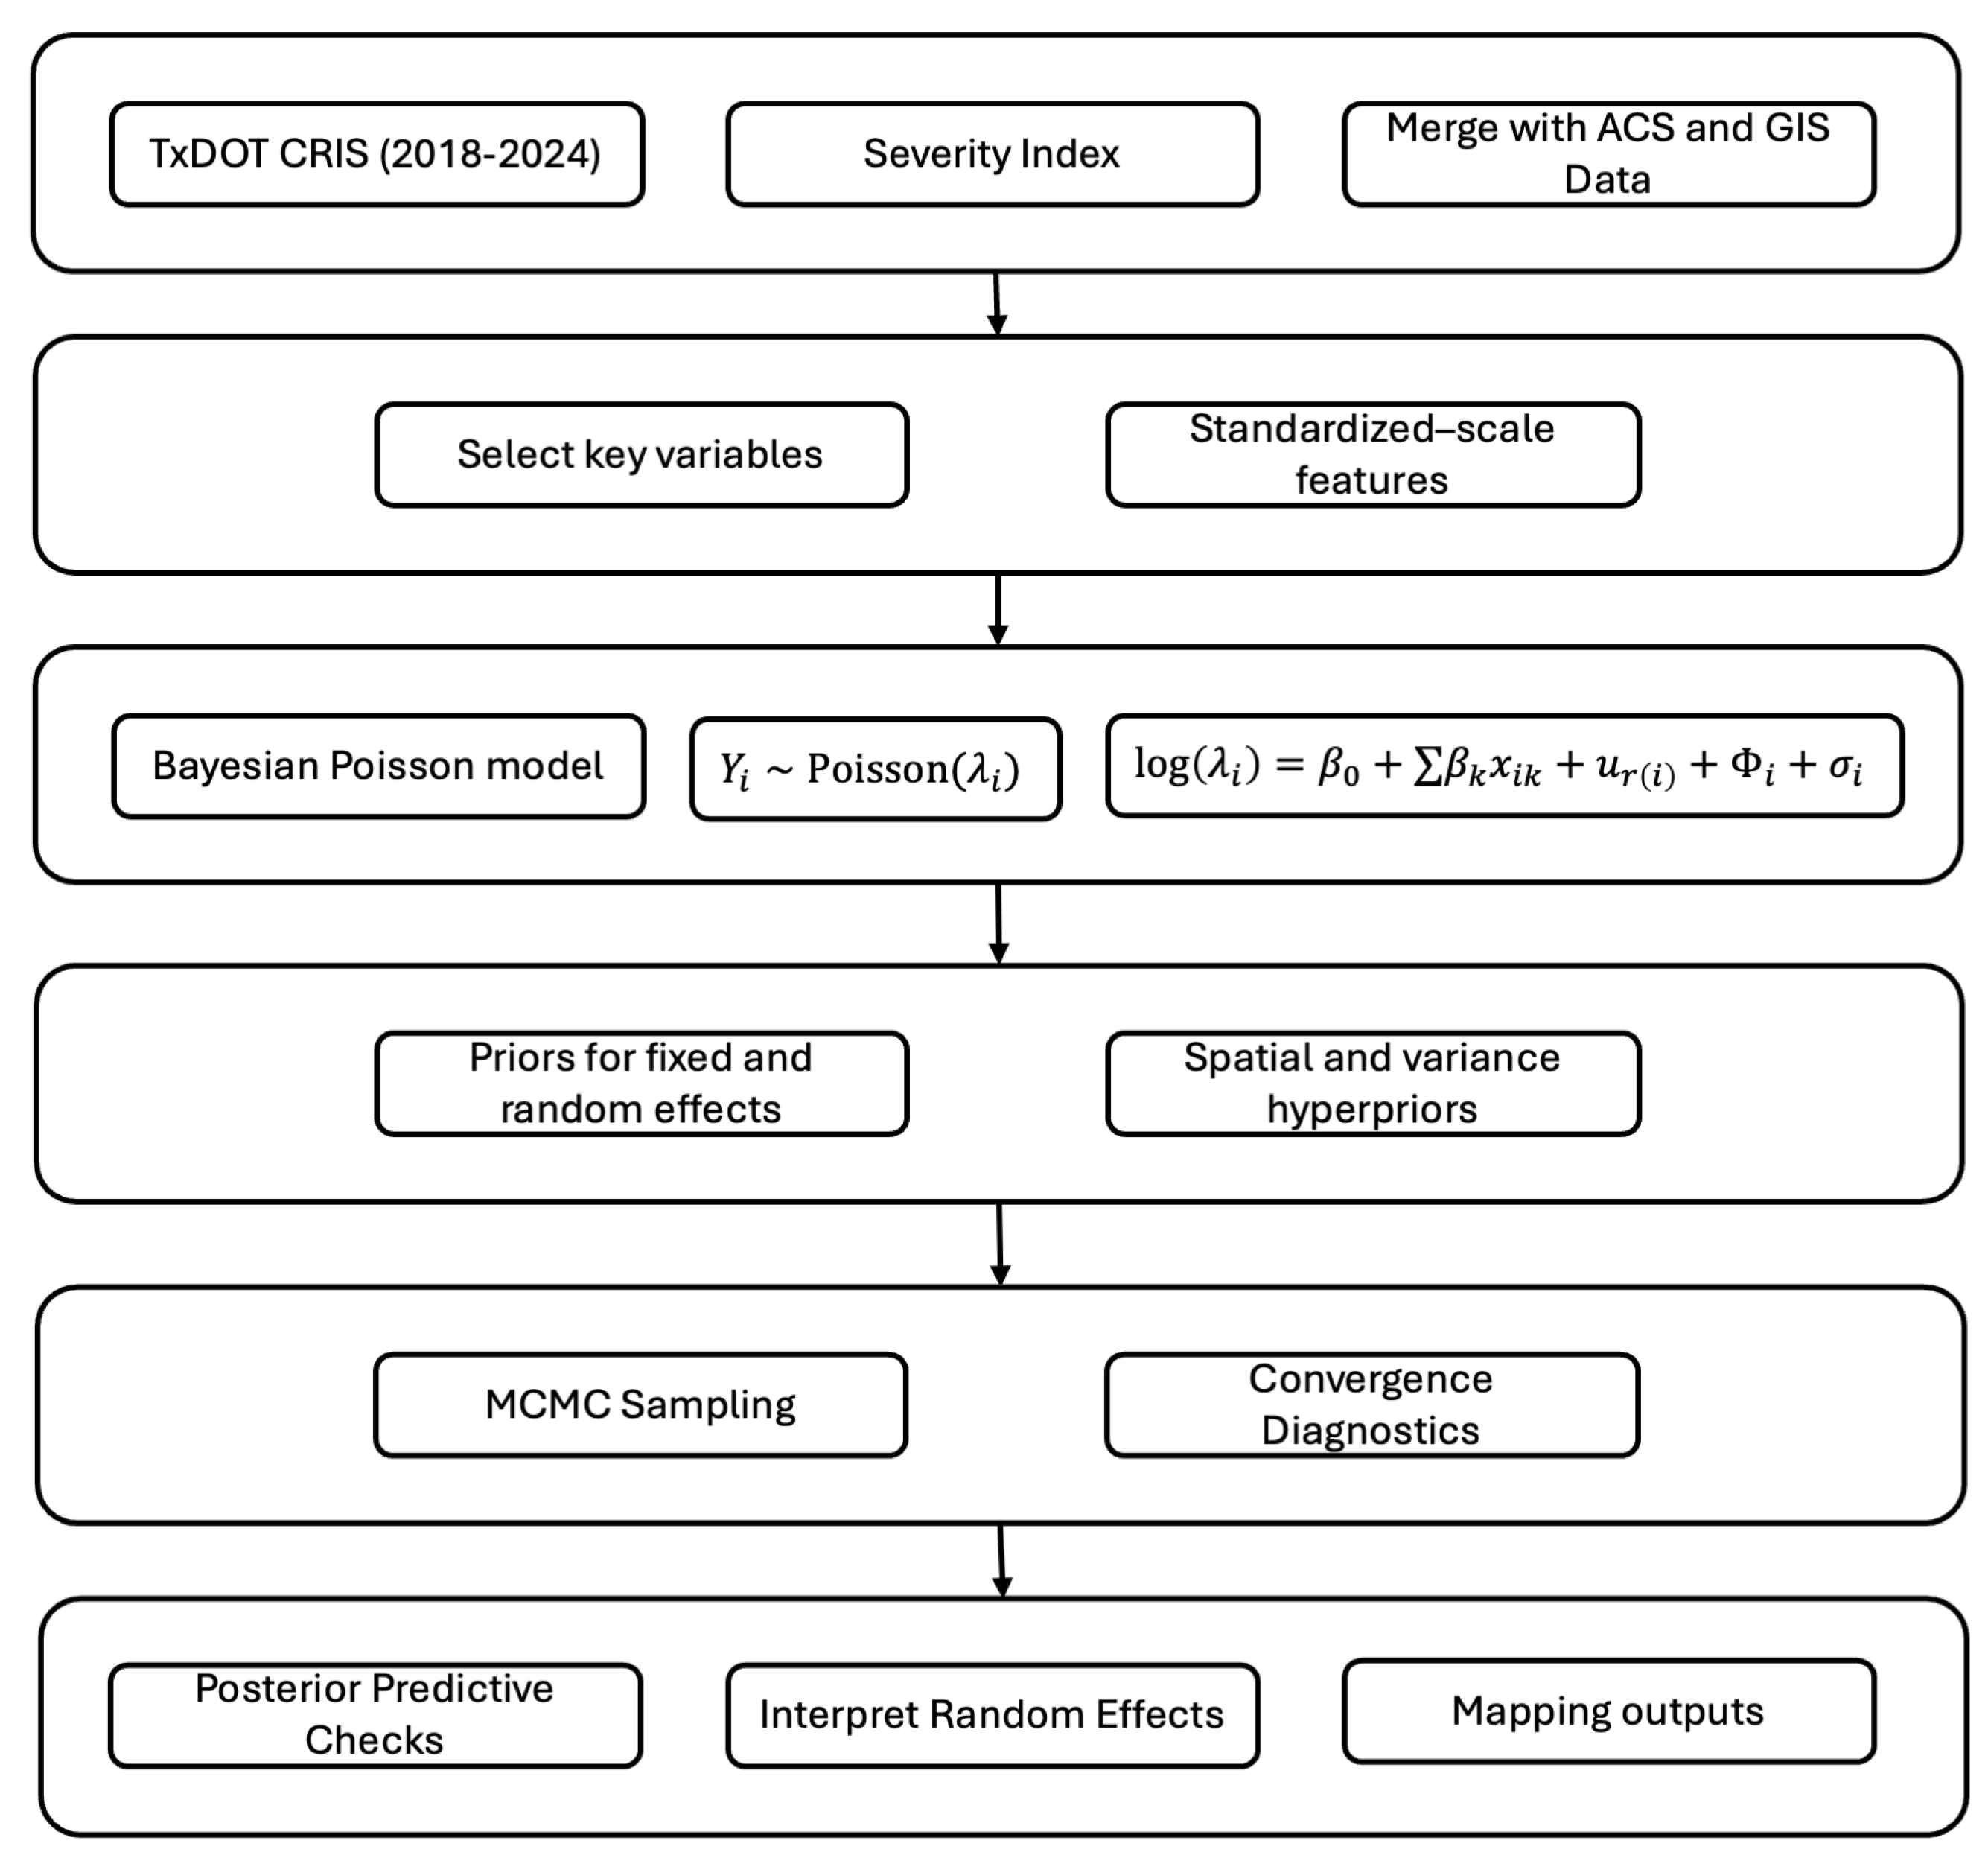
3.2. Bayesian Hierarchical Model Formulation
To estimate spatial variation in e-scooter crash risk, we specify a Bayesian hierarchical model that captures multiple sources of variability: fixed covariate effects, region-specific heterogeneity, structured spatial dependence, and unstructured overdispersion. This formulation follows prior work in spatial epidemiology and road safety modeling [
8,
30,
31].
Let
denote the severity-weighted crash count in block group
i, and let
be the expected crash rate for that unit. At the observational level, we assume the crash counts follow a Poisson distribution:
The log of the expected count is modeled with both fixed and random effects:
where
is the global intercept,
represents fixed-effect coefficients for covariates (
),
is a region-level random intercept for the metropolitan area containing block group
i,
is a spatially structured effect capturing autocorrelation across neighbors, and
is an unstructured noise term to model overdispersion [
32,
33]. The fixed effects (
) are assigned Gaussian priors:
Region-level random intercepts follow
The spatial effects (
) follow an intrinsic Conditional Autoregressive (CAR) prior, as introduced in [
8]:
where
is the set of neighbors of region
i,
is the number of neighbors, and
is the precision parameter with prior
.
Unstructured overdispersion effects are modeled as follows:
This hierarchical CAR model offers several key advantages: it accounts for spatial clustering, accommodates heteroskedasticity in crash counts, and enables partial pooling across regions with sparse data [
9,
33]. This is particularly valuable in the context of zero-inflated and skewed e-scooter crash data, where traditional Poisson models tend to underestimate risk variance. The CAR prior smooths estimates in spatially adjacent zones, reducing false positives from single, isolated, high-count units and improving the robustness of spatial inference.
Figure 1 illustrates the steps of this model.
In modeling e-scooter crash risk at the census block-group level, a Bayesian hierarchical spatial model offers significant advantages over simpler approaches like a Poisson GLM or negative binomial regression by explicitly capturing spatial dependencies and multilevel structure. Given the fine-grained spatial and demographic detail of block-group data, the advanced model can incorporate area-specific random effects (e.g., a spatial CAR prior) that capture unobserved heterogeneity and borrow strength across neighboring areas, yielding more stable risk estimates—a feature that simpler models cannot achieve when treating each block group as independent. Empirical studies show that accounting for spatial correlation yields significantly better fit and predictive accuracy compared to assuming independence [
34]; for instance, a CAR-based Bayesian model had a significantly better fit than an equivalent Poisson log-normal model without spatial effects [
34]. However, these benefits come at the cost of increased model complexity and reduced interpretability: the hierarchical model requires careful prior specification and intensive computation, making its results less transparent, whereas Poisson/NB models are straightforward to implement and have been widely used (with extensions for overdispersion or zero-heavy data) [
19]. The choice of an advanced Bayesian spatial model is ultimately justified when the data’s rich spatial and demographic information can be leveraged to improve insight and prediction, as evidenced by recent micromobility safety studies incorporating spatial effects in crash models.
3.3. Modeling Framework
We employ a Bayesian hierarchical spatial Poisson model to analyze crash counts at the block-group level. The response variable is the number of crashes in each block group, which is assumed to follow a Poisson distribution. The model employs a log-linear specification in which the variables described above are entered as fixed-effect predictors, along with their corresponding regression coefficients. Formally, if
is the crash count in block group
i, we assume
and
where
is an intercept,
represents the observed covariates (fixed effects),
is a region-level random effect for the CSA region (
c) that contains block group
i, and
is a spatial random effect for block group
i. The region-specific random effects (
) capture unobserved heterogeneity across different Combined Statistical Areas (CSAs), recognizing that broad regional factors (e.g., overall urban form or traffic enforcement policies) might influence crash frequencies. We treat these
terms as i.i.d. draws from a common distribution (e.g.,
)—one for each CSA in the study area. We include the
term with a conditional autoregressive (CAR) before the model localizes spatial autocorrelation. In particular, we adopt an intrinsic CAR structure as introduced by Besag et al. [
8]. This CAR prior assumes that neighboring block groups have correlated random effects: each
is assumed to be normally distributed around the average of its neighbors’ effects. Neighbors are defined as adjacent block groups with a common boundary (first-order contiguity), which we determined from U.S. Census TIGER/Line shape files for block-group boundaries. This spatial prior encourages smoother variation in the unexplained risk across space, effectively borrowing strength from adjacent areas to improve estimates in any given block group. It helps account for spatially structured unobserved factors, such as traffic exposure or road design features not captured by our covariates, which can cause nearby areas to have similar crash rates. All parameters are estimated in a fully Bayesian framework using Markov Chain Monte Carlo simulation. We assign relatively diffuse priors for the regression coefficients (
; to let the data inform their values) and hyperpriors for variance components, following standard practices for Bayesian hierarchical models [
9]. The model yields posterior distributions for each parameter, from which we can derive point estimates and credible intervals for the effects of interest. This Bayesian hierarchical spatial approach enables us to accurately quantify uncertainty and leverage the multilevel structure of the data, where block groups are nested within regions with spatial linkages, yielding a robust understanding of how socioeconomic and built environment factors relate to crash occurrences across communities.
5. Sensitivity Analysis
To evaluate the robustness of the crash risk model and the derived risk index, we conducted two types of sensitivity analyses. First, we tested the impact of alternative injury severity weighting schemes on the normalized risk index. Second, we simulated a policy scenario involving changes in urban form and travel behavior to assess how hypothetical shifts in car usage, employment density, and nightlife intensity would influence risk estimates and regression coefficients.
5.1. Sensitivity to Severity Weighting
The crash risk index in our model is based on a weighted sum of crashes, where more severe outcomes receive greater weight. This follows standard practice in traffic safety analysis (e.g., EPDO methods [
44]), but the specific weights are subjective. To assess whether these choices affect spatial patterns of risk, we defined four alternative weighting schemes:
Scheme A: Fatal = 12, Serious = 6, Minor = 3, No injury/Unknown = 1;
Scheme B: Fatal = 8, Serious = 6, Minor = 3, No injury/Unknown = 1;
Scheme C: Fatal = 10, Serious = 8, Minor = 3, No injury/Unknown = 1;
Scheme D: Fatal = 10, Serious = 6, Minor = 5, No injury/Unknown = 1.
For each weighting scheme, we recalculated the risk index and normalized it. Spearman rank correlations between each alternative and the original index were computed to evaluate whether the relative risk ranking of block groups changed.
Table 1 summarizes the results. All Spearman correlations were above 0.98, indicating that the spatial pattern of risk is stable under reasonable changes in crash weighting. The rankings of high-risk areas are essentially unchanged, validating the robustness of our primary risk index.
Table 1 presents Spearman and Pearson correlation coefficients comparing the original risk index with alternative formulations that assign greater or lesser weights to fatal, serious, or minor injuries. The high correlation values (all Spearman coefficients > 0.98) demonstrate the model’s robustness: spatial risk rankings remain consistent, even under substantial variation in injury severity assumptions.
5.2. Policy Scenario Simulation
To test the contextual sensitivity of our model, we constructed a forward-looking policy scenario reflecting coordinated urban policy interventions. Specifically, for block groups with above-median employment density, we applied the following changes:
Employment Density: Increased by 20%;
Car Ownership (% 2+ Cars):Reduced by 10%;
Bar/Restaurant Density: Increased by 30%.
These adjustments represent a hypothetical but plausible scenario in which urban centers experience job growth, reduced vehicle ownership due to improved public or micromobility options, and a growing entertainment economy. We applied the changes to the dataset and re-estimated the Bayesian hierarchical model using the same structure and priors. Under the adjusted data, we found the following changes in posterior mean coefficients:
The effect of car ownership increased by approximately 47%, suggesting that in a lower-car environment, relative differences in car prevalence have a greater influence on crash risk.
The bar/restaurant density coefficient decreased by 22%, potentially indicating saturation or spatial overlap with employment zones.
The employment density effect decreased by 11%, consistent with diminishing marginal influence.
The effect of the working-age population remained negligible.
The scenario also resulted in higher predicted risk values in many downtown blocks, aligning with expectations given the more intensive land use. Importantly, the rank order of high-risk areas remained stable, confirming the model’s interpretability and structural robustness. These findings underscore the value of the Bayesian hierarchical model in both retrospective analysis and scenario-based planning.
6. Conclusions
This study developed a rigorous Bayesian hierarchical model to quantify e-scooter crash risk at the block-group level across Texas. By integrating rich crash data from the Texas CRIS database with detailed socioeconomic and built environment covariates, the analysis provided a nuanced understanding of how local context influences crash frequencies. The modeling framework incorporates region-specific random effects alongside a spatially structured conditional autoregressive (CAR) prior for neighboring block groups, enabling the capture of unobserved heterogeneity and spatial dependence in crash risk. This comprehensive approach represents a methodological advancement in e-scooter safety analysis, combining multi-level modeling with spatial smoothing to reflect the complexity of urban crash patterns better.
The results demonstrate that the spatial Bayesian hierarchical model offers superior fit and predictive performance compared to simpler alternatives. Across multiple model specifications, the inclusion of hierarchical structure and spatial effects significantly improved the goodness of fit to the crash-count data, underscoring the importance of accounting for both regional differences and local spatial autocorrelation. The final model’s predictions proved robust and stable, benefiting from the partial pooling of information: even block groups with sparse data yielded reliable risk estimates by borrowing strength from broader regional trends and neighboring areas. This robustness was further evidenced by the consistency of the identified high-risk locations under alternative modeling assumptions, confirming that the model’s risk estimates are not unduly sensitive to specific parameter choices.
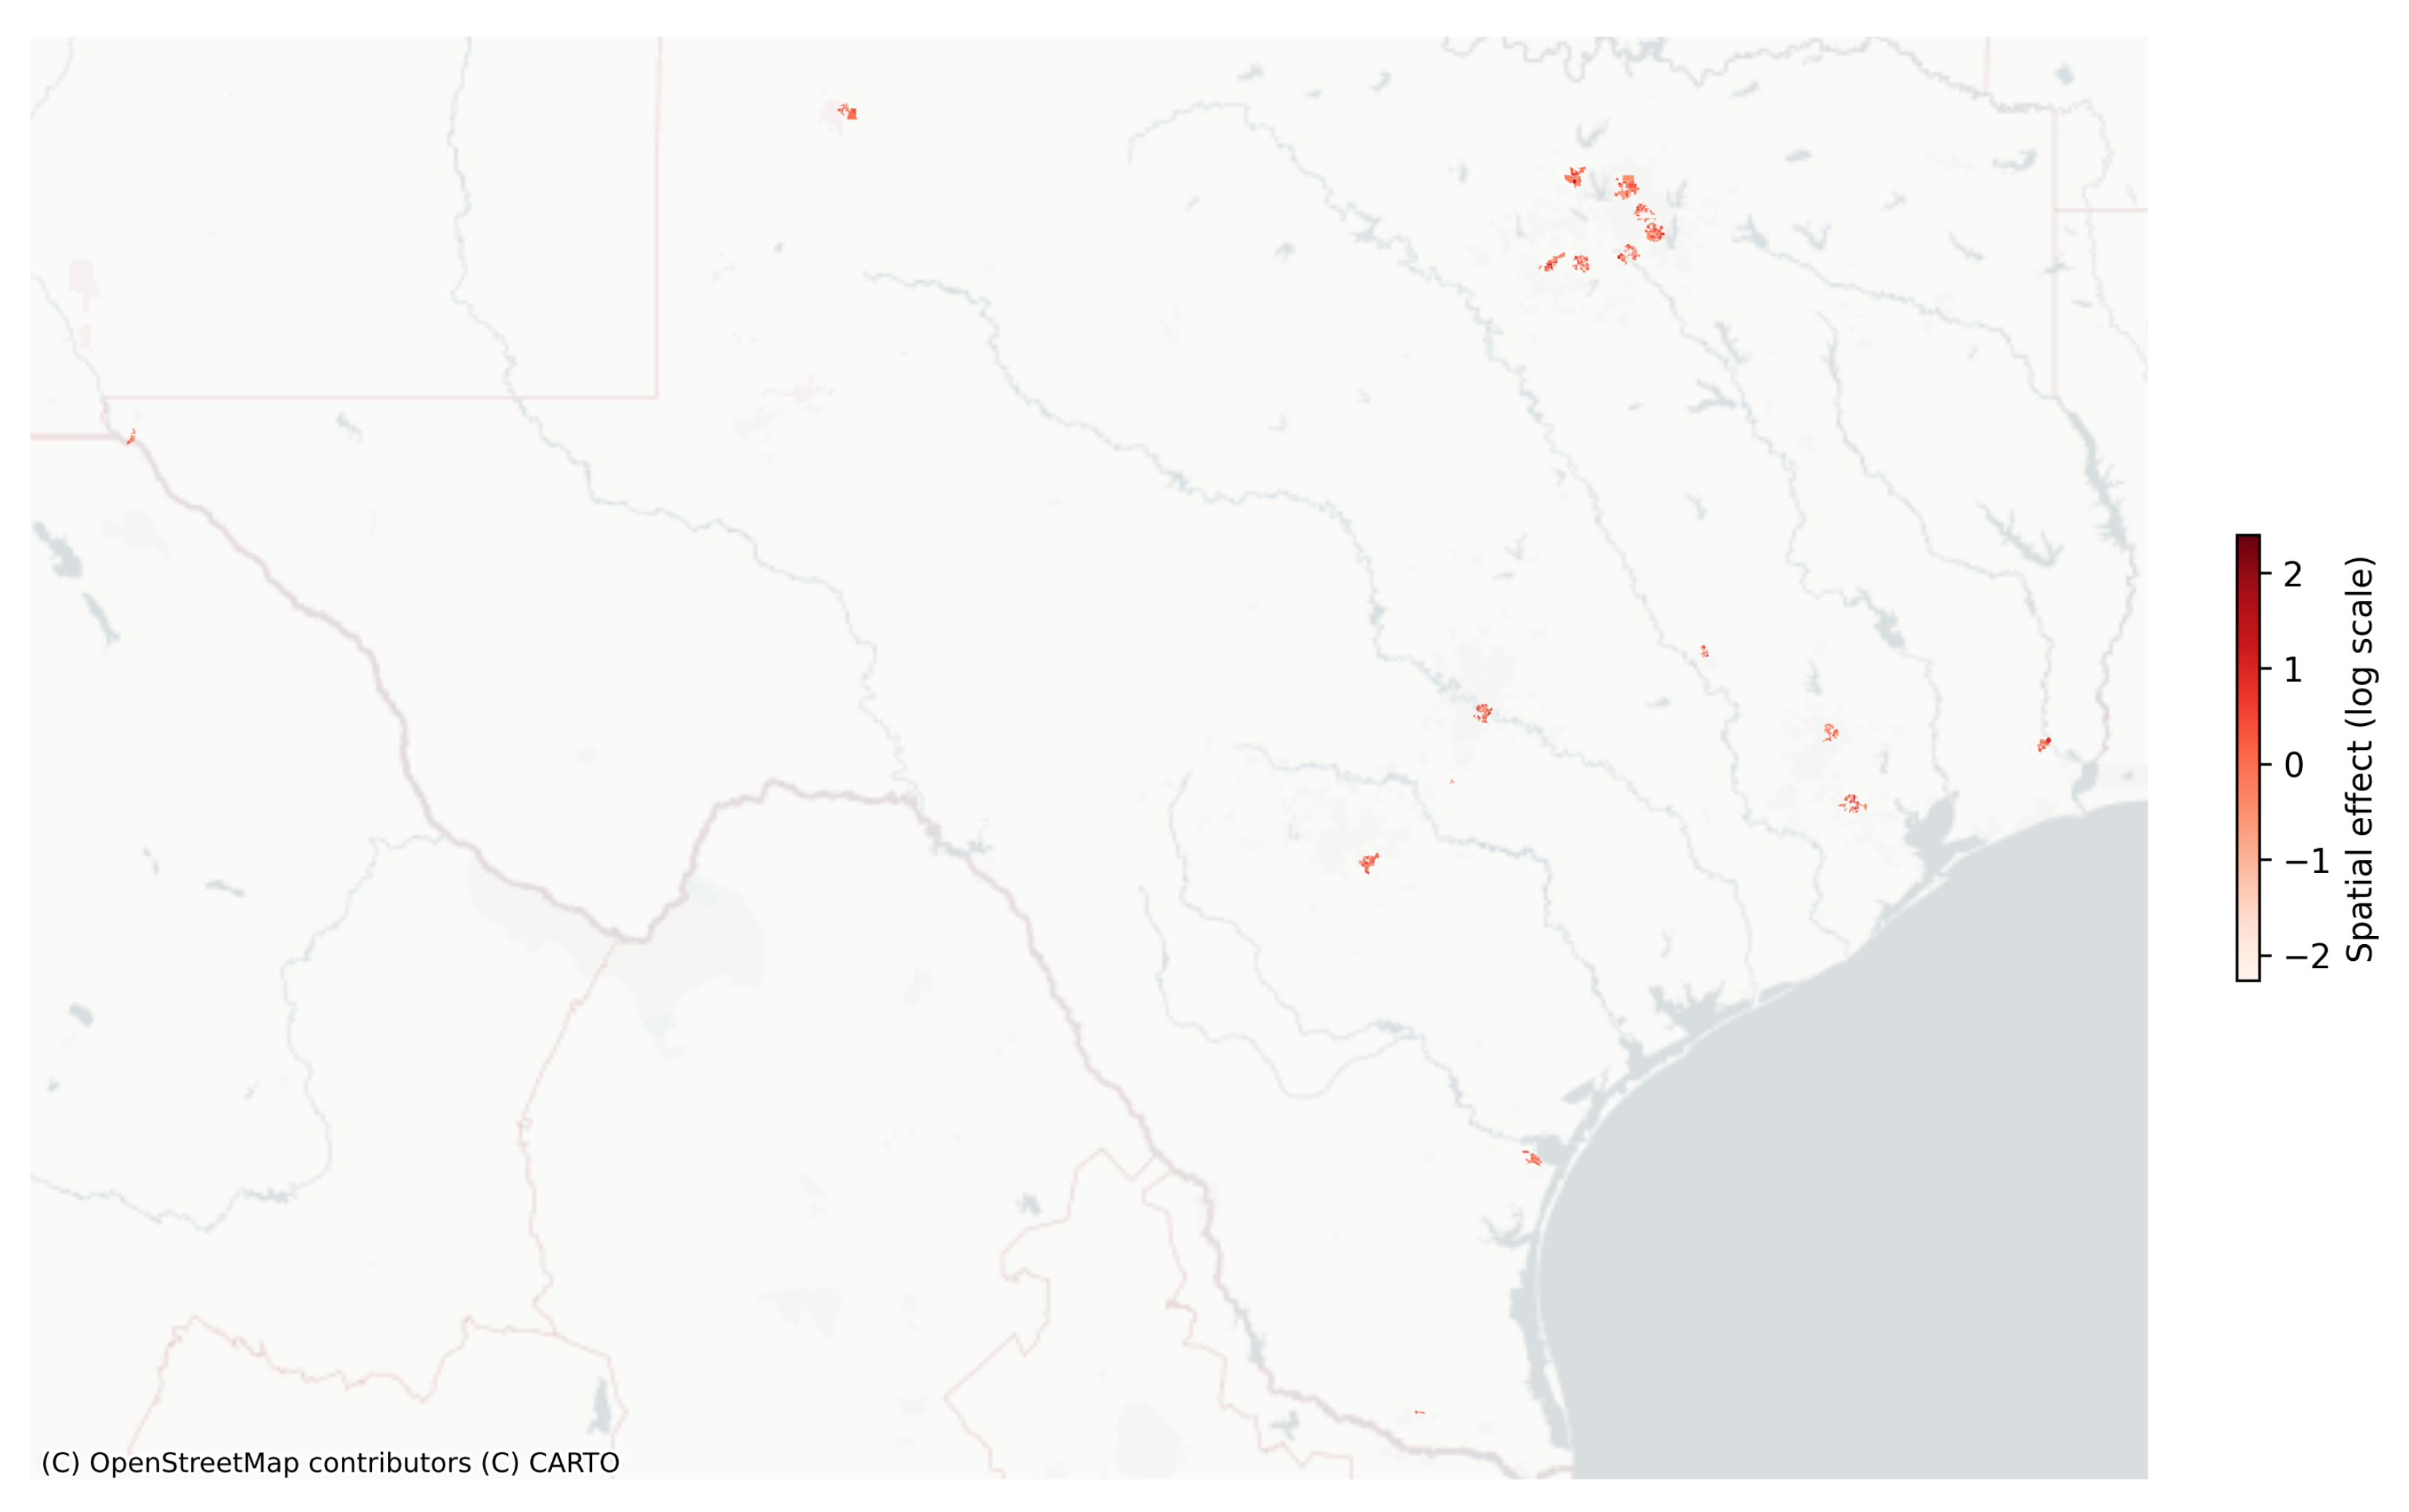
In addition to its strong performance, the model revealed valuable insights into the geography of e-scooter crash risk. The spatial random effects identified distinct clusters of elevated risk that align with intuitive high-activity zones. In particular, urban nightlife districts and downtown areas with high employment density emerged as consistent hotspots for e-scooter crashes, even after controlling for the measured covariates. These findings suggest that intense evening activity and concentrated economic centers contribute to greater exposure and interaction among e-scooter riders, vehicles, and pedestrians. Furthermore, block groups characterized by a high proportion of working-age residents were associated with higher crash frequencies. This demographic effect suggests that areas populated by adults in their prime working years, who are likely the predominant e-scooter user base, experience a disproportionately higher number of incidents, reflecting higher usage or exposure in those communities. By capturing such patterns, the spatial hierarchical model not only quantifies risk but also helps illuminate the underlying factors and latent spatial processes influencing e-scooter safety.
The conclusions of recent research conducted in various international contexts differ from those of this work, particularly in terms of factors such as automobile ownership, walkability, and population density. For instance, studies conducted in London [
16] and Milan [
45] discovered that e-scooter crashes tend to occur in locations that are very walkable and transit-rich. This is not only because of population density; it is also because of increased usage and multimodal activity. In Texas, however, these patterns can be influenced by the local climate and reliance on cars [
19]. Similarly, contrary to trends seen in car-oriented American cities, several studies have linked higher crash rates to regions with lower car ownership and higher public transportation use [
16]. Inequalities in demographics also surface: Low-income and minority neighborhoods were found to be high-risk areas in London studies, whereas in Texas, young adult populations and arterial exposure are more closely associated with accident risk [
16]. Context, data design, and modeling methodology are frequently the causes of these variations. To address sparse or highly localized accident data, other research prefers zero-inflated or geographically weighted models [
19]; this study, however, employed a Bayesian spatial framework to account for neighborhood variance and severity weighting. The contrast highlights that e-scooter crash correlations are not universal and that local infrastructure, usage patterns, and analytical decisions all influence modeling results. This highlights the importance of tailoring safety evaluations to the specific spatial and policy context.
E-scooters have emerged as a promising component of sustainable urban mobility, yet their societal benefits involve important trade-offs. For example, replacing car trips with e-scooters can reduce tailpipe emissions, but life-cycle assessments show that manufacturing, deployment, and charging practices can offset these environmental gains [
46]. At the same time, safety and equity challenges are evident: inadequate infrastructure (e.g., a lack of safe bike lanes) and safety concerns are frequently cited as barriers to e-scooter use, and these issues can disproportionately affect certain demographic groups of riders [
47]. Such concerns are not unique to Texas—cities worldwide face similar micro-mobility safety issues as e-scooter adoption grows [
48]. Addressing these challenges requires a multifaceted approach. Improved understanding of rider behavior and vehicle performance can inform targeted interventions [
49], and recent research highlights the value of vehicle design enhancements (for instance, larger wheels and integrated turn signals to improve stability). Equally important are supportive policies and infrastructure investments: harmonized regulations, dedicated riding space, and public education campaigns have all been recommended to bolster e-scooter safety [
46,
48]. Situating our Texas-based findings within this broader context suggests that many of our insights, such as the influence of urban form and infrastructure on crash risk, are likely generalizable to other regions, provided that local conditions are considered. Ultimately, proactively addressing the equity, environmental, and safety dimensions of e-scooter programs will help ensure that this new mode of travel contributes positively to sustainable and inclusive urban mobility.
Overall, this research highlights the value of a Bayesian spatial hierarchical approach in modeling micro-level crash data for emerging mobility modes. The proposed model delivers robust predictions of e-scooter crash risk and successfully delineates both the contributions of observable factors and the impact of latent spatial influences. These contributions strengthen the analytical foundation for understanding e-scooter crash dynamics and demonstrate a robust framework for safety modeling that can be applied to complex urban transportation systems. Future work should incorporate micromobility fleet data (e.g., trip counts, durations, and spatial traces) to calibrate exposure better and refine crash-rate estimates. Additionally, qualitative research methods, such as rider surveys or observational fieldwork, could help explain the behavioral factors underlying localized crash patterns that are not captured by current covariates.


