
Understanding Spatial–Temporal Patterns in Trespassing on Railway Property


Abstract
1. Introduction
2. Background
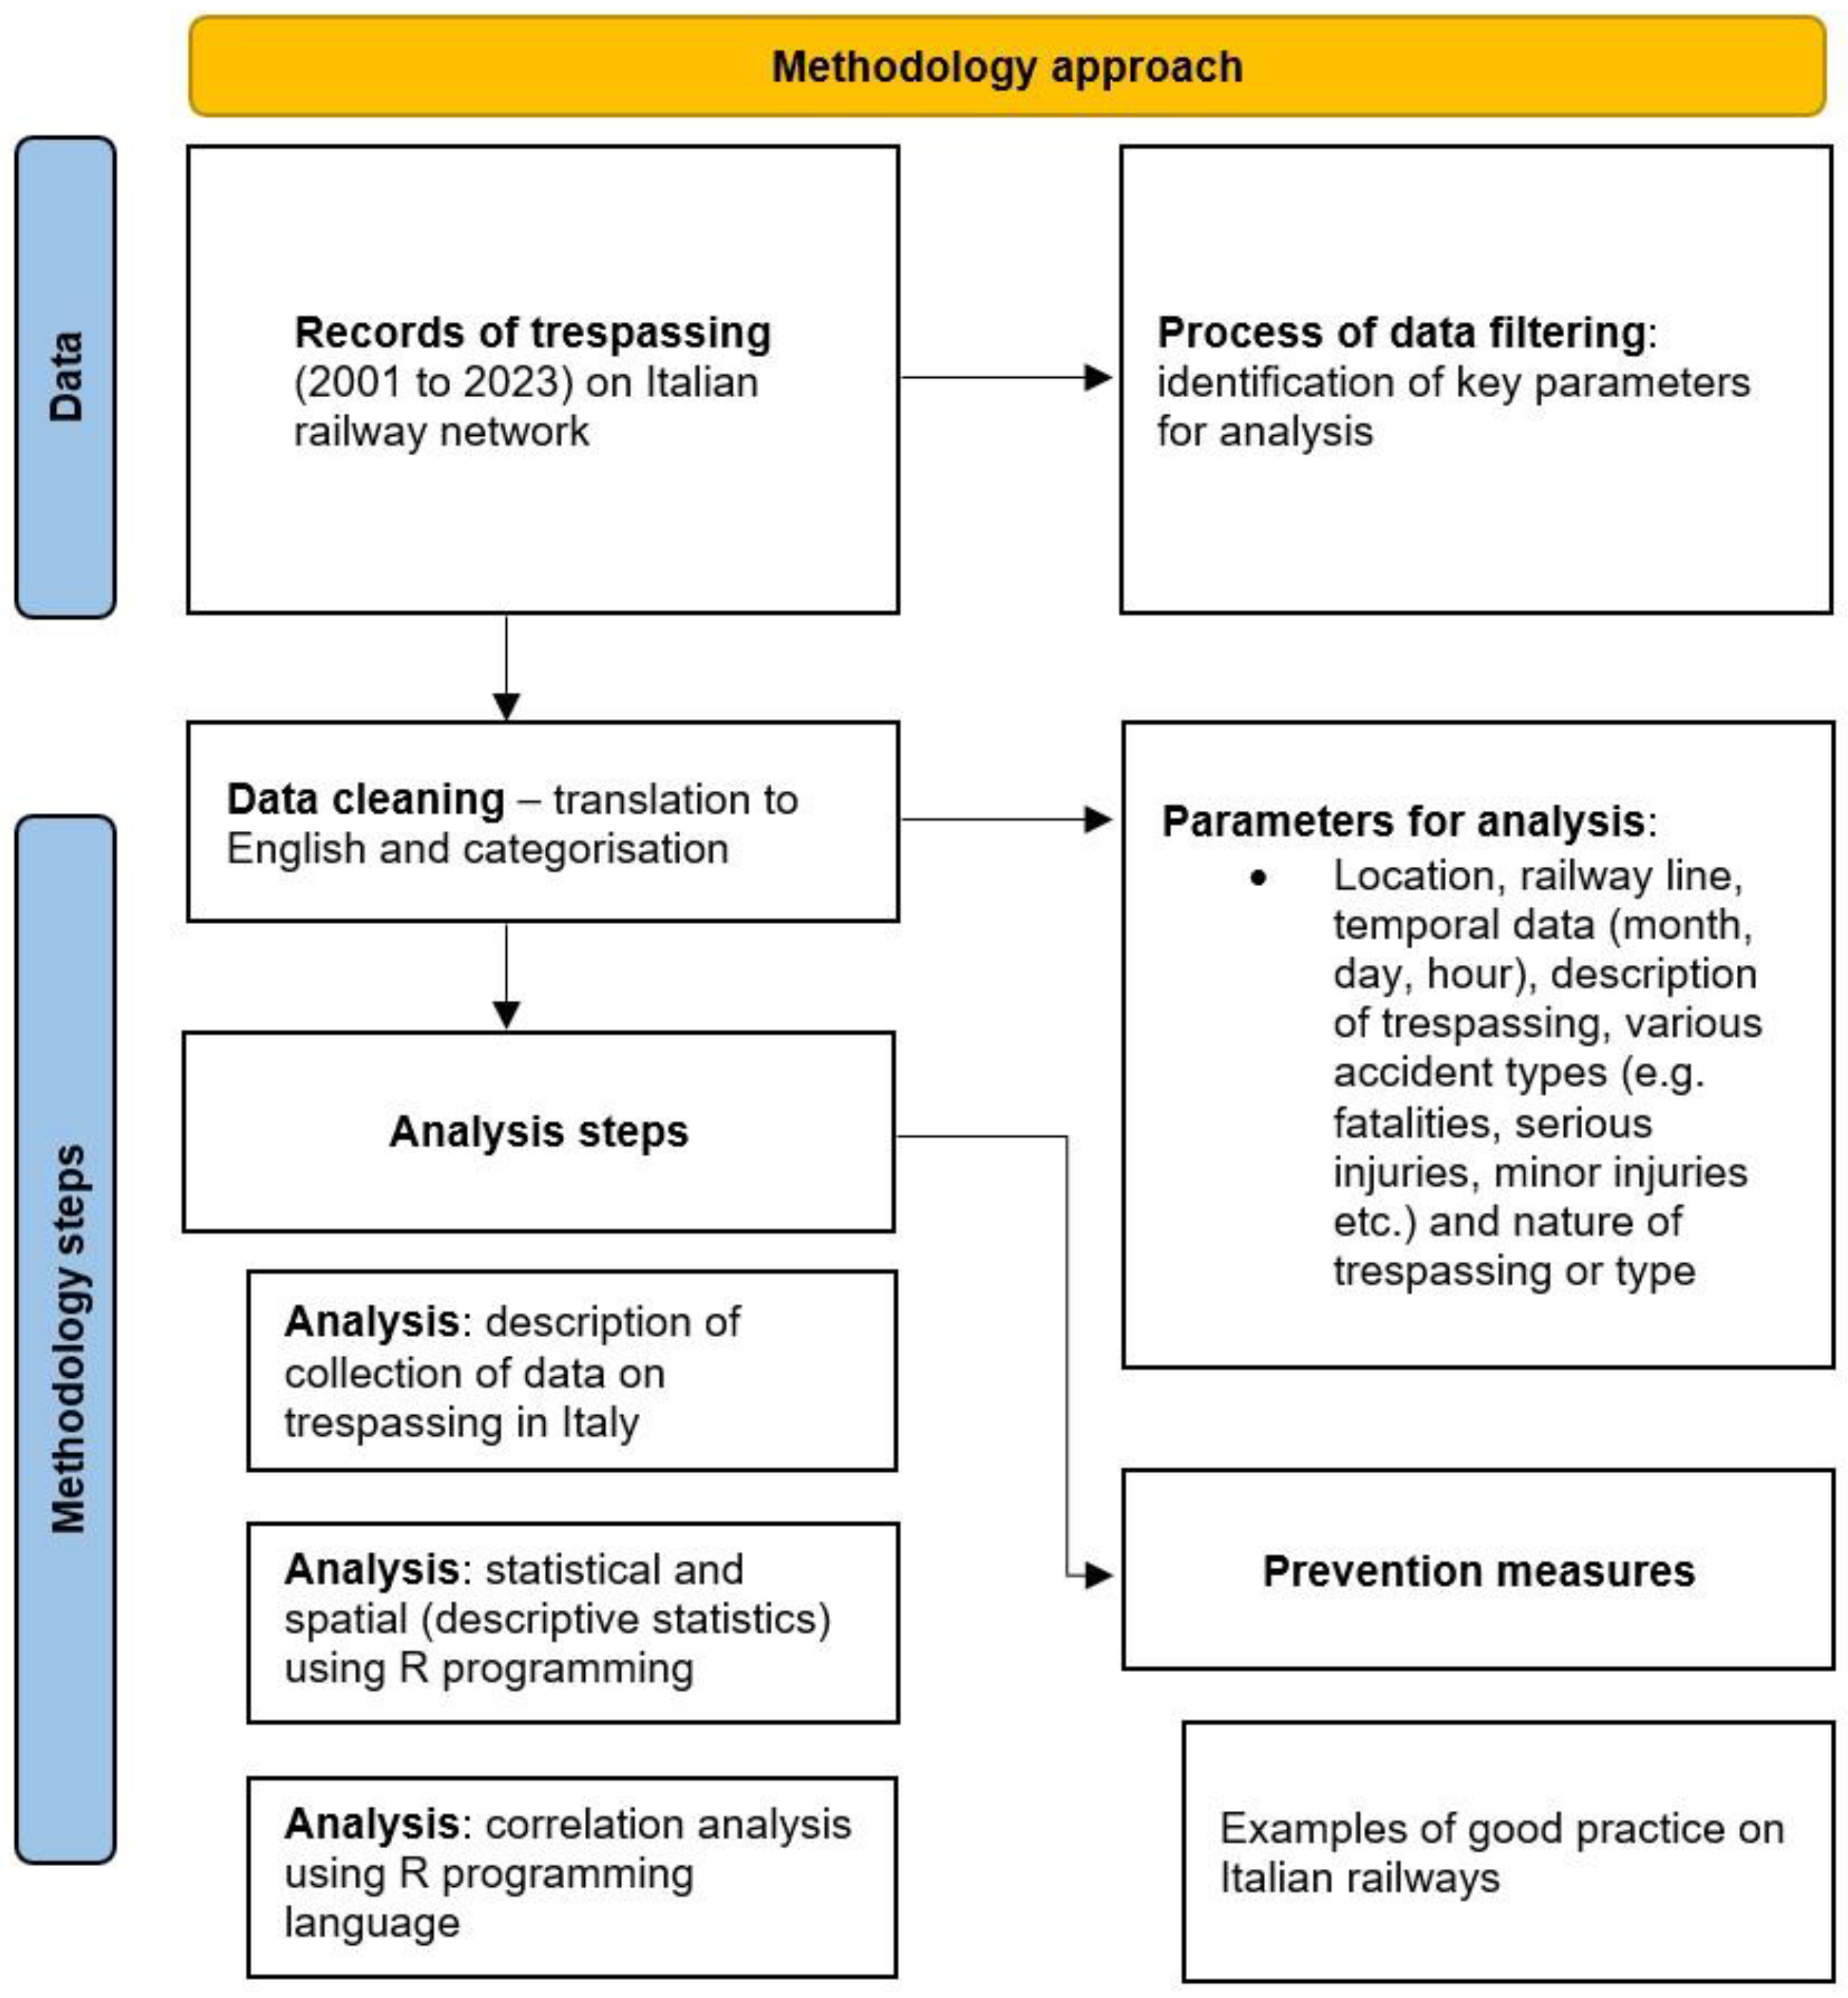
3. Methodology
3.1. Location
3.2. Data Collection
3.3. Analysis and Method
3.4. Tools (Software)
4. Results
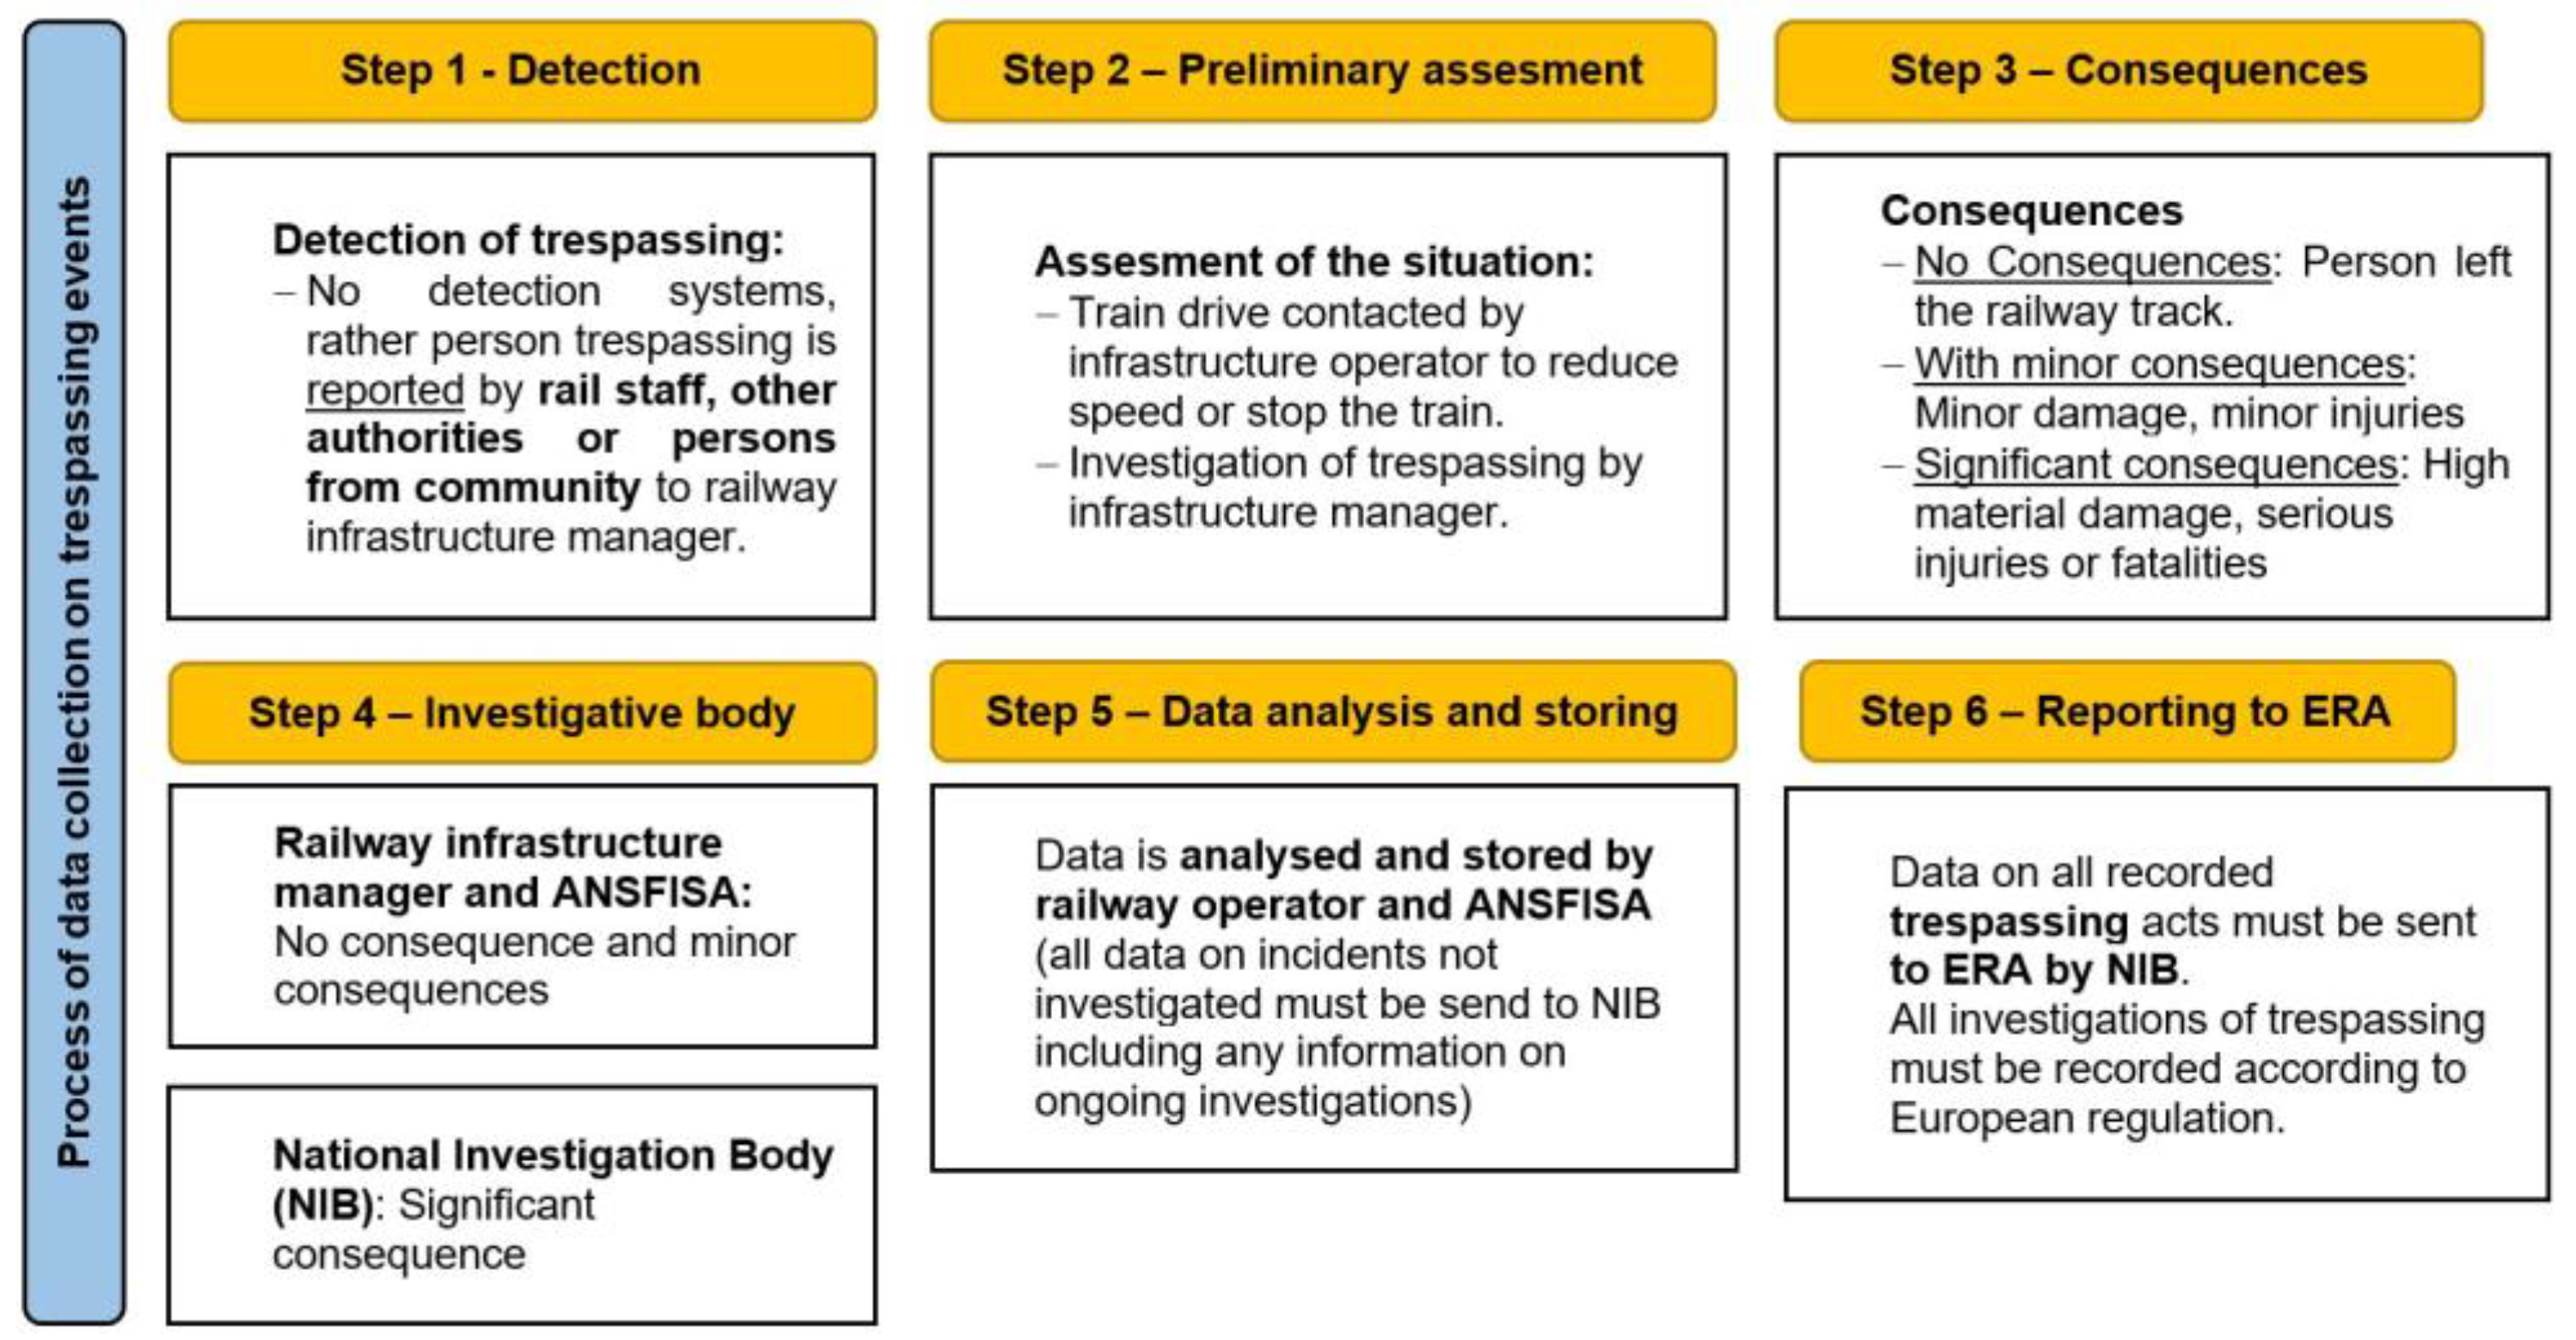
4.1. Data Collection on Trespassing in Italy
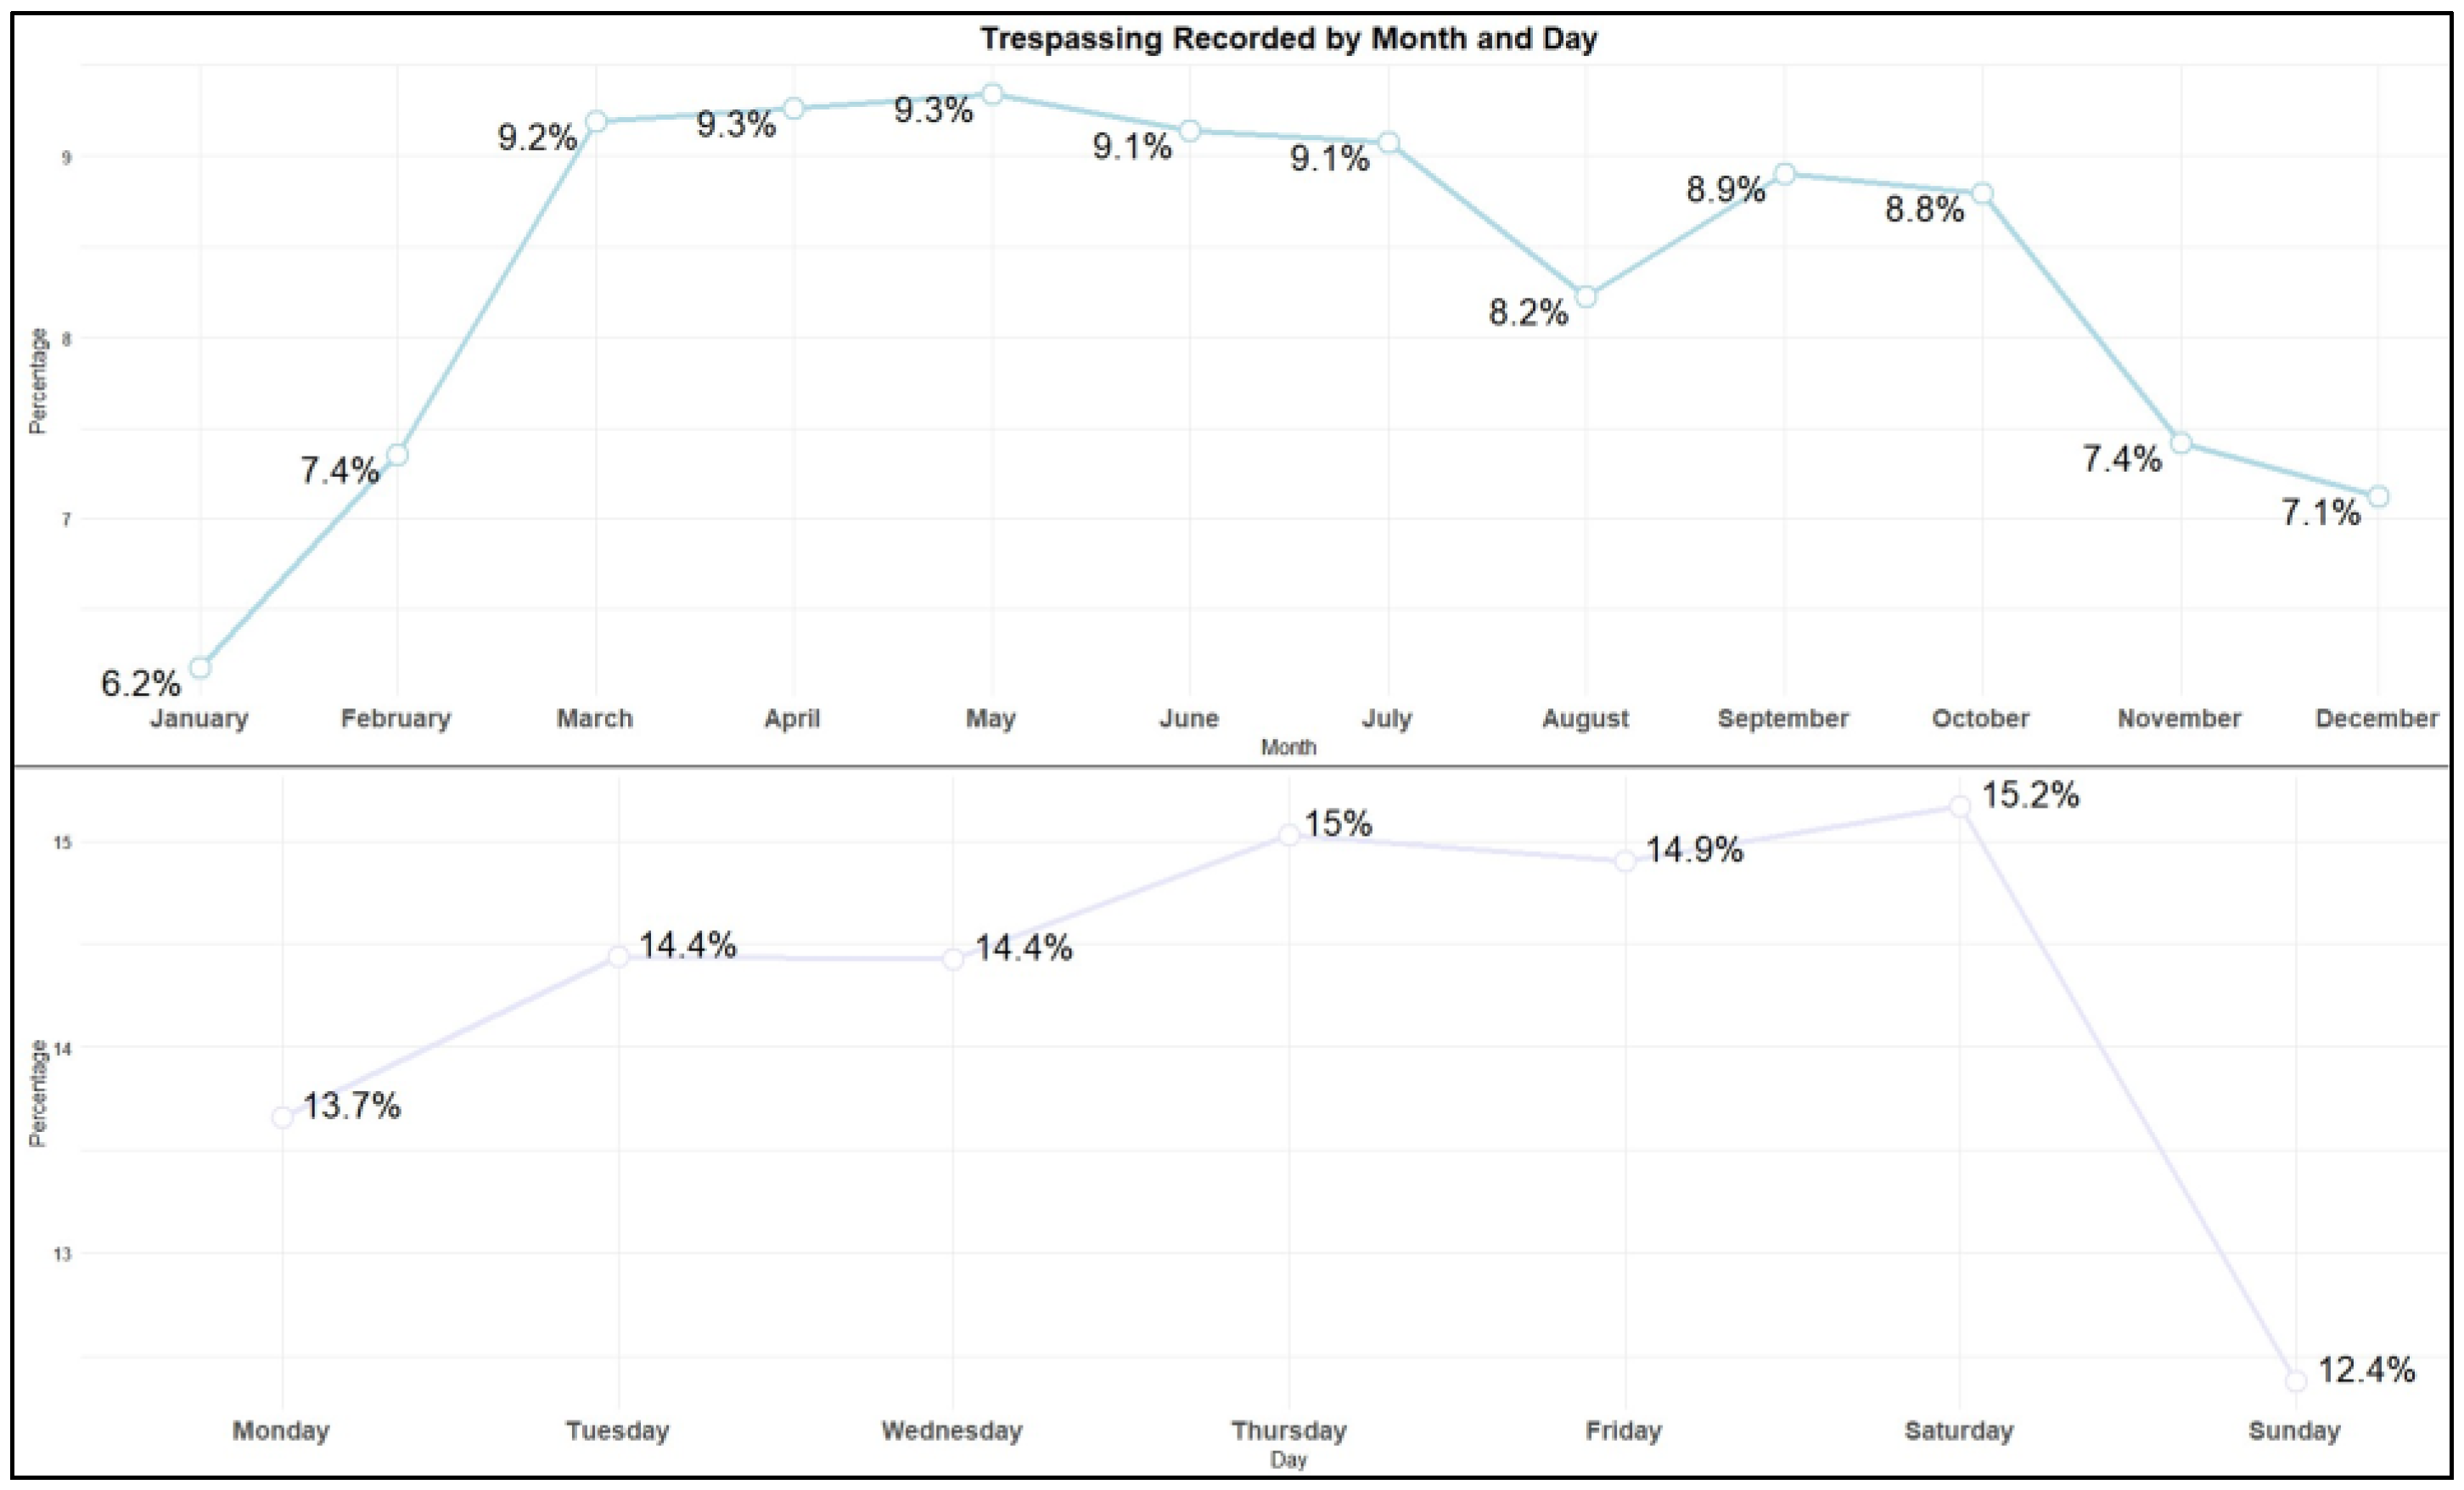
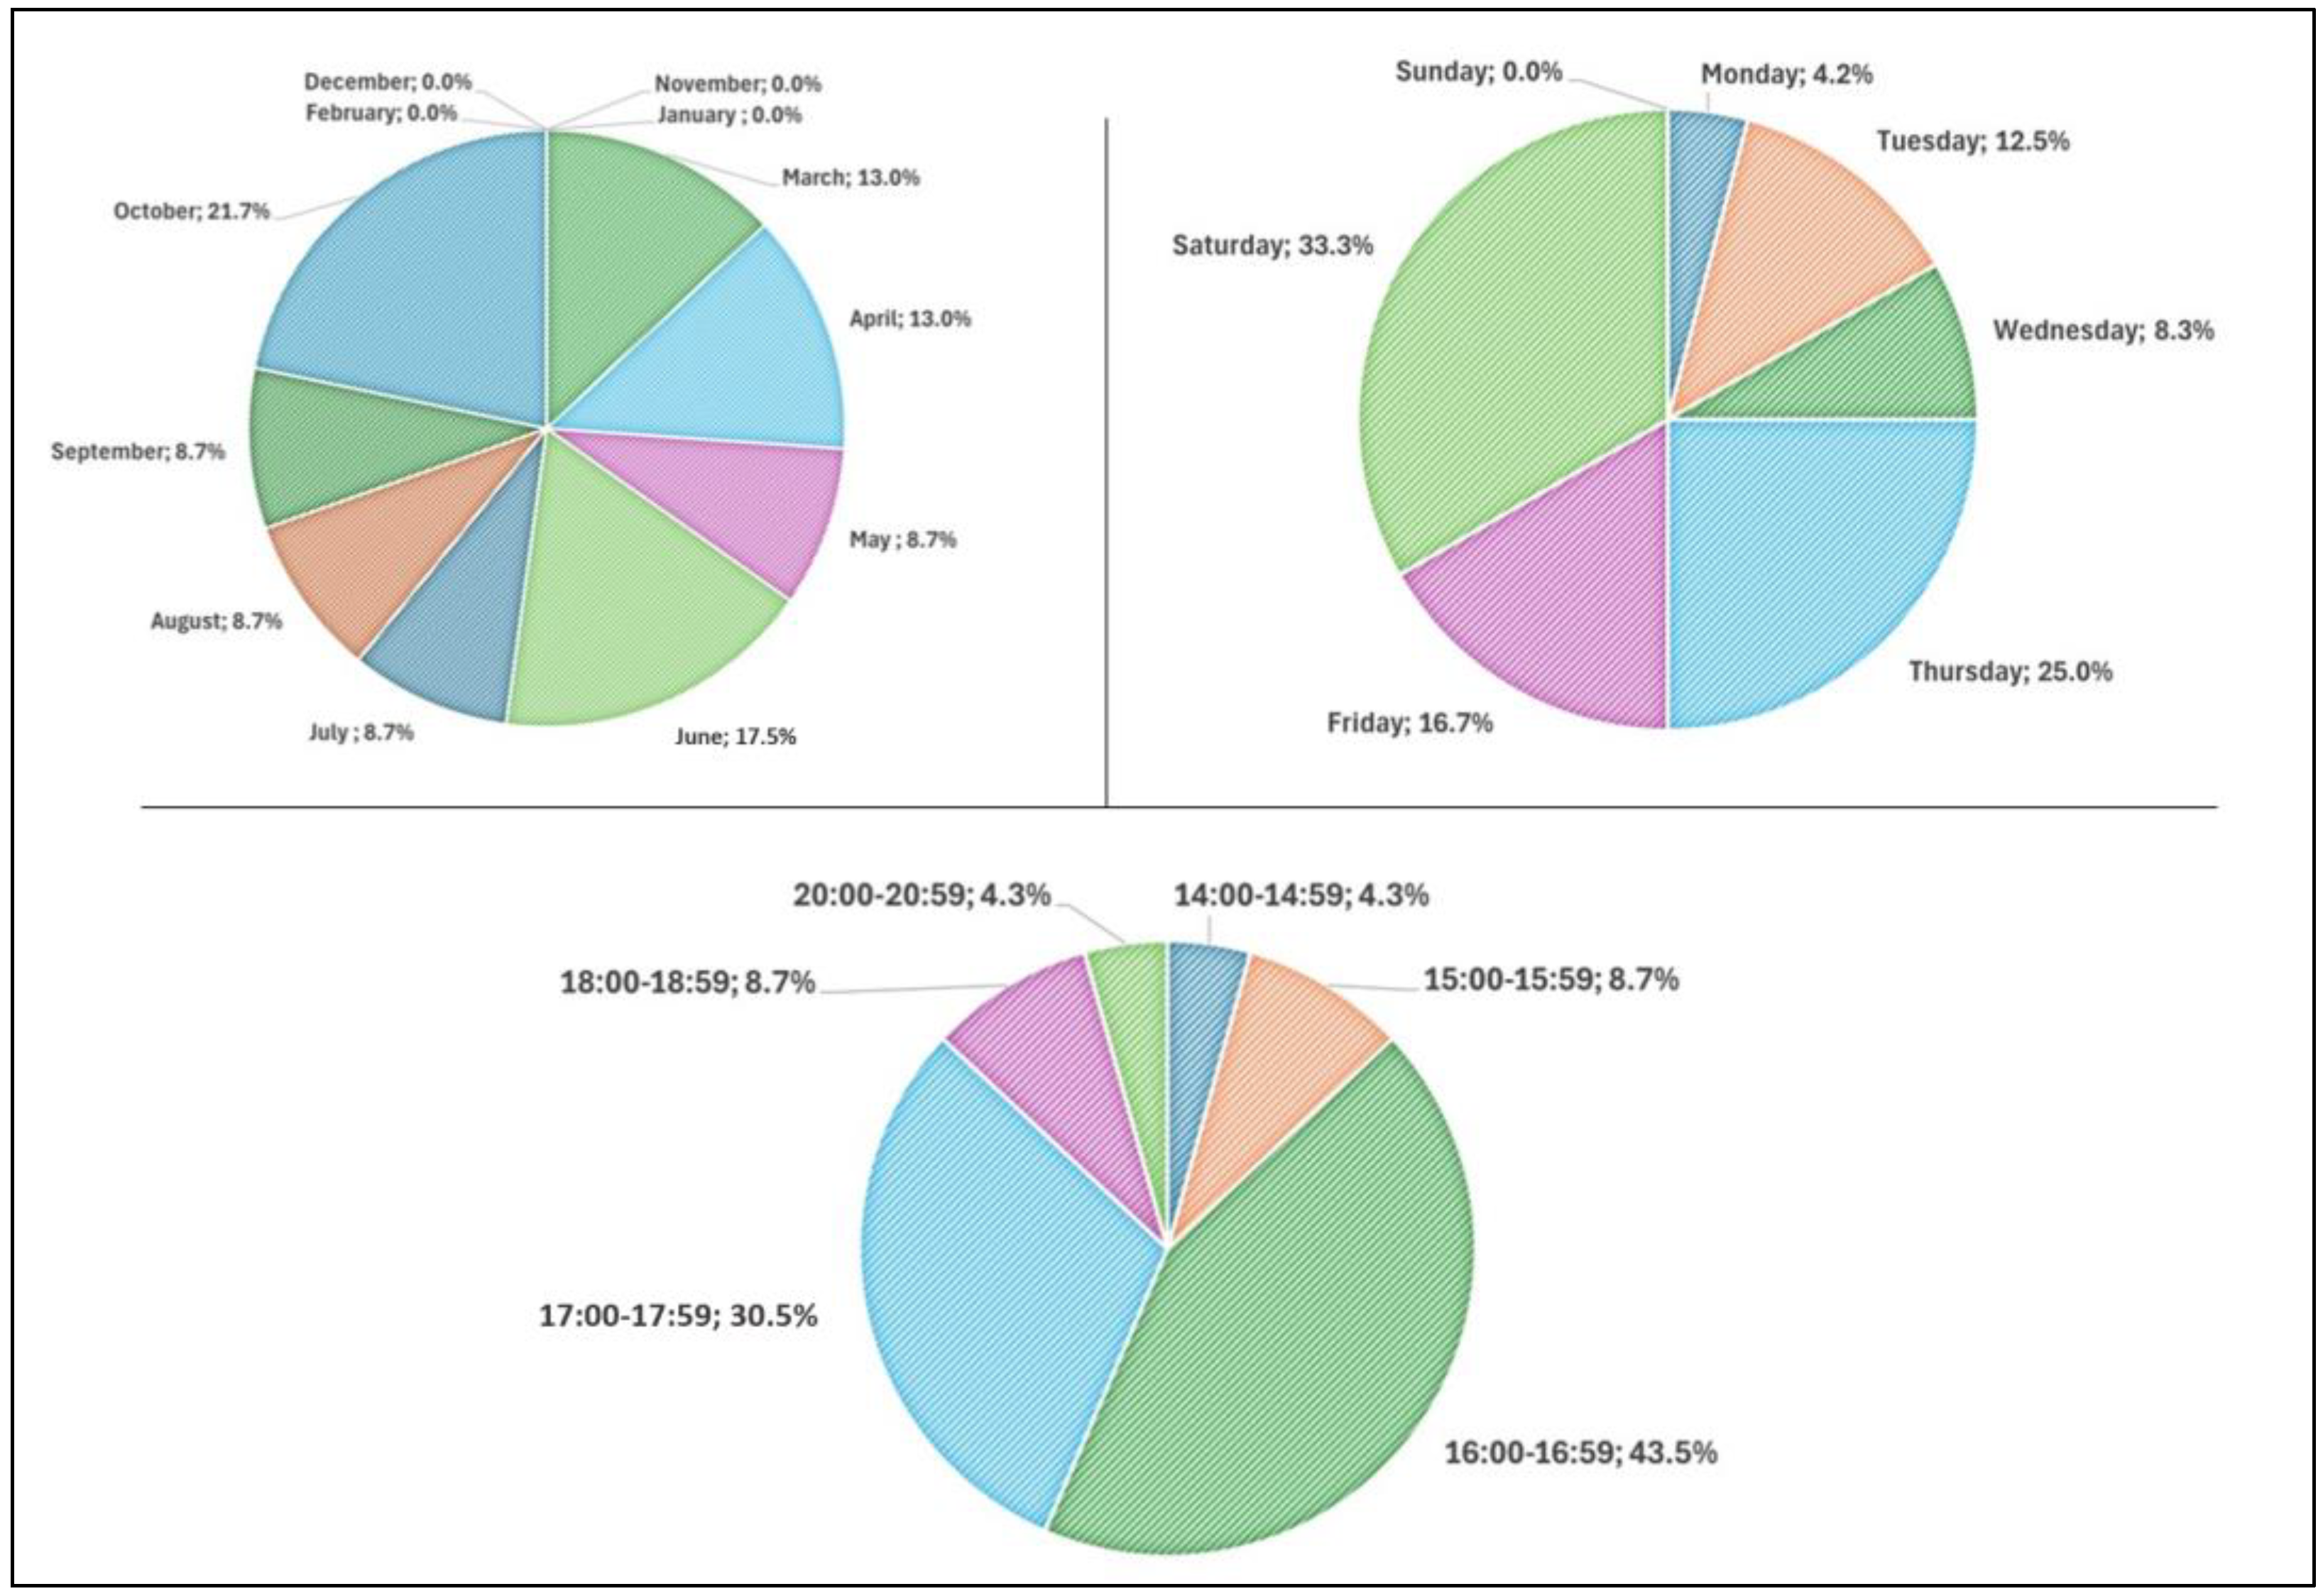
4.2. Descriptive Statistics of Trespassing on Italian Railway Network, Italy
4.3. Relationship Analysis
4.3.1. Correlation Analysis
4.3.2. Association Analysis
4.4. Trespassing Prevention Measures on the Italian Railway Network
4.5. Summary of Results
5. Discussion
6. Conclusions
Author Contributions
Funding
Institutional Review Board Statement
Informed Consent Statement
Data Availability Statement
Acknowledgments
Conflicts of Interest
References
- European Parliament and the Council. Directive (EU) 2016/798 on Railway Safety. European Union, Bruxelles; European Parliament and the Council: Brussels, Belgium, 2016. [Google Scholar]
- Havarneanu, G.; Topel, K. Rail Trespassing and Suicide: What Can Be Done to Improve Safety? Transportation Research Board, TR News, July 2019; pp. 23–29. ISSN 0738-6826. [Google Scholar]
- Network Rail (UK). Vandalism and Trespass. Available online: https://www.networkrail.co.uk/running-the-railway/looking-after-the-railway/delays-explained/vandalism-and-trespass/ (accessed on 15 December 2024).
- Official Gazette. Presidential Decree No. 753; Polygraphic Institute and State Mint: Rome, Italy, 1980; p. 21. [Google Scholar]
- Infrabel. Trespassers. Available online: https://opendata.infrabel.be/explore/dataset/spoorlopers/information/?disjunctive.kwartaal&disjunctive.indicator_id_en (accessed on 15 December 2024).
- Eurostat. Railway Safety Statistics in the EU. 2022. Available online: https://ec.europa.eu/eurostat/statistics-explained/index.php?title=Railway_safety_statistics_in_the_EU (accessed on 15 December 2024).
- Network Rail (UK). Media Centre. Available online: https://www.networkrailmediacentre.co.uk/news/at-least-two-people-risk-their-lives-on-the-railway-every-hour-network-rail-issues-new-trespass-safety-warning-as-holiday-season-begins (accessed on 15 December 2024).
- SNCF. Preventing Risk-Taking on Railways. Available online: https://www.sncf-reseau.com/fr/reseau/securite-ferroviaire/preventing-risk-taking-railways (accessed on 15 December 2024).
- Hž Infrastructure. Annual Safety Report; Public edition. 2023. Available online: https://www.hzinfra.hr/naslovna/odnosi-s-javnoscu/publikacije/ (accessed on 15 December 2024).
- Office of Safety Analysis. Trespasser Casualties. Federal Railroad Administration Washington, SAD. 2023. Available online: https://safetydata.fra.dot.gov/officeofsafety/publicsite/query/castally4.aspx (accessed on 15 December 2024).
- TrackSafe Foundation. Fatalities, Injuries and near Misses on the Australian Heavy Rail Network 2001–2022; TrackSafe Foundation: Canberra, Australia, 2022. [Google Scholar]
- Sapienza University of Rome, Faculty of Civil and Industrial Engineering. Internal Documentation; Sapienza University of Rome: Rome, Italy, 2024. [Google Scholar]
- Lerer, L.B.; Matzopoulos, R. Meeting the Challenge of Railway Injury in a South African City. Lancet 1996, 348, 664–666. [Google Scholar] [CrossRef] [PubMed]
- Patterson, T. Analysis of Trespasser Accidents; Land Transport Safety Authority: 2004. Available online: https://www.nzta.govt.nz/assets/resources/trespasser-accidents-analysis/docs/trespasser-accidents.pdf (accessed on 15 December 2024).
- Akkaş, M.; Ay, D.; Metin Aksu, N.; Günalp, M. 10-Year Evaluation of Train Accidents. Ulus. Travma Acil Cerrahi Dergisi 2011, 17, 440–444. [Google Scholar] [CrossRef]
- Singha, M.K. Study of Railway Fatalities in Barpeta, Assam. Res. Rev. J. Toxicol. (RRJoT) 2017, 7, 16–20. [Google Scholar]
- Silla, A.; Kallberg, V.-P. The Development of Railway Safety in Finland. Accid. Anal. Prev. 2012, 45, 737–744. [Google Scholar] [CrossRef]
- Savage, I. Analysis of Fatal Train-Pedestrian Collisions in Metropolitan Chicago 2004–2012. Accid. Anal. Prev. 2016, 86, 217–228. [Google Scholar] [CrossRef]
- Nixon, J.; Corcoran, A.; Fielding, L.; Eastgate, J. Fatal and Nonfatal Accidents on the Railways—A Study of Injuries to Individuals. with Particular Reference to Children and to Nonfatal Trauma. Accid. Anal. Prev. 1985, 17, 217–222. [Google Scholar] [CrossRef]
- Mohanty, M.K.; Panigrahi, M.K.; Mohanty, S.; Patnaik, K.K. Death Due to Traumatic Railway Injury. Med. Sci. Law 2007, 47, 156–160. [Google Scholar] [CrossRef] [PubMed]
- Shapiro, M.J.; Luchtefeld, W.B.; Durham, R.M.; Mazuski, J.E. Traumatic Train Injuries. Am. J. Emerg. Med. 1994, 12, 92–93. [Google Scholar] [CrossRef]
- Blazar, P.E.; Dormans, J.P.; Born, C.T. Train Injuries in Children. J. Orthop. Trauma 1997, 11, 126–129. [Google Scholar] [CrossRef]
- Limosin, F.; Loze, J.-Y.; Cothereau, C.; De Beaurepaire, C.; Payan, C.; Conso, F.; Hautecouverture, S.; Rouillon, F. A Prospective Study of the Psychological Effects of “Person under Train” Incidents on Drivers. J. Psychiatr. Res. 2006, 40, 755–761. [Google Scholar] [CrossRef]
- Silla, A.; Luoma, J. Trespassing on Finnish Railways: Identification of Problem Sites and Characteristics of Trespassing Behaviour. Eur. Transp. Res. Rev. 2009, 1, 47–53. [Google Scholar] [CrossRef]
- Skladana, P.; Skládaný, P.; Tučka, P. Attitudes of Inhabitants Living in the Vicinity of Railroads on the Matter of Trespassing on the Railway. Trans. Transp. Sci. 2019, 10, 31–40. [Google Scholar] [CrossRef]
- Silla, A.; Luoma, J. Opinions on Railway Trespassing of People Living Close to a Railway Line. Saf. Sci. 2012, 50, 62–67. [Google Scholar] [CrossRef]
- Pelletier, A. Deaths among Railroad Trespassers: The Role of Alcohol in Fatal Injuries. JAMA 1997, 277, 1064–1066. [Google Scholar] [CrossRef] [PubMed]
- Davis, G.G.; Alexander, C.B.; Brissie, R.M. A 15-Year Review of Railway-Related Deaths in Jefferson County, Alabama. Am. J. Forensic Med. Pathol. 1997, 18, 363–368. [Google Scholar] [CrossRef]
- Rådbo, H.; Svedung, I.; Andersson, R. Suicides and Other Fatalities from Train-Person Collisions on Swedish Railroads: A Descriptive Epidemiologic Analysis as a Basis for Systems-Oriented Prevention. J. Saf. Res. 2005, 36, 423–428. [Google Scholar] [CrossRef]
- Rådbo, H.; Andersson, R. Patterns of Suicide and Other Trespassing Fatalities on State-Owned Railways in Greater Stockholm; Implications for Prevention. Int. J. Environ. Res. Public Health 2012, 9, 772–780. [Google Scholar] [CrossRef]
- Skládaná, P.; Skládaný, P.; Tučka, P.; Bidovský, M.; Sulíková, B. Trespassing Railway Property—Typology of Risk Localities. Transp. Res. Procedia 2016, 14, 2091–2100. [Google Scholar] [CrossRef]
- Kučerová, I.; Skládaná, P.; Strnadová, Z. Attitudes of Children and Youth to Railway Trespassing. J. Our Soc. Arch. 2019, 1, 27–52. [Google Scholar] [CrossRef]
- Kang, Y.; Iranitalab, A.; Khattak, A. Modeling Railroad Trespassing Crash Frequency Using a Mixed-Effects Negative Binomial Model. Int. J. Rail Transp. 2019, 7, 208–218. [Google Scholar] [CrossRef]
- Austin, R.D.; L. Carson, J. An Alternative Accident Prediction Model for Highway-Rail Interfaces. Accid. Anal. Prev. 2002, 34, 31–42. [Google Scholar] [CrossRef] [PubMed]
- Italian Railway Network. Information on Railway Network. Available online: https://www.rfi.it/it/rete/la-rete-oggi.html (accessed on 4 January 2025).
- Italian Railway Network. Network Information Sheet. Rome. 2024. Available online: https://www.rfi.it/en/Network/The-network-today.html (accessed on 15 December 2024).
- European Union Agency for Railways (ERA). NIB Network—European Network of Rail Accidents National Investigation Bodies. Available online: https://www.era.europa.eu/agency/stakeholder-relations/national-investigation-bodies/nib-network-european-network-rail-accidents-national-investigation-bodies_en (accessed on 4 January 2025).
- Legislative Decree No. 50 of May 14, 2019—Implementation of Directive 2016/798 of the European Parliament and of the Council of 11 May 2016 on Railway Safety; European Union: Bruxelles, Belgium, 2019.
- Galli, A.; Genovesi, P.; Guerrucci, L.; Franco, A.; Marinacci, C.; Ricci, S. Railway Safety and Operation: Reforms, Innovations and Investments for an Integrated Market. In Proceedings of the 5th National Conference; Ricci, S., Ed Ricci, S., Impastato, S., Eds.; H-Index: Rome, Italy, 2017; pp. 69–79. ISBN 8825508069. [Google Scholar]
- ANSFISA (National Agency for Railway and Highway Safety). Italian Railway Network: Annual Reports on Railway Safety (2007–2023); ANSFISA: Roma, Italy, 2023.
- European Union Agency for Railways (ERA). National Safety Authorities and National Investigation Bodies Annual Reports; ERA: Valenciennes, France, 2023; Available online: https://www.era.europa.eu/library/national-safety-authorities-and-national-investigation-bodies-annual-reports (accessed on 15 December 2024).
- European Union Agency for Railways (ERA). Safety Management System (SMS). Available online: https://www.era.europa.eu/domains/safety-management/safety-management-system-sms_en (accessed on 6 January 2025).
- European Union Agency for Railways (ERA). Railway Accident and Incident Investigations; ERA: Valenciennes, France, 2024; Available online: https://www.era.europa.eu/domains/accident-incident/rail-accident-investigation_en (accessed on 15 December 2024).
- Italian Railway Network. Official Website. Available online: https://www.rfi.it/en/about-us.html (accessed on 8 January 2025).
- Italian Railway Network. Roma Ostiense (Timetable). Available online: https://www.rfi.it/it/stazioni/roma-ostiense.html (accessed on 8 January 2025).
- Italian Railway Network. Asset Protection. Official Website. 2024. Available online: https://www.rfi.it/en/stations/station-page/quality-services/Gates-and-video-surveillance.html (accessed on 15 December 2024).
- Sapienza University of Rome, Faculty of Civil and Industrial Engineering. Internal Report; Sapienza University of Rome: Rome, Italy, 2024. [Google Scholar]
- Italian Railway Network. Safety on the Train and at the Station. Available online: https://www.fsitaliane.it/content/fsitaliane/it/innovazione/tecnologie-per-i-trasporti/sicurezza-in-treno-e-in-stazione.html (accessed on 9 January 2025).
- Italian Railway Network. Rules for Your Safety. Available online: https://www.fsitaliane.it/content/fsitaliane/it/sostenibilita/persone/politiche-sociali/campagne-di-sensibilizzazione/regole-una-sicurezza-per-la-tua-sicurezza.html (accessed on 9 January 2025).
- Italian Railway Network. Rules. A Safety for Your Security. Available online: https://www.fsitaliane.it/content/fsitaliane/it/media/news/2023/4/24/campagna-sicurezza-polo-infrastrutture-gruppo-fs-2023.html (accessed on 9 January 2025).
- Polizia di Stato—Italian National Police. Official Website. (Railway Initiatives). Available online: https://www.poliziadistato.it/articolo/34965 (accessed on 9 January 2025).


| Test | Variables | Pearson’s Product–Moment Correlation | Spearman’s Correlation Test |
|---|---|---|---|
| Test one | (1) Hour of trespassing (2) Minor injuries |
|
|
| Test two | (1) Hour of trespassing (2) Serious injuries |
|
|
| Test three | (1) Hour of trespassing (2) Fatalities |
|
|
| Visual Element | Interpretation | Analysis |
|---|---|---|
Dark red | Strong overrepresentation of trespassing type in the DTP area (observed >> expected) | Significantly more types of trespassing than expected. |
Light red | Mild overrepresentation of types of trespassing in the DTP area | Mildly more types of trespassing than expected. |
Dark blue | Strong underrepresentation of trespassing type in the DTP area (observed << expected) | Significantly less types of trespassing than expected. |
Light blue | Mild underrepresentation of trespassing type in the DTP area | Mildly less types of trespassing than expected. |
| White | No meaningful deviation of trespassing type in the DTP area (observed ≈ expected) | The count of trespassing type is expected for the DTP area and no deviations are detected. |
Dash border | The dash border represents results that are statistically significant and examples are given on strong overrepresentation and mild overrepresentation. | |
Solid Border | The solid border represents results that are not statistically significant and the examples are given on strong underrepresentation or mild underrepresentation. | |
| Dash white Border  | Trespassing types are expected in the DTP area but not observed (strong underrepresentation of expected values with statistical significance). | |
| Solid white Border  | Observed values align with expectations (no significant deviation). | |
| Values −4 to 4 (Standardised Residuals) | Values −4 (strong overrepresentation) to 4 (strong underrepresentation) of trespassing types in DTP area. | |
| Measure Type/Status | Measure Name | Objective | Source |
|---|---|---|---|
| Detection | Cameras at railway station | Detection of trespassing at stations | [46] |
| Planned | AI cameras for detection at the station | AI detection of unusual behaviour and movement of people | [47] |
| Detection | Employment of railway staff or security guards | Rail staff or security guards responsible for monitoring and conducting sweeps of the railway area and tracks | [48] |
| Detection | Psychical barriers (e.g., fences, walls, etc.) | Prevention of access to railway areas and tracks | [46] |
| Infrastructure | Sign that informs users of the proximity of legal crossing | Traffic signs on roads or next to railway tracks that inform users of the distance to legal crossing (level crossing or pedestrian crossing) | [47] |
| Current | Safety rules | Rules for your safety behaviour in the railway environment | [49] |
| Signalisation | Additional safety rules | Awareness campaign on railway and road safety | [50] |
| Education | Project “Train… to be cool” | Aimed at students across Italy | [51] |
| Education | Initiatives “In piazza con lo sport” (“In the Square with Sport”) | Street events on railway safety organized across Italy | [51] |
| Education | Prevention Campaigns—BE CAREFUL! Make a difference | Posters and informational brochures | [51] |
| Summary | 10 |
| Research Question | Findings | Examination |
|---|---|---|
| How are data on trespassing events collected? |
|
|
| Frequent location of trespassing? |
|
|
| What type of trespassing event has the highest percentage of trespassing events? |
|
|
| Year, month, day, and hour with the highest percentage of trespassing events? |
|
|
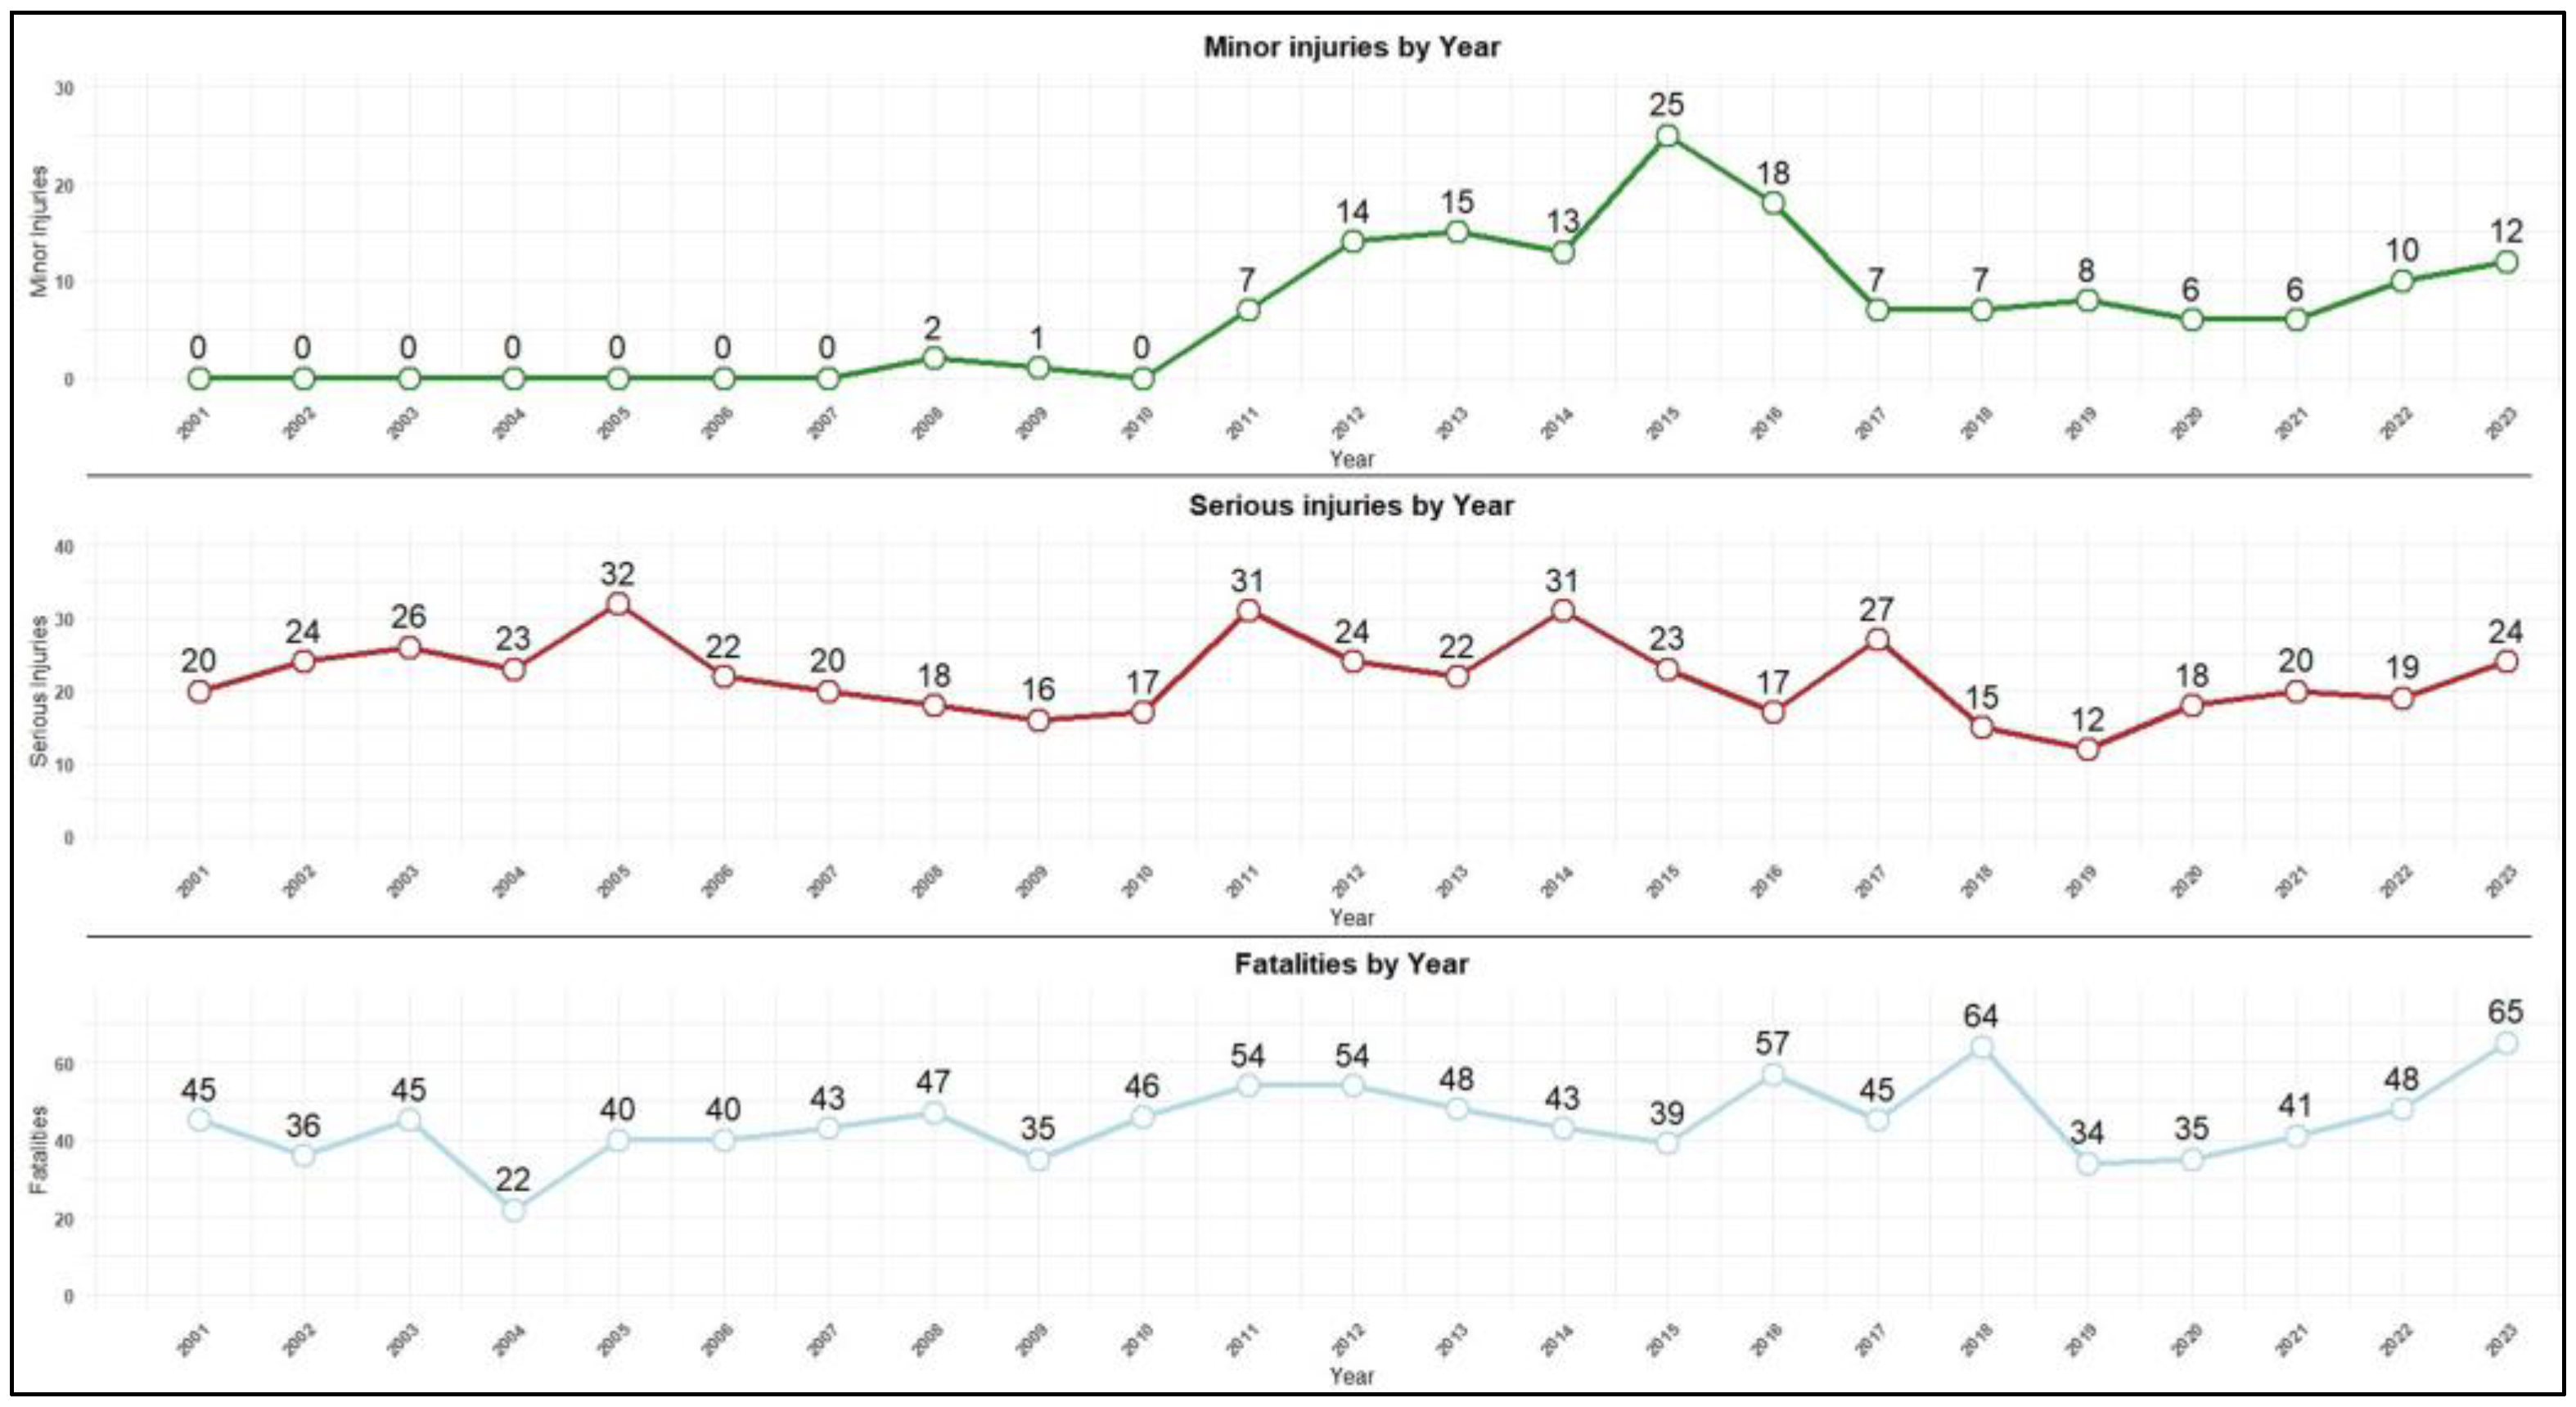
| The year with the highest number of minor injuries, serious injuries and fatalities? |
|
|
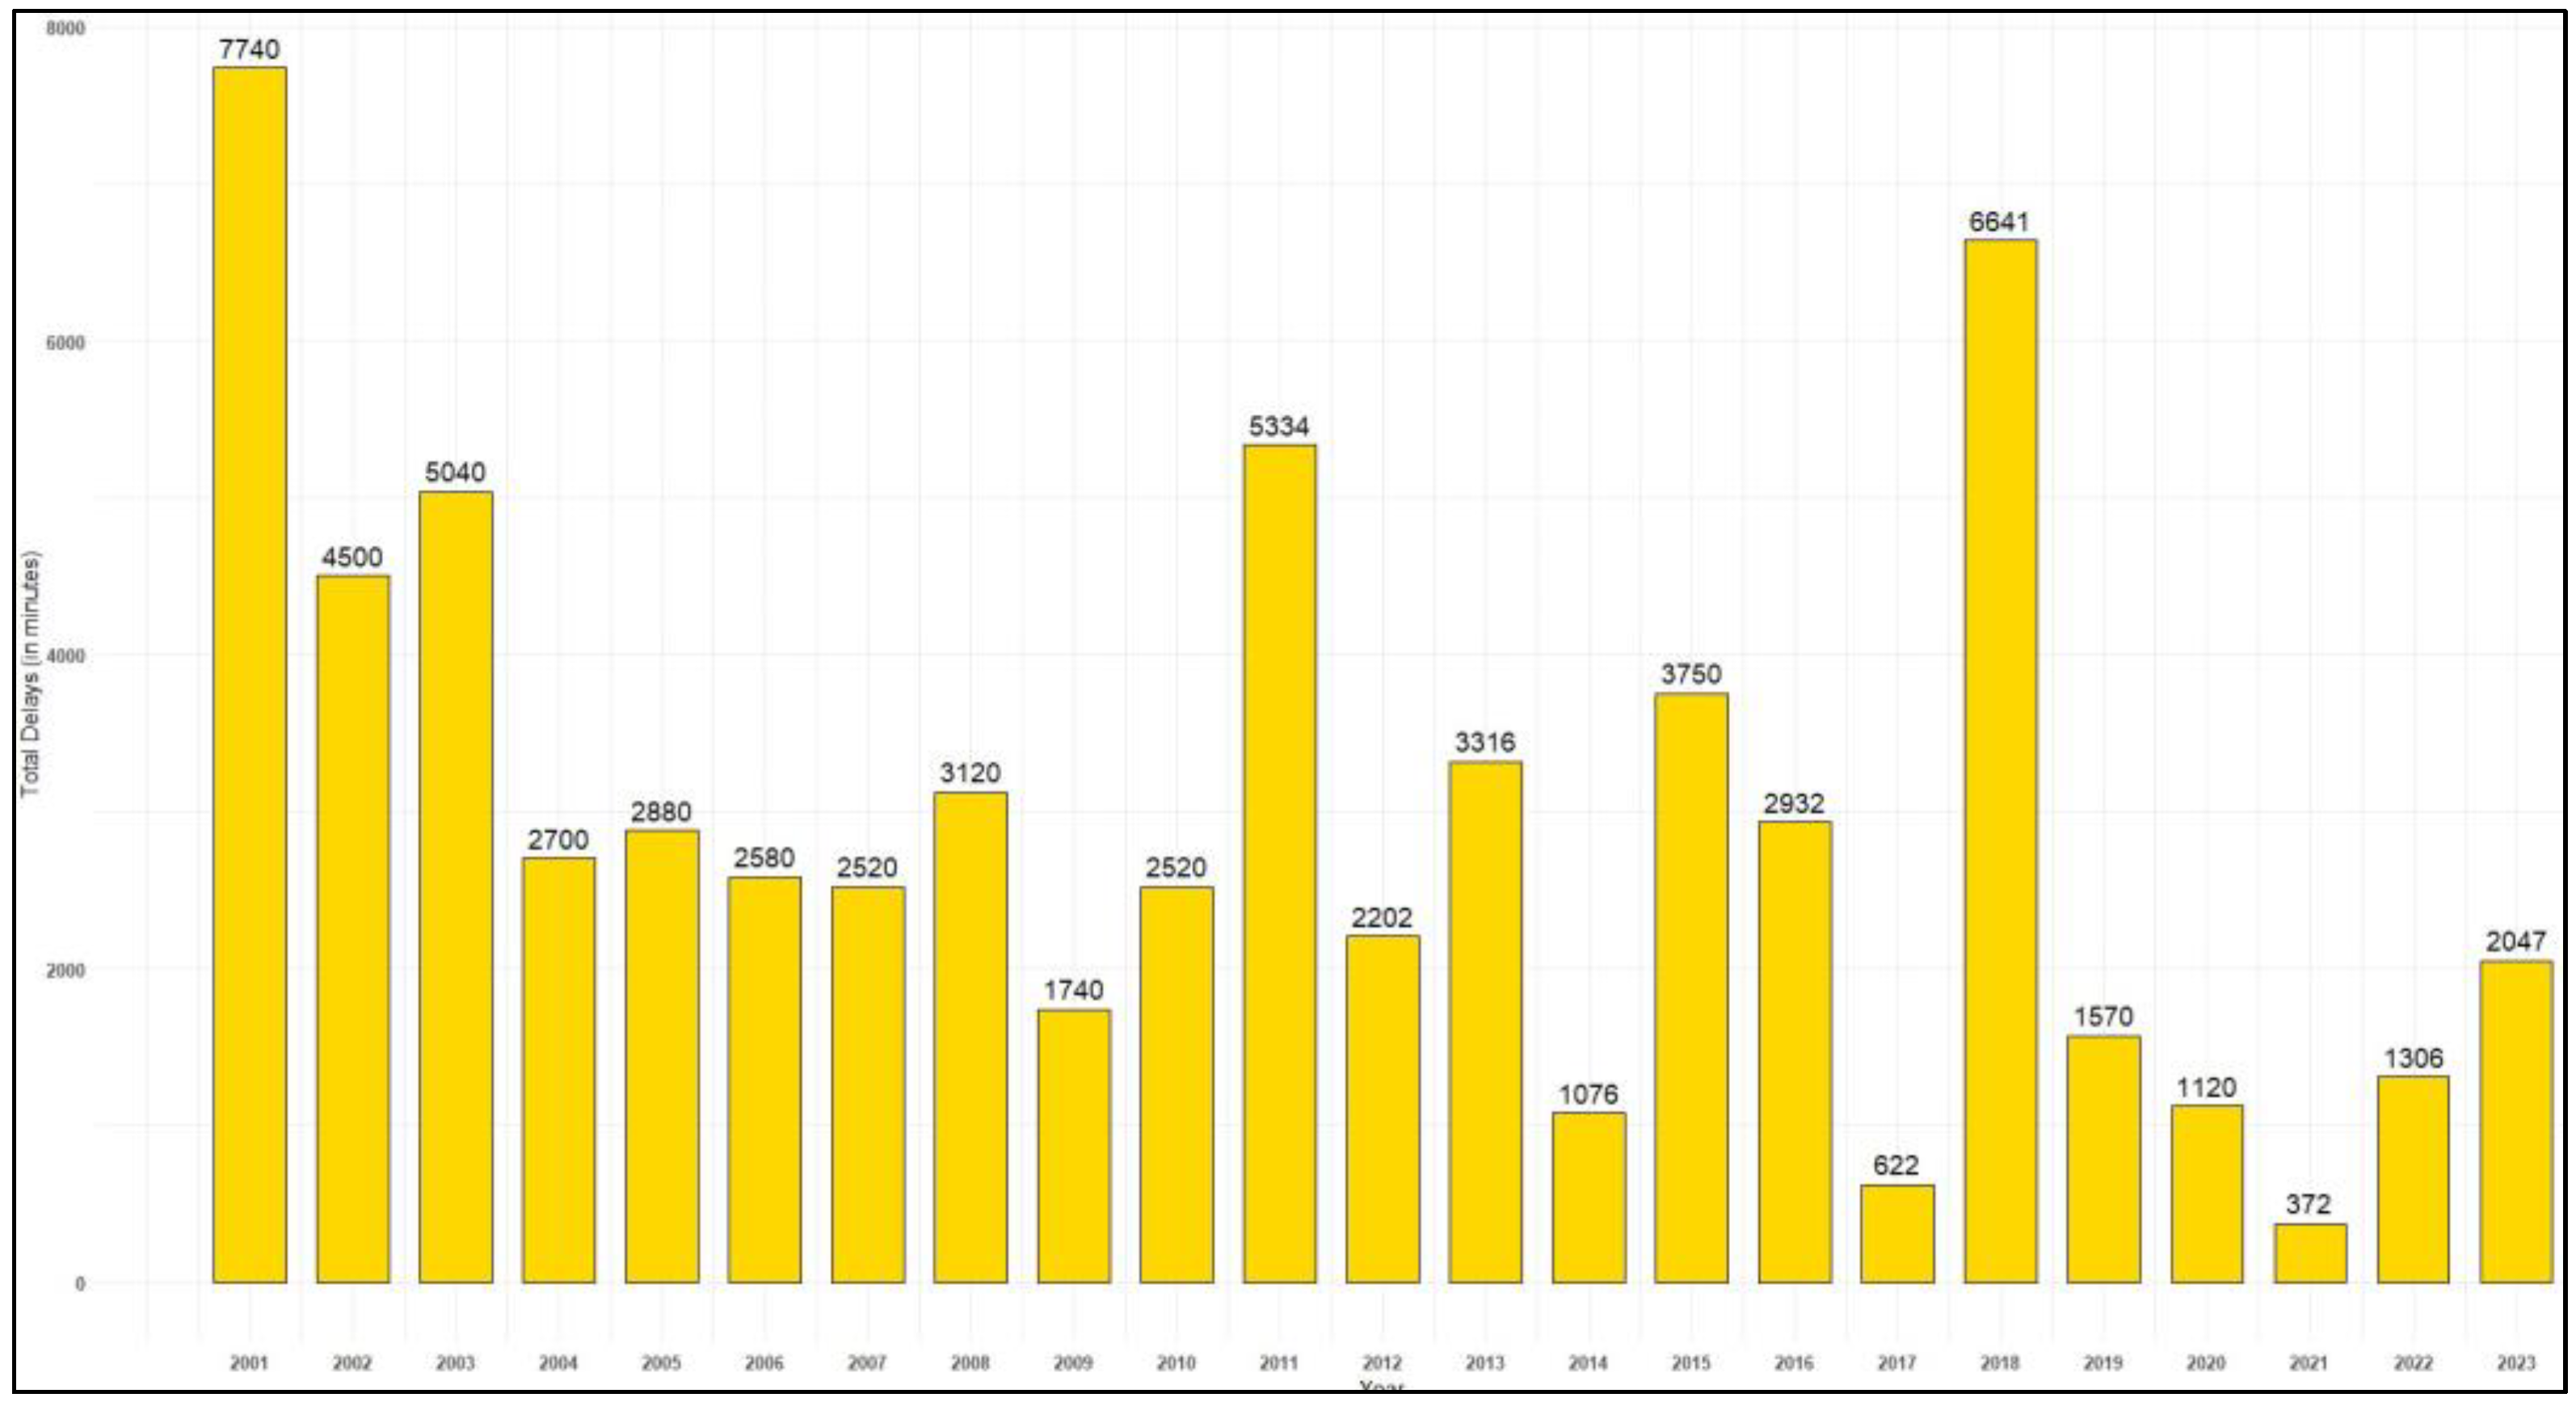
| The year with the highest total delays in rail traffic? |
|
|
| Correlation analysis: Tests one, two, and three |
|
|
| Frequency of trains |
|
|
| Association analysis |
|
|
| Prevention measures on the Italian railway network |
|
|
Disclaimer/Publisher’s Note: The statements, opinions and data contained in all publications are solely those of the individual author(s) and contributor(s) and not of MDPI and/or the editor(s). MDPI and/or the editor(s) disclaim responsibility for any injury to people or property resulting from any ideas, methods, instructions or products referred to in the content. |
© 2025 by the authors. Licensee MDPI, Basel, Switzerland. This article is an open access article distributed under the terms and conditions of the Creative Commons Attribution (CC BY) license (https://creativecommons.org/licenses/by/4.0/).
Share and Cite
Grabušić, S.; Barić, D.; Ricci, S. Understanding Spatial–Temporal Patterns in Trespassing on Railway Property. Safety 2025, 11, 55. https://doi.org/10.3390/safety11020055
Grabušić S, Barić D, Ricci S. Understanding Spatial–Temporal Patterns in Trespassing on Railway Property. Safety. 2025; 11(2):55. https://doi.org/10.3390/safety11020055
Chicago/Turabian StyleGrabušić, Silvestar, Danijela Barić, and Stefano Ricci. 2025. "Understanding Spatial–Temporal Patterns in Trespassing on Railway Property" Safety 11, no. 2: 55. https://doi.org/10.3390/safety11020055
APA StyleGrabušić, S., Barić, D., & Ricci, S. (2025). Understanding Spatial–Temporal Patterns in Trespassing on Railway Property. Safety, 11(2), 55. https://doi.org/10.3390/safety11020055