1. Introduction
Bicycles have become increasingly popular as a mode of transportation, driven by both professional commuting needs and recreational activities. Advances in bicycle design and materials have led to refined, ergonomic, and versatile models capable of achieving significant speeds. Moreover, bicycles are a key component of urban micromobility, providing an alternative to motor vehicles and public transport due to their cost-effectiveness, environmental benefits, and ability to bypass traffic congestion (e.g., [
1,
2,
3]). The development of bicycle-friendly infrastructure, such as dedicated cycling lanes, further supports this trend and contributes to improved safety conditions for cyclists. Additionally, the growth of bike-sharing systems has enabled more people to incorporate bicycles into their daily commutes, increasing their presence in urban traffic networks [
4,
5].
Currently, there is a noticeable shift in the transportation habits of residents in large cities. A survey conducted in Łódź, Poland, aimed to identify the motivations and factors driving the growing interest in public bicycles [
6]. The dynamic changes in urban mobility are largely influenced by the increasing popularity of bike-sharing systems, with congestion and inefficient public transport being the main reasons behind this trend. Another key aspect is the role of interactive maps, which support and enhance cycling mobility. The promotion of bicycles as a means of transport has been ongoing for years in the Netherlands, where a nationwide program was introduced to encourage commuting by bike and modernize bicycle parking facilities near railway stations. Expanding bike rental systems is another factor contributing to the rising interest in cycling [
7,
8]. Interestingly, Japan presents a contrasting trend—bicycle usage has been declining for approximately 40 years [
9].
Despite these positive developments, the issue of cyclist safety remains critical. Studies indicate that accidents involving cyclists often result in severe injuries, particularly head trauma, making safety measures a key concern for policymakers and urban planners [
10,
11]. Passive safety measures, such as helmets and energy-absorbing clothing, are widely recognized as essential in reducing injury severity [
12]. At the same time, active safety improvements—including modern braking systems, bicycle stabilization technologies, and collision-avoidance mechanisms—are being developed to minimize accident risks [
13,
14].
Infrastructure plays a crucial role in cyclist safety. Research highlights that well-designed bicycle paths, free from sharp or rigid obstacles, can significantly reduce accident rates [
15,
16]. Cyclists themselves are also a valuable source of information for road infrastructure designers [
17]. Additionally, segregating bicycle traffic from motor vehicles has been shown to lower the likelihood of serious collisions [
18]. However, many accidents still occur at intersections, where side collisions remain a pressing concern [
19]. Furthermore, the increasing popularity of electric scooters has introduced new challenges in road safety, necessitating ongoing research into the risks associated with these emerging micromobility solutions [
20].
Statistical data suggest that while bicycle accident rates have declined in some regions, the problem persists, particularly among vulnerable groups, such as children and middle-aged individuals [
21,
22]. A comprehensive approach—combining improved infrastructure, enhanced visibility measures (e.g., lighting and reflectors), and education initiatives—is necessary to create a safer environment for cyclists [
23,
24,
25].
This study aims to analyze long-term trends in bicycle accidents in Poland and identify key risk factors affecting cyclist safety. By examining data from 2016 to 2023, we seek to assess accident frequency, contributing causes, and injury patterns, providing insights for policymakers, urban planners, and road safety experts. The findings will contribute to the development of evidence-based recommendations for enhancing cyclist protection through infrastructural, regulatory, and technological interventions.
2. Materials and Methods
To ensure the reliability of the data, a rigorous approach to outlier detection and statistical analysis was employed. Outlier detection was conducted using the Grubbs test, a method designed to identify extreme values within a dataset by comparing the most significant deviation from the sample mean relative to the standard deviation. This test, which assumes a normal distribution, was instrumental in detecting potential anomalies that could affect the validity of the findings. Assessing the normality of the data distribution was a crucial step in the analytical process. Several well-established statistical tests were utilized:
The Lilliefors test, a modified version of the Kolmogorov–Smirnov test, which is particularly suited for small sample sizes where population parameters are unknown.
The Shapiro–Wilk test, which is one of the most effective tests for evaluating normality, especially for datasets with small-to-moderate sample sizes.
The Kolmogorov–Smirnov test, which quantifies the maximum deviation between the sample distribution and a theoretical normal distribution, making it a commonly used general normality check.
The Jarque–Bera test, which assesses skewness and kurtosis to determine whether a dataset adheres to a normal distribution.
To verify the homogeneity of variances, the Levene (Brown–Forsythe) test was applied. This test is particularly useful when data do not conform to normality assumptions, ensuring that variance differences between groups do not introduce bias in subsequent statistical analyses. For statistical comparisons, different tests were chosen based on data characteristics:
The Student’s t-test was used to evaluate differences between two independent sample groups when normality and homogeneity of variance were confirmed.
Welch’s t-test was applied when variance homogeneity was violated.
The Mann–Whitney U-test, a nonparametric alternative to the t-test, was used when normality assumptions were not met.
Quantitative variables were described using the sample arithmetic mean () and standard deviation (SD). Additionally, regression analysis was performed to explore relationships between the independent and dependent variables. The regression coefficient quantifies the strength and direction of these relationships:
A positive coefficient suggests that as the independent variable increases, the dependent variable also increases.
A negative coefficient indicates an inverse relationship.
The combination of these statistical methods provided a robust framework for analyzing cyclist accident trends in Poland. Based on the statistical analyses presented in this study, it is possible to gain a broad understanding of bicycle-related accidents in Poland. While the number of injured cyclists has been decreasing, there is a growing interest in bicycles as both a recreational means of transport and a practical alternative for commuting to work. One particularly interesting option is the electric bicycle, which features a pedal-assist system while offering the same benefits as a traditional bike [
26]. Another positive trend is the ongoing expansion of cycling and road infrastructure, which will undoubtedly contribute to further improvements in safety and accessibility. Research is also being conducted on the optimal planning of dedicated cycling routes [
27].
However, it is crucial to examine the specific causes of accidents and their consequences. Infrastructure design and traffic organization should remain key areas of scientific inquiry [
28], with new technologies such as virtual reality offering promising opportunities for further study [
29].
3. Results
This section presents a detailed analysis of bicycle accidents in Poland from 2016 to 2023. The data are categorized based on location, time (monthly and weekly patterns), age group, and primary causes. Trends in accidents, injuries, and fatalities are examined to identify significant patterns and potential factors influencing bicycle safety over the years.
3.1. Accidents by Location
Table 1 summarizes accidents involving cyclists by location. On average, there are seven times more accidents and eight times more injuries in built-up areas compared to non-built-up areas. However, the location does not significantly impact the number of fatal accidents. One possible explanation for this trend is that urban areas, despite having a higher frequency of collisions, provide quicker access to medical assistance, which may reduce the fatality rate. Additionally, the lower speeds of motor vehicles in city environments might contribute to lower impact forces. In contrast, rural accidents, though less frequent, may involve higher speeds, increasing the likelihood of fatal outcomes. The notable decline in fatal accidents can likely be attributed to awareness campaigns encouraging helmet use and proper lighting.
3.2. Monthly Variations in Accidents, Injuries, and Fatalities
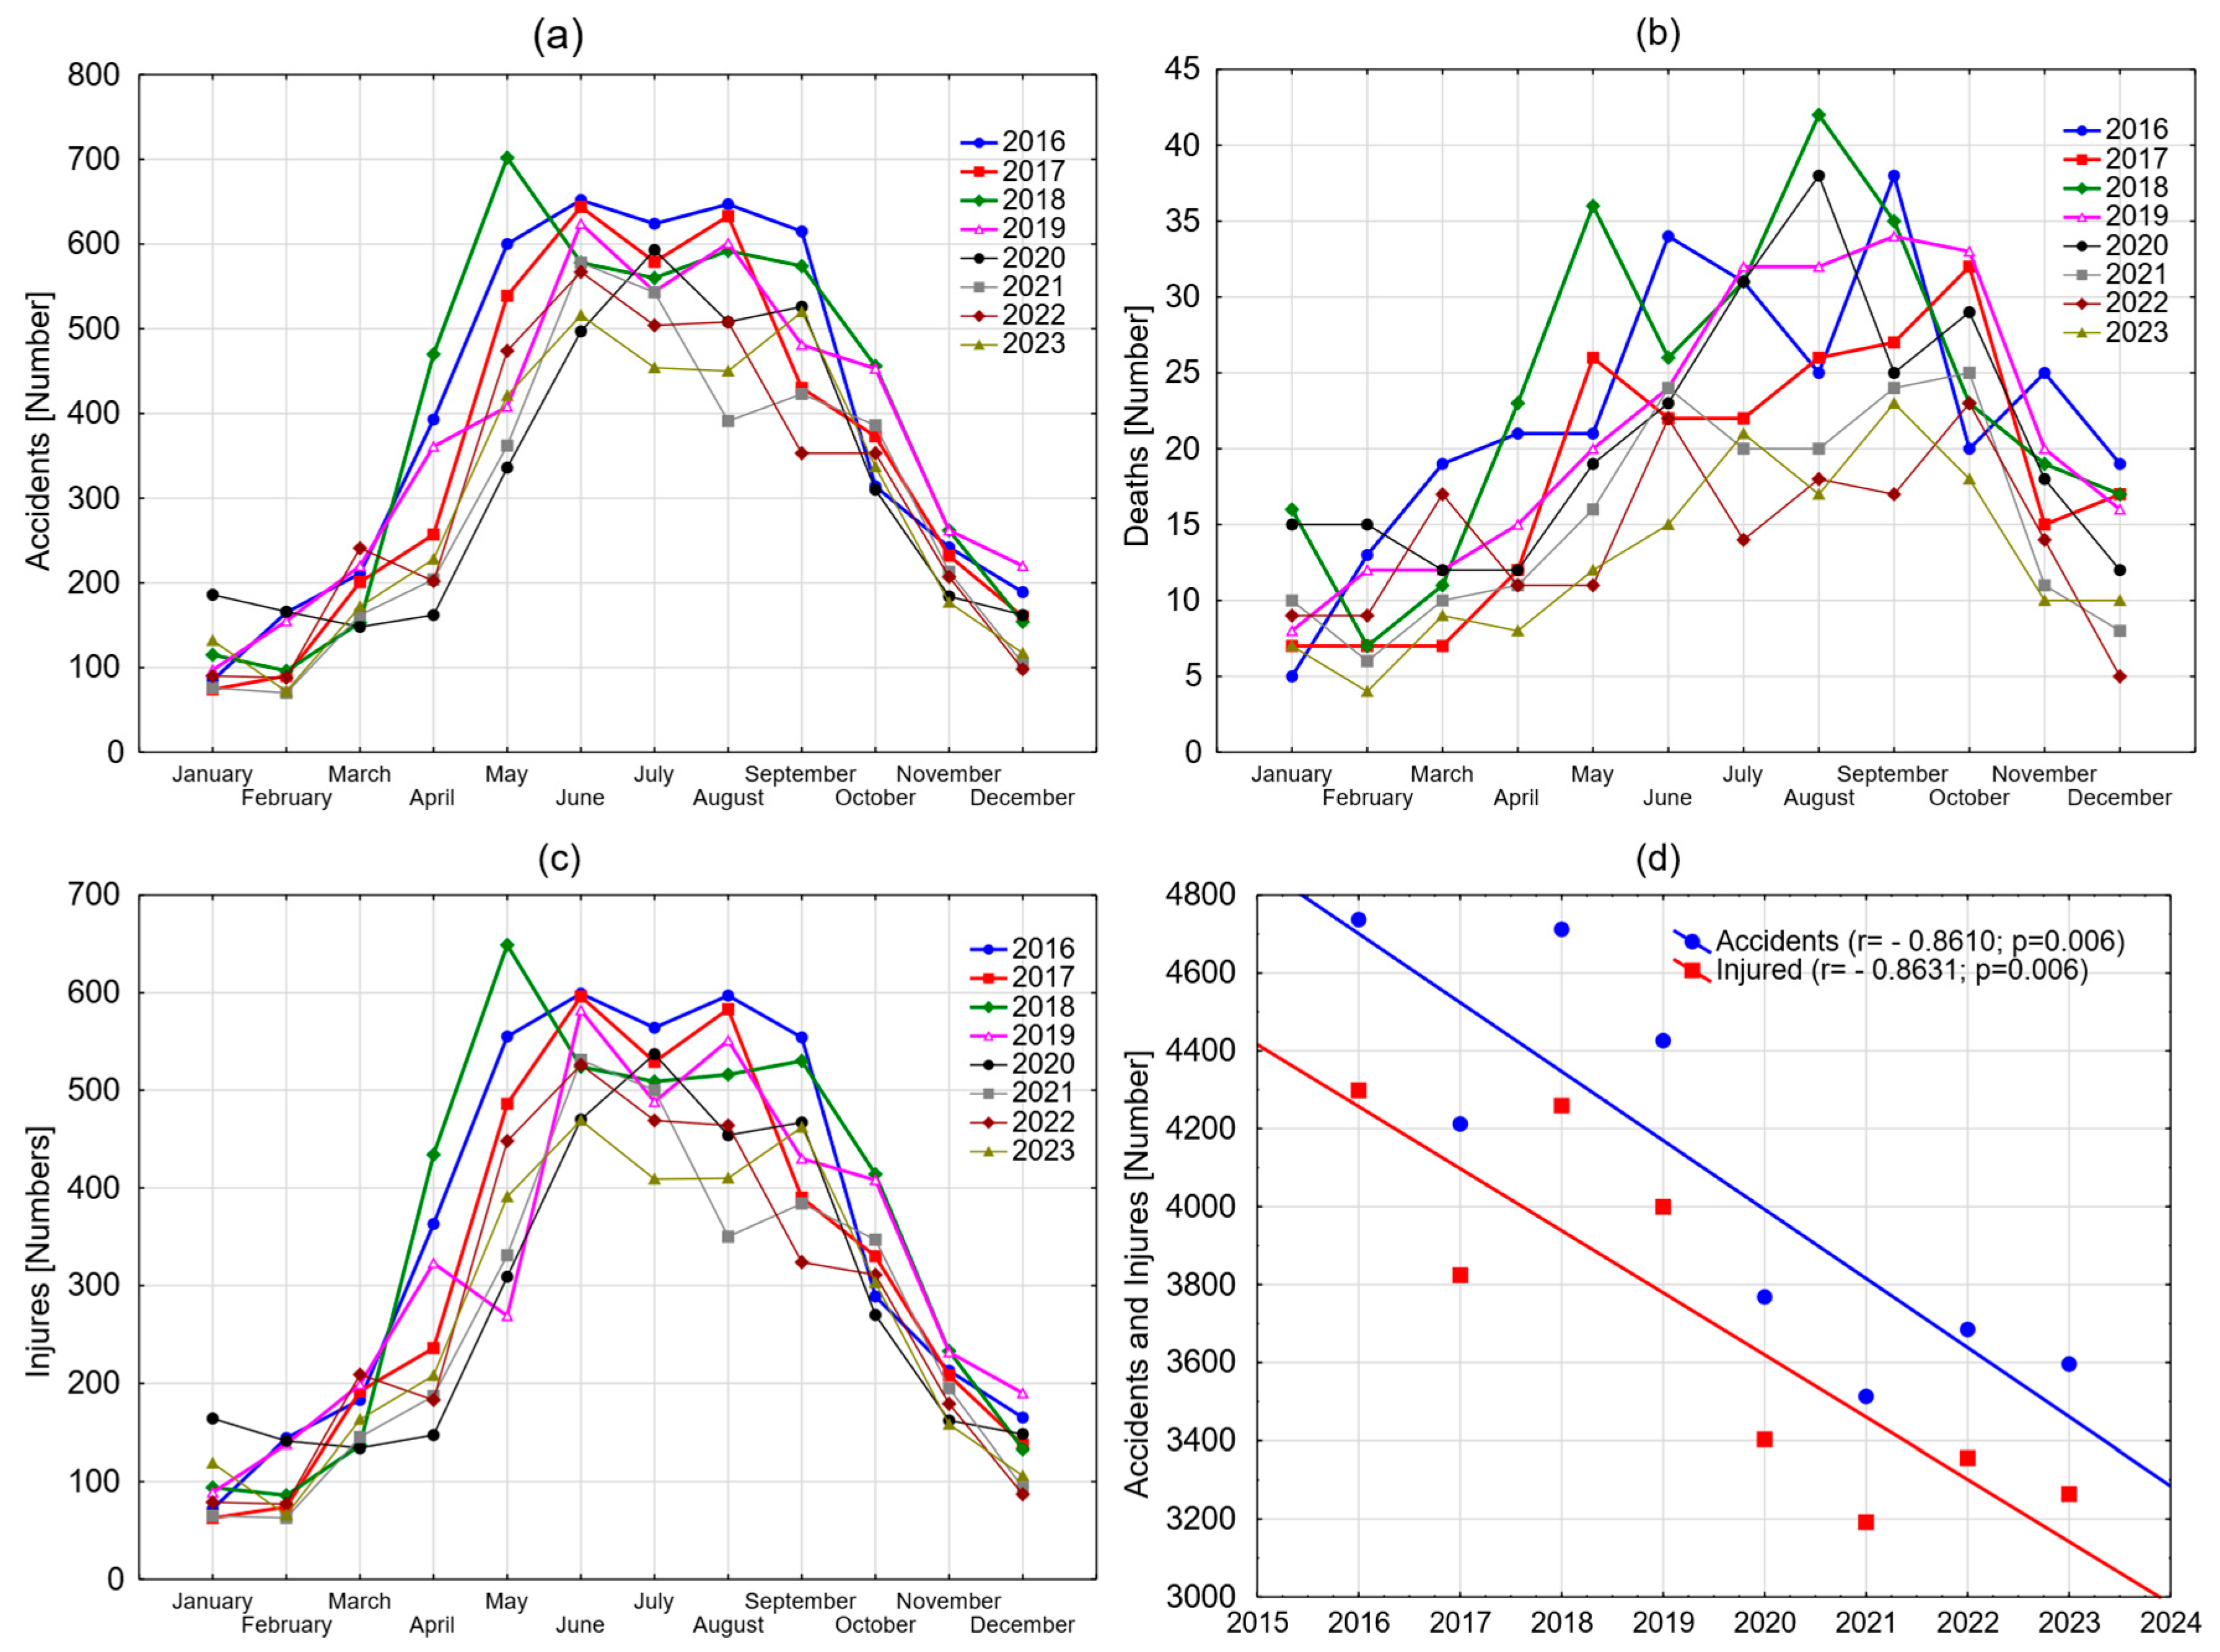
Figure 1a shows the monthly variation in the number of bicycle accidents from 2016 to 2023. Across all years, accidents peak during the summer months, particularly from May to September, with the highest values observed in June, July, and August. The lowest accident counts are in the winter months, from December to February. The general trend for most years is a significant increase in accidents starting in spring (March–April) and peaking mid-year, followed by a decline toward the end of the year. This seasonal pattern is likely due to higher cycling activity in warmer months, as more people use bicycles for commuting and leisure. Additionally, longer daylight hours and favorable weather conditions encourage cycling, which increases exposure to potential accidents.
Figure 1b represents the monthly bicycle deaths. Unlike accidents, the monthly death counts show more variability across years. The peaks in deaths also occur mostly during the warmer months (May to August), with occasional spikes in different years, such as 2020 and 2023. One possible reason for these fluctuations is that while the total number of accidents follows a predictable seasonal trend, fatal accidents may depend on specific factors, such as road conditions, traffic density, or the severity of collisions in particular years. The number of deaths fluctuates substantially more year to year compared to the accident graph, with 2020 showing a relatively sharp peak, particularly in the middle of the year.
Figure 1c tracks monthly injuries, which show a similar pattern to the accidents in
Figure 1a. Injuries tend to increase from March, peaking between May and August, and decreasing toward the end of the year. The shape of the trend mirrors the accident patterns, suggesting a strong correlation between accidents and injuries, though slight variations in the magnitudes of injuries exist across different years.
Figure 1d presents a trendline showing the total number of accidents, injuries, and deaths over time from 2016 to 2023. Both accidents and injuries show a steady decline over this period. The negative correlations (r = −0.8610 for accidents and r = −0.8631 for injuries) indicate a significant downward trend for both variables, suggesting that despite seasonal and yearly fluctuations, the overall number of accidents and injuries has decreased from 2016 to 2023. This decline may be attributed to several factors, including improved road infrastructure, increased awareness campaigns, and possibly a shift in transportation habits, with some cyclists switching to alternative modes of transport.
3.3. Accidents by Day of the Week
Table 2 provides a comprehensive analysis of bicycle accidents, injuries, and fatalities across different days of the week from 2016 to 2023. Accidents are most frequent on weekdays, with Fridays consistently recording the highest numbers, particularly in 2016 (842) and 2018 (758). In contrast, weekends see fewer accidents, with Sundays typically having the lowest figures. A general decline in accidents is observed across all days of the week over the study period.
Fatalities are notably higher on Thursdays and Fridays in many years, with 2016 showing peak numbers on Thursdays (52) and Fridays (55). Sundays consistently record the fewest fatalities. The higher number of fatalities on Thursdays and Fridays may be related to increased evening cycling activity, possibly influenced by social and recreational outings. Additionally, interactions with higher traffic volumes, particularly near the end of the workweek, could contribute to the increased risks.
Injuries follow a similar pattern to accidents, with the highest numbers recorded on Fridays and Thursdays, particularly in 2016 and 2018. Sundays consistently report the fewest injuries. Like accidents, injuries show a general decline over the years. For example, injuries on Mondays dropped from 635 in 2016 to 478 in 2023.
3.4. Accidents by Age Group
Table 3 shows the number of bicycle accidents, deaths, and injuries from 2016 to 2023, categorized by age group in Poland. Cyclists aged 40–59 and 25–39 consistently account for the highest number of accidents across the years, with notable peaks in 2019 (344 and 310, respectively). Cyclists over 60 also see a steady increase in accidents, peaking at 442 in 2018 and remaining high through 2023. The high number of accidents in these age groups may be due to increased cycling for commuting and exercise. Additionally, older cyclists may face higher risks due to slower reaction times and physical vulnerabilities.
Cyclists over 60 account for the most deaths, particularly in 2018 (75) and 2019 (67). The 40–59 age group also shows significant fatalities, with 39 deaths in 2016 and smaller fluctuations afterward. The higher fatality rates among older cyclists may be explained by greater physical fragility, making them more susceptible to severe injuries in crashes.
3.5. Main Factors Contributing to Accidents
Table 4 outlines the primary causes of accidents involving cyclists. The leading cause is failure to yield the right of way, although the frequency of such incidents appears to be declining (
Figure 2a). Another notable cause is the failure to adjust speed to traffic conditions, which shows an upward trend (
Figure 2b). The increasing prevalence of electric bicycles in recent years may explain why cyclists are traveling at higher speeds. Furthermore, the number of incidents involving cyclists due to improper overtaking has been rising steadily year by year (
Figure 2d). The rise in speed-related accidents suggests that traditional safety measures may not be fully adapted to modern cycling behaviors, particularly with the emergence of electric bicycles. It also highlights the need for new regulations to manage cycling speeds and ensure safe interactions with other road users.
3.6. Summary and Interpretation
The analysis of bicycle accidents in Poland from 2016 to 2023 highlights several key trends. While overall accidents and injuries have been declining, certain risk factors remain significant. Older cyclists (40–59 and over 60) are at the highest risk for accidents, injuries, and fatalities, emphasizing the need for targeted safety campaigns focusing on this demographic. The increasing role of e-bikes in accidents suggests that current traffic laws may require adjustments to better regulate their use. Seasonal trends show that summer months have the highest accident rates, indicating a need for increased road safety measures and awareness campaigns during this period.
Additionally, infrastructure improvements such as better lighting, dedicated cycling lanes, and clearer road markings may help mitigate common accident causes. Policies encouraging helmet use and better traffic regulation enforcement could further reduce accident severity. Future research should focus on evaluating the effectiveness of recent safety measures and identifying additional interventions to reduce bicycle-related accidents further.
4. Discussion—Medical Considerations and Analysis
The results of our analysis highlight several important aspects of bicycle accident trends in Poland. The decline in overall accident numbers from 2016 to 2023 suggests that existing safety measures, such as awareness campaigns and improved infrastructure, may be contributing to enhanced road safety. However, certain risk factors remain significant and require further attention.
4.1. Seasonal and Weekly Patterns
The clear seasonal variation in bicycle accidents aligns with findings from other European studies [
10,
11]. The highest accident rates during the summer months (May–August) coincide with increased cycling activity due to favorable weather conditions. This trend is consistent with studies conducted in Germany and the Netherlands, where accident peaks occur during warm months due to higher cyclist exposure [
15,
18]. Additionally, the decrease in accidents during winter is likely linked to lower cyclist numbers, reduced road traction, and shorter daylight hours, as observed in Scandinavian studies [
19].
The weekly distribution of accidents follows an expected pattern, with more incidents occurring on weekdays. This pattern aligns with mobility trends observed in Poland, where bicycles are frequently used for commuting [
4]. The notably high number of accidents on Fridays suggests an increased risk related to end-of-week traffic congestion. This phenomenon is consistent with reports from other European cities, where accident peaks on Fridays have been linked to a combination of high vehicle traffic and increased leisure cycling activity [
7].
4.2. Age-Related Risk Factors
Our findings indicate that cyclists aged 40–59 and over 60 account for the highest number of accidents and fatalities. The vulnerability of older cyclists is well-documented in global studies, which attribute this trend to slower reaction times, decreased stability, and increased susceptibility to severe injuries [
12,
13]. The disproportionately high fatality rate among cyclists over 60 is particularly concerning, mirroring trends observed in studies from the United States and Japan, where elderly cyclists face a significantly higher risk of fatal head trauma [
20,
21]. These findings emphasize the need for targeted safety measures, such as educational campaigns and infrastructure modifications aimed at improving safety for older cyclists.
4.3. Primary Causes of Accidents
Failure to yield the right of way remains the leading cause of bicycle accidents in Poland, a trend consistent with studies from other European countries [
22]. This suggests that despite improvements in infrastructure, conflicts between cyclists and motor vehicles at intersections continue to pose a serious risk. The increasing number of accidents linked to failure to adjust speed to traffic conditions is particularly noteworthy. This trend may be partially explained by the growing popularity of electric bicycles, which allow cyclists to reach higher speeds than traditional bicycles [
26]. Research from China and the USA similarly highlights the role of speed in increasing accident severity among e-bike users [
30].
Another concerning trend is the rising number of accidents related to improper overtaking. This finding suggests that cyclists and motorists may struggle with visibility and road-sharing behavior. Studies from Sweden and Denmark indicate that the introduction of separate cycling lanes significantly reduces such incidents [
17]. Expanding dedicated cycling infrastructure in Poland could therefore help address this issue.
4.4. Implications for Cyclist Safety
The downward trend in accidents and injuries from 2016 to 2023 suggests that existing measures are having a positive impact. However, our findings highlight areas that require further attention:
Helmet Use: While our study did not directly analyze helmet usage rates, international research consistently emphasizes the protective benefits of helmets in reducing head injury severity [
31,
32,
33]. Encouraging helmet adoption, particularly among high-risk groups, could further enhance cyclist safety.
Infrastructure Improvements: Research shows that well-designed bicycle paths and traffic-calming measures significantly reduce accident rates [
15,
16]. Expanding Poland’s cycling infrastructure with clearer road markings, improved lighting, and better intersection designs could mitigate key risk factors.
Education and Awareness: Safety campaigns targeting older cyclists and e-bike users could help reduce accident rates. Studies indicate that public awareness efforts, such as those implemented in the Netherlands, can lead to measurable improvements in road safety [
7].
Regulation Enforcement: Stricter enforcement of traffic laws, particularly at intersections, could help address the common causes of accidents. International case studies suggest that targeted enforcement campaigns effectively reduce cyclist–motorist collisions [
23,
24,
25].
4.5. Implications for Cyclist Safety
While our study provides valuable insights, certain limitations must be acknowledged. The analysis is based on police-reported data, which may underrepresent minor accidents and injuries that do not require police intervention [
34,
35,
36]. Future research should incorporate hospital and trauma center data to provide a more comprehensive assessment of injury patterns. Additionally, a comparative analysis with other countries would help contextualize Poland’s accident trends within a broader international framework.
5. Conclusions
The analysis of bicycle accident data from 2016 to 2023 has provided critical insights into the key risk factors affecting cyclists in Poland. A significant finding is the increasing number of accidents involving children and teenagers, particularly in school zones and residential areas. The correlation between these incidents and peak commuting hours highlights the urgent need for improved cycling infrastructure near schools and enhanced road safety education. Targeted measures, such as the expansion of designated cycling routes and structured safety programs for young riders, could help mitigate these risks.
Another crucial observation is the high frequency of collisions between cyclists, particularly on shared-use paths and in high-density cycling areas. Poor visibility at intersections, unclear traffic markings, and differences in cycling speeds were identified as contributing factors. These results underscore the necessity of redesigning cycling infrastructure, introducing clearer traffic regulations, and promoting safer cycling practices through awareness campaigns.
Additionally, this study revealed a growing number of accidents involving electric bicycles, with a strong correlation between higher speeds and more severe injuries, particularly head trauma. This trend suggests that current regulations may not sufficiently address the specific risks associated with e-bikes. The findings support the need for speed restrictions on cycling paths, stricter enforcement of helmet use, and targeted safety measures for vulnerable groups such as children and elderly cyclists [
37,
38].
Furthermore, accident hotspots were identified, particularly in urban centers where cycling infrastructure is inadequate or poorly integrated with pedestrian and vehicular traffic. By mapping these high-risk locations, this study provides valuable data to support evidence-based urban planning. Targeted interventions, including better lighting, improved signage, and dedicated cycling lanes, could significantly reduce accident rates in these areas.
In summary, this study highlights the necessity of a comprehensive, data-driven approach to improving cyclist safety in Poland. A combination of infrastructure improvements, policy adjustments, educational initiatives, and enhanced enforcement of safety regulations is essential for reducing accidents and promoting cycling as a safe and sustainable mode of transport. The findings offer a strong foundation for policymakers and urban planners to implement effective strategies that will enhance road safety for all cyclists.
Author Contributions
Conceptualization, S.R., M.O. and S.G.; methodology, S.R., M.O. and S.G.; software, S.G.; validation, S.G. and M.O.; investigation, S.R., M.O. and S.G.; resources, S.R. and S.G.; data curation, S.R. and M.O.; writing—original draft preparation, S.R., M.O. and S.G.; writing—review and editing, S.G. and M.O.; visualization, S.G.; supervision, S.G. and M.O.; project administration, S.G. and M.O. All authors have read and agreed to the published version of the manuscript.
Funding
This research received no external funding.
Institutional Review Board Statement
Not applicable.
Informed Consent Statement
Not applicable.
Data Availability Statement
Data are available upon request from the corresponding author.
Conflicts of Interest
The authors declare no conflicts of interest.
References
- Szell, M.; Mimar, S.; Perlman, T.; Ghoshal, G.; Sinatra, R. Growing Urban Bicycle Networks. Sci. Rep. 2022, 12, 6765. [Google Scholar] [CrossRef]
- Tamagusko, T.; Gomes Correia, M.; Rita, L.; Bostan, T.-C.; Peliteiro, M.; Martins, R.; Santos, L.; Ferreira, A. Data-Driven Approach for Urban Micromobility Enhancement through Safety Mapping and Intelligent Route Planning. Smart Cities 2023, 6, 2035–2056. [Google Scholar] [CrossRef]
- Cantisani, G.; Moretti, L.; De Andrade Barbosa, Y. Safety Problems in Urban Cycling Mobility: A Quantitative Risk Analysis at Urban Intersections. Safety 2019, 5, 6. [Google Scholar] [CrossRef]
- Ahmed, T.; Pirdavani, A.; Wets, G.; Janssens, D. Bicycle Infrastructure Design Principles in Urban Bikeability Indices: A Systematic Review. Sustainability 2024, 16, 2545. [Google Scholar] [CrossRef]
- Majer, J.; Adamiec, J.; Obst, M.; Kurpisz, D. System for Monitoring the Safety and Movement Mechanics of Users of Bicycles and Electric Scooters in Real Conditions in the Context of Social Sustainability. Sustainability 2024, 16, 1684. [Google Scholar] [CrossRef]
- Podgórniak-Krzykacz, A.; Trippner-Hrabi, J. Motives and factors that determine city residents’ use of public bicycles. The case of Lodz, Poland. Case Stud. Transp. Policy 2021, 9, 651–662. [Google Scholar] [CrossRef]
- Martens, K. Promoting bike-and-ride: The Dutch experience. Transp. Res. Part A 2007, 41, 326–338. [Google Scholar] [CrossRef]
- Julio, R.; Monzon, A.; Susilo, Y.O. Identifying key elements for user satisfaction of bike-sharing systems: A combination of direct and indirect evaluations. Transportation 2024, 51, 407–438. [Google Scholar] [CrossRef]
- Belliard, L.; Morimoto, A.; Kitano, N. Cyclability in Japan: Toward a Comprehensive National Assessment. Urban Sci. 2025, 9, 45. [Google Scholar] [CrossRef]
- Vanparijs, J.; Int Panis, L.; Meeusen, R.; De Geus, B. Exposure Measurement in Bicycle Safety Analysis: A Review of the Literature. Accid. Anal. Prev. 2015, 84, 9–19. [Google Scholar] [CrossRef]
- Juhra, C.; Wieskötter, B.; Chu, K.; Trost, L.; Weiss, U.; Messerschmidt, M.; Malczyk, A.; Heckwolf, M.; Raschke, M. Bicycle Accidents—Do We Only See the Tip of the Iceberg? Injury 2012, 43, 2026–2034. [Google Scholar] [CrossRef] [PubMed]
- Deck, C.; Bourdet, N.; Meyer, F.; Willinger, R. Protection performance of bicycle helmets. J. Saf. Res. 2019, 71, 67–77. [Google Scholar] [CrossRef] [PubMed]
- Meyer, H.-L.; Kauther, M.D.; Polan, C.; Abel, B.; Vogel, C.; Mester, B.; Burggraf, M.; Dudda, M. E-Scooter-, E-Bike- und Fahrradverletzungen im gleichen Zeitraum-eine prospektive Vergleichsstudie eines Level-1-Traumazentrums. Unfallchirurgie 2023, 126, 208–217. [Google Scholar] [CrossRef] [PubMed]
- Chen, W.S.; Dunn, R.Y.; Chen, A.J.; Linakis, J.G. Epidemiology of Nonfatal Bicycle Injuries Presenting to United States Emergency Departments, 2001–2008. Acad. Emerg. Med. 2013, 20, 570–575. [Google Scholar] [CrossRef]
- Eriksson, J.; Niska, A.; Forsman, Å. Injured Cyclists with Focus on Single-Bicycle Crashes and Differences in Injury Severity in Sweden. Accid. Anal. Prev. 2022, 165, 106510. [Google Scholar] [CrossRef]
- Uijtdewilligen, T.; Wijlhuizen, G.J.; Niaki, M.N. Assessing the safety of international examples of bicycle streets to identify important design elements—An expert judgement. Traffic Saf. Res. 2024, 7, e000071. [Google Scholar] [CrossRef]
- Ketikidis, K.; Papagiannakis, A.; Basbas, S. Identifying and Modeling the Factors That Affect Bicycle Users’ Satisfaction. Sustainability 2023, 15, 13666. [Google Scholar] [CrossRef]
- De Guerre, L.E.V.M.; Sadiqi, S.; Leenen, L.P.H.; Oner, C.F.; Van Gaalen, S.M. Injuries Related to Bicycle Accidents: An Epidemiological Study in The Netherlands. Eur. J. Trauma Emerg. Surg. 2020, 46, 413–418. [Google Scholar] [CrossRef]
- Hu, F.; Lv, D.; Zhu, J.; Fang, J. Related Risk Factors for Injury Severity of E-Bike and Bicycle Crashes in Hefei. Traffic Inj. Prev. 2014, 15, 319–323. [Google Scholar] [CrossRef]
- Scheiman, S.; Moghaddas, H.S.; Björnstig, U.; Bylund, P.O.; Saveman, B.-I. Bicycle Injury Events among Older Adults in Northern Sweden: A 10-Year Population Based Study. Accid. Anal. Prev. 2010, 42, 758–763. [Google Scholar] [CrossRef]
- Liu, H.-T.; Rau, C.-S.; Liang, C.-C.; Wu, S.-C.; Hsu, S.-Y.; Hsieh, H.-Y.; Hsieh, C.-H. Bicycle-Related Hospitalizations at a Taiwanese Level I Trauma Center. BMC Public Health 2015, 15, 722. [Google Scholar] [CrossRef]
- McAdams, R.J.; Swidarski, K.; Clark, R.M.; Roberts, K.J.; Yang, J.; Mckenzie, L.B. Bicycle-Related Injuries among Children Treated in US Emergency Departments, 2006–2015. Accid. Anal. Prev. 2018, 118, 11–17. [Google Scholar] [CrossRef] [PubMed]
- Schepers, P.; Hagenzieker, M.; Methorst, R.; van Wee, B.; Wegman, F. A conceptual framework for road safety and mobility applied to cycling safety. Accid. Anal. Prev. 2014, 62, 331–340. [Google Scholar] [CrossRef] [PubMed]
- Deliali, K.; Christofa, E.; Knodler, M. The role of protected intersections in improving bicycle safety and driver right-turning behavior. Accid. Anal. Prev. 2021, 159, 106295. [Google Scholar] [CrossRef]
- Tuckel, P.; Milczarski, W.; Maisel, R. Pedestrian injuries due to collisions with bicycles in New York and California. J. Saf. Res. 2014, 51, 7–13. [Google Scholar] [CrossRef]
- Jenkins, M.; Lustosa, L.; Chia, V.; Wildish, S.; Tan, M.; Hoornweg, D.; Lloyd, M.; Dogra, S. What do we know about pedal assist E-bikes? A scoping review to inform future directions. Transp. Policy 2022, 128, 25–37. [Google Scholar] [CrossRef]
- Zuo, T.; Wei, H. Bikeway prioritization to increase bicycle network connectivity and bicycle-transit connection: A multi-criteria decision analysis approach. Transp. Res. Part A 2019, 129, 52–71. [Google Scholar] [CrossRef]
- Gössling, S.; McRae, S. Subjectively safe cycling infrastructure: New insights for urban designs. J. Transp. Geogr. 2022, 101, 103340. [Google Scholar] [CrossRef]
- Schwarzkopf, M.; Dettmann, A.; Bullinger, A.C. What turns a bicycle street into a street for cyclists? A multimodal study on subjective safety of infrastructure measures on bicycle streets using an approach in virtual reality. Traffic Saf. Res. 2024, 7, e000066. [Google Scholar] [CrossRef]
- Kowalczewska, J.; Rzepczyk, S.; Okła, M.; Nijakowski, K.; Słowik, Ł.; Makuch, A.; Hryniewicz, O.; Krasnoborska, J.; Żaba, C.; Osmola, K. Characteristics of E-Scooter-Related Maxillofacial Injuries over 2019–2022—Retrospective Study from Poznan, Poland. J. Clin. Med. 2023, 12, 3690. [Google Scholar] [CrossRef]
- Siman-Tov, M.; Jaffe, D.H.; Peleg, K. Bicycle Injuries: A Matter of Mechanism and Age. Accid. Anal. Prev. 2012, 44, 135–139. [Google Scholar] [CrossRef] [PubMed]
- Teisch, L.F.; Allen, C.J.; Tashiro, J.; Golpanian, S.; Lasko, D.; Namias, N.; Neville, H.L.; Sola, J.E. Injury Patterns and Outcomes Following Pediatric Bicycle Accidents. Pediatr. Surg. Int. 2015, 31, 1021–1025. [Google Scholar] [CrossRef] [PubMed]
- Yamamoto, K.; Matsusue, Y.; Horita, S.; Murakami, K.; Sugiura, T.; Kirita, T. Maxillofacial Fractures Sustained in Bicycle Accidents. J. Oral Maxillofac. Surg. 2011, 69, 155–160. [Google Scholar] [CrossRef]
- Petzoldt, T.; Schleinitz, K.; Krems, J.F.; Gehlert, T. Drivers’ gap acceptance in front of approaching bicycles—Effects of bicycle speed and bicycle type. Saf. Sci. 2017, 92, 283–289. [Google Scholar] [CrossRef]
- Scott, L.R.; Bazargan-Hejazi, S.; Shirazi, A.; Pan, D.; Lee, S.; Teruya, S.A.; Shaheen, M. Helmet Use and Bicycle-Related Trauma Injury Outcomes. Brain Inj. 2019, 33, 1597–1601. [Google Scholar] [CrossRef]
- Obst, M.; Rzepczyk, S.; Głowiński, S.; Żaba, C. Motorbike Protective Helmets, Construction, Testing and Its Influence on the Type and Severity of Injuries of Motorbike Accident Casualties: A Literature Review. Vib. Phys. Syst. 2023, 34, 2023118. [Google Scholar] [CrossRef]
- Obst, M.; Rzepczyk, S.; Karwasz, A.; Glowinski, S. Helmet Usage for Single-Track Vehicle Users in the Poznan Agglomeration: A Preliminary Study. Transp. Samoch. 2023, 2, 101–111. [Google Scholar] [CrossRef]
- Büth, C.M.; Barbour, N.; Abdel-Aty, M. Effectiveness of Bicycle Helmets and Injury Prevention: A Systematic Review of Meta-Analyses. Sci. Rep. 2023, 13, 8540. [Google Scholar] [CrossRef]
| Disclaimer/Publisher’s Note: The statements, opinions and data contained in all publications are solely those of the individual author(s) and contributor(s) and not of MDPI and/or the editor(s). MDPI and/or the editor(s) disclaim responsibility for any injury to people or property resulting from any ideas, methods, instructions or products referred to in the content. |
© 2025 by the authors. Licensee MDPI, Basel, Switzerland. This article is an open access article distributed under the terms and conditions of the Creative Commons Attribution (CC BY) license (https://creativecommons.org/licenses/by/4.0/).


