
Adaptive Intervention Algorithms for Advanced Driver Assistance Systems

 , ,
, ,  and
and 
Abstract
1. Introduction
2. Related Work
3. Case Study: The i-DREAMS System
3.1. Context
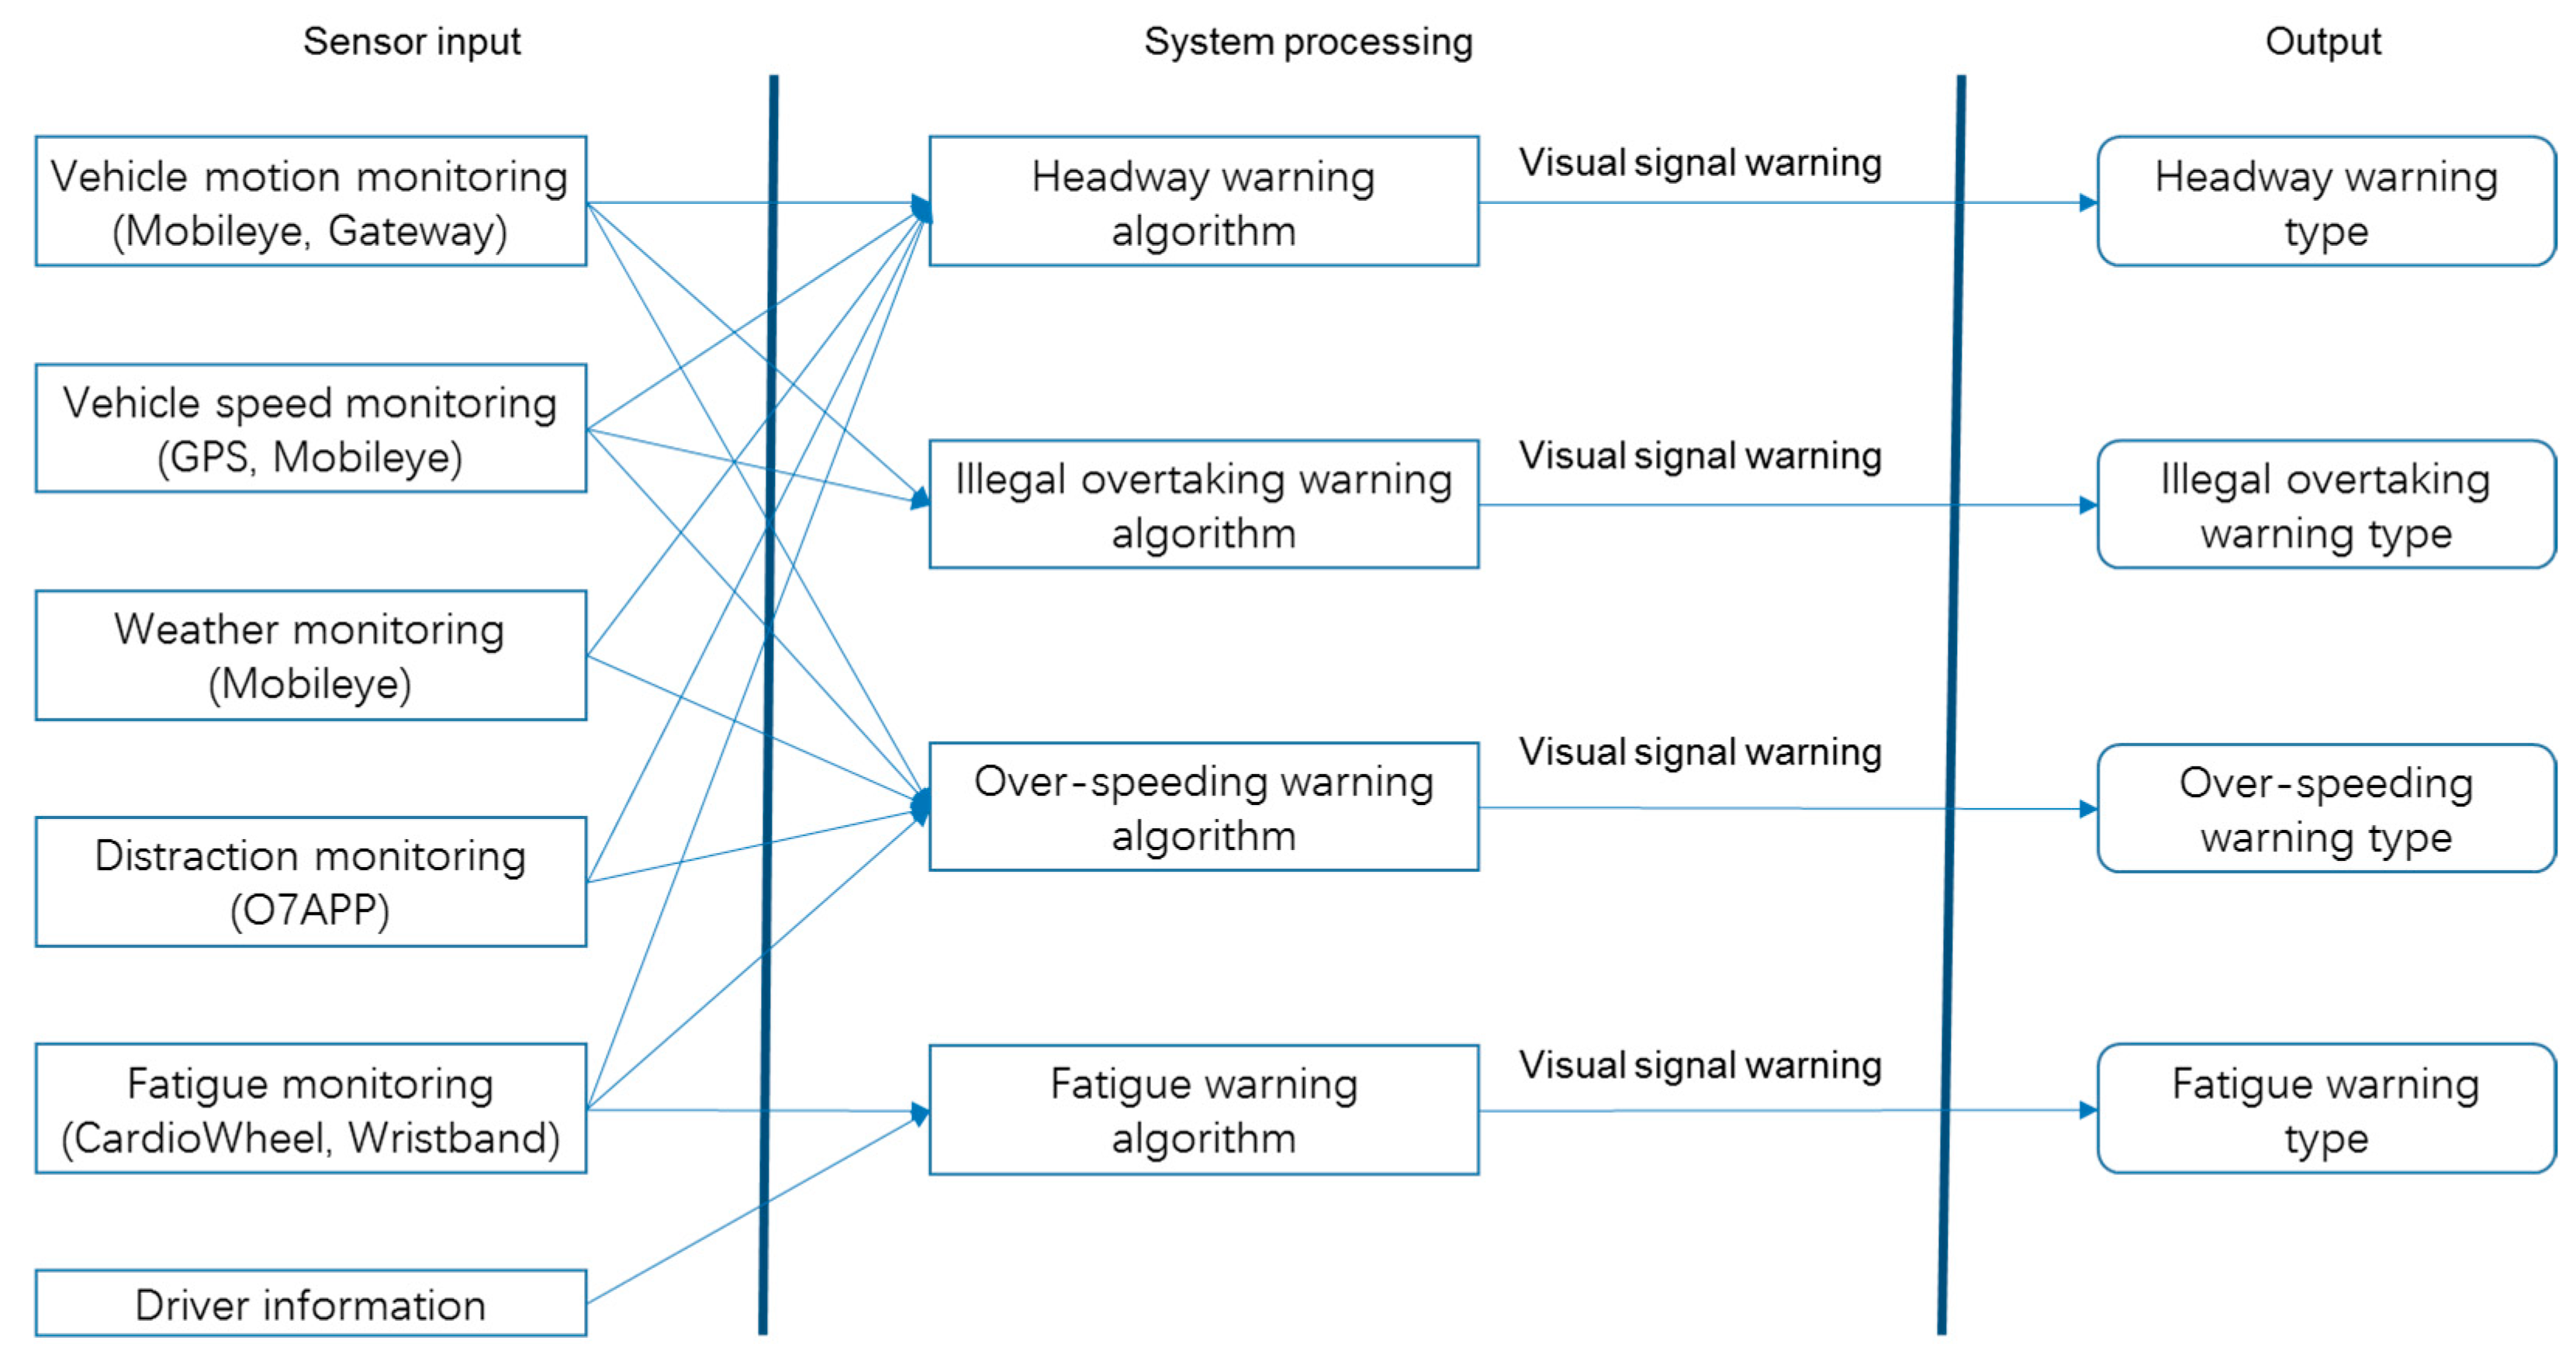
3.2. Sensor Inputs
4. Proposed Algorithms
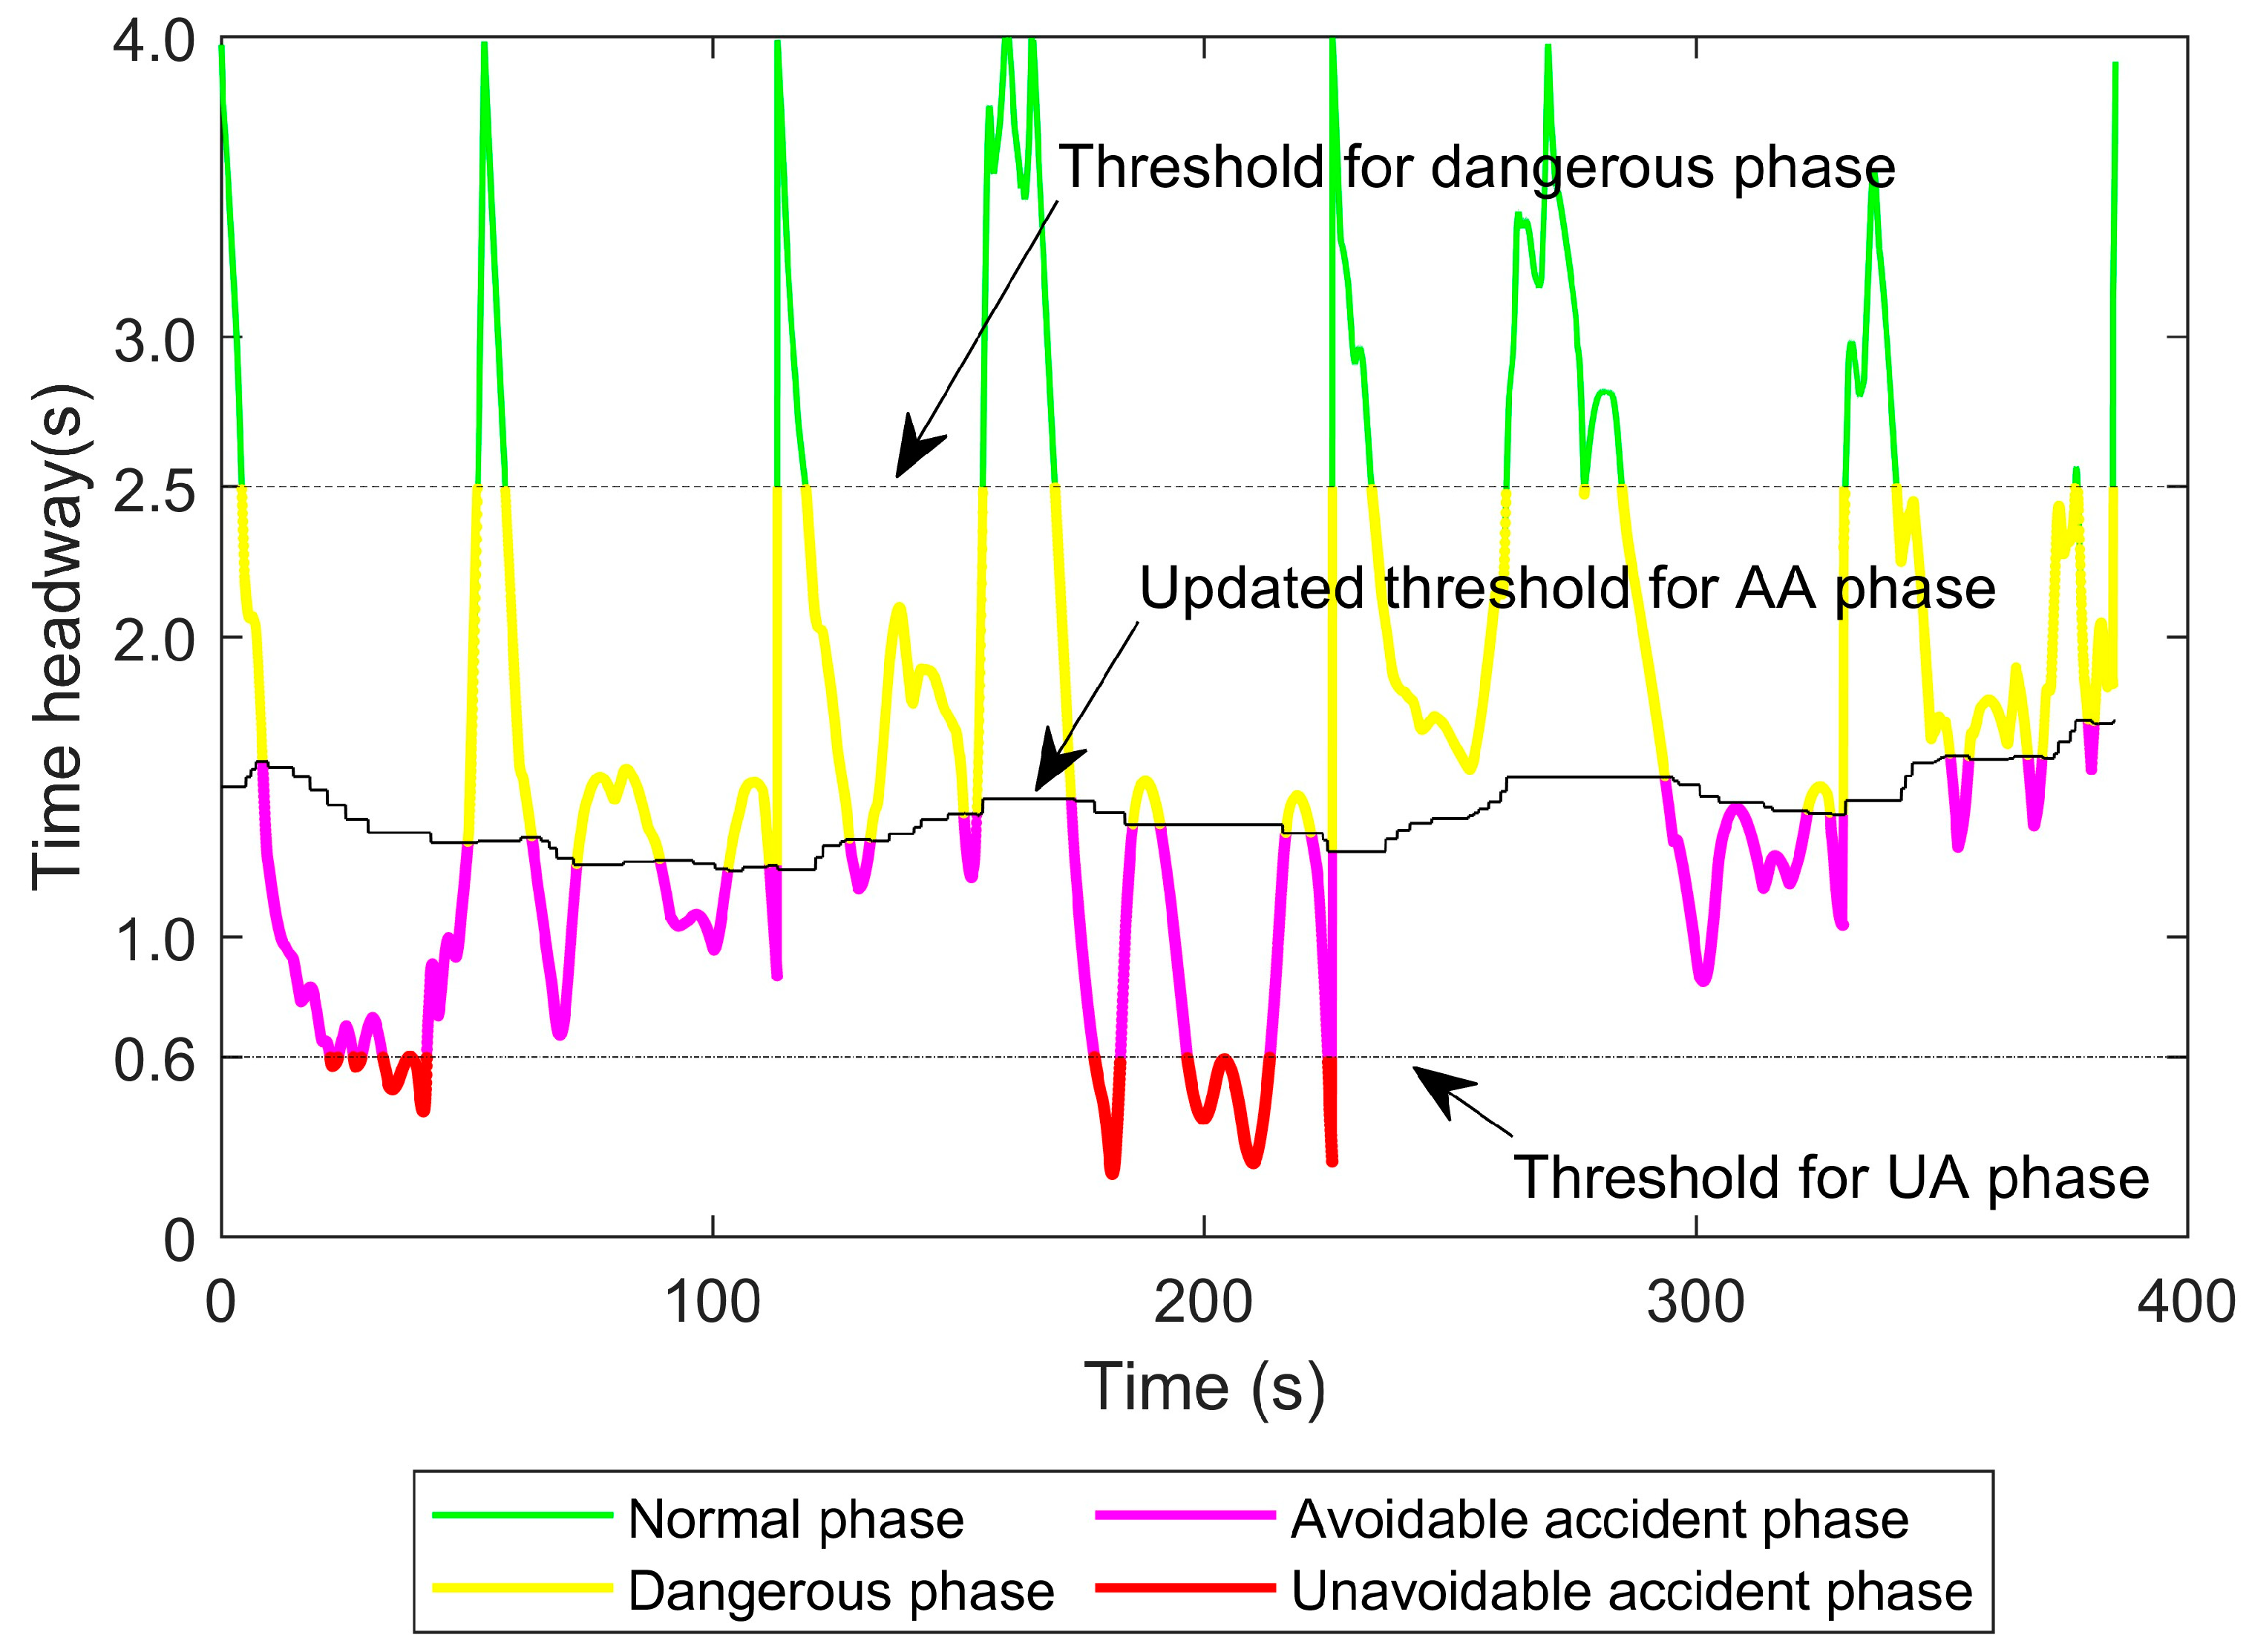
4.1. Adaptive Headway Warning Algorithm
| Algorithm 1. Adaptive Headway Warning Framework |
| At any time instant t: Warning Generation Sub-System: then warning_headway = −1 then warning_headway = 0 then warning_headway = 1 else if 0.6 then warning_headway = 2 then warning_headway = 3 end |
| Threshold Update Sub-System: & then ……….…….…….…… (1) then …………….………… (2) End then …….(3) ) end then else if then end then then |
- Normal Phase (warning_headway = 0): no warnings when the headway is greater than 2.5 s.
- Dangerous Phase (warning_headway = 1): when the headway is between the 2.5 s and the updated threshold, a visual warning indicating the dangerous phase is displayed.
- Avoidable Accident Phase (warning_headway = 2): when the headway is between the updated threshold and 0.6 s, a visual warning indicating the avoidable accident phase is displayed.
- Unavoidable Accident Phase (warning_headway = 3): It is a quite dangerous phase once the headway is less than 0.6 s. A frequent visual warning with alerts is displayed. The updated threshold ranges from the maximum and minimum values, which are 2.0 s and 1.0 s, respectively, to consider the reaction time of drivers which is not the same for every driver, and it varies from less than 1.0 s to about 2.0 s [26].
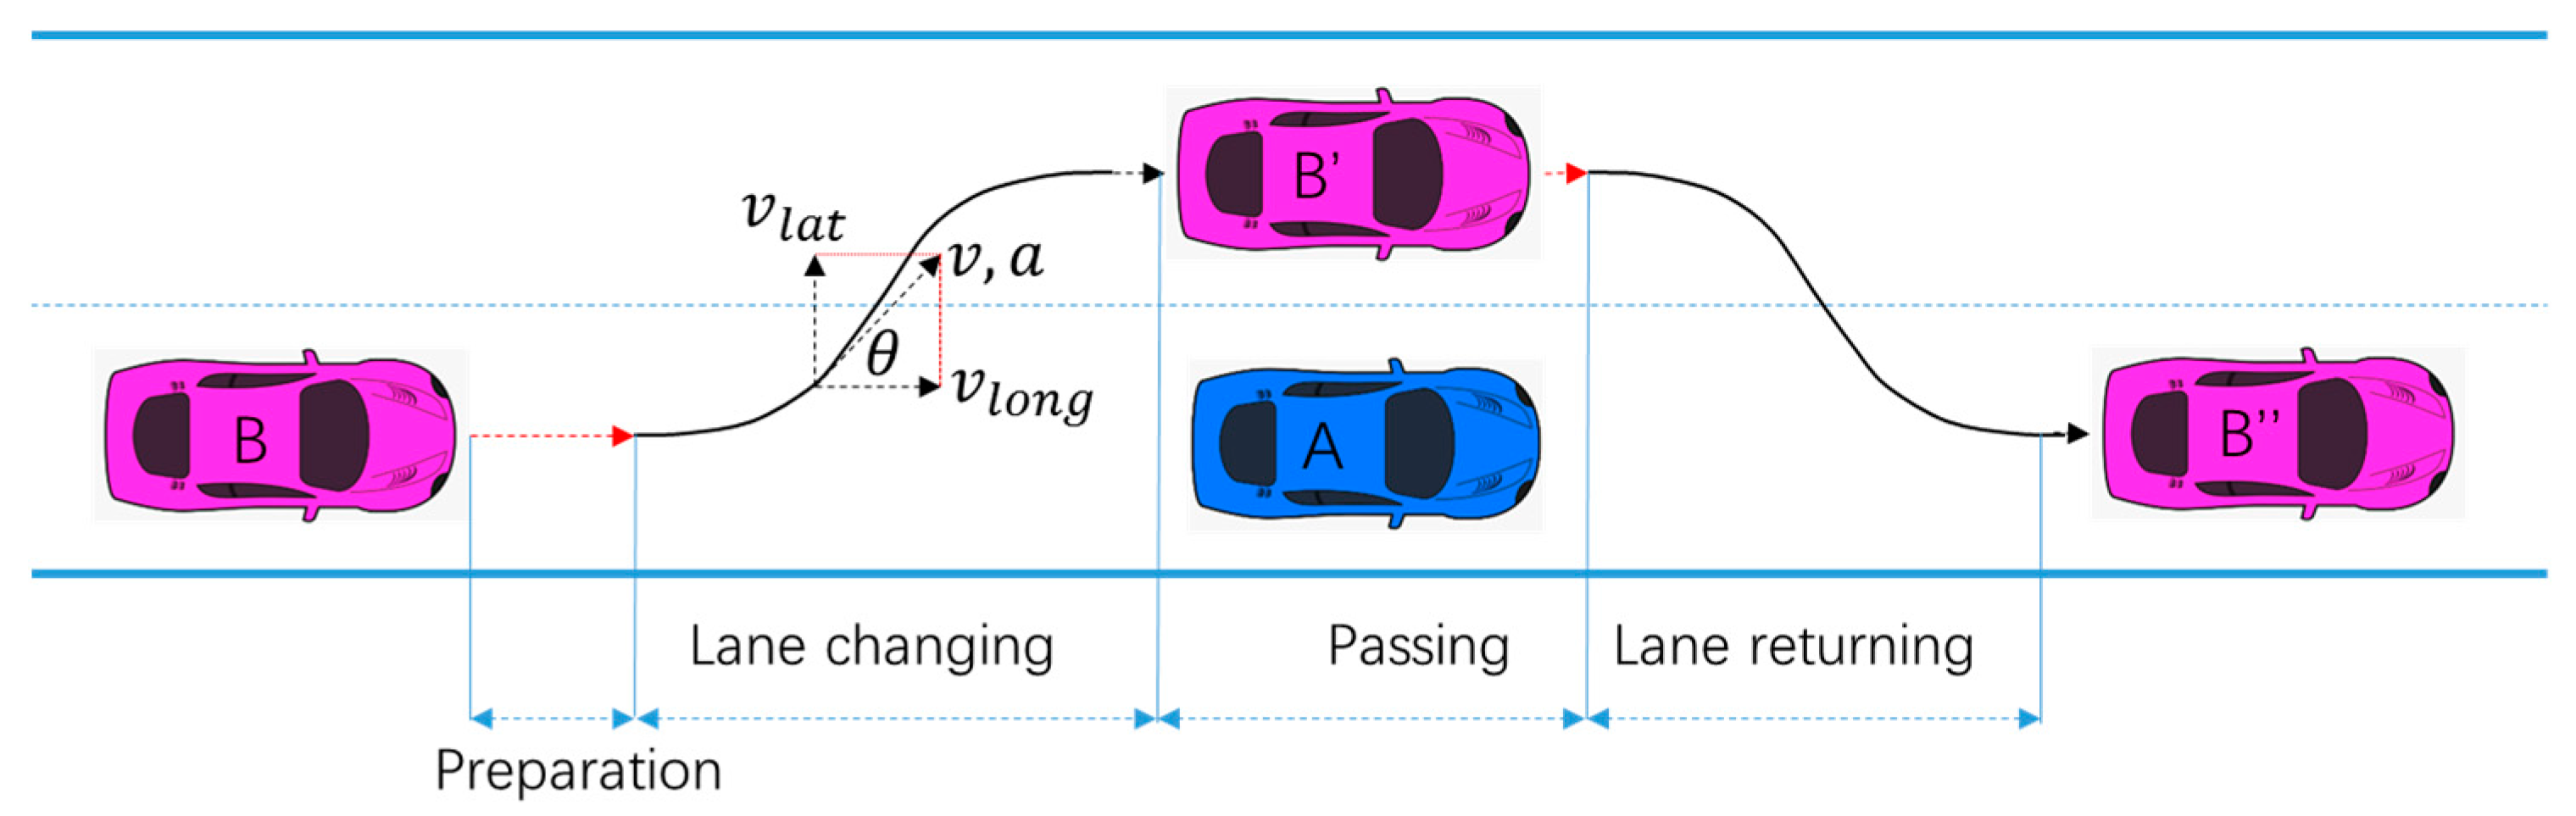
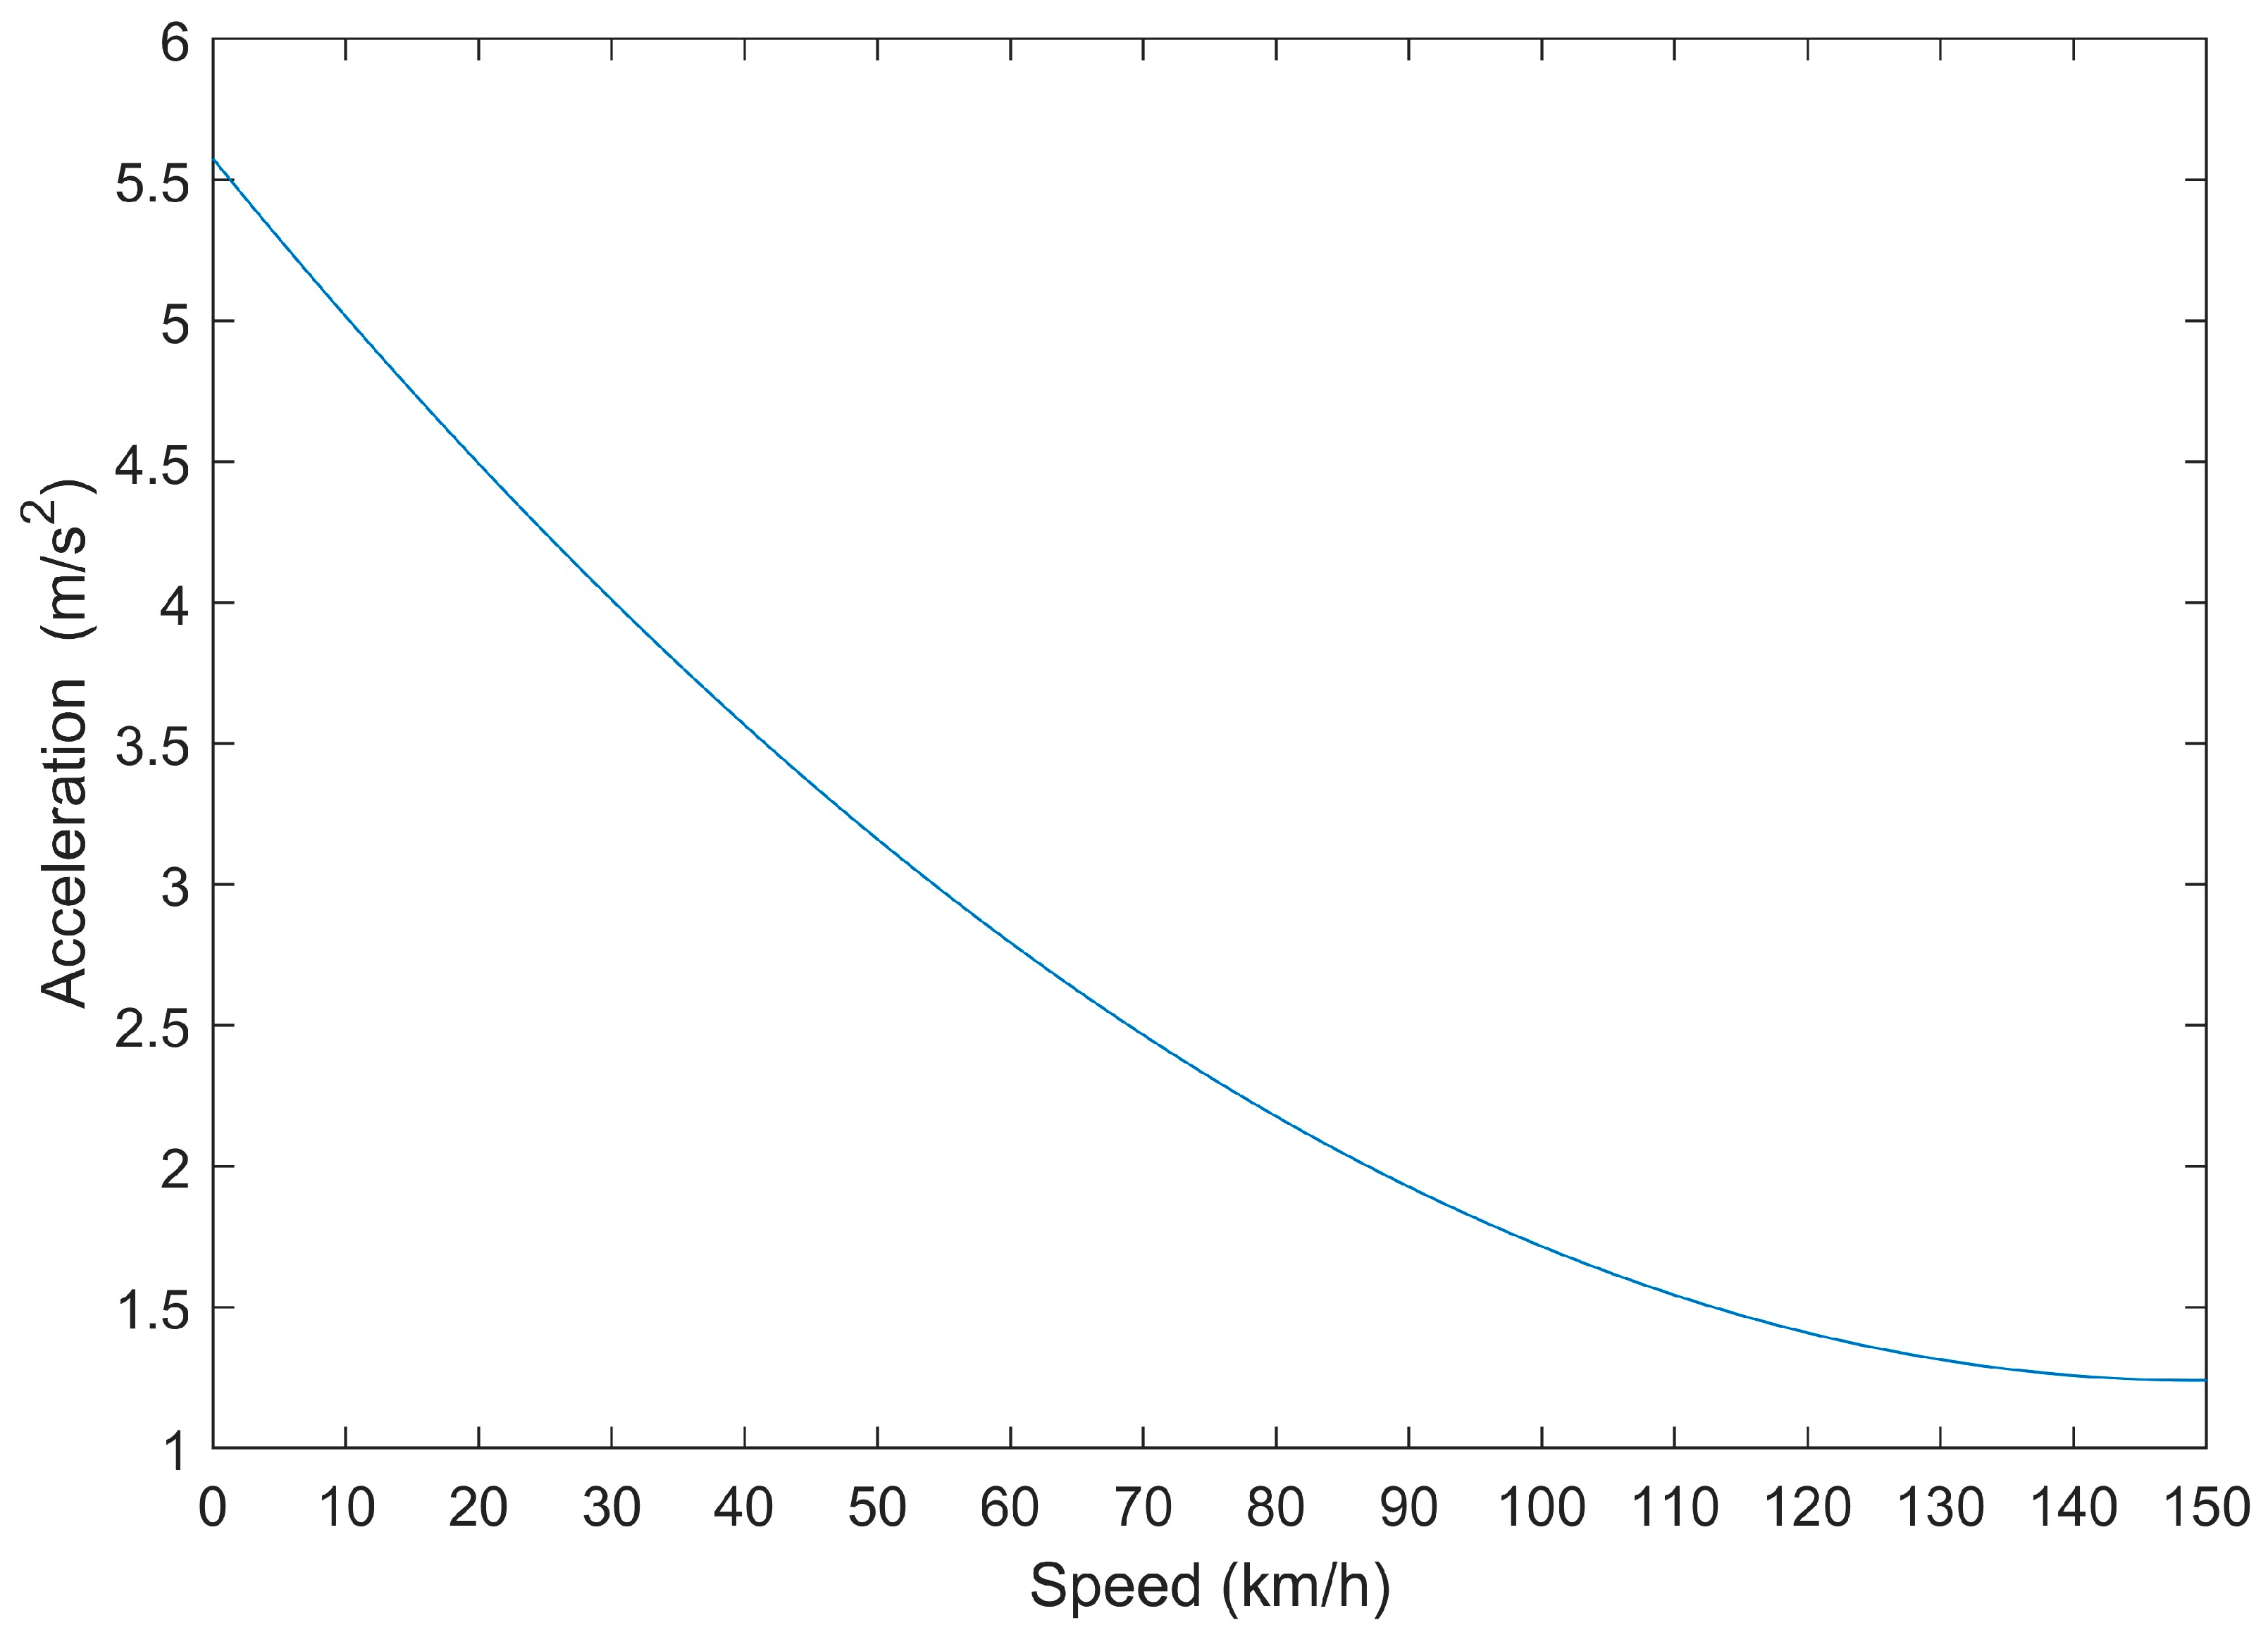
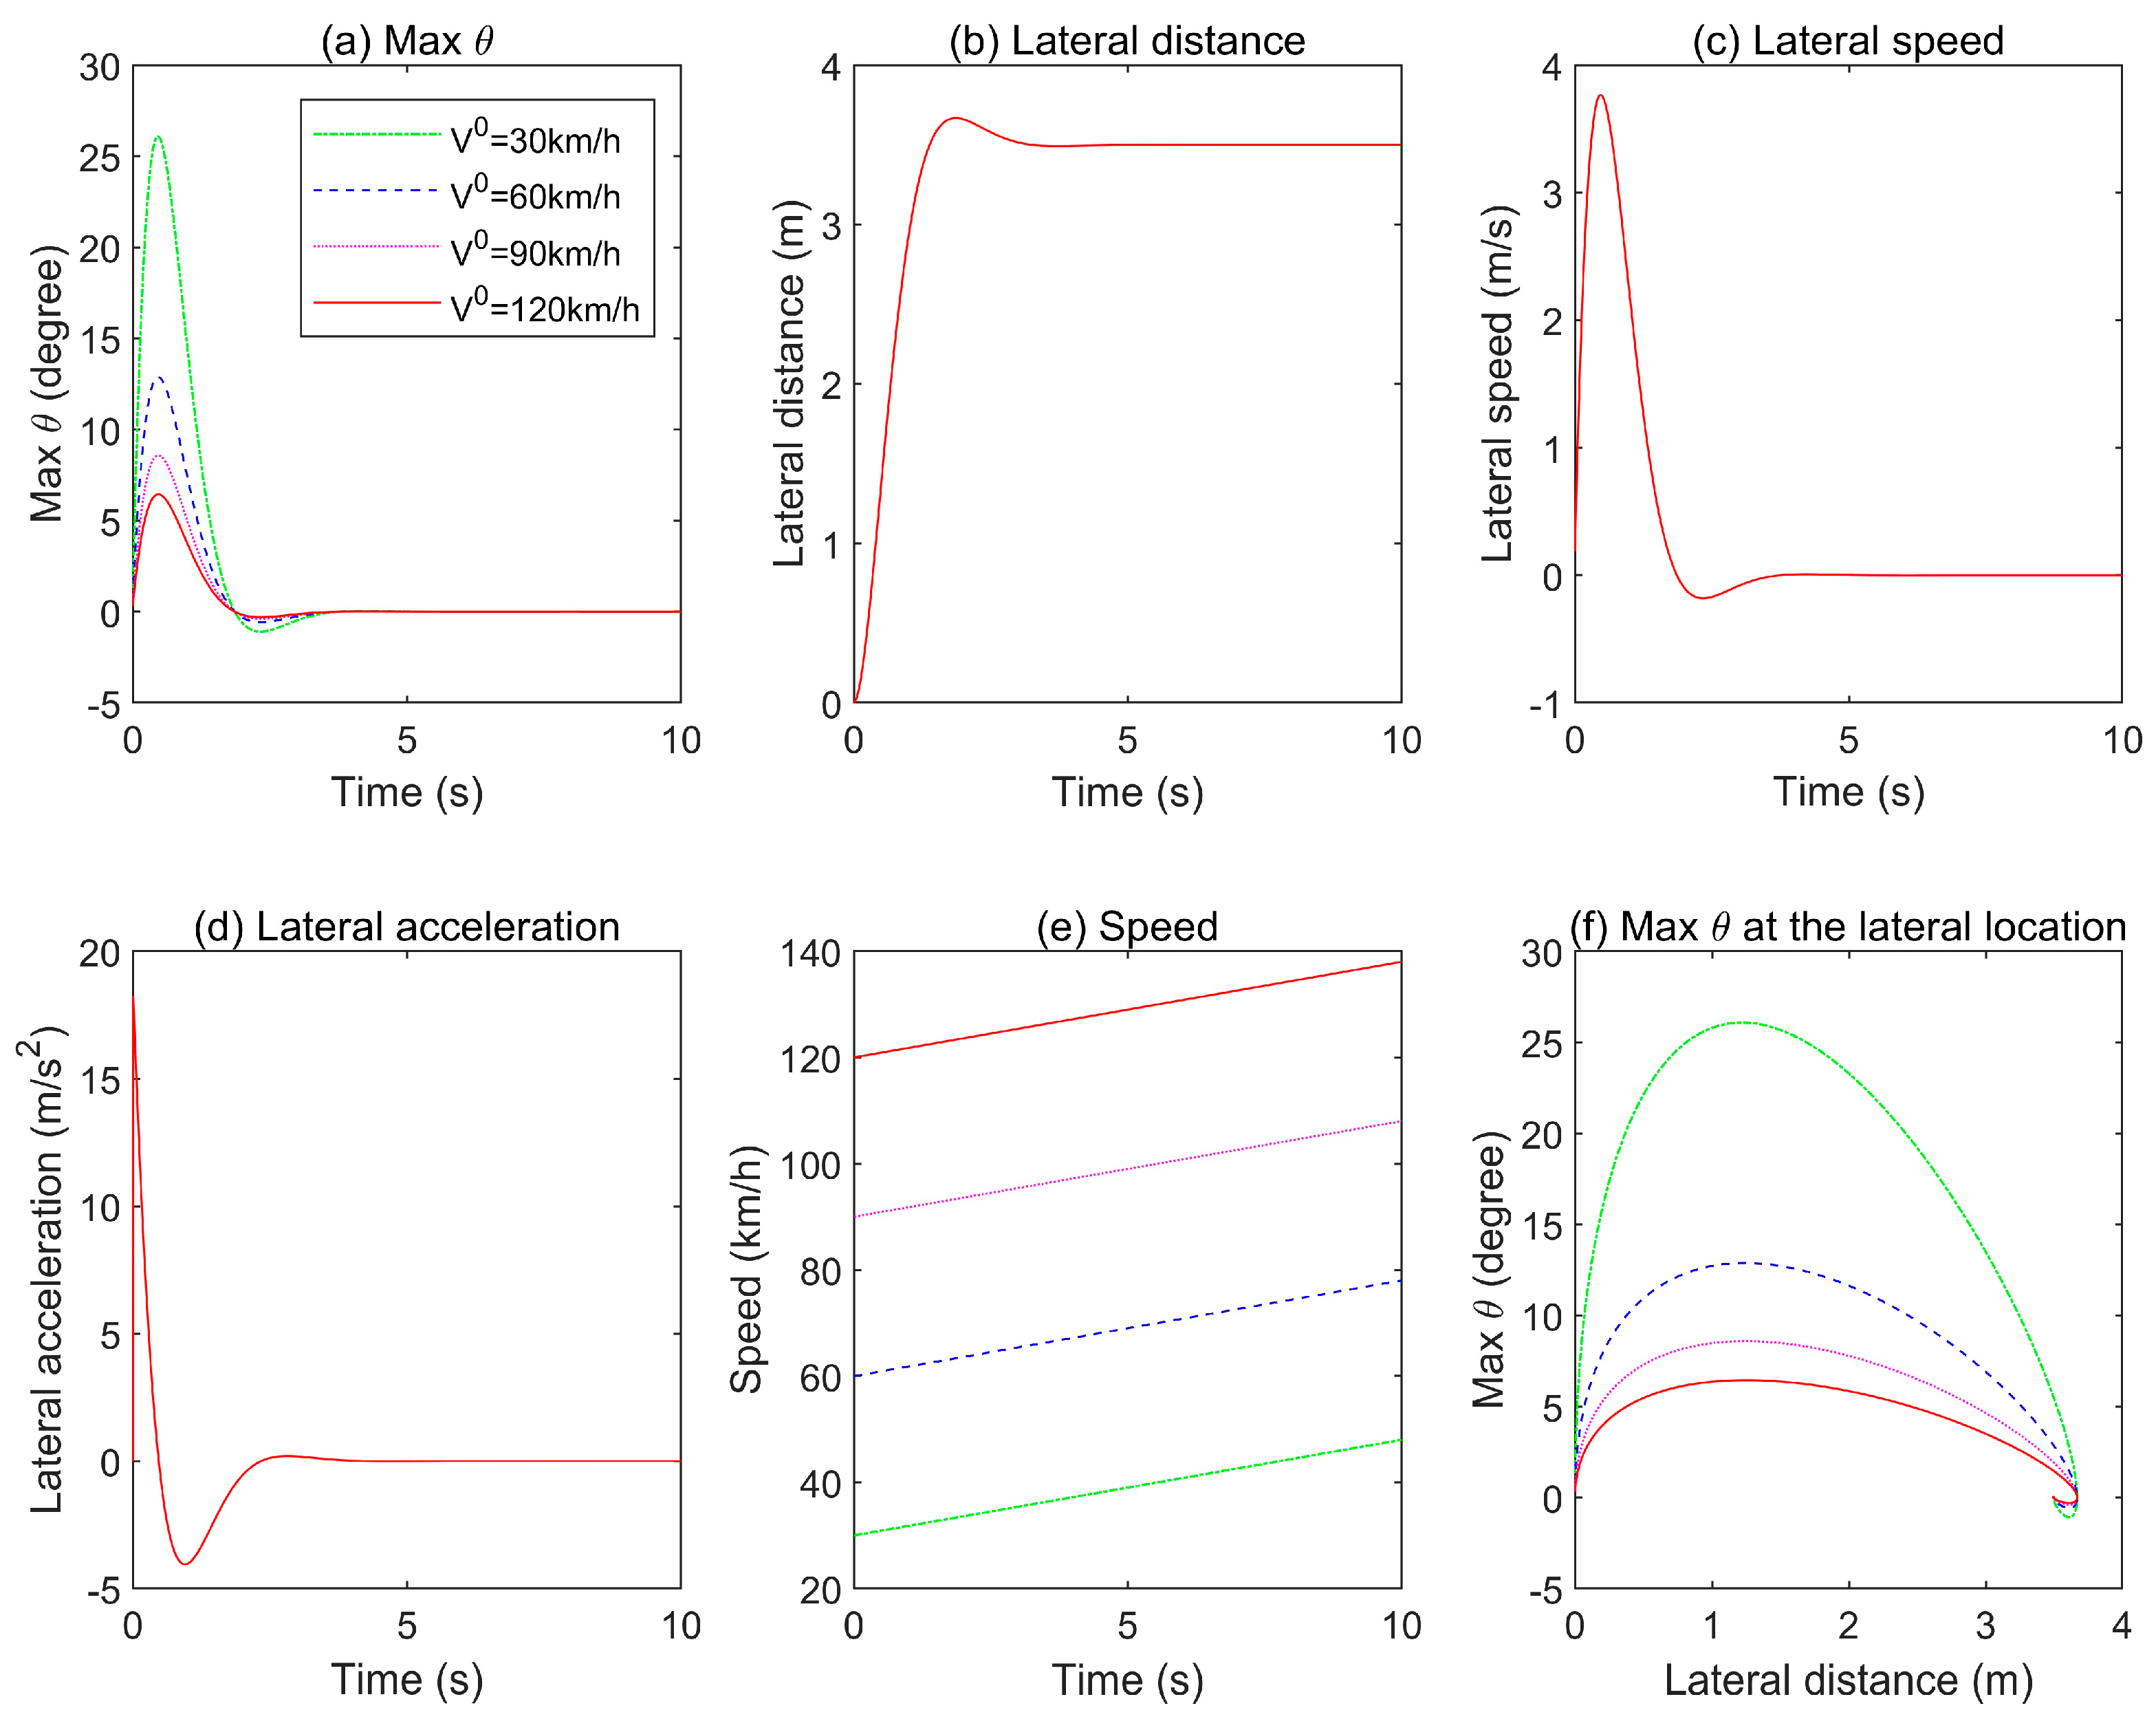
4.2. Illegal Overtaking Warning Algorithm
- Normal Phase (warning_overtaking = 0);
- Dangerous Phase (warning_overtaking = 1);
- Avoidable Accident Phase (warning_overtaking = 2);
- Unavoidable Accident Phase (warning_overtaking = 3).
| Algorithm 2. Illegal Overtaking Warning Framework |
|
At any time instant t: Warning Generation Sub-System: warning_overtaking = 0 if then warning_overtaking = 1 end if then warning_overtaking = 2 else if then warning_overtaking = 2 end if then warning_overtaking = 3 end |
4.3. Over-Speeding Warning Algorithm
- Normal Phase: driving speed < 0% above legal speed limit (SL);
- Dangerous Phase: driving speed = 0–5% over legal speed limit (SL);
- Avoidable Accident Phase: driving speed = 5–10% over legal speed limit (SL);
- Unavoidable Accident Phase: driving speed > 10% over legal speed limit (SL).
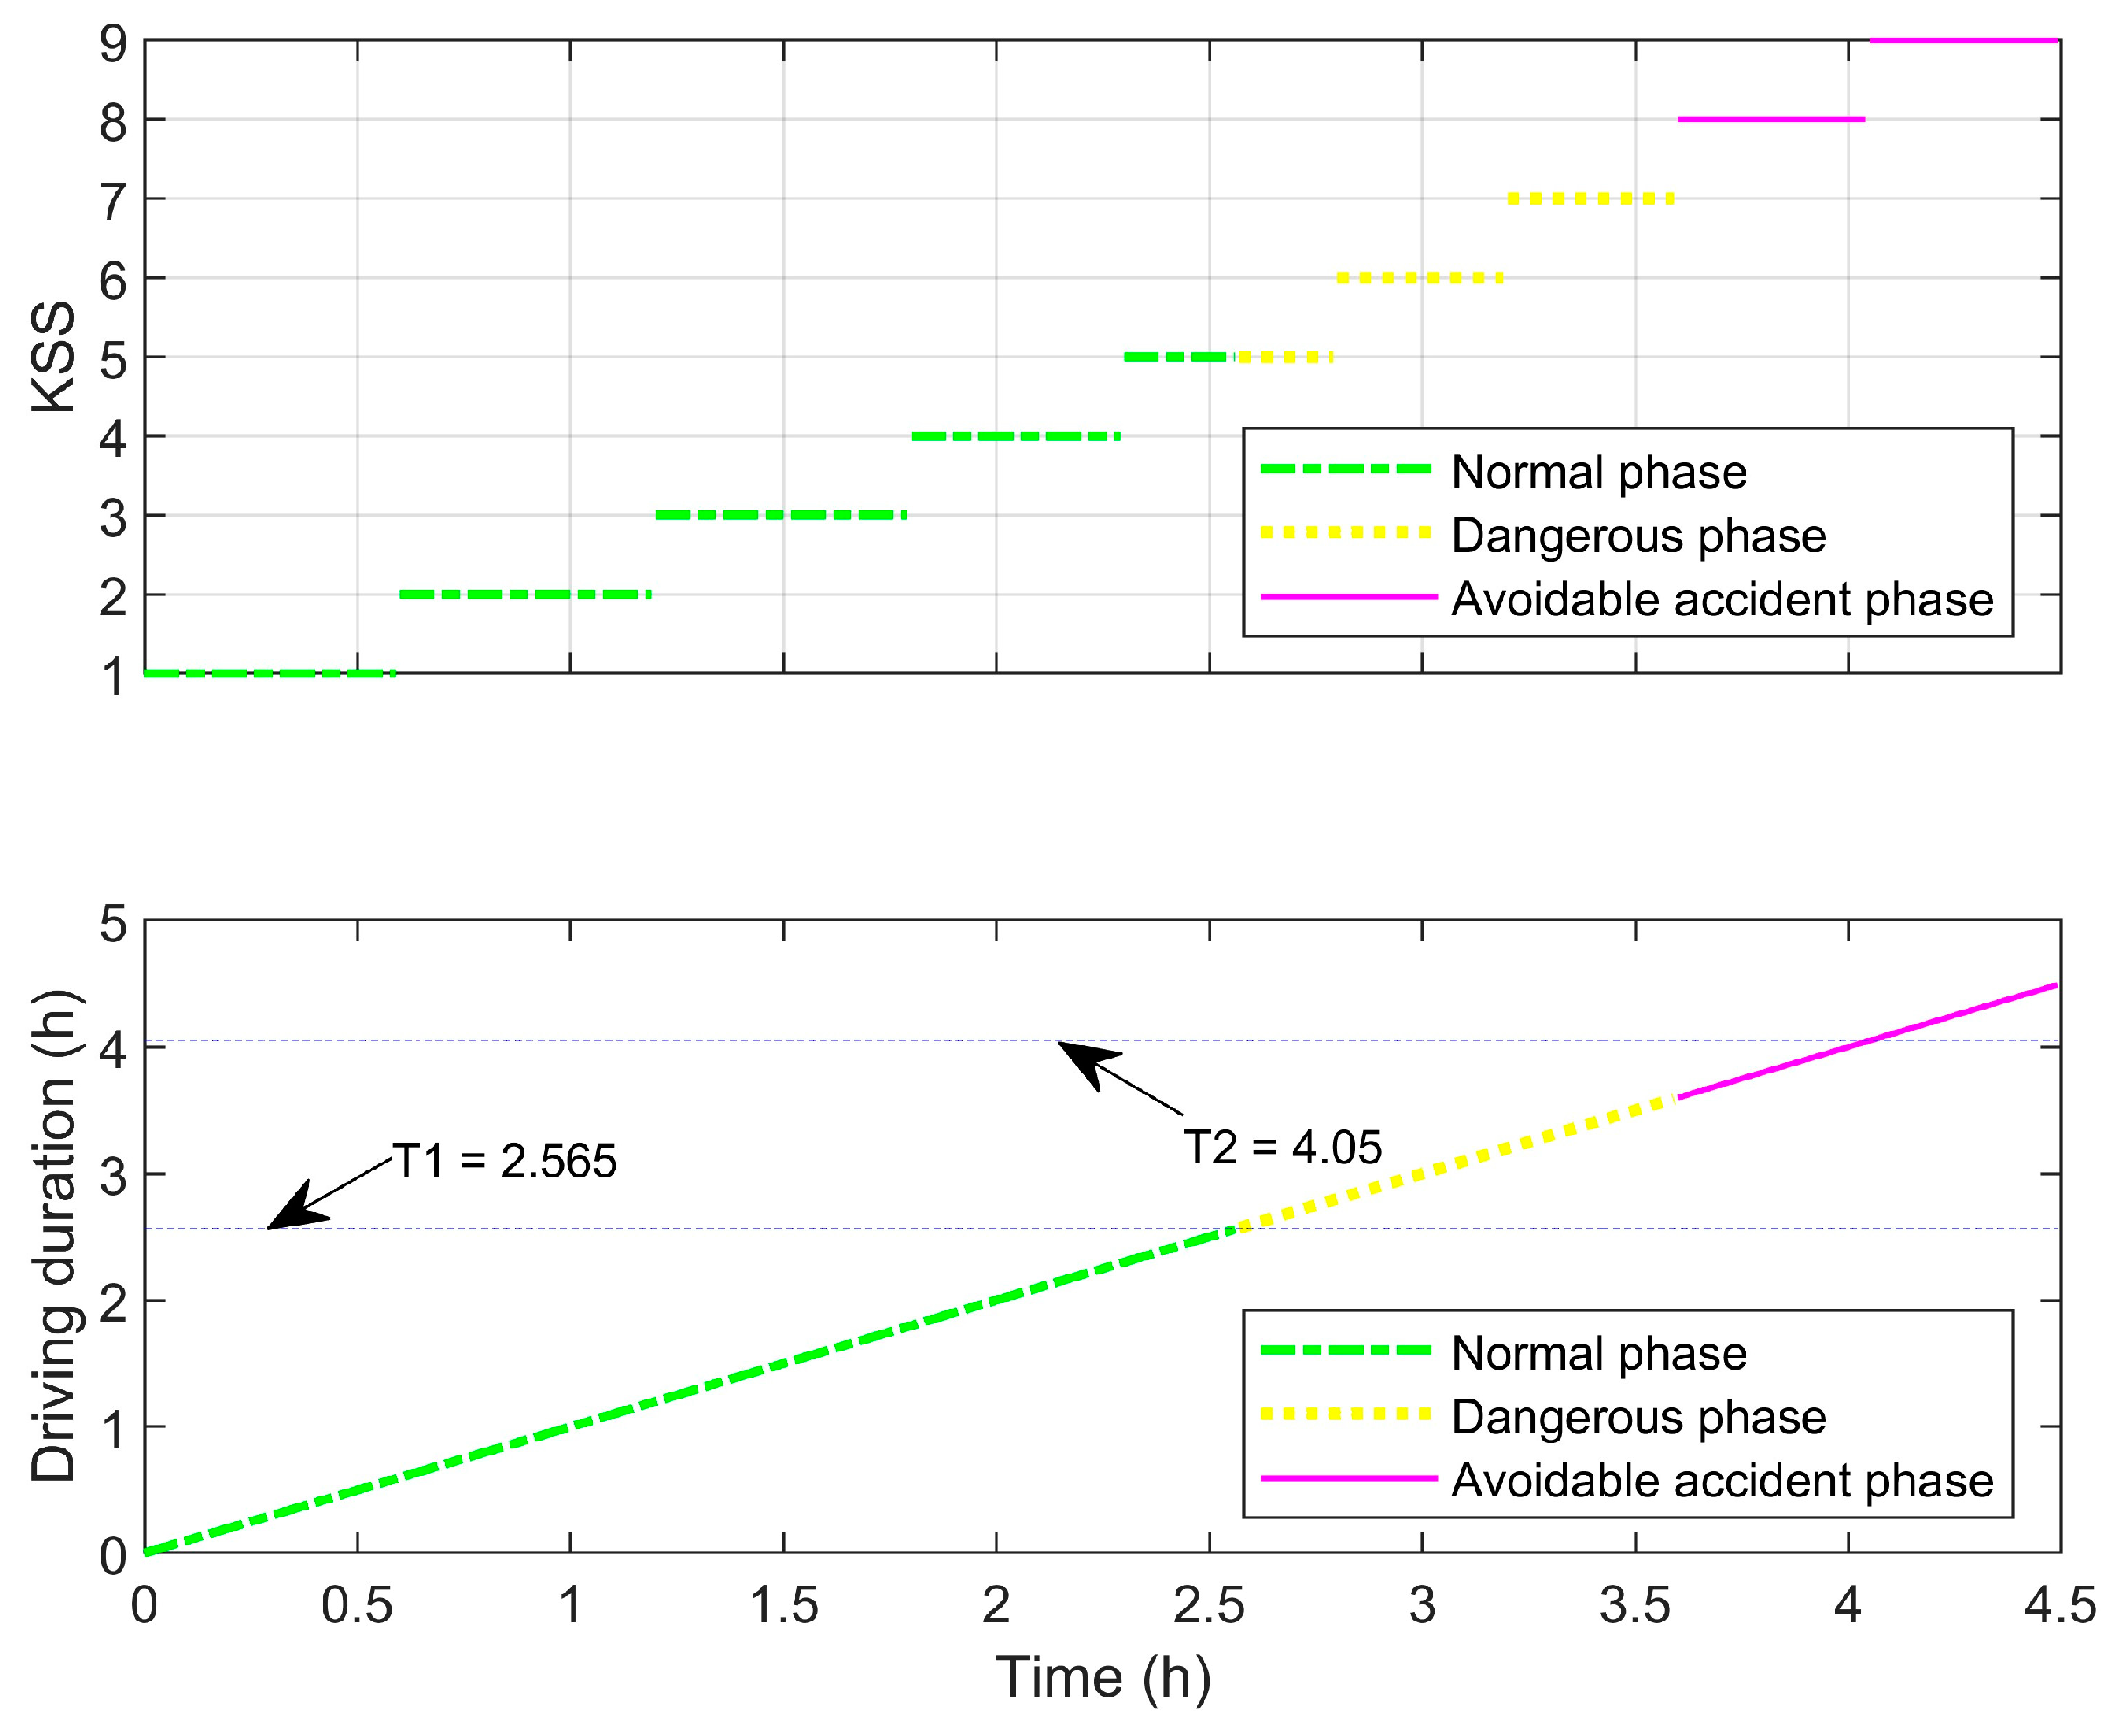
4.4. Fatigue Warning Algorithm
| Algorithm 3. Fatigue Warning Framework |
| At any time instant t: Warning Generation Sub-System: then warning_fatigue = −1 end then warning_fatigue = 1 end then warning_fatigue = 2 end then warning_fatigue = 3 end |
| Threshold Update Sub-System: T1 = 3 h T2 = 4.5 h If driver is not a professional driver T1 = T1 × 0.9 T2 = T2 × 0.9 end If then T1 = T1 × 0.95 end then T1 = T1 × 0.9 T2 = T2 × 0.9 end |
4.5. Warning Visualizations
5. Algorithm Validation
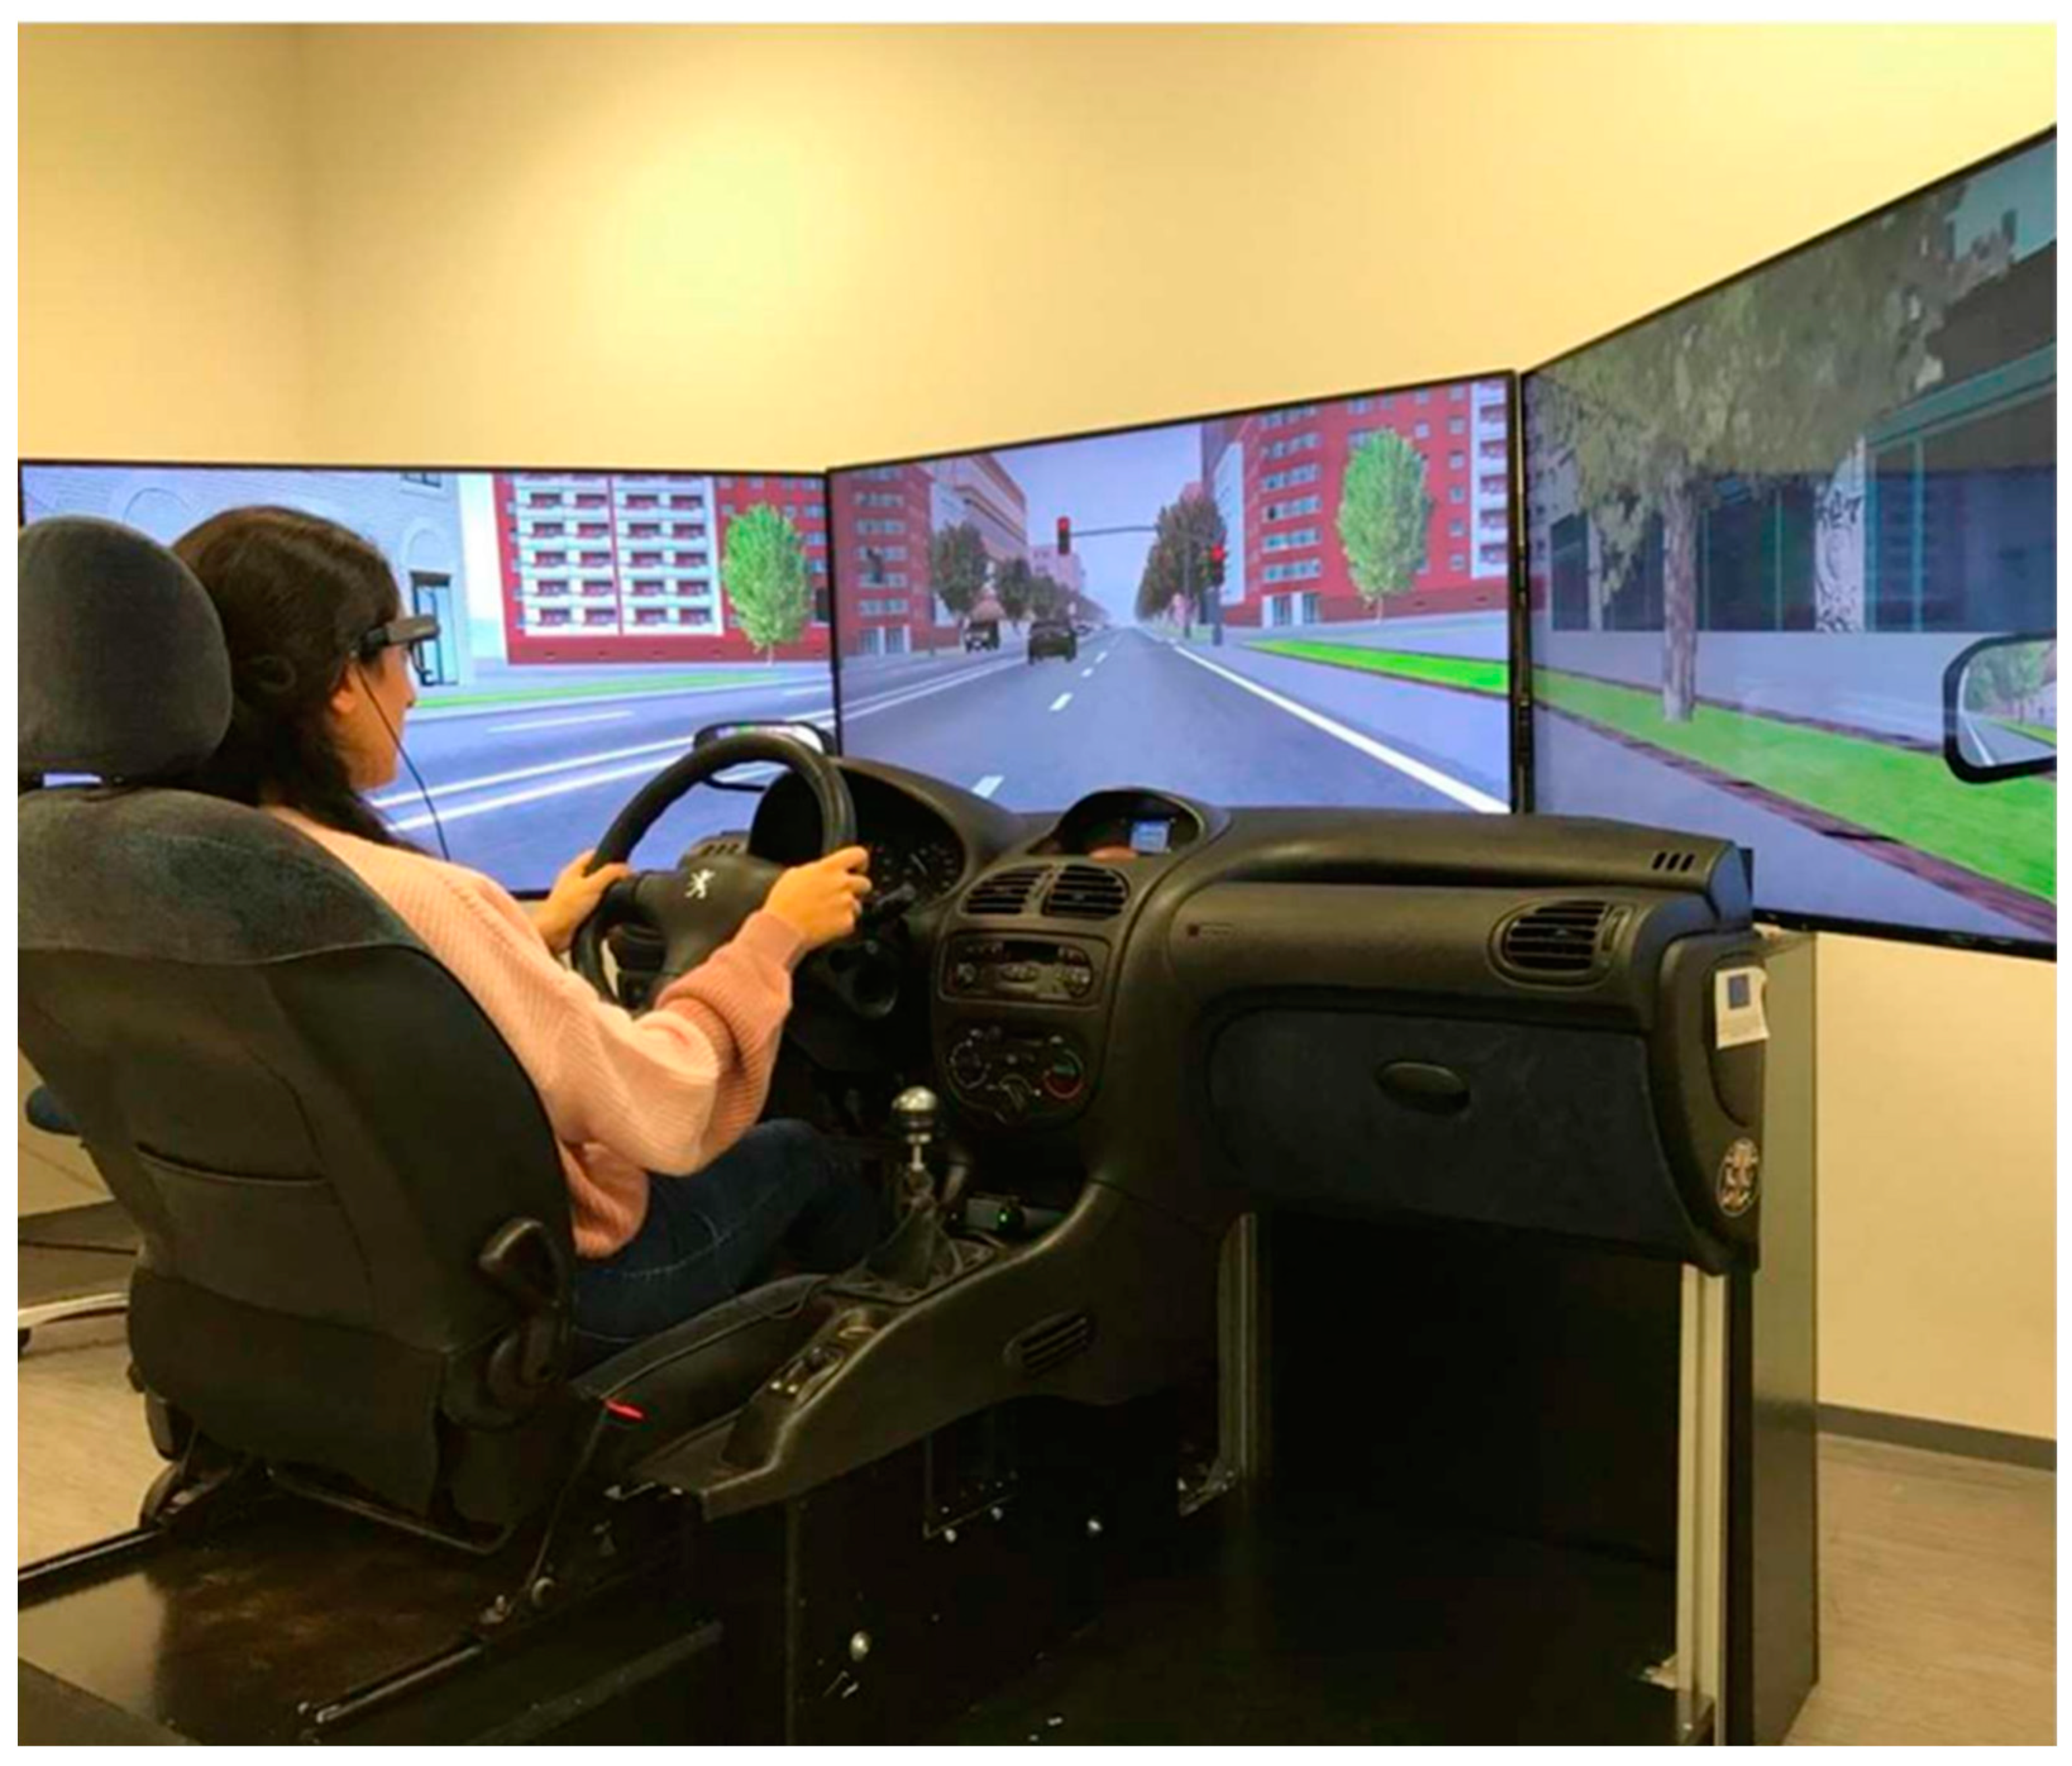
5.1. Driving Simulation Test
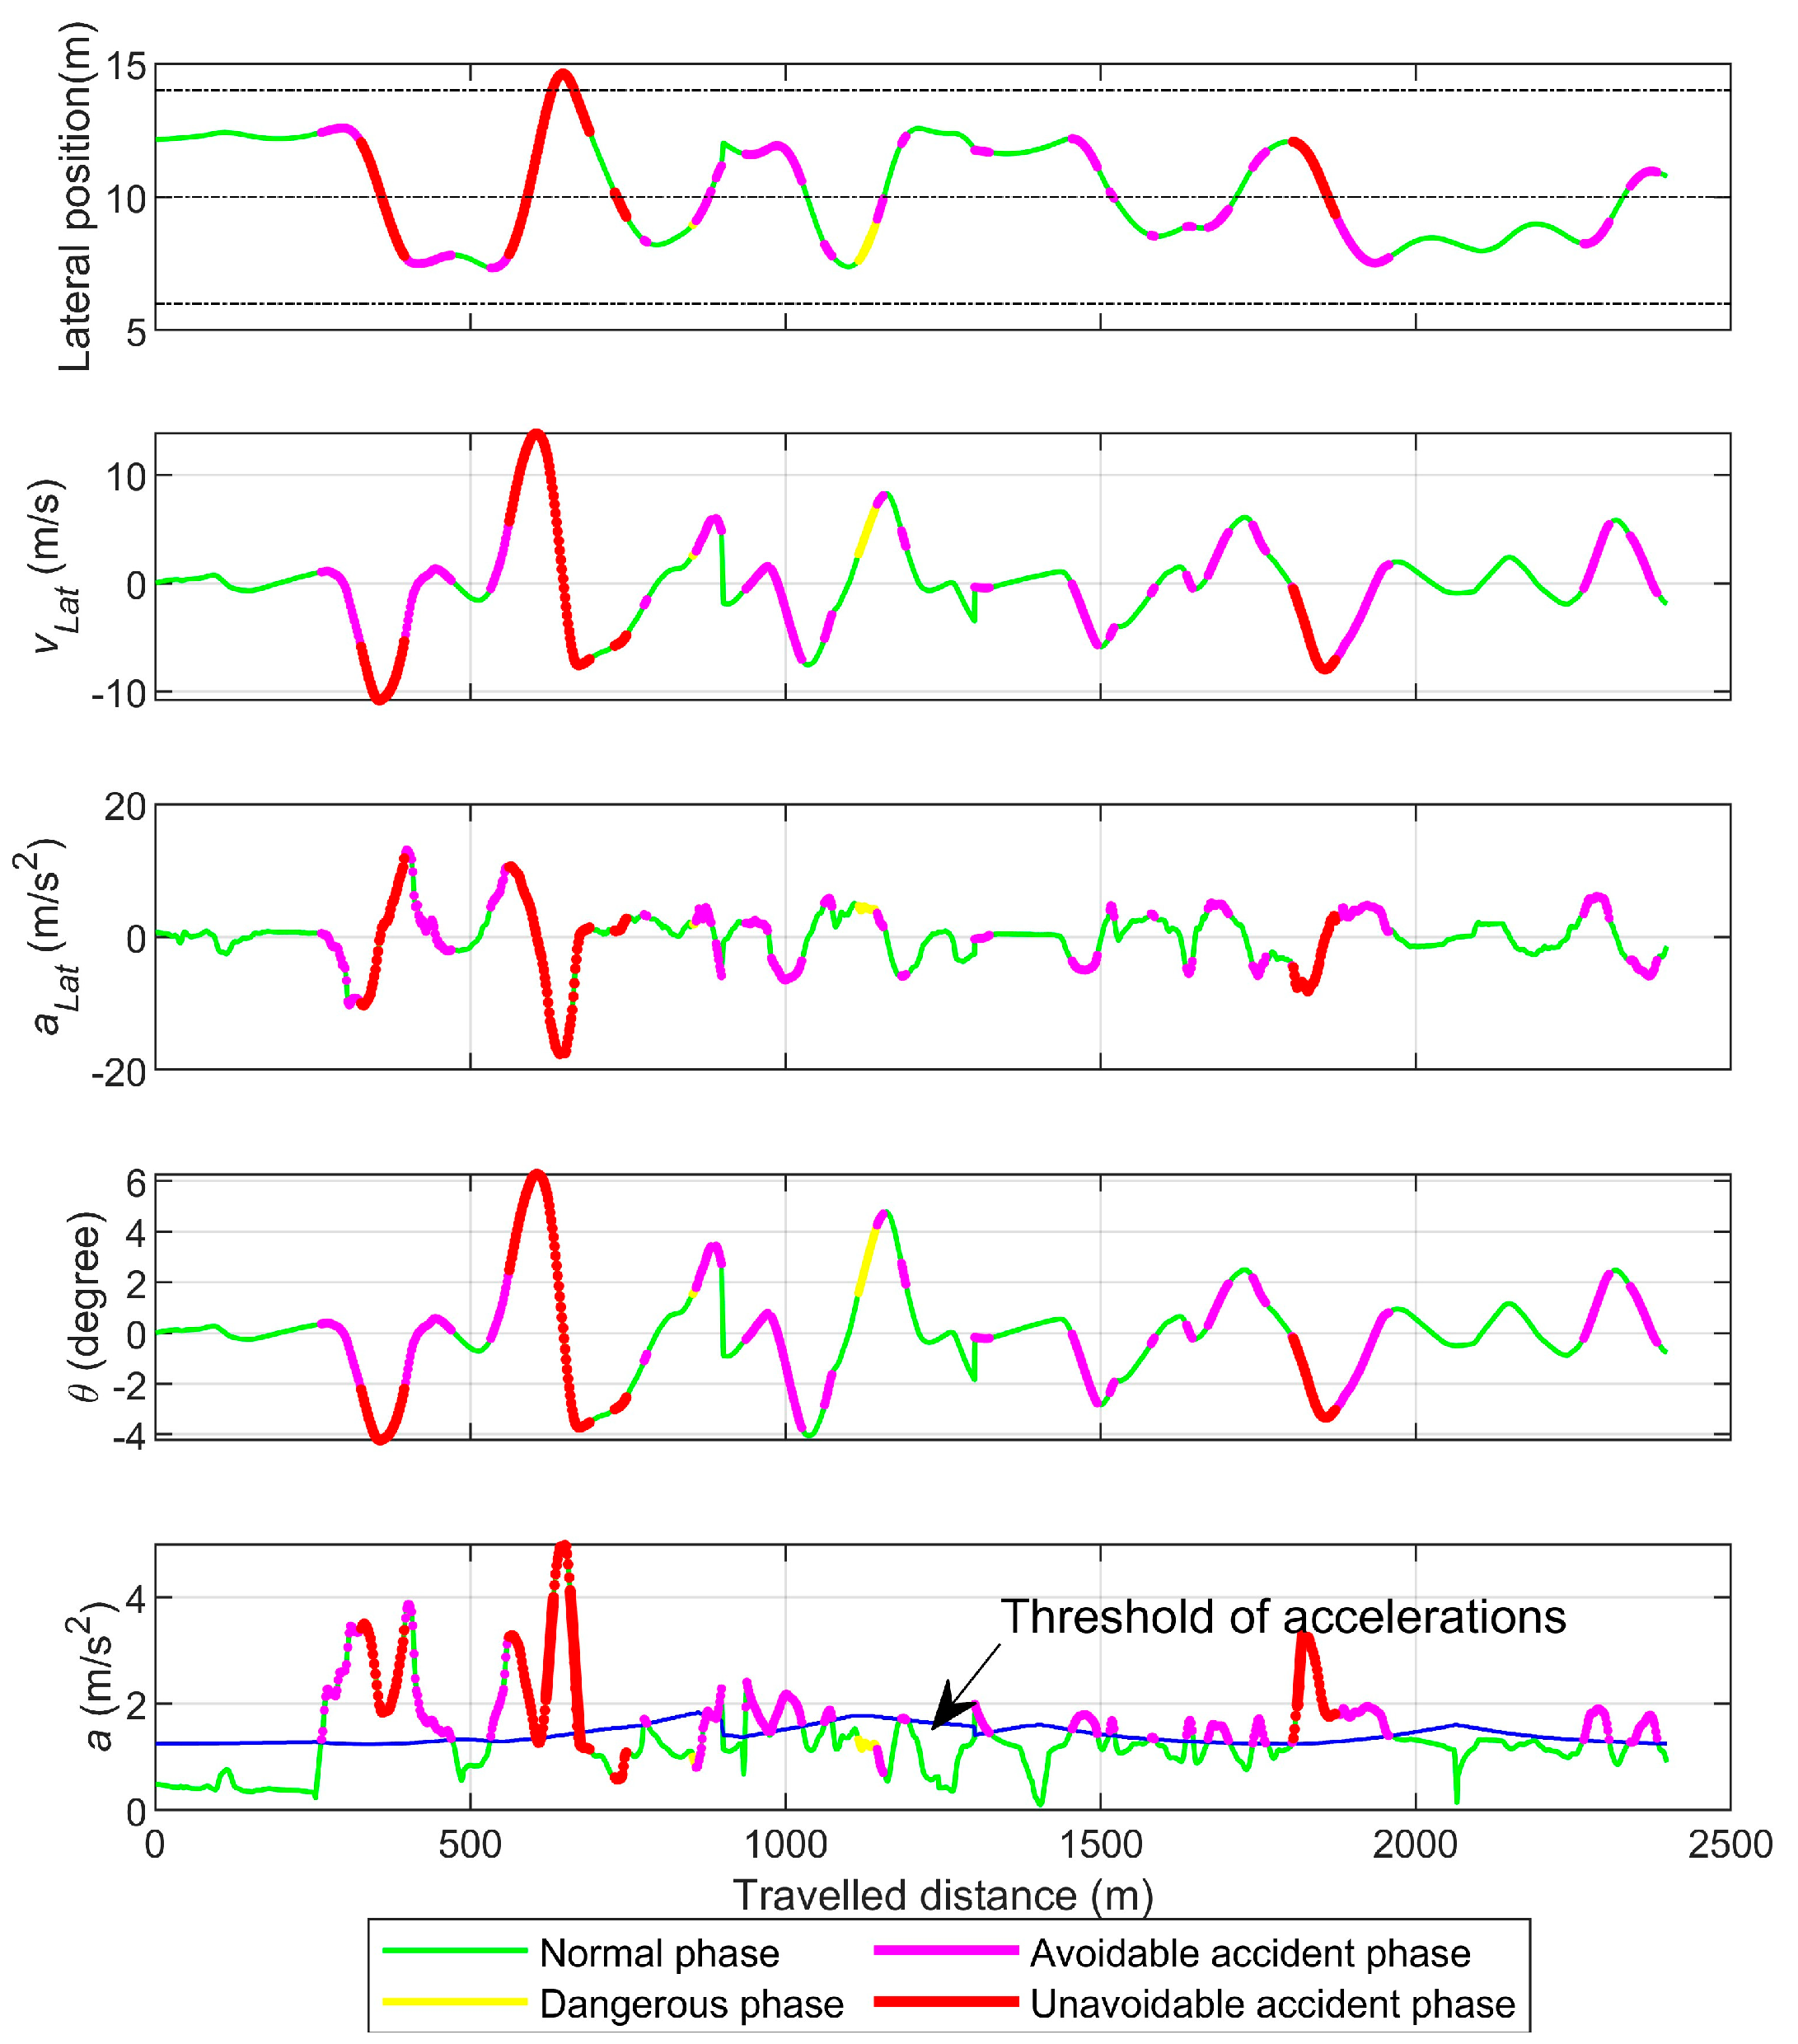
5.2. Results
6. Conclusions
Author Contributions
Funding
Institutional Review Board Statement
Informed Consent Statement
Data Availability Statement
Conflicts of Interest
References
- World Health Organization. Global Status Report on Road Safety 2016; World Health Organization: Geneva, Switzerland, 2018. [Google Scholar]
- Singh, S. Critical Reasons for Crashes Investigated in the National Motor Vehicle Crash Causation Survey (No. DOT HS 812 115). 2015. Available online: https://trid.trb.org/view.aspx?id=1346216&source=post_page (accessed on 10 November 2023).
- Furlan, A.D.; Kajaks, T.; Tiong, M.; Lavallière, M.; Campos, J.L.; Babineau, J.; Haghzare, S.; Ma, T.; Vrkljan, B. Advanced vehicle technologies and road safety: A scoping review of the evidence. Accid. Anal. Prev. 2020, 147, 105741. [Google Scholar] [CrossRef] [PubMed]
- Thompson, J.P.; Mackenzie, J.R.; Dutschke, J.K.; Baldock, M.R.; Raftery, S.J.; Wall, J. A trial of retrofitted advisory collision avoidance technology in government fleet vehicles. Accid. Anal. Prev. 2018, 115, 34–40. [Google Scholar] [CrossRef] [PubMed]
- Botzer, A.; Musicant, O.; Perry, A. Driver behavior with a smartphone collision warning application–a field study. Saf. Sci. 2017, 91, 361–372. [Google Scholar] [CrossRef]
- National Highway Traffic Safety Administration. Traffic Safety Facts 2006: A Compilation of Motor Vehicle Crash Data from the Fatality Analysis Reporting System the General Estimates System (NHTSAPublication No DOT-HS810-818); U.S. Department of Transportation: Washington, DC, USA, 2006.
- Birrell, S.A.; Fowkes, M.; Jennings, P.A. Effect of using an in-vehicle smart driving aid on real-world driver performance. IEEE Trans. Intell. Transp. Syst. 2014, 15, 1801–1810. [Google Scholar] [CrossRef]
- Fleming, J.M.; Allison, C.K.; Yan, X.; Lot, R.; Stanton, N.A. Adaptive driver modelling in ADAS to improve user acceptance: A study using naturalistic data. Saf. Sci. 2019, 119, 76–83. [Google Scholar] [CrossRef]
- McGehee, D.V.; Dingus, T.A.; Horowitz, A.D. An experimental field test of automotive headway maintenance/collision warning visual displays. Proc. Hum. Factors Ergon. Soc. Annu. Meet. 1994, 38, 1099–1104. [Google Scholar] [CrossRef]
- Dingus, T.A.; McGehee, D.V.; Manakkal, N.; Jahns, S.K.; Carney, C.; Hankey, J.M. Human factors field evaluation of automotive headway maintenance/collision warning devices. Hum. Factors 1997, 39, 216–229. [Google Scholar] [CrossRef]
- Wang, J.; Yu, C.; Li, S.E.; Wang, L. A forward collision warning algorithm with adaptation to driver behaviors. IEEE Trans. Intell. Transp. Syst. 2015, 17, 1157–1167. [Google Scholar] [CrossRef]
- Iranmanesh, S.M.; Mahjoub, H.N.; Kazemi, H.; Fallah, Y.P. An adaptive forward collision warning framework design based on driver distraction. IEEE Trans. Intell. Transp. Syst. 2018, 19, 3925–3934. [Google Scholar] [CrossRef]
- Panou, M.C. Intelligent personalized ADAS warnings. Eur. Transp. Res. Rev. 2018, 10, 59. [Google Scholar] [CrossRef]
- Sharpe, A.; Koh, B.R.; McLernon, S. Over-speeding warning system using wireless communications for road signs and vehicles. J. Adv. Technol. Eng. Res. 2016, 2, 140–155. [Google Scholar]
- Hegeman, G.; van der Horst, R.; Brookhuis, K.A.; Hoogendoorn, S.P. Functioning and Acceptance of Overtaking Assistant Design Tested in Driving Simulator Experiment. Transp. Res. Rec. 2007, 2018, 45–52. [Google Scholar] [CrossRef]
- Llorca, C.; Moreno, A.T.; Garcia, A. Modelling vehicles acceleration during overtaking manoeuvres. IET Intell. Transp. Syst. 2016, 10, 206–215. [Google Scholar] [CrossRef]
- Asaithambi, G.; Shravani, G. Overtaking behaviour of vehicles on undivided roads in non-lane based mixed traffic conditions. J. Traffic Transp. Eng. (Engl. Ed.) 2017, 4, 252–261. [Google Scholar] [CrossRef]
- Ji, Q.; Lan, P.; Looney, C. A probabilistic framework for modeling and real-time monitoring human fatigue. IEEE Trans. Syst. Man Cybern.-Part A Syst. Hum. 2006, 36, 862–875. [Google Scholar]
- Luo, X.Q.; Hu, R.; Fan, T.E. The driver fatigue monitoring system based on face recognition technology. In Proceedings of the 2013 Fourth International Conference on Intelligent Control and Information Processing (ICICIP), Beijing, China, 9–11 June 2013; pp. 384–388. [Google Scholar]
- Krajewski, J.; Batliner, A.; Golz, M. Acoustic sleepiness detection: Framework and validation of a speech-adapted pattern recognition approach. Behav. Res. Methods 2009, 41, 795–804. [Google Scholar] [CrossRef]
- Meng, F.; Li, S.; Cao, L.; Peng, Q.; Li, M.; Wang, C.; Zhang, W. Designing fatigue warning systems: The perspective of professional drivers. Appl. Ergon. 2016, 53, 122–130. [Google Scholar] [CrossRef]
- Yang, J.H.; Mao, Z.H.; Tijerina, L.; Pilutti, T.; Coughlin, J.F.; Feron, E. Detection of driver fatigue caused by sleep deprivation. IEEE Trans. Syst. Man Cybern.-Part A Syst. Hum. 2009, 39, 694–705. [Google Scholar] [CrossRef]
- Ji, Q.; Zhu, Z.; Lan, P. Real-time nonintrusive monitoring and prediction of driver fatigue. IEEE Trans. Veh. Technol. 2004, 53, 1052–1068. [Google Scholar] [CrossRef]
- Katrakazas, C.; Michelaraki, E.; Yannis, G.; Kaiser, S.; Senitschnig, N.; Ross, V.; Adnan, M.; Brijs, K.; Brijs, T.; Talbot, R.; et al. Toolbox of Recommended Data Collection Tools and Monitoring Methods and a Conceptual Definition of the Safety Tolerance Zone. Deliverable 3.2 of the EC H2020 project i-DREAMS. 2020. Available online: https://documentserver.uhasselt.be/bitstream/1942/32595/1/iDREAMS_814761_D3.2_30042020_Final.pdf (accessed on 10 November 2023).
- Nadimi, N.; Amiri, A.M.; Sadri, A. Introducing novel statistical-based method of screening and combining currently well- known surrogate safety measures. Transp. Lett. Int. J. Transp. Res. 2021, 14, 385–395. [Google Scholar] [CrossRef]
- Lamm, R.; Psarianos, B.; Mailaender, T. Highway Design and Traffic Safety Engineering Handbook; McGraw-Hill: New York, NY, USA, 1999. [Google Scholar]
- Kovaceva, J.; Nero, G.; Bärgman, J.; Dozza, M. Drivers overtaking cyclists in the real-world: Evidence from a naturalistic driving study. Saf. Sci. 2019, 119, 199–206. [Google Scholar] [CrossRef]
- Ahmed, I.; Karr, A.F.; Rouphail, N.M.; Chase, R.T.; Tanvir, S. Characterizing lane changing behavior and identifying extreme lane changing traits. Transp. Lett. Int. J. Transp. Res. 2022, 15, 450–464. [Google Scholar] [CrossRef]
- Amrutsamanvar, R. Modeling lateral movement decisions of powered two wheelers in disordered heterogeneous traffic conditions. Transp. Lett. Int. J. Transp. Res. 2020, 14, 195–214. [Google Scholar] [CrossRef]
- Čulík, K.; Kalašová, A.; Štefancová, V. Evaluation of driver’s reaction time measured in driving simulator. Sensors 2022, 22, 3542. [Google Scholar] [CrossRef] [PubMed]
- Eboli, L.; Mazzulla, G.; Pungillo, G. Combining speed and acceleration to define car users’ safe or unsafe driving behavior. Transp. Res. Part C Emerg. Technol. 2016, 68, 113–125. [Google Scholar] [CrossRef]
- Wilmots, B.; Hermans, E.; Brijs, T.; Wets, G. Speed control with and without advanced warning sign on the field: An analysis of the effect on driving speed. Saf. Sci. 2016, 85, 23–32. [Google Scholar] [CrossRef]
- Fleiter, J.; Watson, B. The speed paradox: The misalignment between driver attitudes and speeding behaviour. In Proceedings of the 2005 Australasian Road Safety Research, Policing & Education Conference, Wellington, New Zealand, 18 April 2005; pp. 187–192. [Google Scholar]
- Alavi, H.; Keleher, S.; Nieuwesteeg, M. Quantifying the contribution of low-level speeding to trauma in Victoria. In Proceedings of the Submitted to Australasian Road Safety Research, Policing & Education Conference, Melbourne, Australia, 12–14 November 2014. [Google Scholar]
- Stephens, A.N.; Nieuwesteeg, M.; Page-Smith, J.; Fitzharris, M. Self-reported speed compliance and attitudes towards speeding in a representative sample of drivers in Australia. Accid. Anal. Prev. 2017, 103, 56–64. [Google Scholar] [CrossRef]
- Treat, J.R.; Tumbas, N.S.; McDonald, S.T.; Shinar, D.; Hume, R.D.; Mayer, R.E. Tri-Level Study of the Causes of Traffic Accidents; Institute for Research in Public Safety: Bloomington, IN, USA, 1977; Volume 1. [Google Scholar]
- Bartley, S.H.; Chute, E. Fatigue and Impairment in Man; McGraw-Hill Book Company: New York, NY, USA, 1947. [Google Scholar]
- Ziakopoulos, A.; Theofilatos, A.; Papadimitriou, E.; Yannis, G. A meta-analysis of the impacts of operating in-vehicle information systems on road safety. IATSS Res. 2019, 43, 185–194. [Google Scholar] [CrossRef]
- Yang, K.; Alam, M.R.; Al Haddad, C.; Ezzati Amini, R.; Antoniou, C. An algorithm for safety tolerance zone calculation. Deliverable 4.2 of the EC H2020 project i-DREAMS. 2020. [Google Scholar]


| Source | Variable | Description |
|---|---|---|
| Mobileye (AWS) | THW | Time headway (float, second) |
| Time_indicator | Time of day indicator (str): day, dusk, night | |
| Speed_limit | Speed limit sign recognition | |
| Mobileye (Car) | Wiper_weather | Wipers indicator (bool): 1—on, 0—off |
| Brake | Braking indicator (bool): 1—on, 0—off | |
| Speed | Vehicle speed (int): km/h | |
| Left_turn | Left turn signal indicator(bool): 1—on, 0—off | |
| Right_turn | Right turn signal indicator(bool): 1—on, 0—off | |
| GPS | Vehicle heading in degrees (float) | |
| O7APP | Distraction | Distraction (via hand-held mobile phone use): 1—use, 0—not use |
| CardioWheel | KSS | Karolinska Sleepiness Scale (int): −1 (invalid), 1 = extremely alert, 2 = very alert, 3 = alert, 4 = rather alert, 5 = neither alert nor sleepy, 6 = some signs of sleepiness, 7 = sleepy, but no effort to keep awake, 8 = sleepy, some effort to keep awake, 9 = very sleepy, great effort keeping awake, fighting sleep |
| Gateway | Driving_duration | Driving duration (hour) |
| Questionnaire | Age | Driver age (year) |
| Gender | Driver gender(bool): 0—male, 1—Female | |
| Professional_driver | Professional driver (bool): 0—No, 1—Yes |
| Items | Factors | Adjustment Coefficient | |
|---|---|---|---|
| Environment factors | Web_weather | clear | 0 |
| rain | −3.0% | ||
| snow | −4.0% | ||
| frost | −2.0% | ||
| Wiper_weather | wiper_on | −3.0% | |
| wiper_off | 0 | ||
| Risky hours | driving in risky hours 00:00 a.m.–05:00 a.m. | −3.0% | |
| Time_indicator | daytime | 0 | |
| dusk | −2.0% | ||
| night time | −2.5% | ||
| Human factors | Fatigue | No tired (KSS 5 or Driving_duration < 4.5 h) | 0 |
| Tired (6 KSS 7 or (4.5 h Driving_duration < 6 h)) | −2.5% | ||
| very tired (KSS 8 or Driving_duration 6 h) | −4.0% | ||
| Distraction | Not distracted | 0 | |
| Distracted | −4.5% | ||
| Warning Levels | Headway Warning | Over-Speeding Warning | Fatigue Warning |
|---|---|---|---|
| Normal phase | A green car | A speed limit sign with the current speed value in green.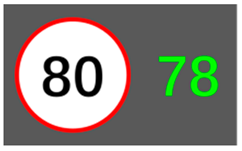 | No interventions |
| Dangerous phase | A yellow car with the time headway value in yellow.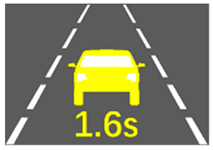 | A speed limit sign with the current speed value in yellow.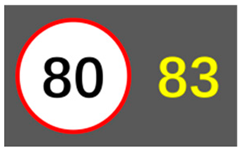 | A yellow coffee symbol with the current driving duration value in red and auditory alarms.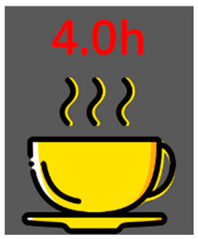 |
| Avoidable accident phase | A red car with the time headway value in red and auditory alarms.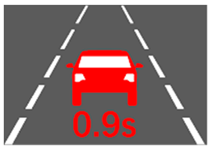 | A speed limit sign with the current speed value in red and auditory alarms.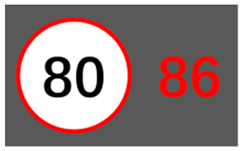 | A fatigue warning sign with increased pitch auditory alarms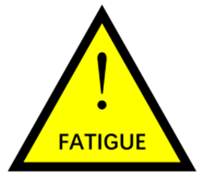 |
| Unavoidable accident phase | A red car with the time headway value in red and increased pitch auditory alarms.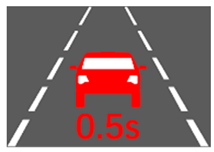 | A speed limit sign with the current speed value in red and increased pitch auditory alarms.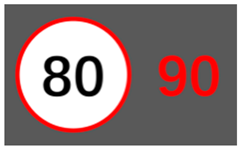 |
| Warning Types | Description | Illustration Example |
|---|---|---|
| Normal phase | An overtaking warning sign. | 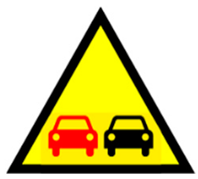 |
| Dangerous phase | An overtaking warning sign with a duration limit sign of the left-turn signal light on (i.e., 3 s), a flashing left turn sign and the current duration value of the left-turn signal light on in yellow. | 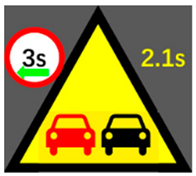 |
| An overtaking warning sign with a duration limit sign of the right-turn signal light on (i.e., 3 s), a flashing right turn sign and the current duration value of the right-turn signal light on in yellow. |  | |
| Avoidable accident phase | An overtaking warning sign with a duration limit sign of the left-turn signal light on (i.e., 3 s), a flashing left turn sign, the current duration value of the left-turn signal light on in red and auditory alarms. | 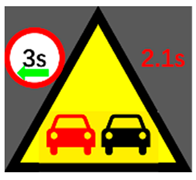 |
| An overtaking warning sign with a duration limit sign of the right-turn signal light on (i.e., 3 s), a flashing right turn sign, the current duration value of the right-turn signal light on in red and auditory alarms. | 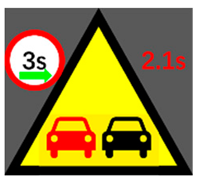 | |
| An overtaking warning sign with an acceleration limit sign, the current acceleration value in red and auditory alarms. | 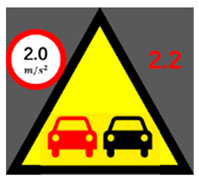 | |
| Unavoidable accident phase | An overtaking warning sign with a heading degree limit sign and the current heading degree value in red and increased pitch auditory alarms. | 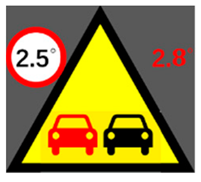 |
Disclaimer/Publisher’s Note: The statements, opinions and data contained in all publications are solely those of the individual author(s) and contributor(s) and not of MDPI and/or the editor(s). MDPI and/or the editor(s) disclaim responsibility for any injury to people or property resulting from any ideas, methods, instructions or products referred to in the content. |
© 2024 by the authors. Licensee MDPI, Basel, Switzerland. This article is an open access article distributed under the terms and conditions of the Creative Commons Attribution (CC BY) license (https://creativecommons.org/licenses/by/4.0/).
Share and Cite
Yang, K.; Al Haddad, C.; Alam, R.; Brijs, T.; Antoniou, C. Adaptive Intervention Algorithms for Advanced Driver Assistance Systems. Safety 2024, 10, 10. https://doi.org/10.3390/safety10010010
Yang K, Al Haddad C, Alam R, Brijs T, Antoniou C. Adaptive Intervention Algorithms for Advanced Driver Assistance Systems. Safety. 2024; 10(1):10. https://doi.org/10.3390/safety10010010
Chicago/Turabian StyleYang, Kui, Christelle Al Haddad, Rakibul Alam, Tom Brijs, and Constantinos Antoniou. 2024. "Adaptive Intervention Algorithms for Advanced Driver Assistance Systems" Safety 10, no. 1: 10. https://doi.org/10.3390/safety10010010
APA StyleYang, K., Al Haddad, C., Alam, R., Brijs, T., & Antoniou, C. (2024). Adaptive Intervention Algorithms for Advanced Driver Assistance Systems. Safety, 10(1), 10. https://doi.org/10.3390/safety10010010