Article

Short-Term Precision and Repeatability of Radiofrequency Echographic Multi Spectrometry (REMS) on Lumbar Spine and Proximal Femur: An In Vivo Study

1
IRCCS Istituto Ortopedico Galeazzi, Via Cristina Belgioioso, 173, 20157 Milan, Italy
2
Dipartimento di Scienze Biomediche per la Salute, Università degli Studi di Milano, Via Mangiagalli, 31, 20133 Milan, Italy
3
Scuola di Specializzazione in Radiodiagnostica, Università degli Studi di Milano, Via Festa del Perdono, 7, 20122 Milan, Italy
*
Author to whom correspondence should be addressed.
J. Imaging 2023, 9(6), 118; https://doi.org/10.3390/jimaging9060118
Submission received: 24 April 2023 / Revised: 28 May 2023 / Accepted: 8 June 2023 / Published: 11 June 2023
(This article belongs to the Section Medical Imaging)

Abstract

:
To determine the short-term intra-operator precision and inter-operator repeatability of radiofrequency echographic multi-spectrometry (REMS) at the lumbar spine (LS) and proximal femur (FEM). All patients underwent an ultrasound scan of the LS and FEM. Both precision and repeatability, expressed as root-mean-square coefficient of variation (RMS-CV) and least significant change (LSC) were obtained using data from two consecutive REMS acquisitions by the same operator or two different operators, respectively. The precision was also assessed in the cohort stratified according to BMI classification. The mean (±SD) age of our subjects was 48.9 ± 6.8 for LS and 48.3 ± 6.1 for FEM. Precision was assessed on 42 subjects at LS and 37 subjects on FEM. Mean (±SD) BMI was 24.71 ± 4.2 for LS and 25.0 ± 4.84 for FEM. Respectively, the intra-operator precision error (RMS-CV) and LSC resulted in 0.47% and 1.29% at the spine and 0.32% and 0.89% at the proximal femur evaluation. The inter-operator variability investigated at the LS yielded an RMS-CV error of 0.55% and LSC of 1.52%, whereas for the FEM, the RMS-CV was 0.51% and the LSC was 1.40%. Similar values were found when subjects were divided into BMI subgroups. REMS technique provides a precise estimation of the US-BMD independent of subjects’ BMI differences.

1. Background

Osteoporosis is a systemic skeletal disorder characterized by bone mass loss and deterioration of bone microarchitecture, which results in impairment of bone strength and an increased risk of bone fragility and susceptibility to fragility fractures [1]. Typical sites for osteoporotic fractures are the vertebral spine, proximal femur, and wrist, with hip fractures being associated with significant morbidity in the population [2]. In clinical practice, areal bone mineral density (BMD), expressed as g/cm2, is measured by dual-energy X-ray absorptiometry (DXA) and is one of the strongest predictors of fracture risk [3]. The T-score value represents the number of standard deviations that distinguishes the BMD assessed in the patient from the average BMD value in the reference population of young adults. According to the World Health Organization (WHO) diagnostic classification, the status of osteoporosis is defined by a BMD at the hip or lumbar spine that is less than or equal to 2.5 standard deviations (SD) below the average value of the reference population of young adults. Although BMD reflects about 70% of bone strength [4], it resulted in underdiagnosis and undertreatment of osteoporosis since most fragility fractures occur in subjects with BMD out of the osteoporosis classification criteria [5]. This can be explained by assuming that bone strength also depends on microarchitectural changes other than bone density, such as trabecular and cortical thinning, reduced trabecular connectivity, and increased cortical porosity [6]. Additionally, DXA may be prone to possible acquisition and analysis errors, which may lead to inaccurate BMD values [7]. These assumptions have led to the developing of new diagnostic strategies complementary or alternative to DXA. One successful approach for the lumbar spine is the Trabecular Bone Score (TBS), a textural index providing an indirect measurement of trabecular microarchitecture by evaluating pixel-grey-levels from lumbar spine DXA images [8]. Other quantitative methods have been introduced, such as quantitative computed tomography (QCT) and alternative non-ionizing methods, such as quantitative ultrasound (QUS) [9]. For QCT, a limitation is the lower availability and higher exposure to ionizing radiation, while QUS methods are limited by the fact that they are only applicable to peripheral sites like the heel, radius, tibia, and phalanx [10].
More recently, a new non-ionizing technique has been introduced with the name of radiofrequency echographic multi-spectrometry (REMS), which is based on a complete and complex spectral analysis of the raw, unfiltered ultrasound signals reflected from the bone surface of lumbar vertebrae and the femoral neck, the so-called radiofrequency (RF) ultrasound signals [11,12]. The main concept behind REMS technology is that “raw” ultrasound signals can provide useful information for bone status characterization. Usually, ultrasound devices for conventional imaging only use a small portion of the reflected ultrasound waves, filtering them out, to obtain a B-mode image [9,11,12]. Further, REMS can simultaneously analyze and acquire all RF wave spectra associated with the vertical lines of a given ultrasound image, laying the basis for the following statistical calculations needed to quantitative evaluate the examined bone [11,12,13]. Specifically, a REMS acquisition is obtained by placing the ultrasound probe on the abdomen or the hip to identify the target bone structure. The operator must set the scan depth to visualize the bone cortical interface in the central part of the sonographic field of view, with the transducer focus immediately above it. REMS software automatically detects the bone interface and identifies the region of interest (ROIs). For every sonographic line, a corresponding RF spectrum is extracted, and the software can identify cortical and trabecular bone layers. Moreover, the analysis of single scan line spectra allows the automatic exclusion of signal artifacts, such as those originating from osteophytes, thanks to the ability to detect “anomalous” characteristics in the frequency domain. Subsequently, the obtained spectrum deriving from the trabecular bone under investigation is analyzed to generate patient-specific spectra, which are compared to the previously derived anthropometrically matched reference models for pathological and normal bones, based on gender, age, BMI, and site [11,12]. Figure 1 shows an example of REMS acquisition and procession of RF signals at the femoral neck, as well as the comparison with spectral models.
This procedure leads to the calculation of the so-called “Osteoporosis Score”, which corresponds to the percentage of analyzed spectra classified as “osteoporotic”. Employing linear equations, the Osteoporosis Score is then transformed into US-BMD values, expressed as g/cm2, and T-score and Z-score are calculated through quantitative comparisons with the National Health and Nutrition Examination Survey (NHANES) reference curves [11,12]. Several studies demonstrated a significant correlation between BMD measured by REMS and DXA [12,13,14,15]. Additionally, a growing body of evidence supports REMS as a diagnostic procedure that can be employed in evaluating patients with secondary osteoporosis. As an example, in 2022, Caffarelli et al. investigated the role of the REMS technique in the assessment of type 2 diabetes mellitus (T2DM), by comparing REMS to DXA at central sites in a cohort of 90 T2DM postmenopausal subjects matched with 90 healthy controls [15]. Compared to DXA, in which BMD measurements were higher in T2DM women, they discovered that REMS measurements were significantly lower in T2DM than in non-T2DM women. REMS was also able to classify more T2DM patients as “osteoporotic” compared to DXA, suggesting a promising role for this technology to complement DXA in assessing T2DM subjects [15]. Finally, in a subset of diabetic women with fragility fractures, the BMD values from both DXA and REMS at the lumbar spine were lower compared to subjects without fractures; nevertheless, the difference was statistically significant only for US-BMD by REMS [15]. Another interesting paper by Lalli et al. investigated the role of the Fragility Score (FS), which has been proposed as an indicator of bone quality derived by REMS [16]. In their paper, the authors assessed the discriminative power of FS in subjects with primary and disuse-related osteoporosis related to spinal cord injuries, showing a significant difference in the FS between the fractured and non-fractured subjects for both populations [16].
An important aspect of bone densitometry is the reproducibility of measurements, typically expressed as precision error and least significant change (LSC) [17]. Low precision error values are necessary to identify small BMD changes over time, which may be related to natural disease progression or therapeutic decisions [18]. In this context, it has been shown how increasing values of body mass index (BMI) can negatively influence the precision values of BMD at central sites [19]. Therefore, our study aims to determine the short-term intra-operator precision and short-term inter-operator repeatability of US-BMD by REMS at the lumbar spine (LS) and proximal femur at the level of the neck (FEM), exploring the effect of BMI increase on precision values.

2. Materials and Methods
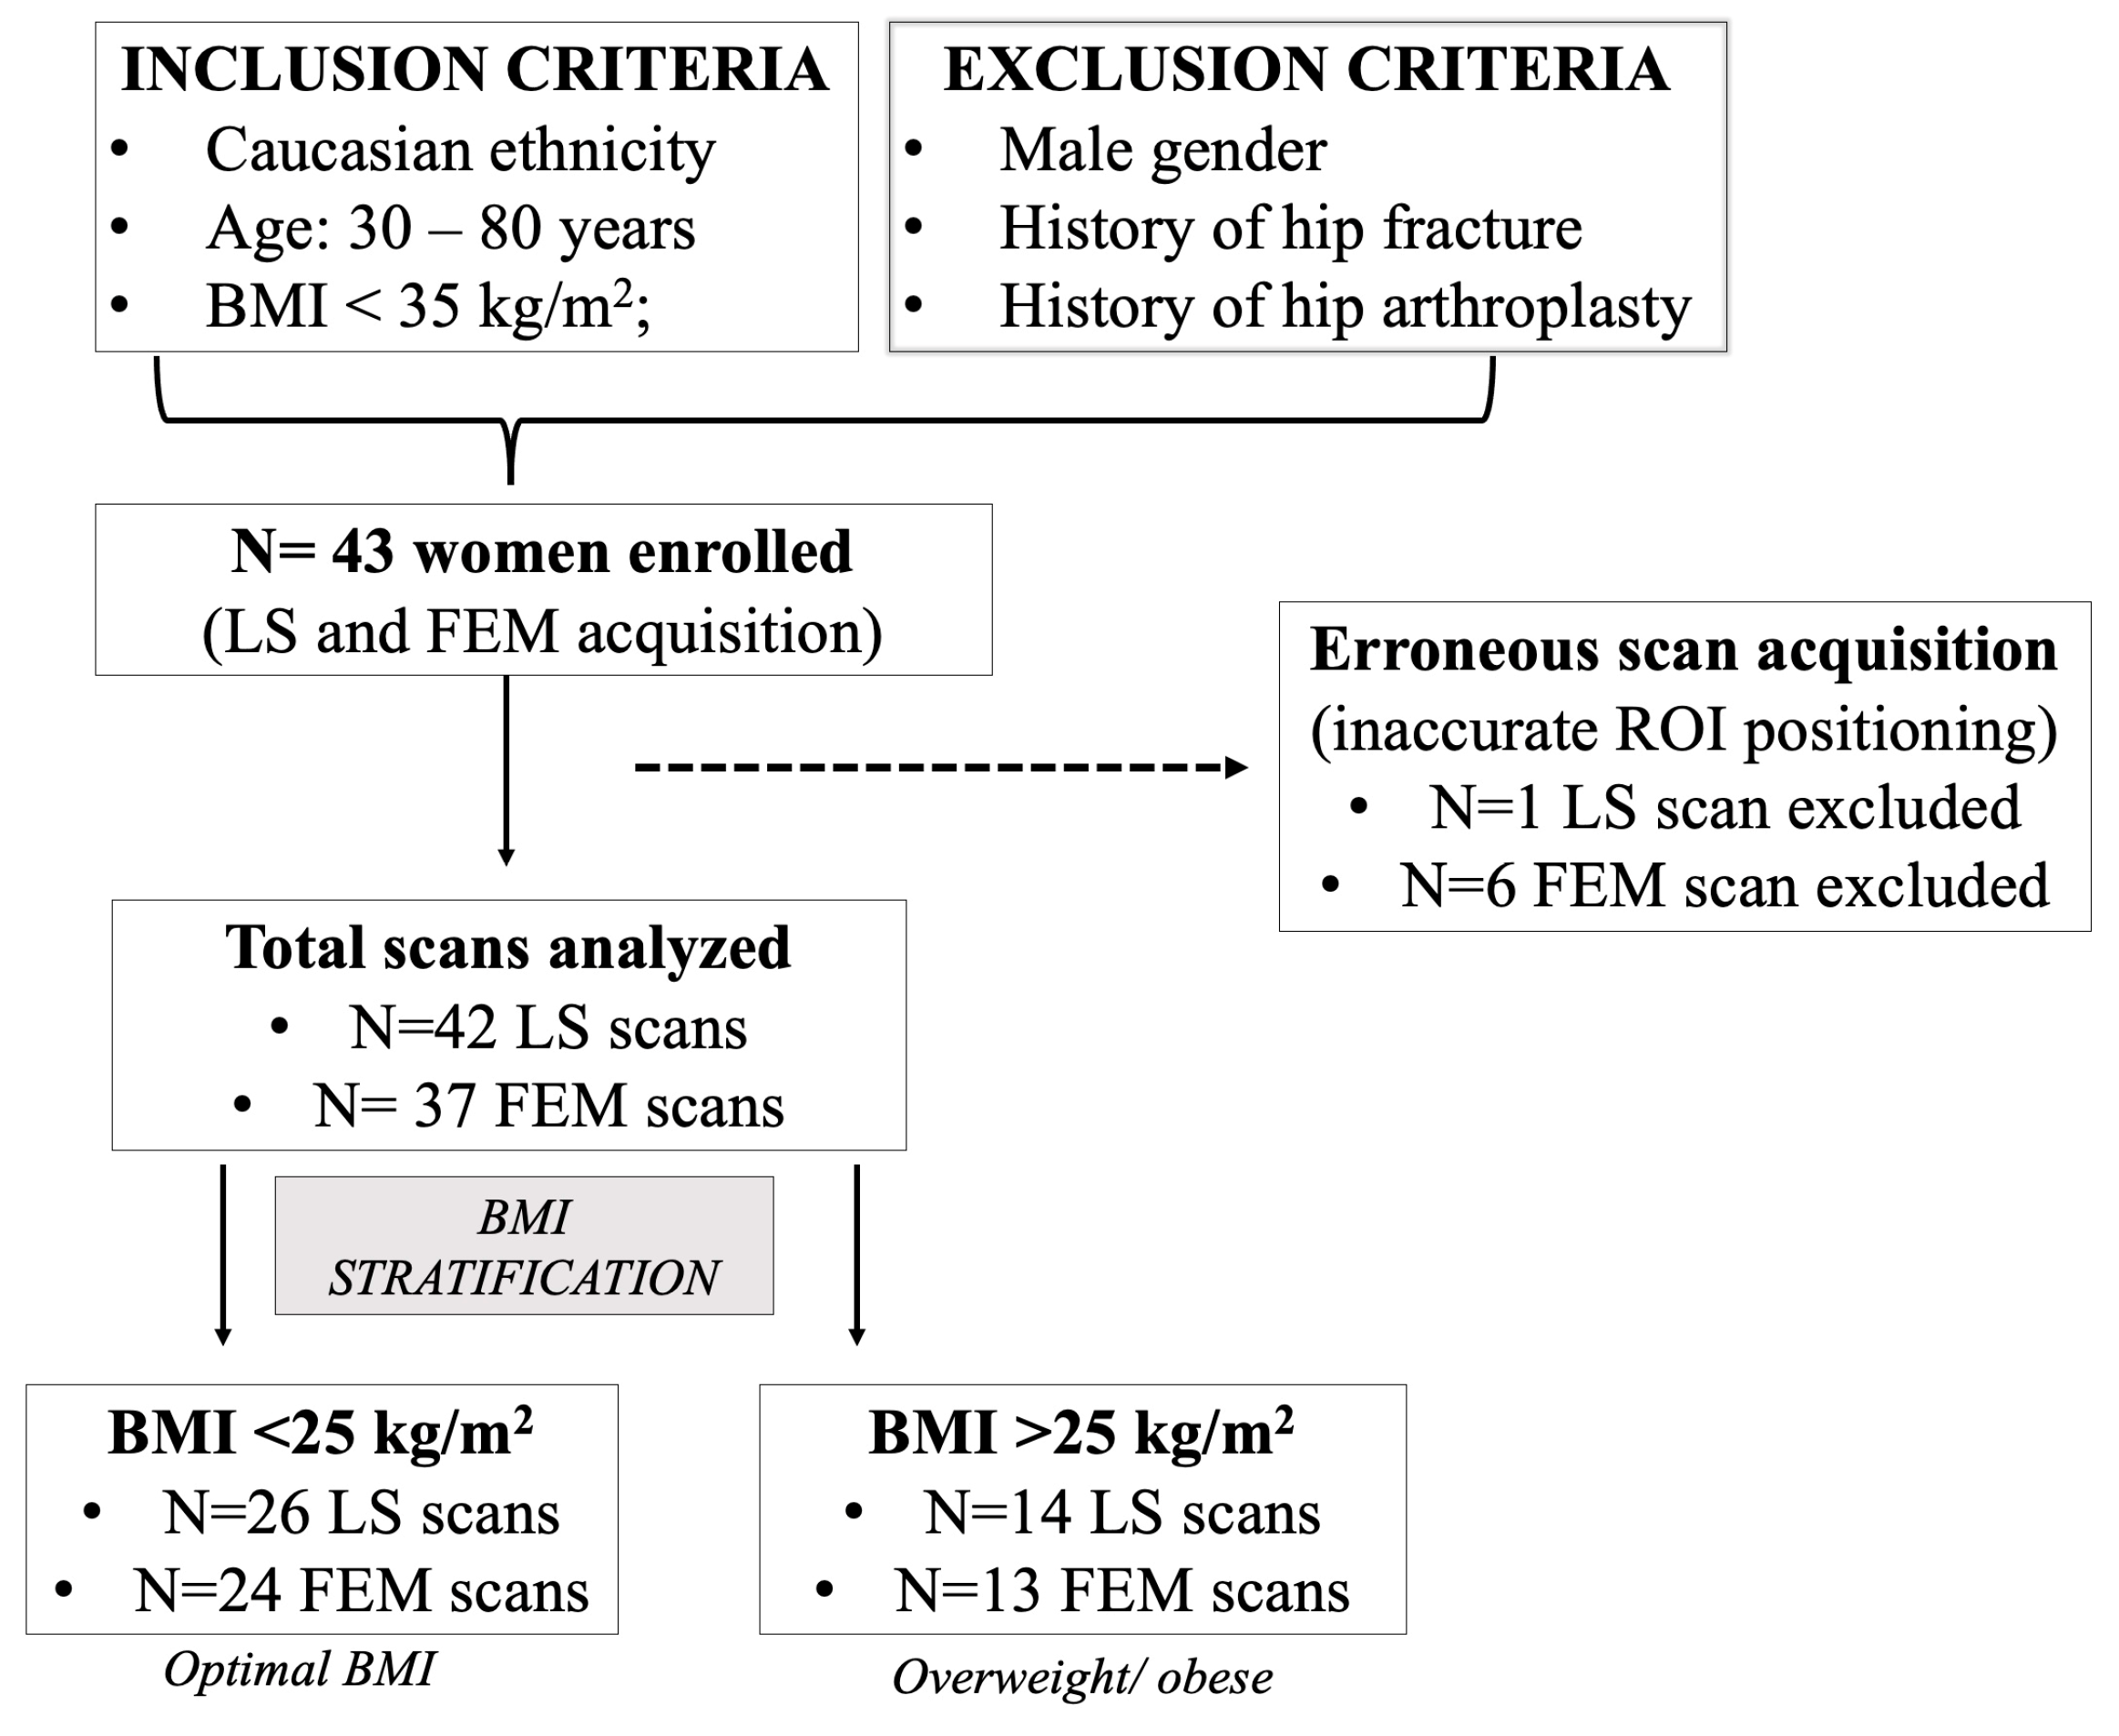
2.1. Study Design

Our study was a single-center observational study. The assessment of short-term precision was conducted in a single center at the Galeazzi Hospital in Milan (Italy). The study protocol was approved by the Ethics Review Boards of the Galeazzi Hospital in Milan (protocol name: ULTRADXA; Comitato Etico San Raffaele, Milan, Italy). According to the International Society for Clinical Densitometry (ISCD) Official Positions, precision studies should be carried out on patients similar in age, gender, and bone density to those seen in daily clinical practice [20]. Therefore, we asked hospital staff women around the menopausal age (both pre- and post-menopausal) to voluntarily enter the study. According to our protocol, we included only women because they are the vast majority of subjects we usually test for BMD using DXA. Women voluntarily entered the study after providing written informed consent and authorization for anonymized data publication. All patients were recruited from November 2019 to February 2020. Inclusion criteria were Caucasian ethnicity, age between 30 and 80 years, and body mass index (BMI) below 35 kg/m2; exclusion criteria involved male gender and those conditions that could interfere with the REMS evaluation at the two skeletal sites (previous history of hip fracture or hip arthroplasty surgery, previous surgery at the lumbar spine).

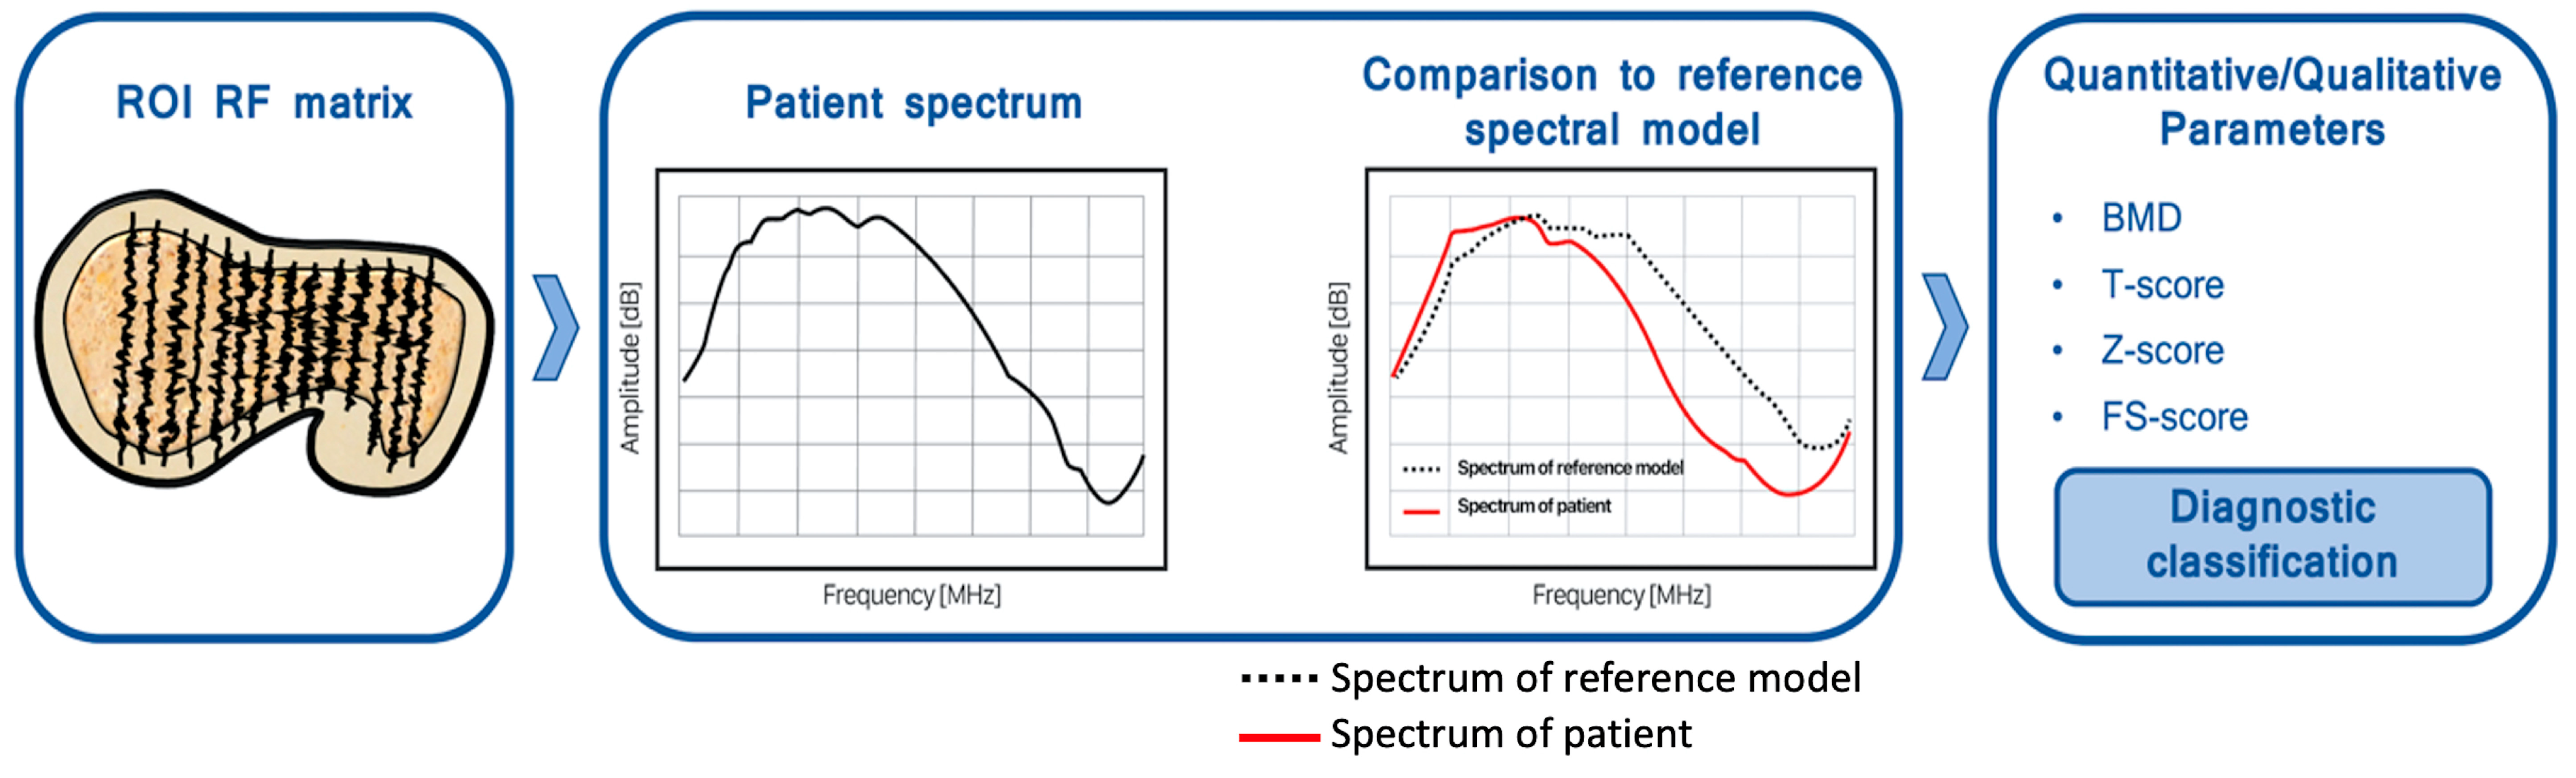
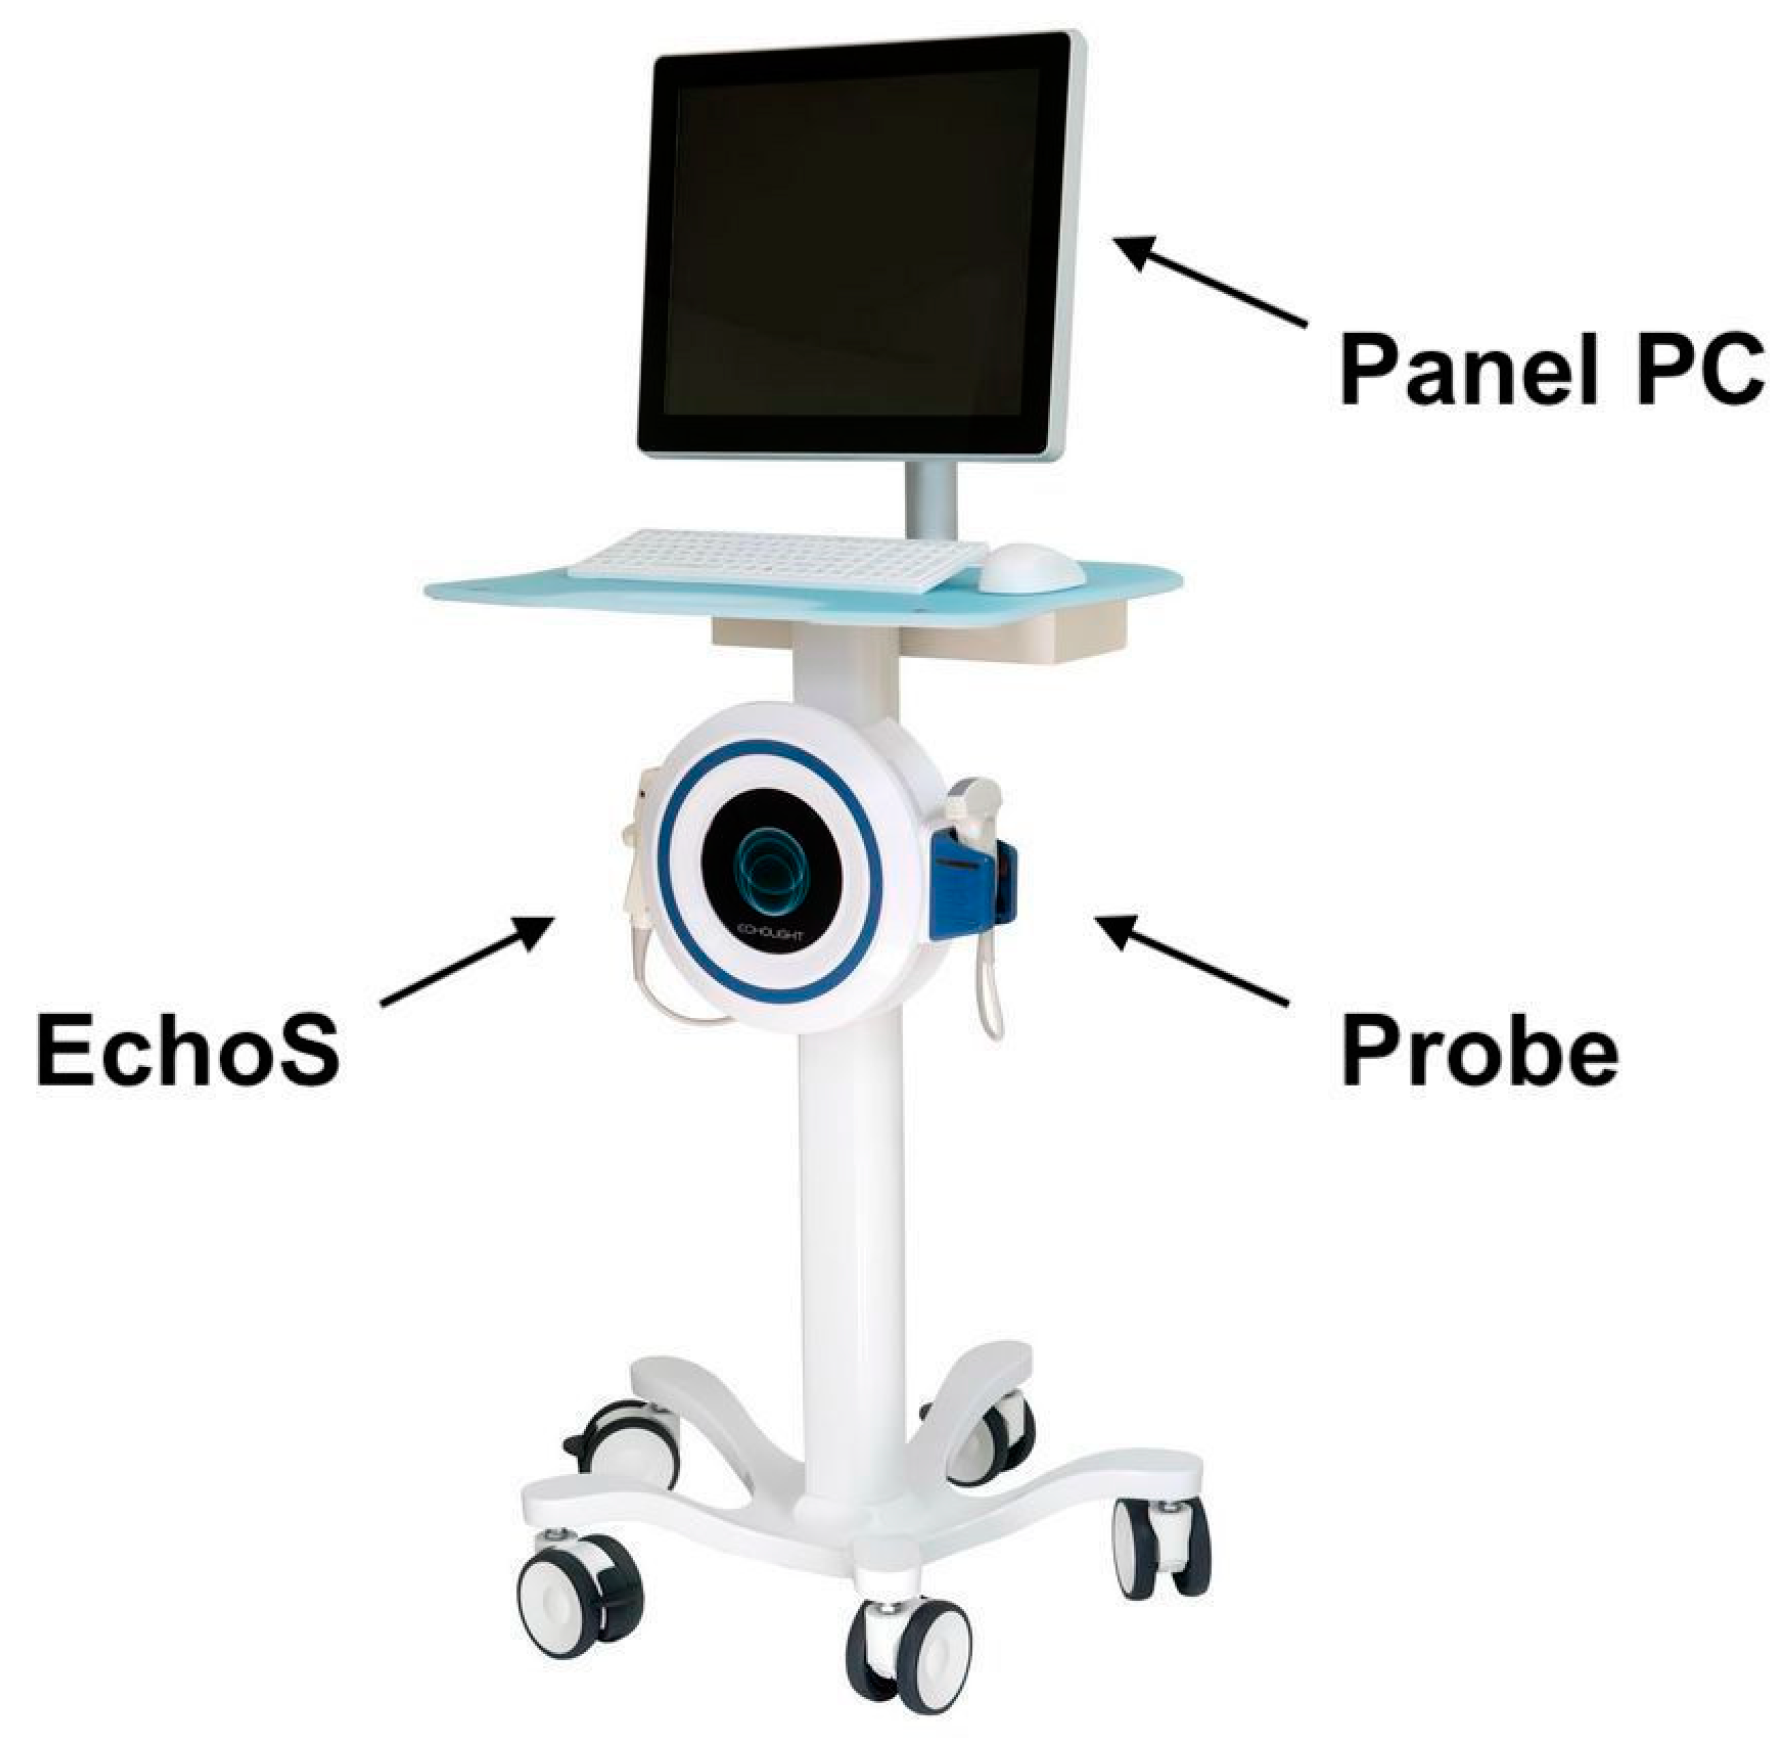
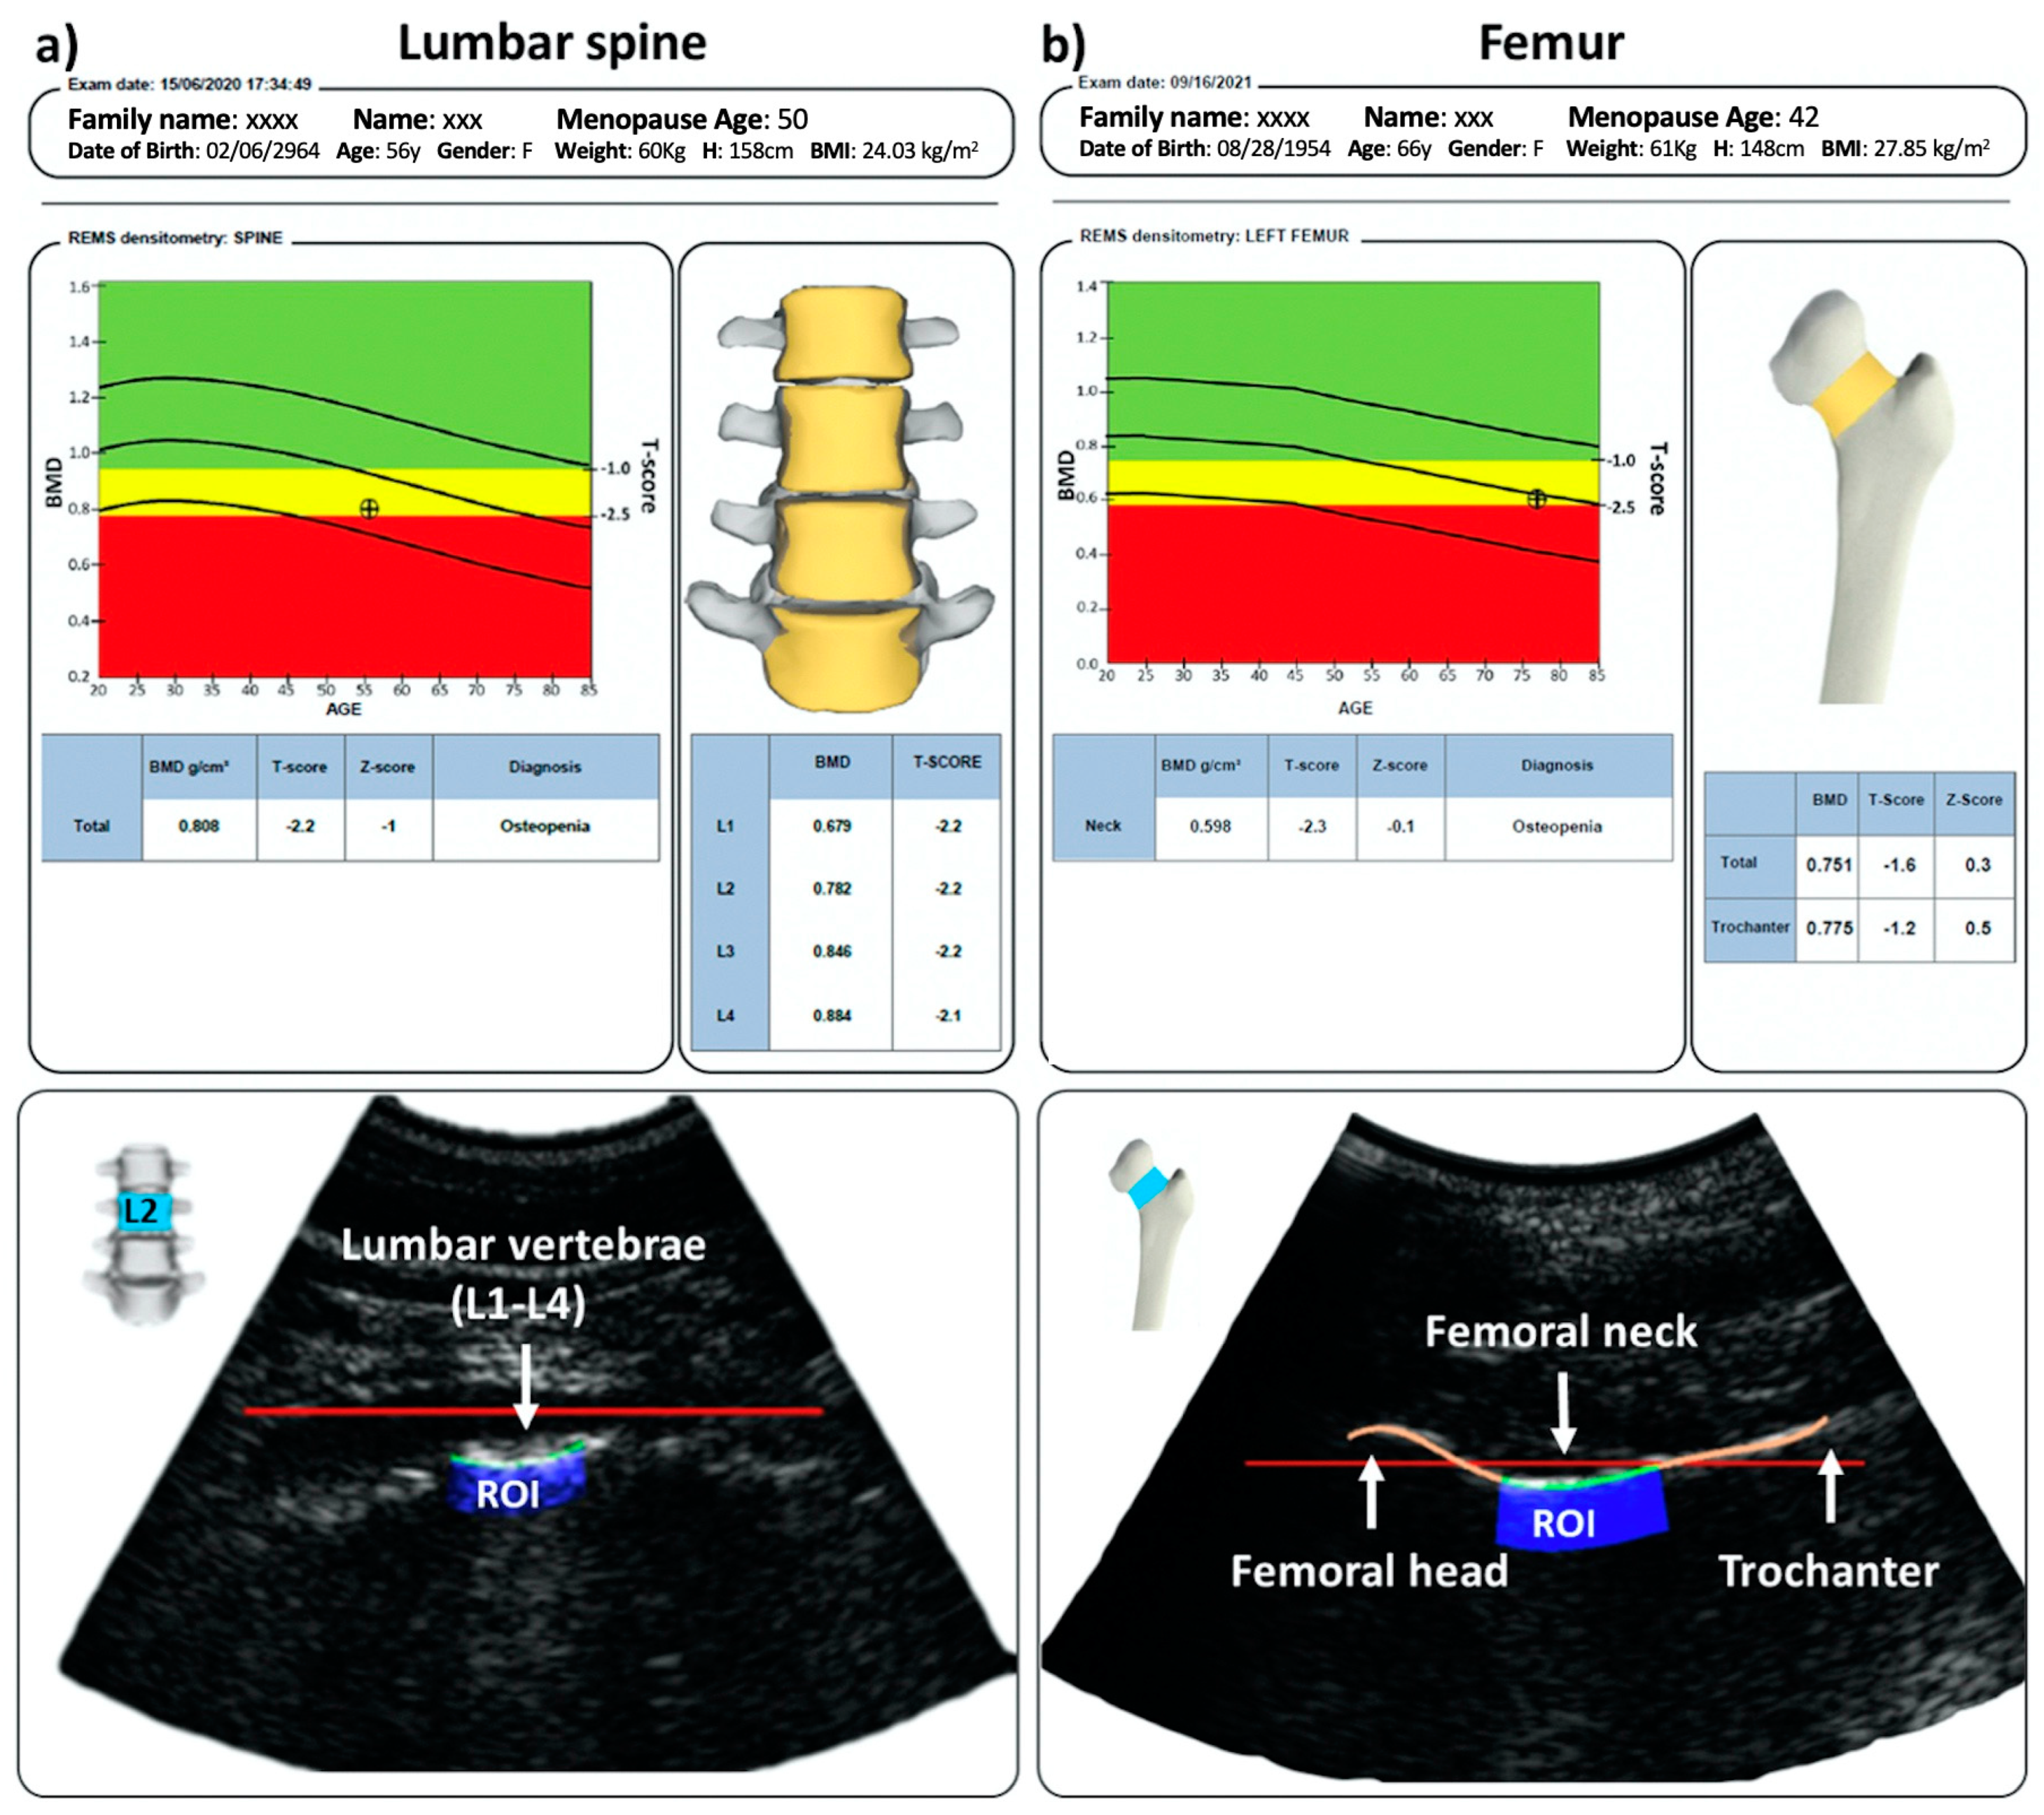
2.2. REMS Acquisitions

All the enrolled patients underwent an ultrasound investigation of the spine and femur performed with the REMS technology for US-BMD determination. Two radiologists with 10 years (C.M.) and 7 years (S.G) in abdominal and musculoskeletal ultrasound performed all the acquisitions. A dedicated echographic device (EchoStation, Echolight Spa, Lecce, Italy) was employed to perform REMS scans as recommended by the manufacturer [11]. The system is equipped with a convex probe transducer operating at the nominal frequency of 3.5 MHz. Figure 2 shows the ultrasound device that was used for the study.
For LS, the ultrasound transducer was placed under the sternum, to initially visualize L1 lumbar vertebra and then move downward until L4, according to the on-screen and audible indications provided by the device software. Each lumbar scan lasted 80 s (20 s per vertebra), followed by an automatic processing time of about 1–2 min. For FEM scans, the ultrasound transducer was placed parallel to the head-neck axis of the femur, to visualize the typical proximal femur cortical profile. The femoral neck scan lasted 40 s and was followed by an automatic processing time of about 1 min.
For all the acquisitions performed at both axial sites, the operator firstly sets image depth and focus according to the patient’s constitution. Subsequently, after starting the scan, the algorithm automatically identifies the target bone interfaces in the ultrasound images and detects the region of interest (ROIs) for the following calculations. The bone interface is expected to fall within the ultrasound beam focal zone and at least 3 cm from the image bottom.
To ensure maximum reliability of REMS diagnostic classifications, a rigorous quality check of the quality of all reports was performed according to a previous study [14]. Short-term intra-operator precision was calculated using data from two consecutive REMS acquisitions on the same patient by the same operator. Short-term inter-operator repeatability was obtained by performing a third REMS evaluation assessed by a second operator, on the same day. Both operators underwent specific training for using the EchoStation device and the REMS technology, which was performed on both phantoms and healthy volunteers (4 h for each operator). All consecutive REMS acquisitions at both axial sites were performed within the same day.
Figure 3 shows two representative images of subjects diagnosed with osteopenia, generated after a REMS scan performed at the spine (L1–L4), proximal femur (femoral neck, total femur), and the corresponding medical reports. The acquisitions display the bone interface, focus positioning, and the ROI on each axial site.

2.3. Statistical Analysis

Similar to previous studies, precision error was obtained in compliance with the ISCD official position instructions, which suggest testing BMD on 15 patients 3 times, or 30 patients 2 times [20,21] to achieve statistical power. Two operators were involved in this study (CM and SG). The short-term intra-operator precision and inter-operator repeatability were calculated as the root-mean-square coefficient of variation (RMS-CV), the smallest detectable change (SDD), and least significant change (LSC) for a 95% confidence level, according to the ISCD official positions.
The participants were stratified based on their BMI resulting in two groups of <25 and >25 kg/m2, representing the optimal and overweight/obese groups, respectively. An unpaired t-test compared the US-BMD between the optimal weight and the overweight/obese groups. All calculations were performed using an Excel electronic sheet (Microsoft Excel 2019, Redmond, WA, USA), GraphPad Prism (v. 8.0.1), and MATLAB (v. R2013b). Data are presented as mean ± standard deviation (SD). The short-term intra-operator precision and inter-operator repeatability were calculated in these subgroups of patients also.

3. Results

A total of 43 women were enrolled and underwent REMS scan both at the LS and the FEM site. Due to erroneous acquisition (inaccurate ROI positioning), one LS scan and six FEM scans were excluded; therefore, a total of n = 42 scans were analyzed at LS, while n = 37 scans were analyzed at FEM. For analysis convenience, the enrolled patients were divided into two groups so that the LS and FEM scans could be analyzed independently. A flowchart showing the inclusion/exclusion criteria, as well as the final number of scans analyzed according to the patient’s BMI, is reported in Figure 4.
Erroneous acquisitions were mainly related to FEM scans and one case of LS scan, in which the operator did not correctly set image depth and focus. In such cases, the device cannot provide US-BMD data; therefore, the scans were excluded. Such erroneous acquisitions were obtained at the very early phase of our study, due to technical difficulties related to using a new machine. Still, they were easily overcome once the problem was understood.
The characteristics of the patients who received a REMS scan at the LS and FEM are shown in Table 1. All women were Caucasian, mostly postmenopausal, aged up to 66 years, with a mean age (±SD) of 48.9 ± 6.8 for LS and 48.3 ± 6.1 for FEM. Regardless of the site, the majority of women showed normal (38.1% at LS, 32.4% at FEM) or osteopenic (52.4% at LS, 62.2% at FEM) US-BMD values, while only a minority showed US-BMD values in the range of osteoporosis (9.5% at LS, 5.4% at FEM).
Both intra- and inter-operator precision were assessed for the central axial sites (see Table 2). Regarding the intra-operator precision, RMS-CV was 0.47% for LS and 0.32% for FEM, with corresponding LSC values of 1.29% and 0.89%, respectively. Inter-operator repeatability error (RMS-CV) was 0.55% for the LS and 0.51% for the FEM, with corresponding LSC values of 1.52% and 1.40%, respectively.
To evaluate whether the precision was affected by the BMI variability among the enrolled subjects, the cohort (from the previous precision assessment study) was subdivided into two groups, in line with the WHO classification. Thus, patients with optimal weight (only one underweight patient was included in this group) were compared to overweight and obese subjects (see Table 3). Significant differences were found for the mean BMD between the normal and overweight/obese groups at both LS (p = 0.004) and FEM (p < 0.0001). The LSC values at the LS and FEM resulted in smaller in the optimal weight group with LSC = 1.23% and 0.73%, respectively, compared to the overweight/obese group with LSC = 1.40% and 1.07%, respectively.

4. Discussion

This study assessed the US-BMD precision at LS and FEM with REMS technology. Optimal values for intra-operator precision and inter-operator repeatability were found on both sites, which were superior to those typically documented with DXA when the characteristics of the study groups are analogous to those of the present study. The RMS-CV resulting from duplicate measurements at the spine by a single operator is 0.47% with REMS, whereas it is reported to range from 0.91% to 1.92% with DXA [22,23,24]. Similarly, the intra-operator repeatability expressed as RMS-CV at the femoral neck it is reported to range between 1.49% to 2.25% with DXA [24,25], while we found a smaller precision error of 0.32% with REMS.
Inter-operator repeatability assessment studies using DXA are quite scant. To our knowledge, one study shared similar patient characteristics as this work and identified an RMS-CV value of 1.6% when measured with DXA at the spine [26], still superior to the value of 0.55% found here by applying REMS technology.
In addition, the measurement error of DXA scanners is also affected by other factors such as inter-device variability [27], patient positioning, and post-acquisition analysis errors [7,28]. Considering the possible negative effect on the precision with DXA related to patient positioning, the margin of error with DXA could still be large [29]. On the contrary, it has been shown that REMS analysis is independent of patient positioning and inter-device variability [30].
The evaluation of the precision error of any densitometric device is fundamental in the clinical practice to warrant that over a certain time-lapse, any detected skeletal change is due to a bone density variation and not to the instrument’s uncertainty nor the operator’s experience [31]. In clinical practice, a BMD change that overcomes the precision error of a given densitometer is attributed to a meaningful biologic variation, identified with the LSC value. Therefore, minimizing precision errors ensures that the test is sensitive and accurate enough to detect subtle skeletal changes, thus enabling thorough monitoring of bone health and selecting the most reasonable therapeutic option for the patient [32].
Generally, when performing precision studies, cohort characteristics should be carefully selected since factors such as body mass index (BMI), study group as well as ethnicity, may impact the precision assessment. Regarding BMI-associated errors, a tendency for precision errors and variability of serial measurements to increase with increasing fat layering has been frequently observed in obese patients when using DXA [19,33], probably due to a reduction in X-ray penetration into thicker soft tissues [19].
On the contrary, when the cohort was stratified in two distinct BMI groups, REMS provided considerably high precision and repeatability, which were superior in subjects with normal weight. Indeed, considering that REMS can automatically identify the bone interface and then analyze the ultrasonic signal reflected by the bone region of interest in a highly selective way, it may still have a superior ability concerning DXA in dealing with physical interferences induced by fat tissues. For instance, during a REMS scan at the lumbar spine, the attenuation of the signal caused by the encumbrance of abdominal fat can be counteracted by increasing the focus and depth values and pressing the transducer on the abdomen, thus maximizing penetration of the ultrasonic beam on the bone interface [34]. On the other hand, DXA is a technique that measures the areal bone density from a bi-dimensional image obtained as a planar projection of the scanned tissues, without considering the effects of different volumetric tissues above the ROI. In fact, among others, this technique greatly suffers from the contribution of interposed soft tissues contained in the scan, which are projected on the image modifying the pixel values in the ROI and consequently influencing the bone density estimation [35].
Regarding the subjects investigated, for instance, postmenopausal women with osteoarthritis may have greater BMD variability compared to healthy subjects [36]. Amorim and colleagues have recently reported inter-operator repeatability errors with REMS to be above 1% at both femoral neck and lumbar spine, overall resulting in a slightly lower precision compared to the data previously published [14] as well as to the current work. Nevertheless, this work included a multiracial study group of Asian, Caucasian, and African descendant women, also affected by degenerative disorders. Therefore, it could be speculated that in a multiracial real-life group also, REMS precision performance is very good.
REMS analysis depends on the automatic processing of unfiltered native ultrasound signal and subsequent comparison of its spectral profile to a dedicated database of spectral models for healthy and osteoporotic bones to assess the diagnostic classification. Bone mass modulates the ultrasound echo and the associated spectra as a function of its physical properties [11,12]. After discarding artifacts, unfiltered signals of multiple scan lines are processed in parallel to obtain a patient-specific spectrum profile.
Considering that in the clinical routine, REMS scans can be repeated as often as needed, thanks to their non-invasive nature, it overcomes certain limitations of the DXA acquisition. Although DXA images can undergo several post-processing analyses, the initial quality of the scan must comply with high ISCD quality standards to avoid the detected BMD measurement being misleading. Furthermore, the REMS method can reduce reproducibility errors by automatically verifying whether the spectral features of the tested area correspond with the spectral model of the trabecular bone. If the ROI is considered non-diagnostic or the signals provided are of insufficient quality, the operator does not receive the test result and will need to perform the test again [11,12]. At the same time, a rigid training operator program for using REMS is needed to assure maximum diagnostic accuracy.
This study has some limitations, mainly related to the limited sample size that did not allow us to perform a complete stratification according to the various categories of BMI. Nevertheless, we reach a statistical power for the purpose of precision assessment, and further studies will explore the effect of soft tissue on US-BMD in very obese patients. Another possible limitation as a source of bias relates to the study population, which was entirely composed of Caucasian women. Finally, as our study was focused on the precision assessment of US-BMD values, we can neither provide data nor draw conclusions regarding the accuracy of the REMS technique. Nevertheless, our paper was specifically aimed at assessing the technical aspect of REMS precision according to BMI. Previous studies assessed the REMS accuracy compared to DXA on large populations, showing good agreement between US-BMD and the corresponding DXA-measured BMD [14,37].
In conclusion, US-BMD assessed with REMS technology can be used to precisely monitor bone density. Further studies will help define the proper interval time for longitudinal assessment of US-BMD with REMS.

Author Contributions

C.M., S.G. and D.A. contributed to the design, implementation of the research and enrollment. G.G., R.C., S.F. and M.P. contributed to the analysis of the results. C.M., L.M.S. and J.C.P. contributed to the writing of the manuscript, which was reviewed and approved by all authors. All authors have read and agreed to the published version of the manuscript.

Funding

This sponsored study was funded by Echolight Spa.

Institutional Review Board Statement

The study was conducted following the Declaration of Helsinki and approved by the Institutional Review Board of the Galeazzi Hospital in Milan (Comitato Etico San Raffaele, Milan, Italy), protocol code: ULTRADXA.

Informed Consent Statement

Women voluntarily entered the study after providing written informed consent and authorization for anonymized data publication.

Data Availability Statement

Not applicable.

Conflicts of Interest

The authors declare no conflict of interest.

References

  1. NIH Consensus Development Panel on Osteoporosis Prevention Diagnosis, Therapy—Osteoporosis Prevention, Diagnosis, and Therapy. JAMA J. Am. Med. Assoc. 2001, 285, 785–795. [CrossRef]
  2. Kanis, J.A.; Cooper, C.; Rizzoli, R.; Reginster, J.-Y. European guidance for the diagnosis and management of osteoporosis in postmenopausal women. Osteoporos. Int. 2019, 30, 3–44. [Google Scholar] [CrossRef] [PubMed] [Green Version]
  3. Hillier, T.A.; Cauley, J.A.; Rizzo, J.H.; Pedula, K.L.; Ensrud, K.E.; Bauer, D.C.; Lui, L.-Y.; Vesco, K.K.; Black, D.M.; Donaldson, M.G.; et al. WHO absolute fracture risk models (FRAX): Do clinical risk factors improve fracture prediction in older women without osteoporosis? J. Bone Miner. Res. 2011, 26, 1774–1782. [Google Scholar] [CrossRef] [Green Version]
  4. Johnell, O.; Kanis, J.A.; Oden, A.; Johansson, H.; De Laet, C.; Delmas, P.; Eisman, J.A.; Fujiwara, S.; Kroger, H.; Mellstrom, D.; et al. Predictive Value of BMD for Hip and Other Fractures. J. Bone Miner. Res. 2005, 20, 1185–1194. [Google Scholar] [CrossRef]
  5. de Liefde, I.I.; van der Klift, M.; de Laet, C.E.D.H.; Van Daele, P.L.A.; Hofman, A.; Pols, H.A.P. Bone mineral density and fracture risk in type-2 diabetes mellitus: The Rotterdam Study. Osteoporos. Int. 2005, 16, 1713–1720. [Google Scholar] [CrossRef] [PubMed]
  6. Bouxsein, M.L.; Zysset, P.; Glüer, C.C.; McClung, M.; Biver, E.; Pierroz, D.; Ferrari, S.L. Perspectives on the non-invasive evaluation of femoral strength in the assessment of hip fracture risk. Osteoporos. Int. 2020, 31, 393–408. [Google Scholar] [CrossRef] [PubMed]
  7. Messina, C.; Bandirali, M.; Sconfienza, L.M.; D’alonzo, N.K.; Di Leo, G.; Papini, G.D.E.; Ulivieri, F.M.; Sardanelli, F. Prevalence and type of errors in dual-energy X-ray absorptiometry. Eur. Radiol. 2015, 25, 1504–1511. [Google Scholar] [CrossRef]
  8. Bazzocchi, A.; Isaac, A.; Dalili, D.; Fotiadou, A.; Kariki, E.P.; Kirschke, J.S.; Krestan, C.R.; Messina, C.; Oei, E.H.; Phan, C.M.; et al. Imaging of Metabolic Bone Diseases: The Spine View, Part I. Semin. Musculoskelet. Radiol. 2022, 26, 478–490. [Google Scholar] [CrossRef]
  9. Diez-Perez, A.; Brandi, M.L.; Al-Daghri, N.; Branco, J.C.; Bruyère, O.; Cavalli, L.; Cooper, C.; Cortet, B.; Dawson-Hughes, B.; Dimai, H.P.; et al. Radiofrequency echographic multi-spectrometry for the in-vivo assessment of bone strength: State of the art—Outcomes of an expert consensus meeting organized by the European Society for Clinical and Economic Aspects of Osteoporosis, Osteoarthritis and Mus. Aging Clin. Exp. Res. 2019, 31, 1375–1389. [Google Scholar] [CrossRef] [Green Version]
  10. Olszynski, W.P.; Brown, J.P.; Adachi, J.D.; Hanley, D.A.; Ioannidis, G.; Davison, K.S.; CaMos Research Group. Multisite quantitative ultrasound for the prediction of fractures over 5 years of follow-up: The Canadian Multicentre Osteoporosis Study. J. Bone Miner. Res. 2013, 28, 2027–2034. [Google Scholar] [CrossRef] [Green Version]
  11. Conversano, F.; Franchini, R.; Greco, A.; Soloperto, G.; Chiriacò, F.; Casciaro, E.; Aventaggiato, M.; Renna, M.D.; Pisani, P.; Di Paola, M.; et al. A Novel Ultrasound Methodology for Estimating Spine Mineral Density. Ultrasound Med. Biol. 2015, 41, 281–300. [Google Scholar] [CrossRef] [PubMed]
  12. Casciaro, S.; Peccarisi, M.; Pisani, P.; Franchini, R.; Greco, A.; De Marco, T.; Grimaldi, A.; Quarta, L.; Quarta, E.; Muratore, M.; et al. An Advanced Quantitative Echosound Methodology for Femoral Neck Densitometry. Ultrasound Med. Biol. 2016, 42, 1337–1356. [Google Scholar] [CrossRef] [PubMed]
  13. Pisani, P.; Greco, A.; Conversano, F.; Renna, M.D.; Casciaro, E.; Quarta, L.; Costanza, D.; Muratore, M.; Casciaro, S. A quantitative ultrasound approach to estimate bone fragility: A first comparison with dual X-ray absorptiometry. Measurement 2017, 101, 243–249. [Google Scholar] [CrossRef]
  14. di Paola, M.; Gatti, D.; Viapiana, O.; Cianferotti, L.; Cavalli, L.; Caffarelli, C.; Conversano, F.; Quarta, E.; Pisani, P.; Girasole, G.; et al. Radiofrequency echographic multispectrometry compared with dual X-ray absorptiometry for osteoporosis diagnosis on lumbar spine and femoral neck. Osteoporos. Int. 2019, 30, 391–402. [Google Scholar] [CrossRef]
  15. Caffarelli, C.; Tomai Pitinca, M.D.; Al Refaie, A.; Ceccarelli, E.; Gonnelli, S. Ability of radiofrequency echographic multispectrometry to identify osteoporosis status in elderly women with type 2 diabetes. Aging Clin. Exp. Res. 2022, 34, 121–127. [Google Scholar] [CrossRef]
  16. Lalli, P.; Mautino, C.; Busso, C.; Bardesono, F.; Di Monaco, M.; Lippi, L.; Invernizzi, M.; Minetto, M.A. Reproducibility and Accuracy of the Radiofrequency Echographic Multi-Spectrometry for Femoral Mineral Density Estimation and Discriminative Power of the Femoral Fragility Score in Patients with Primary and Disuse-Related Osteoporosis. J. Clin. Med. 2022, 29, 3761. [Google Scholar] [CrossRef]
  17. el Maghraoui, A.; Achemlal, L.; Bezza, A. Monitoring of Dual-Energy X-ray Absorptiometry Measurement in Clinical Practice. J. Clin. Densitom. 2006, 9, 281–286. [Google Scholar] [CrossRef]
  18. Engelke, K.; Glüer, C.-C. Quality and performance measures in bone densitometry. Osteoporos. Int. 2006, 17, 1283–1292. [Google Scholar] [CrossRef]
  19. Knapp, K.M.; Welsman, J.R.; Hopkins, S.J.; Fogelman, I.; Blake, G.M. Obesity Increases Precision Errors in Dual-Energy X-Ray Absorptiometry Measurements. J. Clin. Densitom. 2012, 15, 315–319. [Google Scholar] [CrossRef]
  20. Lewiecki, E.M.; Gordon, C.M.; Baim, S.; Leonard, M.B.; Bishop, N.J.; Bianchi, M.-L.; Kalkwarf, H.J.; Langman, C.B.; Plotkin, H.; Rauch, F.; et al. International Society for Clinical Densitometry 2007 Adult and Pediatric Official Positions. Bone 2008, 43, 1115–1121. [Google Scholar] [CrossRef]
  21. Bandirali, M.; Poloni, A.; Sconfienza, L.M.; Messina, C.; Papini, G.D.E.; Petrini, M.; Ulivieri, F.M.; Di Leo, G.; Sardanelli, F. Short-term precision assessment of trabecular bone score and bone mineral density using dual-energy X-ray absorptiometry with different scan modes: An in vivo study. Eur. Radiol. 2015, 25, 2194–2198. [Google Scholar] [CrossRef] [PubMed]
  22. Hopkins, S.J.; Welsman, J.R.; Knapp, K.M. Short-term Precision Error in Dual Energy X-Ray Absorptiometry, Bone Mineral Density and Trabecular Bone Score Measurements; and Effects of Obesity on Precision Error. J. Biomed. Graph. Comput. 2014, 4, 8. [Google Scholar] [CrossRef] [Green Version]
  23. Messina, C.; Buonomenna, C.; Menon, G.; Magnani, S.; Albano, D.; Gitto, S.; Ulivieri, F.M.; Sconfienza, L.M. Fat Mass Does Not Increase the Precision Error of Trabecular Bone Score Measurements. J. Clin. Densitom. 2019, 22, 359–366. [Google Scholar] [CrossRef] [PubMed]
  24. Lodder, M.C.; Lems, W.F.; Ader, H.J.; Marthinsen, A.E.; Van Coeverden, S.C.C.M.; Lips, P.; Netelenbos, J.C.; Dijkmans, B.A.C.; Roos, J.C. Reproducibility of bone mineral density measurement in daily practice. Ann. Rheum. Dis. 2004, 63, 285–289. [Google Scholar] [CrossRef] [PubMed]
  25. Messina, C.; Acquasanta, M.; Rinaudo, L.; Tortora, S.; Arena, G.; Albano, D.; Sconfienza, L.M.; Ulivieri, F.M. Short-Term Precision Error of Bone Strain Index, a New DXA-Based Finite Element Analysis Software for Assessing Hip Strength. J. Clin. Densitom. 2021, 24, 330–337. [Google Scholar] [CrossRef]
  26. Leslie, W.D.; Moayyeri, A. Minimum sample size requirements for bone density precision assessment produce inconsistency in clinical monitoring. Osteoporos. Int. 2006, 17, 1673–1680. [Google Scholar] [CrossRef]
  27. Shepherd, J.A.; Morgan, S.L.; Lu, Y. Comparing BMD Results between Two Similar DXA Systems Using the Generalized Least Significant Change. J. Clin. Densitom. 2008, 11, 237–242. [Google Scholar] [CrossRef]
  28. Albano, D.; Agnollitto, P.M.; Petrini, M.; Biacca, A.; Ulivieri, F.M.; Sconfienza, L.M.; Messina, C. Operator-Related Errors and Pitfalls in Dual Energy X-Ray Absorptiometry: How to Recognize and Avoid Them. Acad. Radiol. 2021, 28, 1272–1286. [Google Scholar] [CrossRef]
  29. Bandirali, M.; Sconfienza, L.M.; Aliprandi, A.; Di Leo, G.; Marchelli, D.; Ulivieri, F.M.; Sardanelli, F. In vivo differences among scan modes in bone mineral density measurement at dual-energy X-ray absorptiometry. Radiol. Med. 2014, 119, 257–260. [Google Scholar] [CrossRef]
  30. Caffarelli, C.; Adami, G.; Arioli, G.; Bianchi, G.; Brandi, M.L.; Casciaro, S.; Cianferotti, L.; Ciardo, D.; Conversano, F.; Gatti, D.; et al. AB1082 Influence of the Variation of the Operator, Patient Position and Device on the Measurement Performance of Radiofrequency Echographic Multi Spectrometry (REMS). Ann. Rheum. Dis. 2020, 79, 1830. [Google Scholar] [CrossRef]
  31. el Maghraoui, A. Monitoring DXA Measurement in Clinical Practice. In Dual Energy X-ray Absorptiometry; InTech: London, UK, 2012. [Google Scholar]
  32. Shuhart, C.R.; Yeap, S.S.; Anderson, P.A.; Jankowski, L.G.; Lewiecki, E.M.; Morse, L.R.; Rosen, H.N.; Weber, D.R.; Zemel, B.S.; Shepherd, J.A. Executive Summary of the 2019 ISCD Position Development Conference on Monitoring Treatment, DXA Cross-calibration and Least Significant Change, Spinal Cord Injury, Peri-prosthetic and Orthopedic Bone Health, Transgender Medicine, and Pediatrics. J. Clin. Densitom. 2019, 22, 453–471. [Google Scholar] [CrossRef] [PubMed]
  33. Patel, R.; Blake, G.M.; Rymer, J.; Fogelman, I. Long-Term Precision of DXA Scanning Assessed over Seven Years in Forty Postmenopausal Women. Osteoporos. Int. 2000, 11, 68–75. [Google Scholar] [CrossRef] [PubMed]
  34. Khu, A.; Sumardi, M. A REMS Scan-Based Report on Relation between Body Mass Index and Osteoporosis in Urban Population of Medan at Royal Prima Hospital. Maj. Kedokt. Bdg. 2020, 52, 22–27. [Google Scholar] [CrossRef]
  35. Bolotin, H.H. DXA in vivo BMD methodology: An erroneous and misleading research and clinical gauge of bone mineral status, bone fragility, and bone remodelling. Bone 2007, 41, 138–154. [Google Scholar] [CrossRef]
  36. el Maghraoui, A.; do Santos Zounon, A.A.; Jroundi, I.; Nouijai, A.; Ghazi, M.; Achemlal, L.; Bezza, A.; Tazi, M.A.; Abouqual, R. Reproducibility of bone mineral density measurements using dual X-ray absorptiometry in daily clinical practice. Osteoporos. Int. 2005, 16, 1742–1748. [Google Scholar] [CrossRef] [PubMed]
  37. Cortet, B.; Dennison, E.; Diez-Perez, A.; Locquet, M.; Muratore, M.; Nogués, X.; Crespo, D.O.; Quarta, E.; Brandi, M.L. Radiofrequency Echographic Multi Spectrometry (REMS) for the diagnosis of osteoporosis in a European multicenter clinical context. Bone 2021, 143, 115786. [Google Scholar] [CrossRef] [PubMed]
Figure 1. Examples of how REMS data deriving from femoral neck scans are analyzed to create a patient-specific spectrum, which is compared with spectral reference models. Regarding the spectra images, amplitude [dB] is on the y-axis, while frequency [MHz] is on the x-axis.
Jimaging 09 00118 g001
Figure 2. EchoStation device. Schematic representation of the EchoStation ultrasound machine, provided with the main unit EchoS, probe, and panel PC that implements REMS Technology.
Jimaging 09 00118 g002
Figure 3. REMS acquisitions at the spine (a) and proximal femur (b). The figure depicts (upper panel) the medical report and (lower panel) a typical echographic image with the identification of the ROI (blue) and the bone interfaces (green). ROI, region of interest.
Jimaging 09 00118 g003
Figure 4. Study flowchart showing inclusion/exclusion criteria, the total number of women enrolled, the total scan analyzed after excluding erroneous acquisitions, and final BMI stratification. BMI = Body Mass Index; LS = lumbar spine; FEM = proximal femur; ROI = region of interest.
Jimaging 09 00118 g004
Table 1. Characteristics of the study group. Data are presented as mean ± SD of the total number of acquisitions performed at the respective axial sites (LS and FEM). BMD, bone mineral density; BMI, body mass index; FEM, femoral neck; LS, lumbar spine; SD, standard deviation. Regarding diagnosis, percentages are in parentheses.
Demographic DataLS (42)FEM (37)
Age (years)48.9 ± 6.848.3 ± 6.1
EthnicityCaucasianCaucasian
Diagnosis
Normal16 (38.1%)12 (32.4%)
Osteopenia22 (52.4%)23 (62.2%)
Osteoporosis4 (9.5%)2 (5.4%)
BMI (kg/m2)24.71 ± 4.2125.0 ± 4.84
BMD (g/cm2) 0.914 ± 0.10.709 ± 0.1
Age (years)48.9 ± 6.848.3 ± 6.1
Table 2. Assessment of short-term precision. CV, coefficient of variation; FEM, femoral neck; LS, lumbar spine; LSC, least significant change; RMS, root mean square.
Short Term Precision
LS (42)FEM (37)
RMS-CV
(%)
LSC
(%)
SDD
(g/cm2)
RMS-CV
(%)
LSC
(%)
SDD
(g/cm2)
Intra-operator precision0.471.290.0090.320.890.004
Inter-operator repeatability0.551.520.0090.511.400.008
Table 3. Precision error in subjects with optimal weight or overweight/obese patients at the LS and FEM. A t-test was used to determine significant differences between BMD values measured the optimal weight and overweight/obese groups at the LS (p = 0.004) and FEM (p < 0.0001). BMD, bone mineral density; BMI, body mass index; CV, coefficient of variation; FEM, femoral neck; LSC, least significant change; LS, lumbar spine; RMS, root mean square; SDD, smallest detectable difference. Optimal category = BMI ≤ 25 kg/m2; Overweight/obese category = BMI > 25 kg/m2.
SiteBMI
Category
nBMD
(g/cm2)
p-ValueRMS-CV (%)LSC (%)SDD (g/cm2)
LSOptimal $260.879 ± 0.10p = 0.0040.441.230.008
Overweight/obese140.975 ± 0.090.501.400.011
FEMOptimal $240.659 ± 0.07p < 0.00010.280.730.004
Overweight/obese130.794 ± 0.090.391.070.005
$ (only one underweight patient was included in the normal group).
Disclaimer/Publisher’s Note: The statements, opinions and data contained in all publications are solely those of the individual author(s) and contributor(s) and not of MDPI and/or the editor(s). MDPI and/or the editor(s) disclaim responsibility for any injury to people or property resulting from any ideas, methods, instructions or products referred to in the content.

