
Neutron Tomography Studies of Two Lamprophyre Dike Samples: 3D Data Analysis for the Characterization of Rock Fabric

 , , and
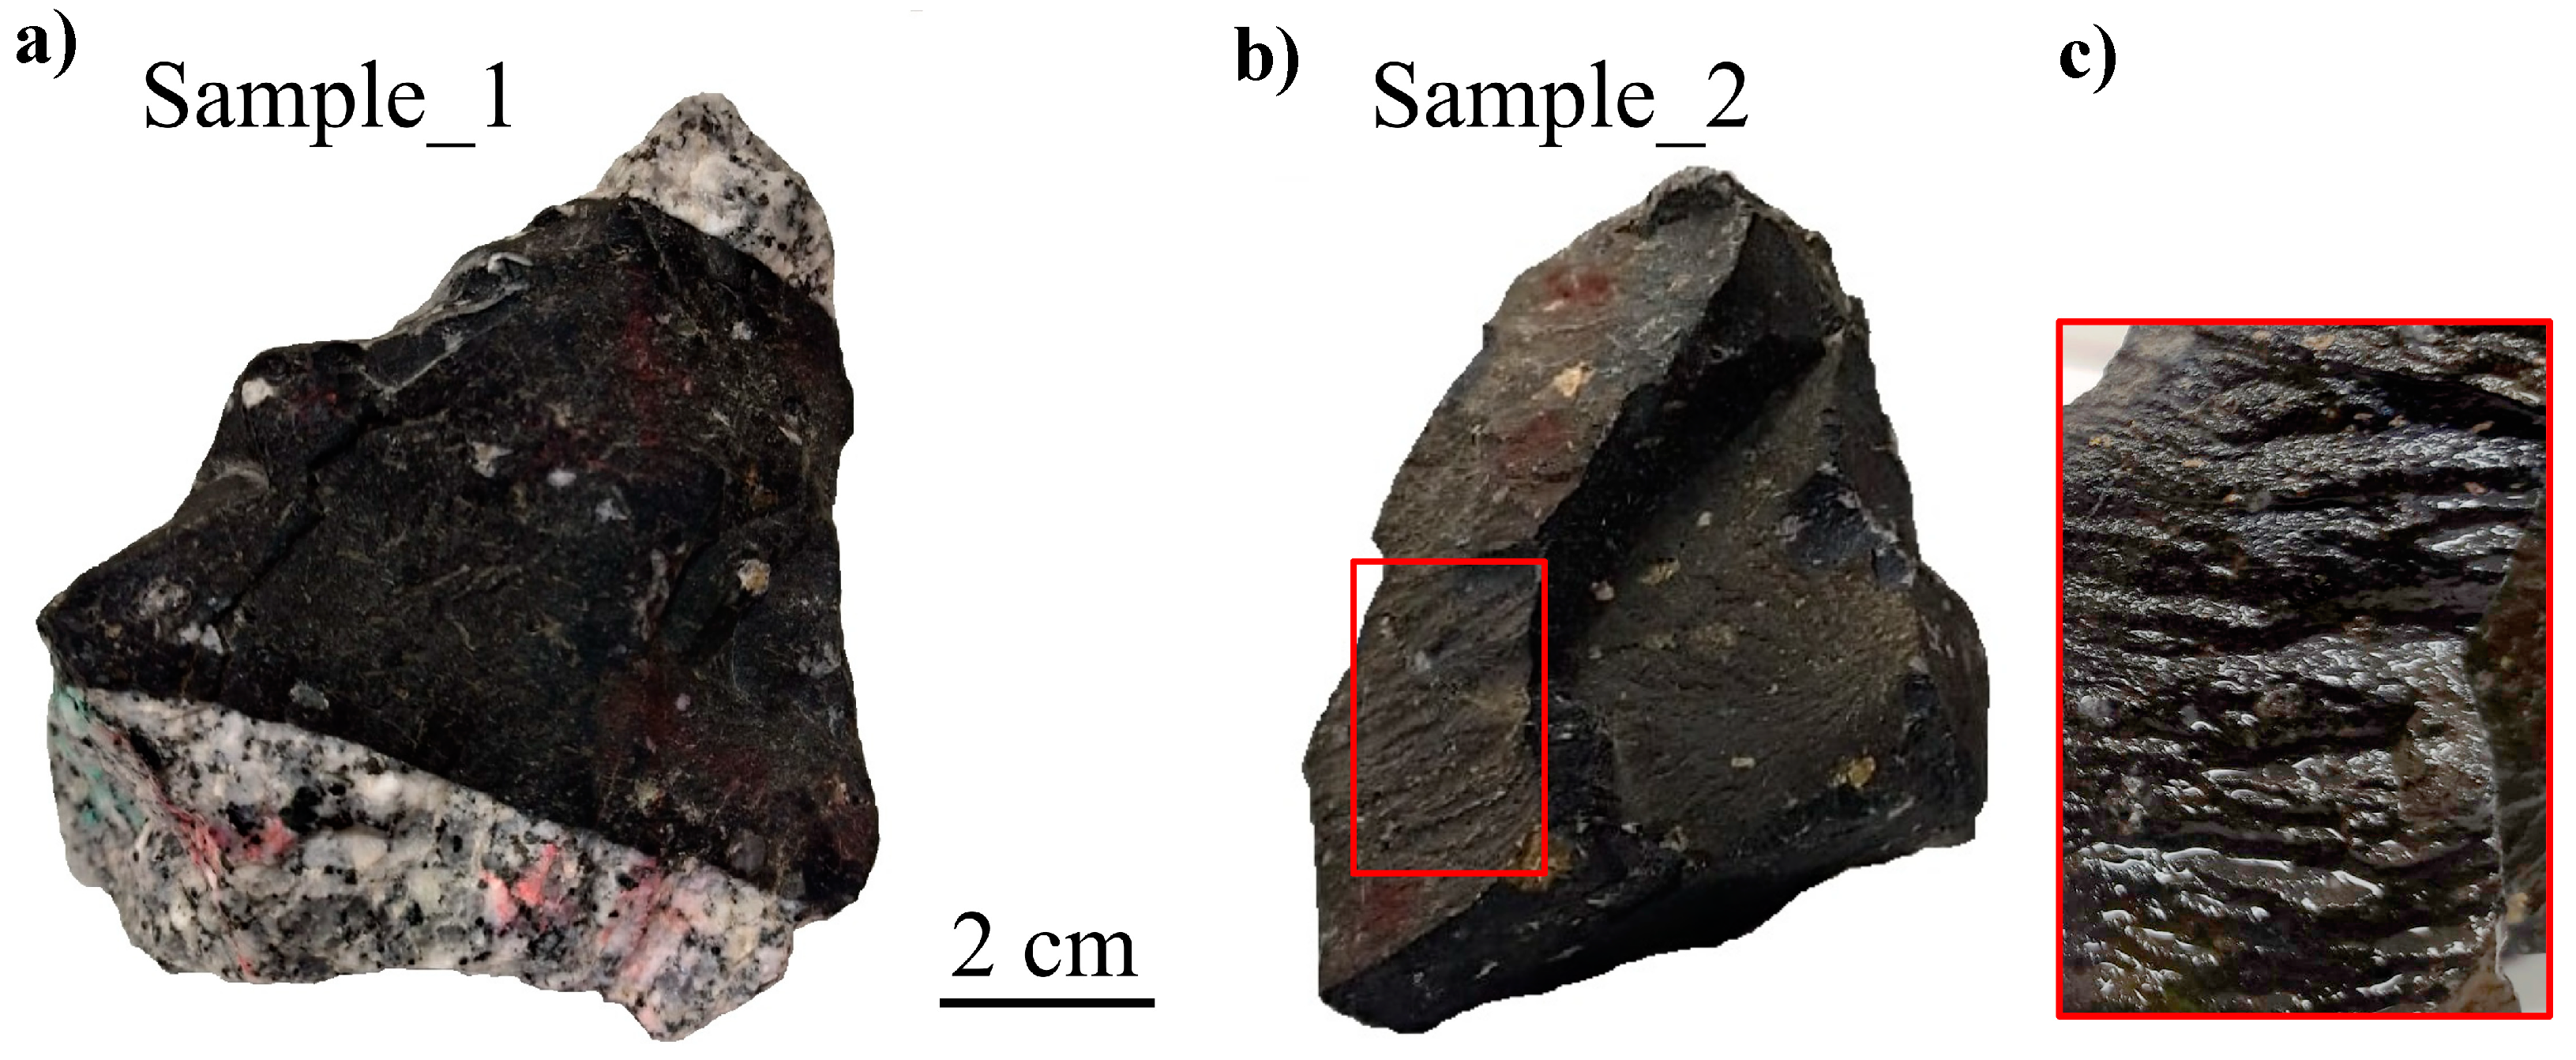
Abstract
:1. Introduction
2. Experimental
2.1. Dike Samples Description
2.2. Raman Spectroscopy
2.3. Neutron Tomography
3. Results and Discussion
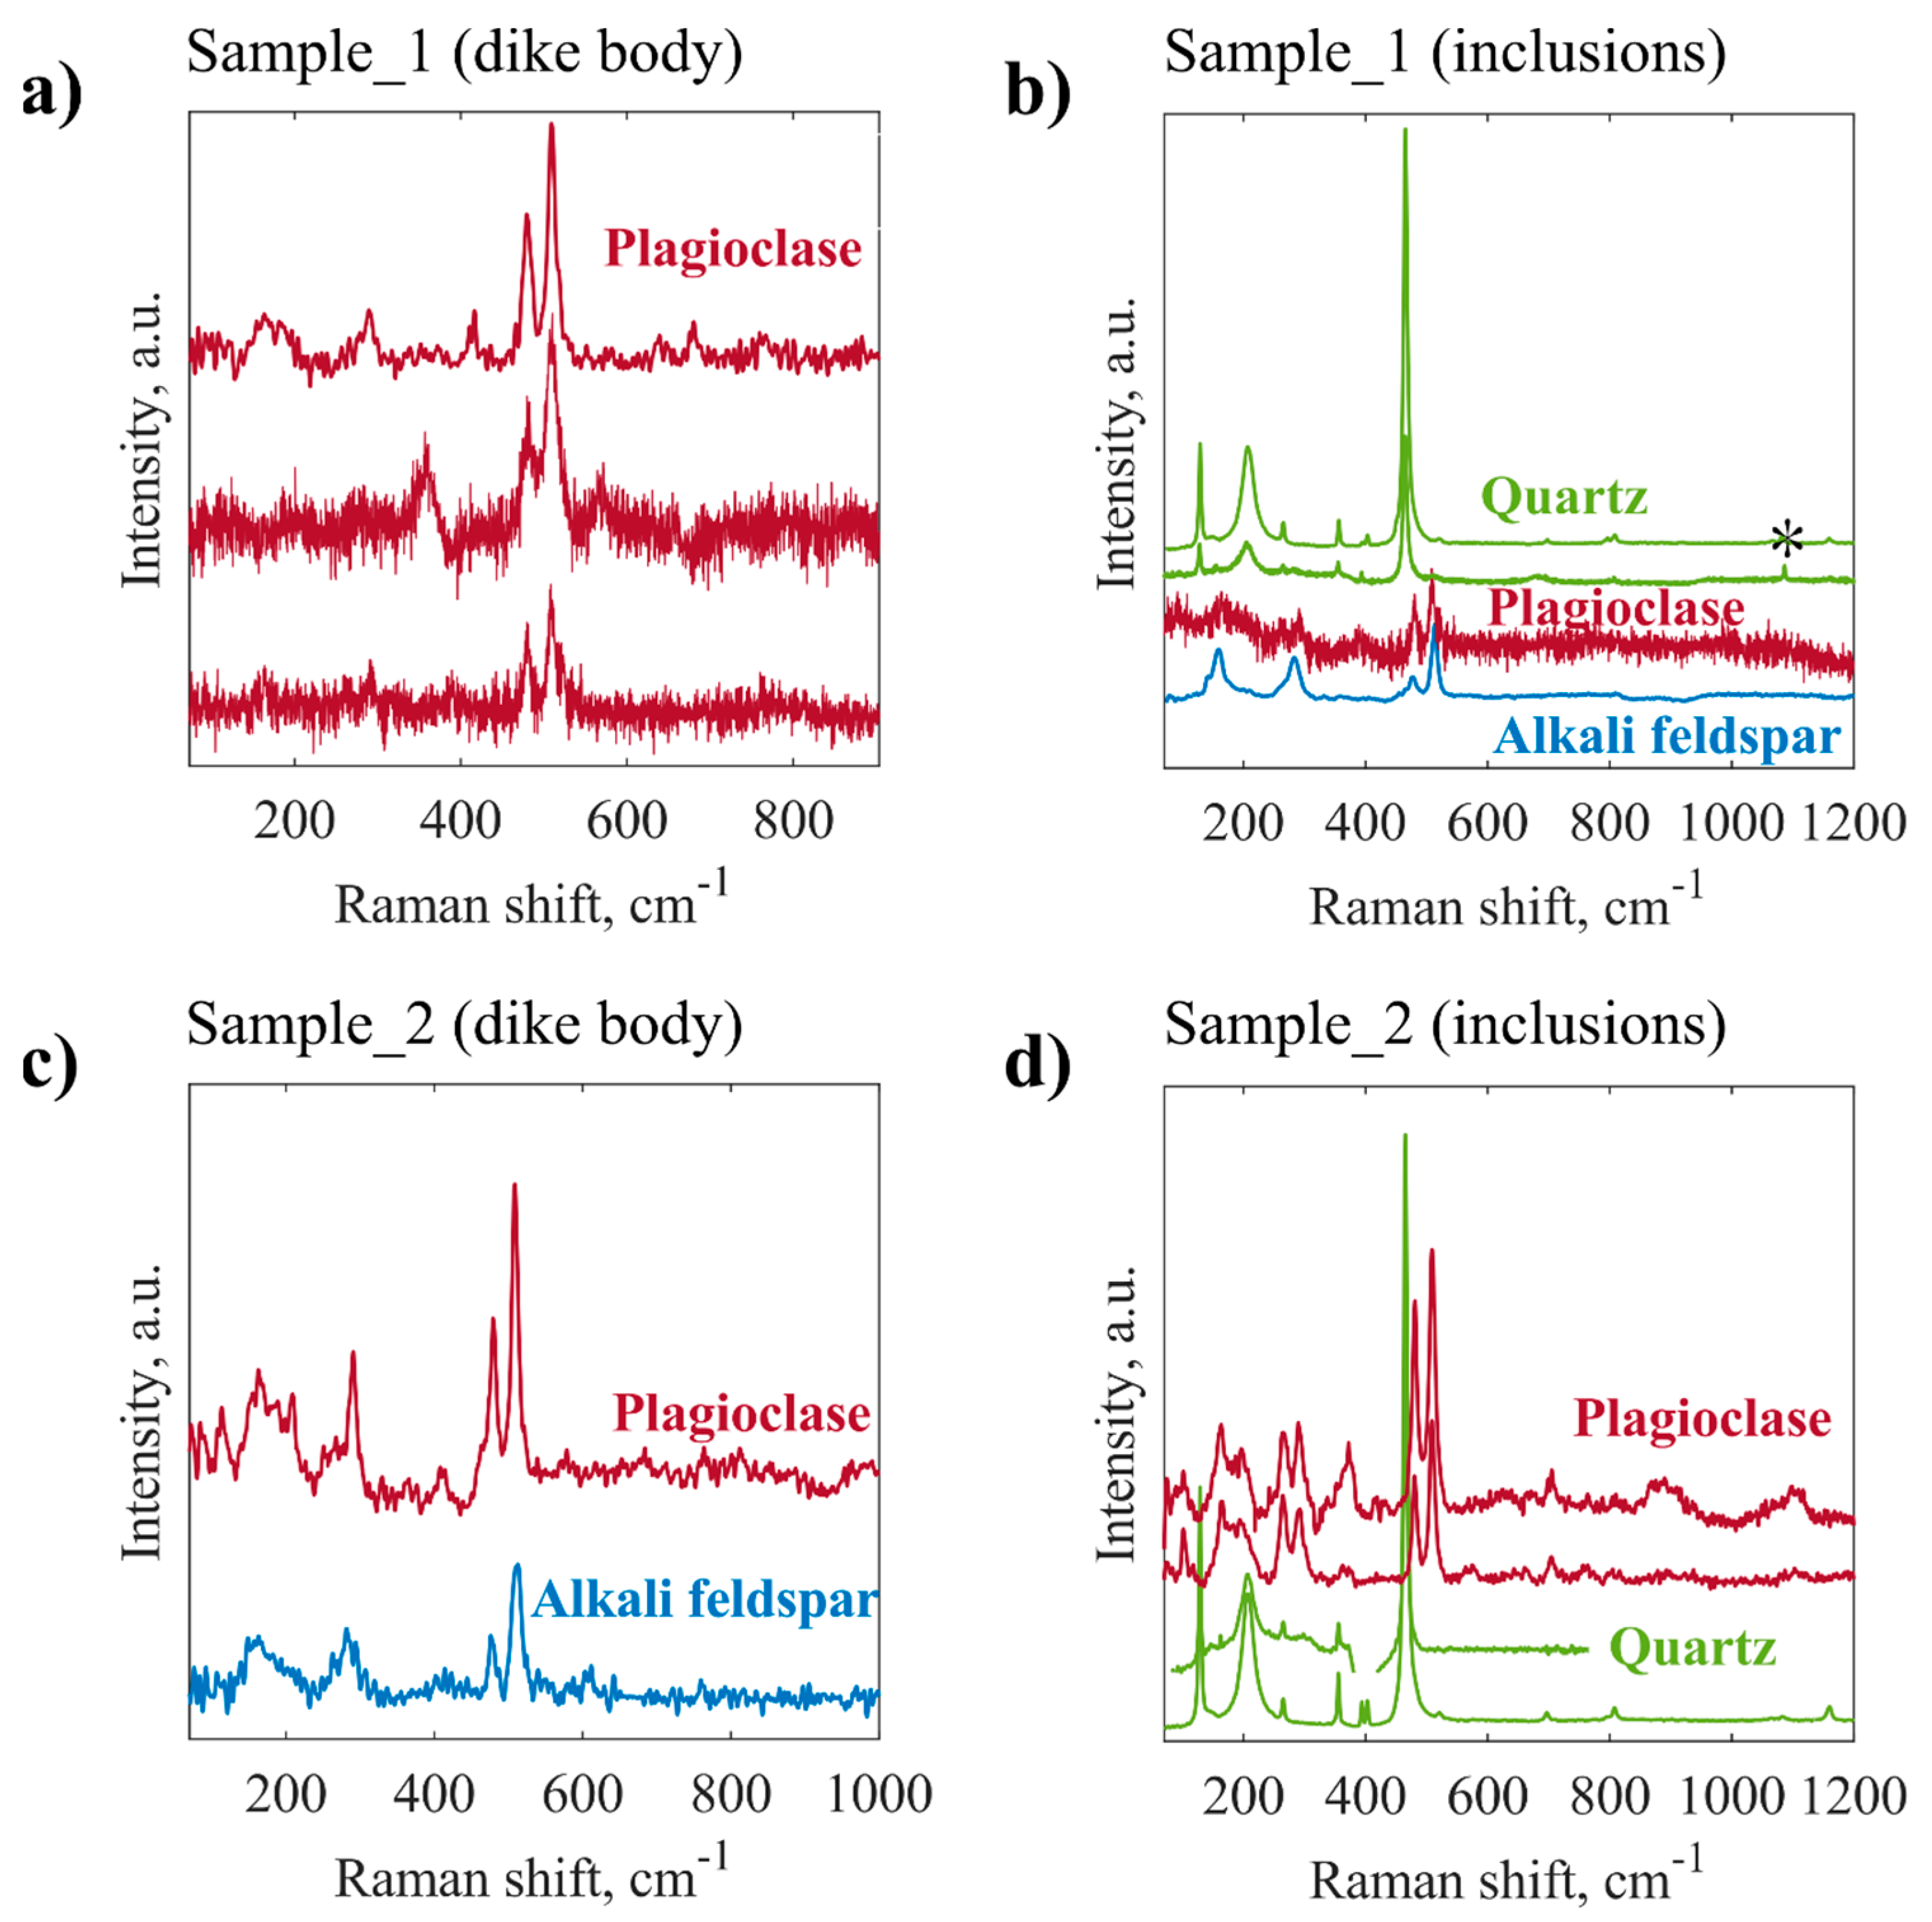
3.1. Raman Spectroscopy
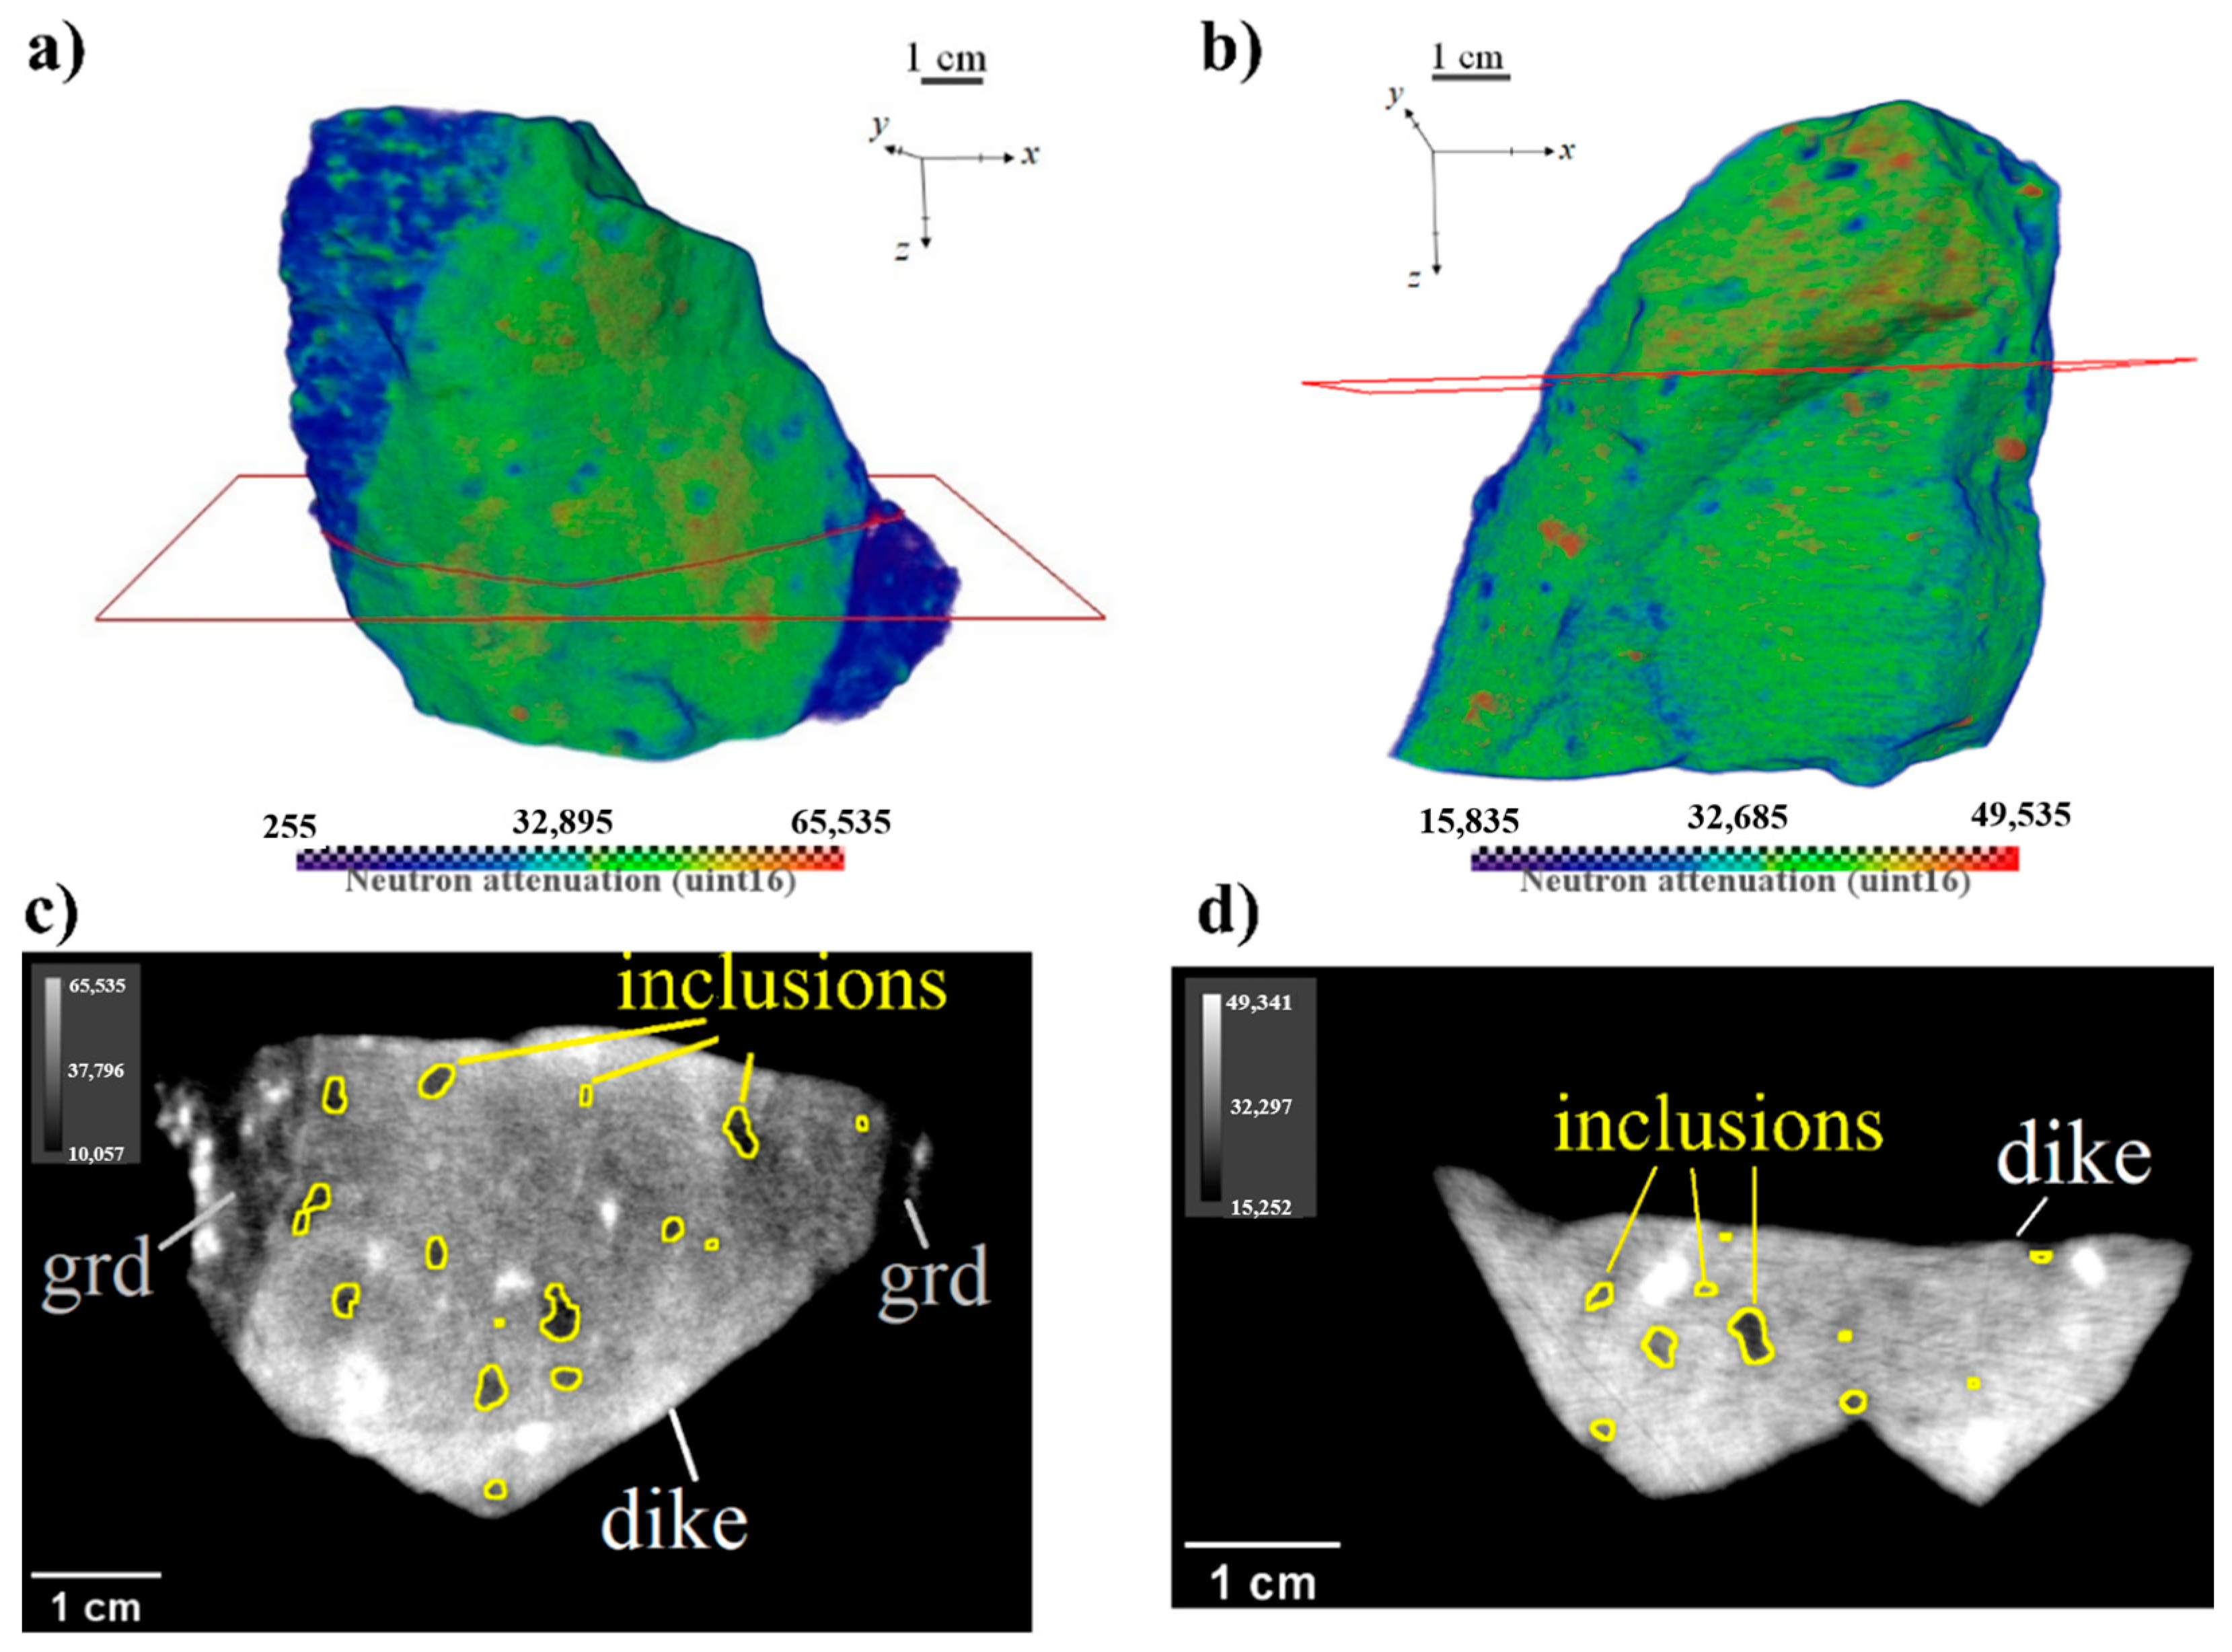
3.2. Neutron Tomography
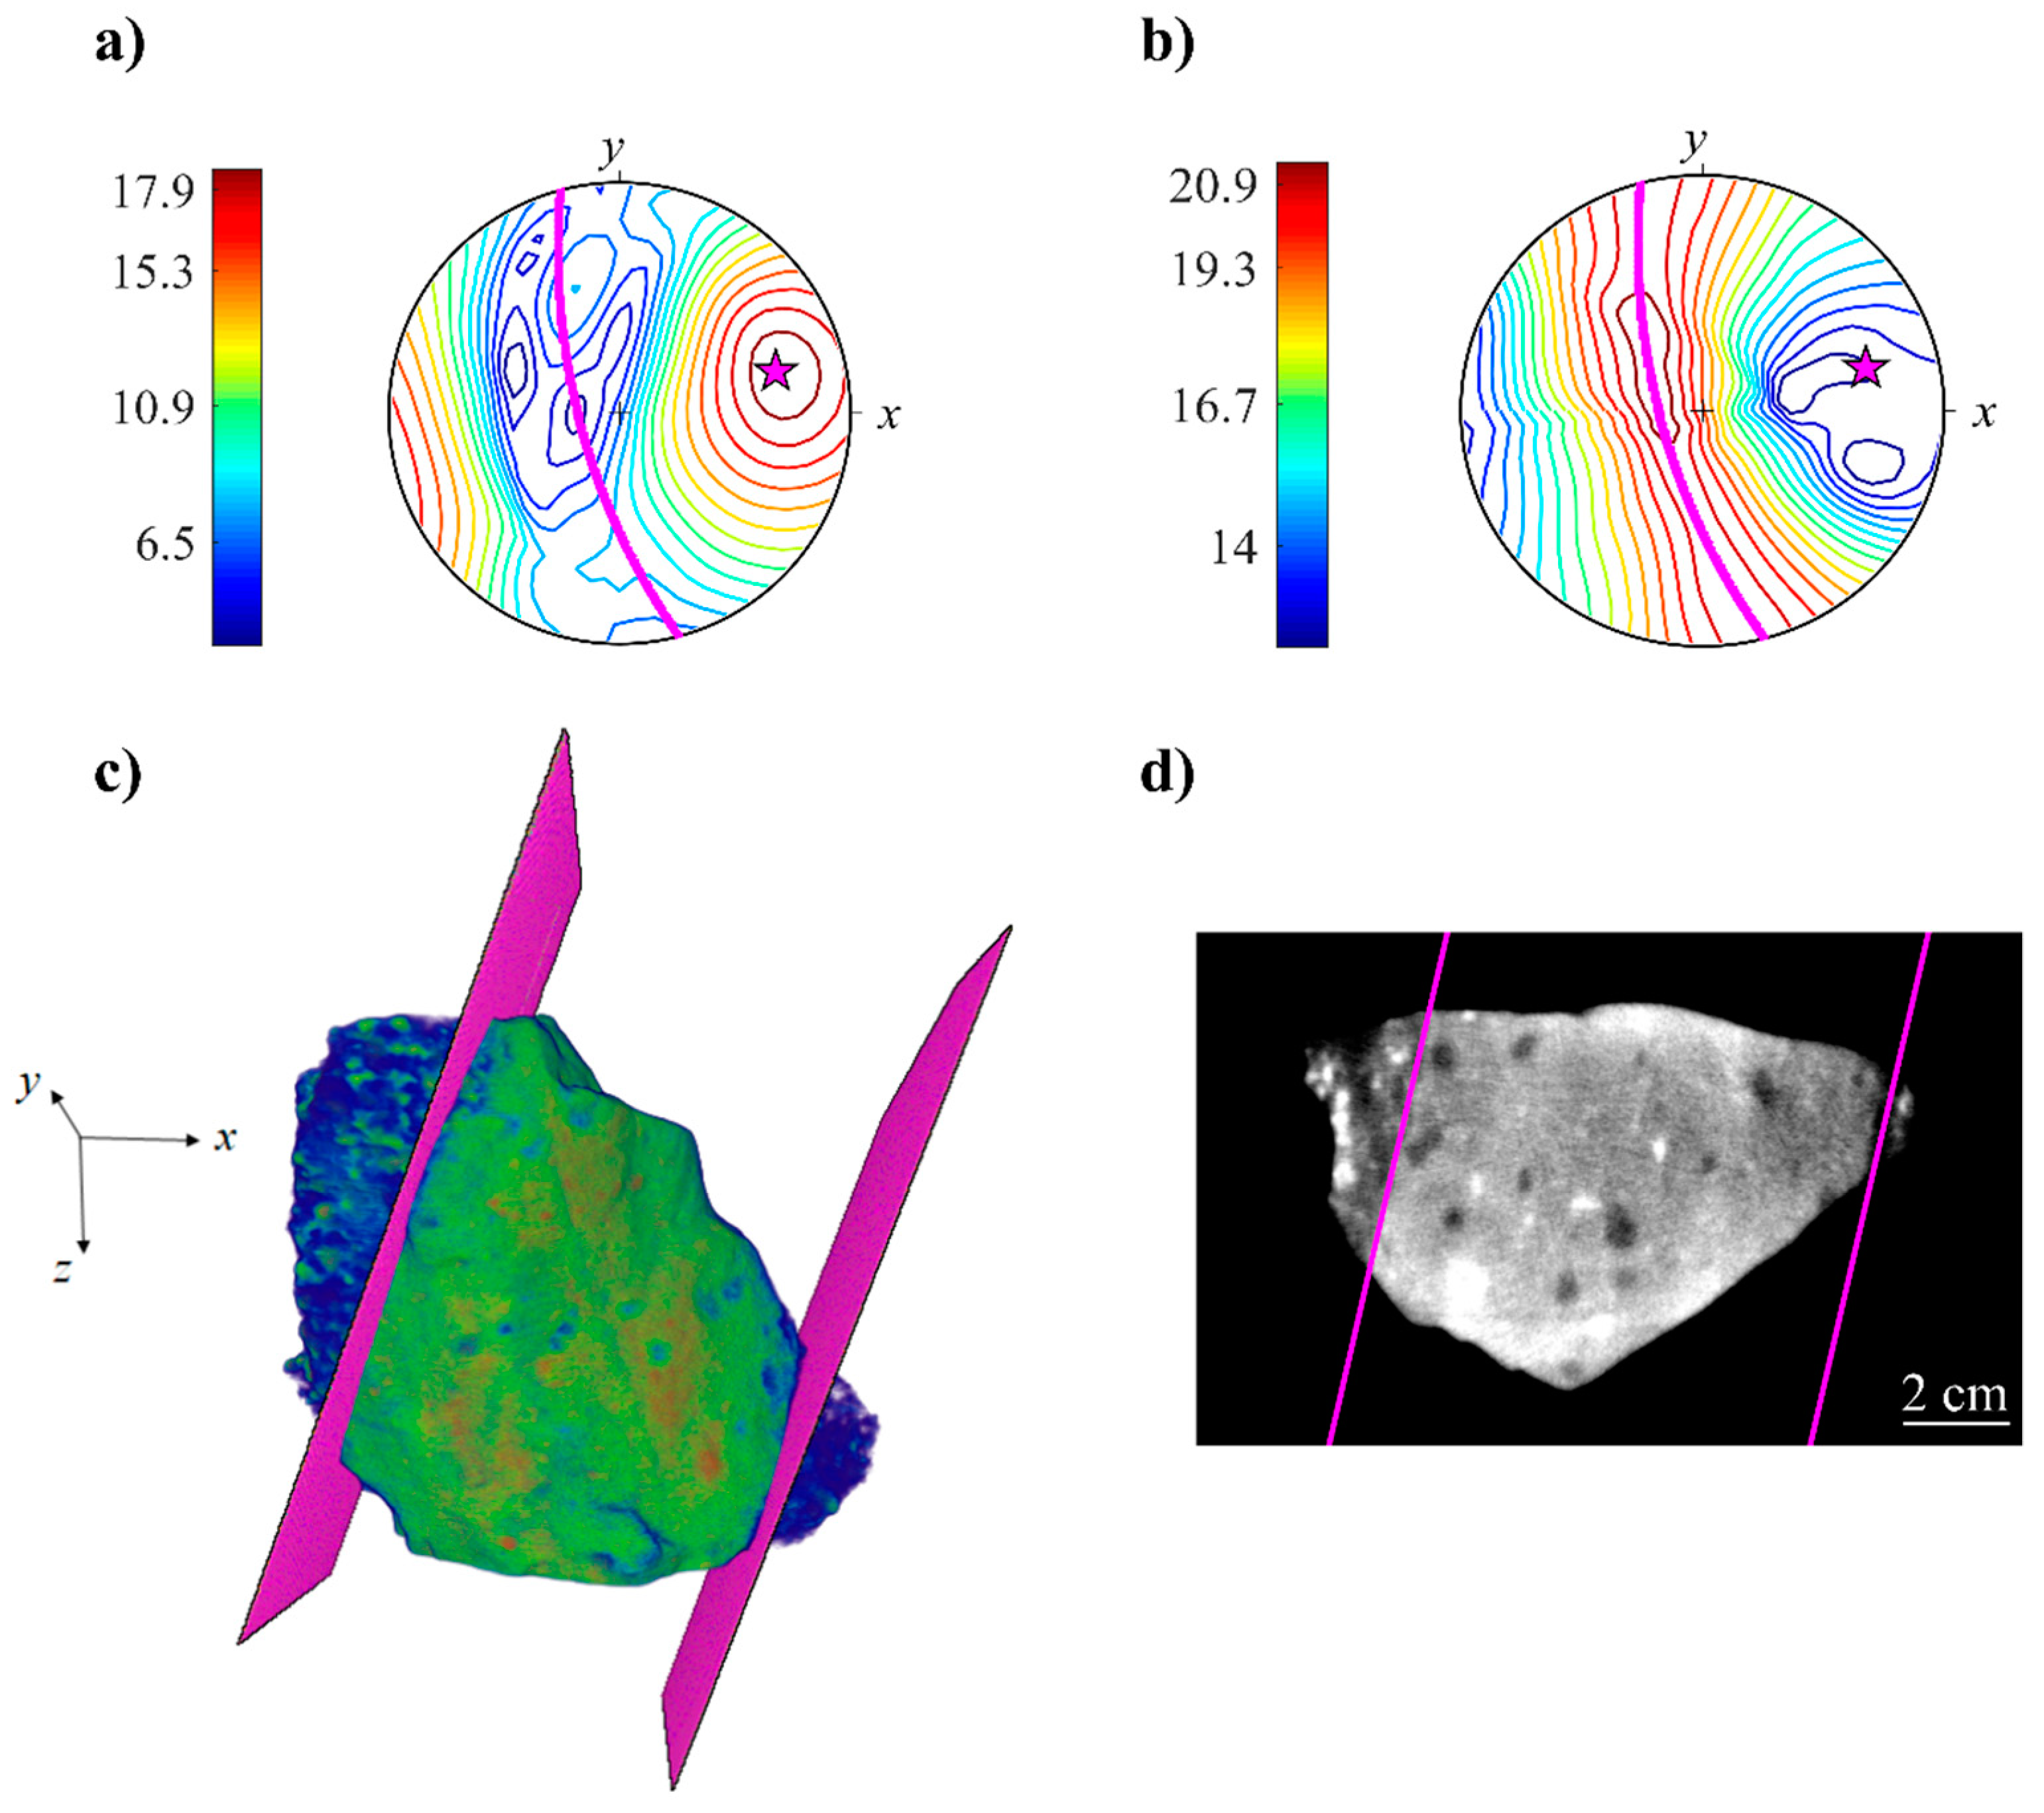
3.3. 3D Data Analysis: Dike Walls Orientation and Segmentation
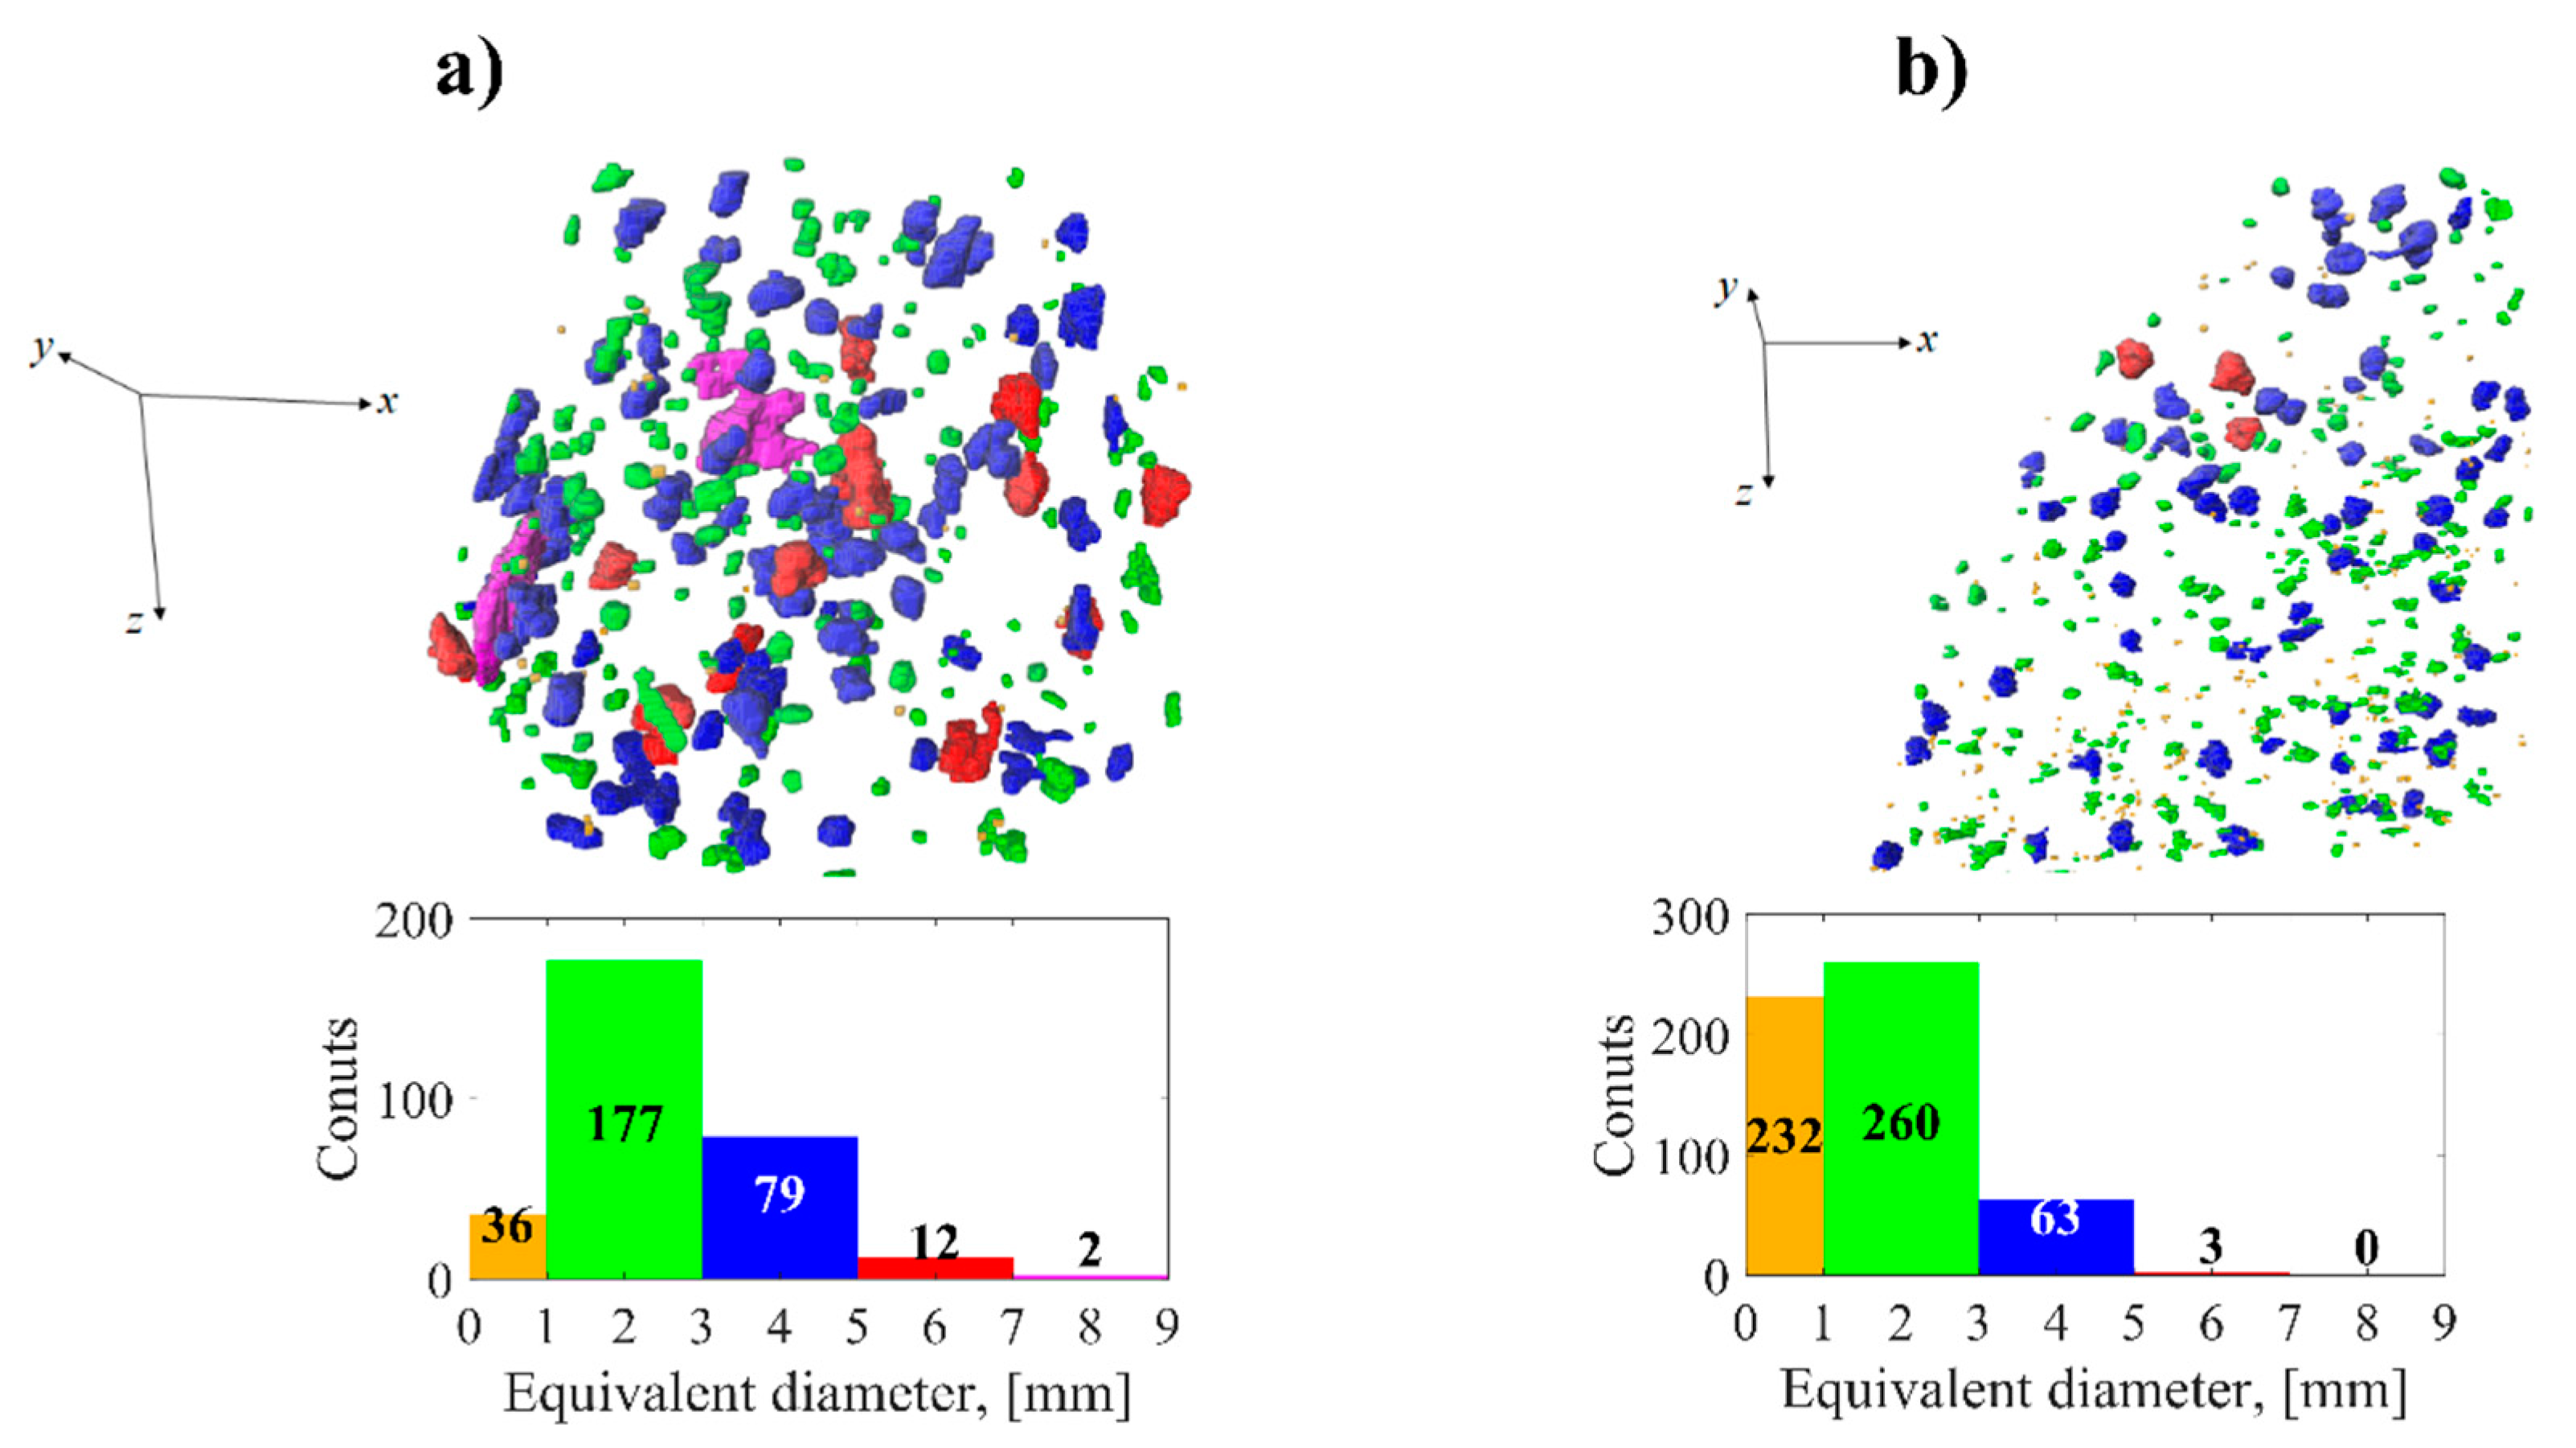
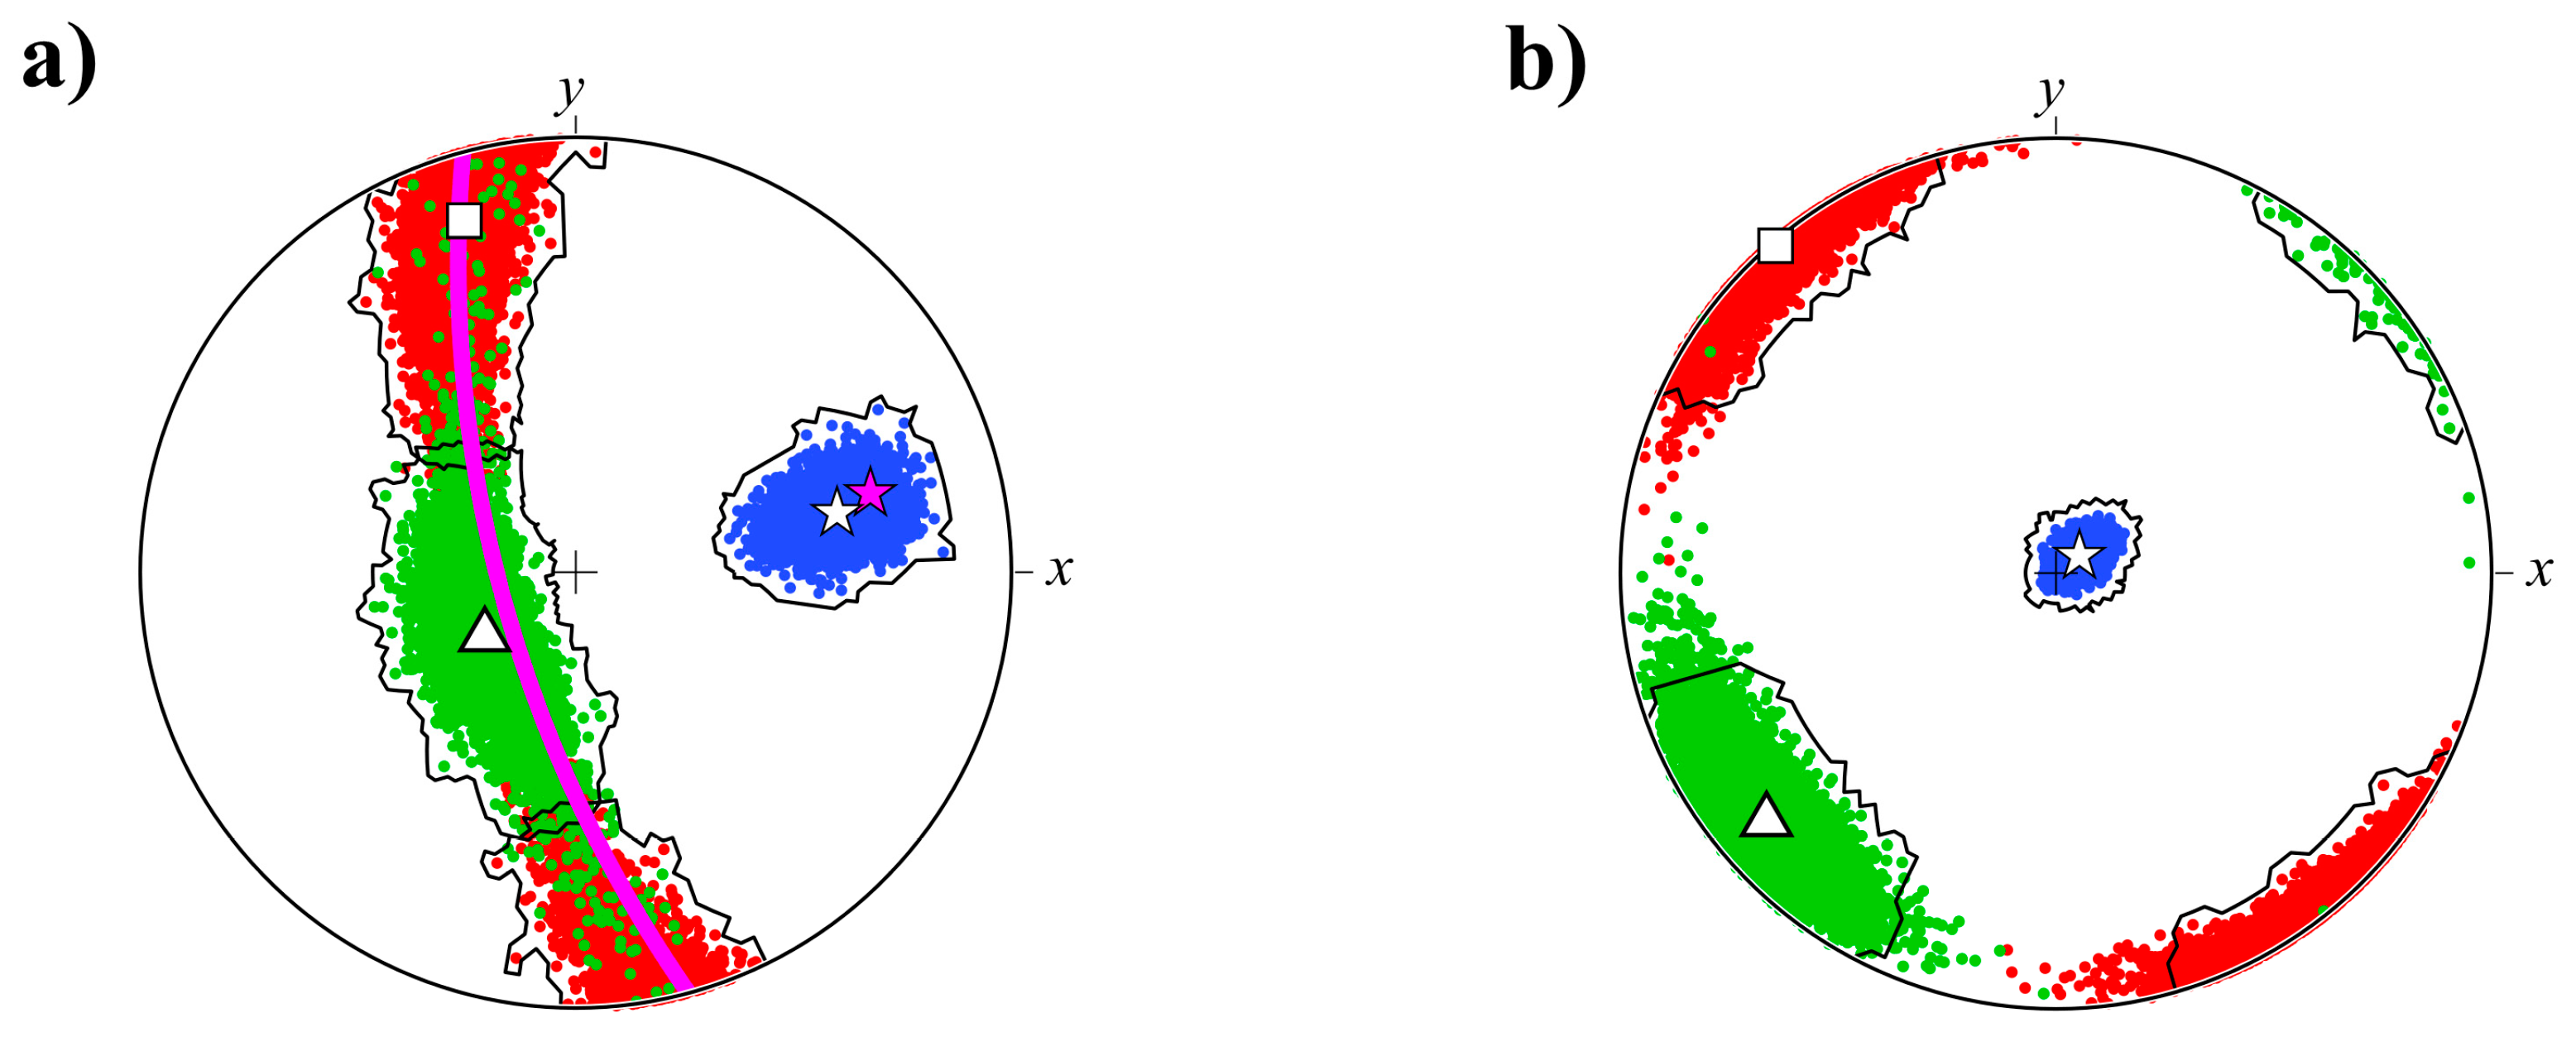
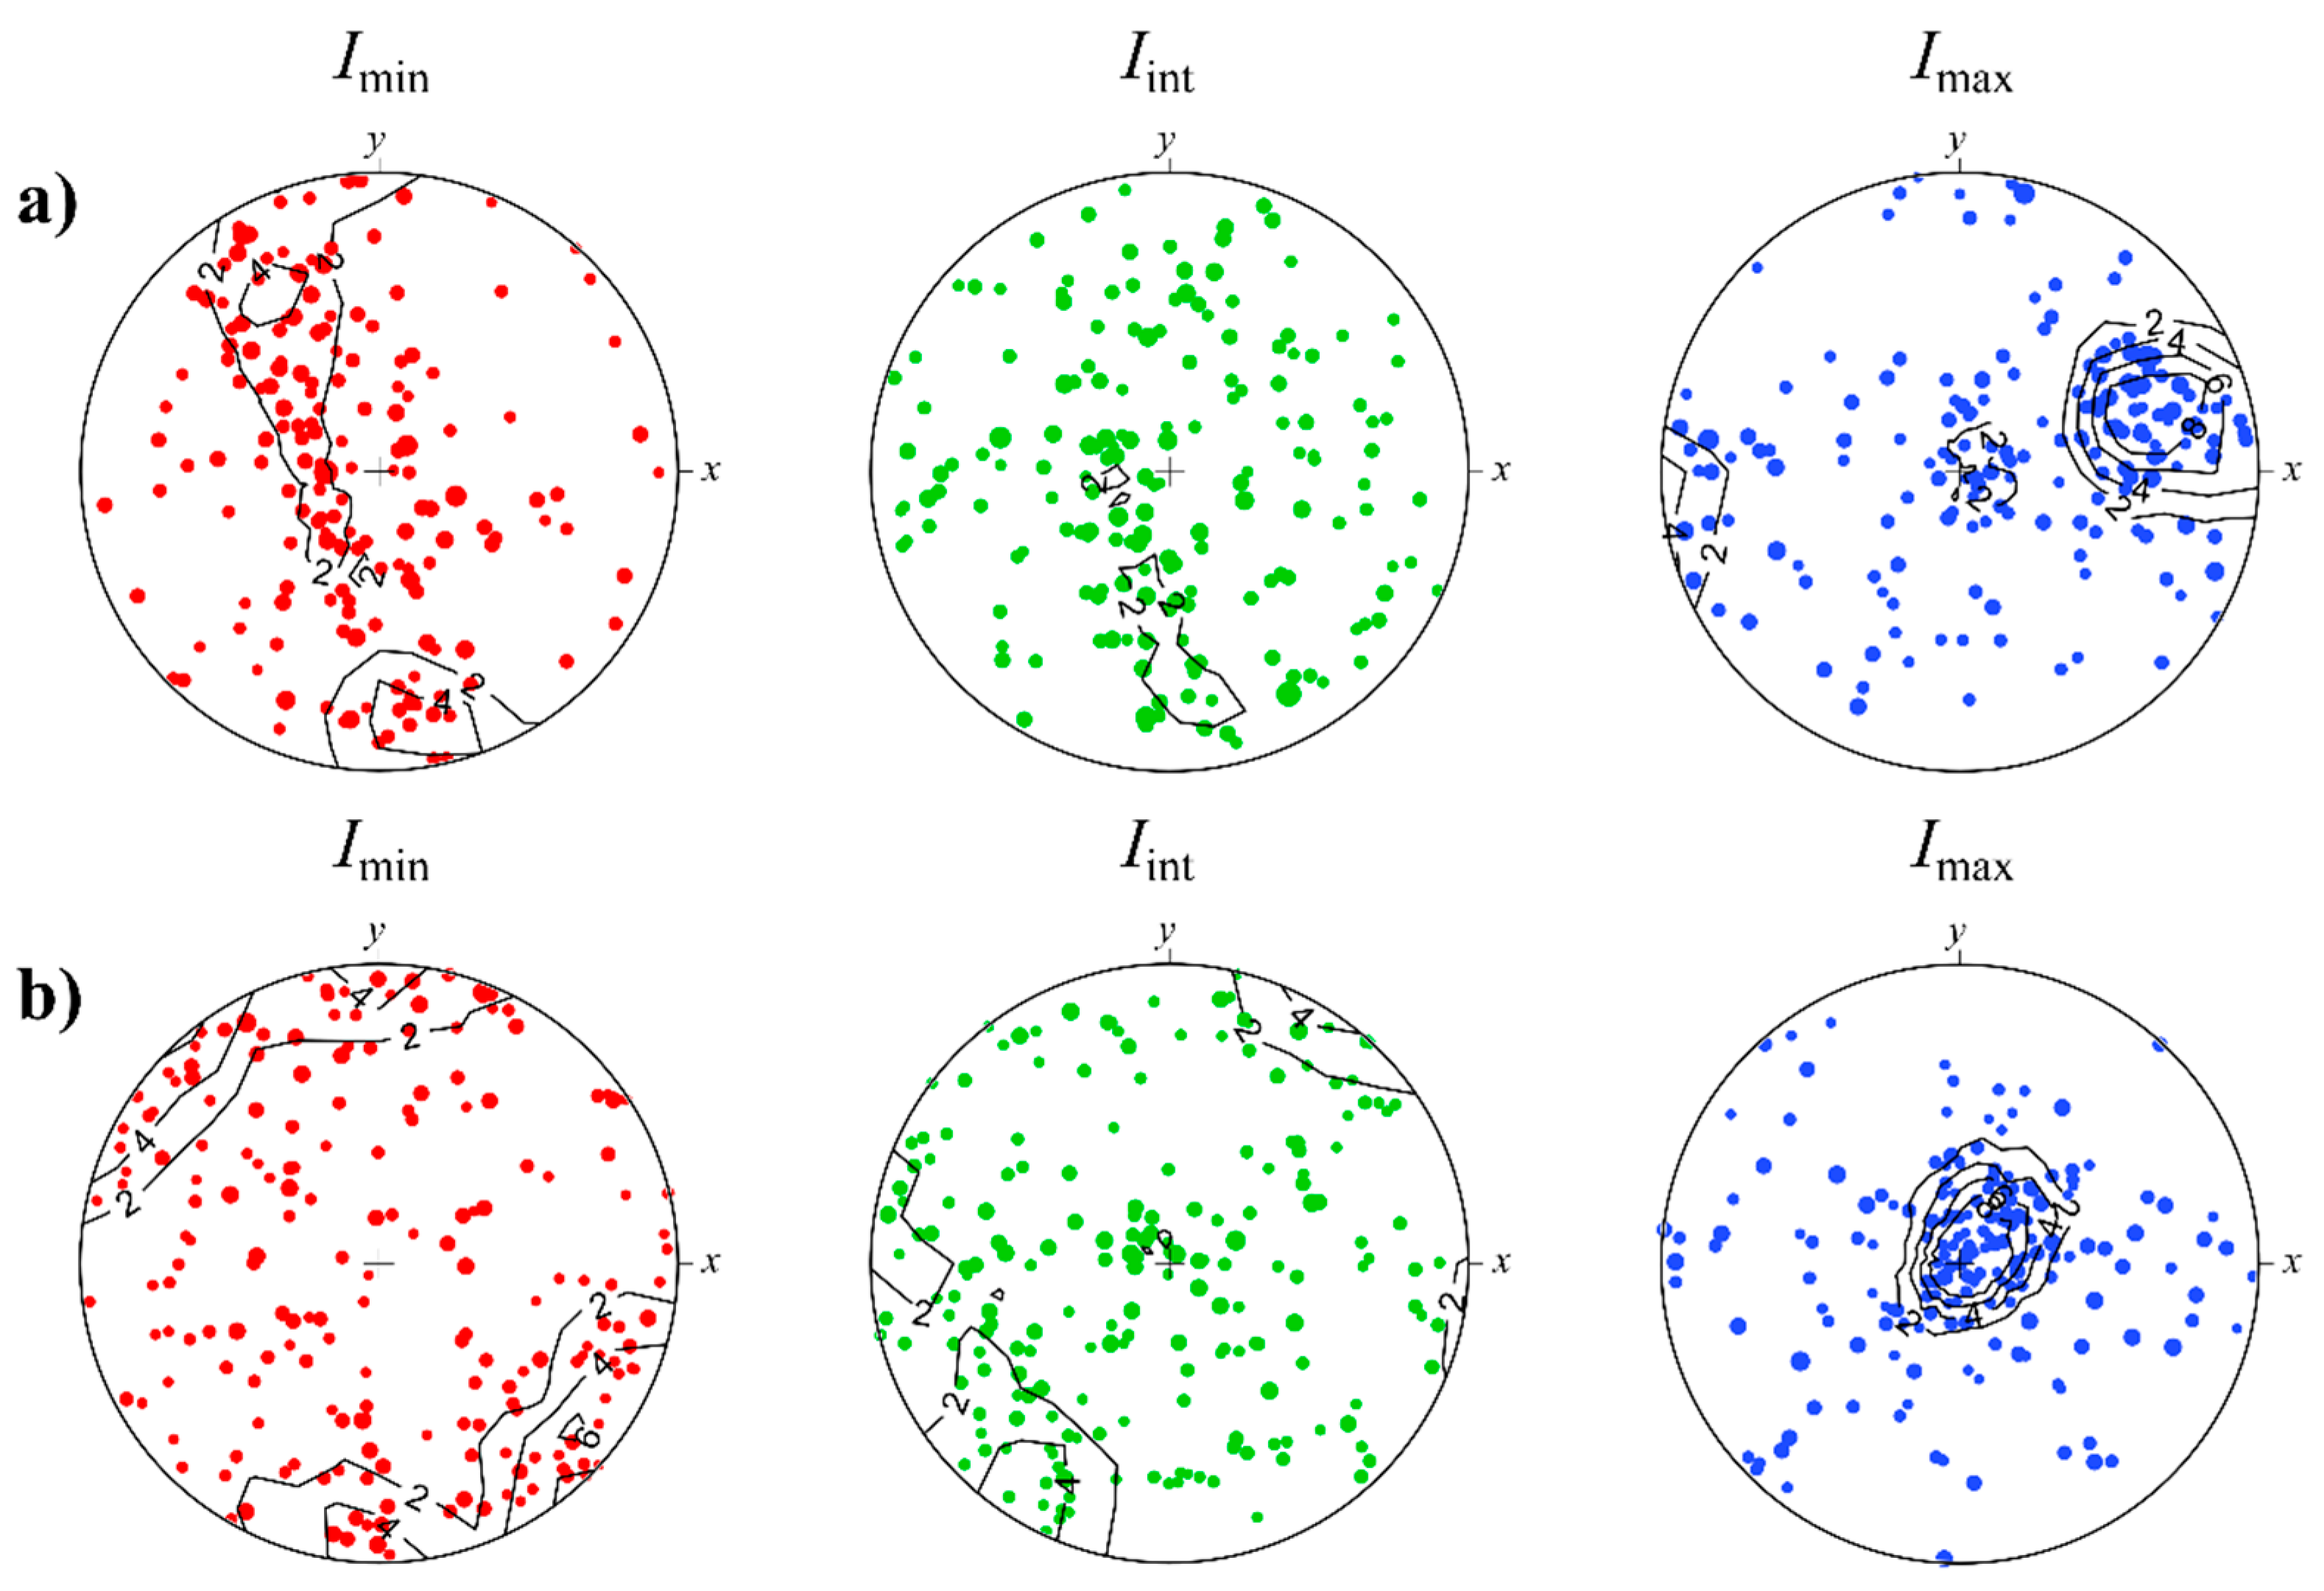
3.4. 3D Data Analysis: Size Distribution and Shape Orientations of Inclusions
3.5. Discussion
4. Conclusions
Author Contributions
Funding
Institutional Review Board Statement
Informed Consent Statement
Data Availability Statement
Conflicts of Interest
References
- Philpotts, A.R. Density, surface tension and viscosity of the immiscible phase in a basic, alkaline magma. LITHOS 1972, 5, 1–18. [Google Scholar] [CrossRef]
- Nicolas, A. Kinematics in magmatic rocks with special reference to gabbros. J. Petrol. 1992, 33, 891–915. [Google Scholar] [CrossRef]
- Philpotts, A.R.; Philpotts, D.E. Upward and downward flow in a camptonite dike as recorded by deformed vesicles and the anisotropy of magnetic susceptibility (AMS). J. Volcanol. Geotherm. Res. 2007, 161, 81–94. [Google Scholar] [CrossRef]
- Bascou, J.; Camps, P.; Dautria, J.M. Magnetic versus crystallographic fabrics in a basaltic lava flow. J. Volcanol. Geotherm. Res. 2005, 145, 119–135. [Google Scholar] [CrossRef]
- Paterson, S.R.; Vernon, R.H.; Tobisch, O.T. A review of criteria for the identification of magmatic and tectonic foliations in granitoids. J. Struct. Geol. 1989, 11, 349–363. [Google Scholar] [CrossRef]
- Varga, R.J.; Gee, J.S.; Staudigel, H.; Tauxe, L. Dike surface lineations as magma flow indicators within the sheeted dike complex of the Troodos ophiolite, Cyprus. J. Geophys. Res. Solid Earth 1998, 103, 5241–5256. [Google Scholar] [CrossRef]
- Knight, M.D.; Walker, G.P.L. Magma flow directions in dikes of the Koolau complex, Oahu, determined from magnetic fabric studies (Hawaii). J. Geophys. Res. Solid Earth 1988, 93, 4301–4319. [Google Scholar] [CrossRef]
- Hrouda, F.; Faryad, S.W.; Kubínová, Š.; Verner, K.; Chlupácová, M. Simultaneous free flow and forcefully driven movement of magma in lamprophyre dykes as indicated by magnetic anisotropy: Case study from the central bohemian dyke swarm, Czech Republic. Geosciences 2019, 9, 104. [Google Scholar] [CrossRef] [Green Version]
- Correa-Gomes, L.C.; Souza Filho, C.R.; Martins, C.J.F.N.; Oliveira, E.P. Development of symmetrical and asymmetrical fabrics in sheet-like igneous bodies: The role of magma flow and wall-rock displacements in theoretical and natural cases. J. Struct. Geol. 2001, 23, 1415–1428. [Google Scholar] [CrossRef]
- Zel, I.Y.; Petružálek, M.; Kichanov, S.E.; Nazarov, K.M.; Lokajíček, T.; Kozlenko, D.P.; Turková, I.; Kotrlý, M.; Onysko, R. Contribution of neutron tomography to 3d heterogeneity analysis of granitic rocks. Acta Geodyn. Geomater. 2020, 17, 259–267. [Google Scholar] [CrossRef]
- Zel, I.Y.; Kenessarin, M.; Kichanov, S.E.; Balasoiu, M.; Kozlenko, D.P.; Nazarov, K.; Nicu, M.; Ionascu, L.; Dragolici, A.C.; Dragolici, F. Spatial distribution of graphite in cement materials used for radioactive waste conditioning: An approach to analysis of neutron tomography data. Cem. Concr. Compos. 2021, 119, 103993. [Google Scholar] [CrossRef]
- Zel, I.Y.; Petružálek, M.; Lokajíček, T.; Ivankina, T.I.; Kichanov, S.E.; Kozlenko, D.P.; Porosnicu, I.; Schnabl, P.; Pruner, P.; Duliu, O.G. Assessment of structural, magnetic, and P-wave velocity anisotropy of two biotite gneisses from X-ray and neutron tomography. Tectonophysics 2021, 812, 228925. [Google Scholar] [CrossRef]
- Podurets, K.M.; Kichanov, S.E.; Glazkov, V.P.; Kovalenko, E.S.; Murashev, M.M.; Kozlenko, D.P.; Lukin, E.V.; Yatsishina, E.B. Modern Methods of Neutron Radiography and Tomography in Studies of the Internal Structure of Objects. Crystallogr. Rep. 2021, 66, 254–266. [Google Scholar] [CrossRef]
- Vontobel, P.; Lehmann, E.; Carlson, W.D. Comparison of X-ray and neutron tomography investigations of geological materials. IEEE Trans. Nucl. Sci. 2005, 52, 338–341. [Google Scholar] [CrossRef]
- Ishbaev, K.D.; Shukurov, A.K.; Kosbergenov, K.M. Lamprophyres and mineralization of the koytash ore field (Southern Tien Shan). Lithosphere Russ. Fed. 2020, 20, 231–253. [Google Scholar] [CrossRef]
- Kozlenko, D.P.; Kichanov, S.E.; Lukin, E.V.; Rutkauskas, A.V.; Belushkin, A.V.; Bokuchava, G.D.; Savenko, B.N. Neutron radiography and tomography facility at IBR-2 reactor. Phys. Part. Nucl. Lett. 2016, 13, 346–351. [Google Scholar] [CrossRef]
- Schneider, C.A.; Rasband, W.S.; Eliceiri, K.W. NIH Image to ImageJ: 25 years of image analysis. Nat. Methods 2012, 9, 671–675. [Google Scholar] [CrossRef] [PubMed]
- Brun, F.; Massimi, L.; Fratini, M.; Dreossi, D.; Billé, F.; Accardo, A.; Pugliese, R.; Cedola, A. SYRMEP Tomo Project: A graphical user interface for customizing CT reconstruction workflows. Adv. Struct. Chem. Imaging 2017, 3, 4. [Google Scholar] [CrossRef] [PubMed] [Green Version]
- Mernagh, T.P. Use of the laser Raman microprobe for discrimination amongst feldspar minerals. J. Raman Spectrosc. 1991, 22, 453–457. [Google Scholar] [CrossRef]
- Kamb, W.B. Ice petrofabric observations from Blue Glacier, Washington, in relation to theory and experiment. J. Geophys. Res. 1959, 64, 1891–1909. [Google Scholar] [CrossRef]
- Constable, C.; Tauxe, L. The bootstrap for magnetic susceptibility tensors. J. Geophys. Res. 1990, 95, 8383. [Google Scholar] [CrossRef]
- Matthies, S.; Vinel, G.W.; Helming, K. Standard Distributions in Texture Analysis; Akademie-Verlag: Berlin, Germany, 1987; 442p. [Google Scholar]
- Féménias, O.; Diot, H.; Berza, T.; Gauffriau, A.; Demaiffe, D. Asymmetrical to symmetrical magnetic fabric of dikes: Paleo-flow orientations and Paleo-stresses recorded on feeder-bodies from the Motru Dike Swarm (Romania). J. Struct. Geol. 2004, 26, 1401–1418. [Google Scholar] [CrossRef]
- Gay, N.C. Pure shear and simple shear deformation of inhomogeneous viscous fluids. 1. Theory. Tectonophysics 1968, 5, 211–234. [Google Scholar] [CrossRef]
- Jezek, J.; Schulmann, K.; Paterson, S. Modified Jeffery model: Influence of particle concentration on mineral fabric in moderately concentrated suspensions. J. Geophys. Res. Solid Earth 2013, 118, 852–861. [Google Scholar] [CrossRef]
- Taylor, G.I. The formation of emulsions in definable fields of flow. Proc. Math. Phys. Eng. Sci. 1934, 146, 501–523. [Google Scholar] [CrossRef] [Green Version]
- Guido, S.; Villone, M. Three-dimensional shape of a drop under simple shear flow. J. Rheol. 1998, 42, 395–415. [Google Scholar] [CrossRef]
- Cui, Z.; Zhao, L.; Huang, W.X.; Xu, C.X. Stability analysis of rotational dynamics of ellipsoids in simple shear flow. Phys. Fluids 2019, 31, 023301. [Google Scholar] [CrossRef]
- Hastie, W.W.; Watkeys, M.K.; Aubourg, C. Characterisation of grain-size, shape and orientation of plagioclase in the Rooi Rand dyke swarm, South Africa. Tectonophysics 2013, 583, 145–157. [Google Scholar] [CrossRef]
- Rust, A.C.; Manga, M.; Cashman, K.V. Determining flow type, shear rate and shear stress in magmas from bubble shapes and orientations. J. Volcanol. Geotherm. Res. 2003, 122, 111–132. [Google Scholar] [CrossRef]


Publisher’s Note: MDPI stays neutral with regard to jurisdictional claims in published maps and institutional affiliations. |
© 2022 by the authors. Licensee MDPI, Basel, Switzerland. This article is an open access article distributed under the terms and conditions of the Creative Commons Attribution (CC BY) license (https://creativecommons.org/licenses/by/4.0/).
Share and Cite
Zel, I.; Abdurakhimov, B.; Kichanov, S.; Lis, O.; Myrzabekova, E.; Kozlenko, D.; Tashmetov, M.; Ishbaev, K.; Kosbergenov, K. Neutron Tomography Studies of Two Lamprophyre Dike Samples: 3D Data Analysis for the Characterization of Rock Fabric. J. Imaging 2022, 8, 80. https://doi.org/10.3390/jimaging8030080
Zel I, Abdurakhimov B, Kichanov S, Lis O, Myrzabekova E, Kozlenko D, Tashmetov M, Ishbaev K, Kosbergenov K. Neutron Tomography Studies of Two Lamprophyre Dike Samples: 3D Data Analysis for the Characterization of Rock Fabric. Journal of Imaging. 2022; 8(3):80. https://doi.org/10.3390/jimaging8030080
Chicago/Turabian StyleZel, Ivan, Bekhzodjon Abdurakhimov, Sergey Kichanov, Olga Lis, Elmira Myrzabekova, Denis Kozlenko, Mannab Tashmetov, Khalbay Ishbaev, and Kuatbay Kosbergenov. 2022. "Neutron Tomography Studies of Two Lamprophyre Dike Samples: 3D Data Analysis for the Characterization of Rock Fabric" Journal of Imaging 8, no. 3: 80. https://doi.org/10.3390/jimaging8030080
APA StyleZel, I., Abdurakhimov, B., Kichanov, S., Lis, O., Myrzabekova, E., Kozlenko, D., Tashmetov, M., Ishbaev, K., & Kosbergenov, K. (2022). Neutron Tomography Studies of Two Lamprophyre Dike Samples: 3D Data Analysis for the Characterization of Rock Fabric. Journal of Imaging, 8(3), 80. https://doi.org/10.3390/jimaging8030080