
An Empirical Evaluation of Convolutional Networks for Malaria Diagnosis


Abstract
:1. Introduction
2. Related Work
3. Materials and Methods
3.1. Datasets
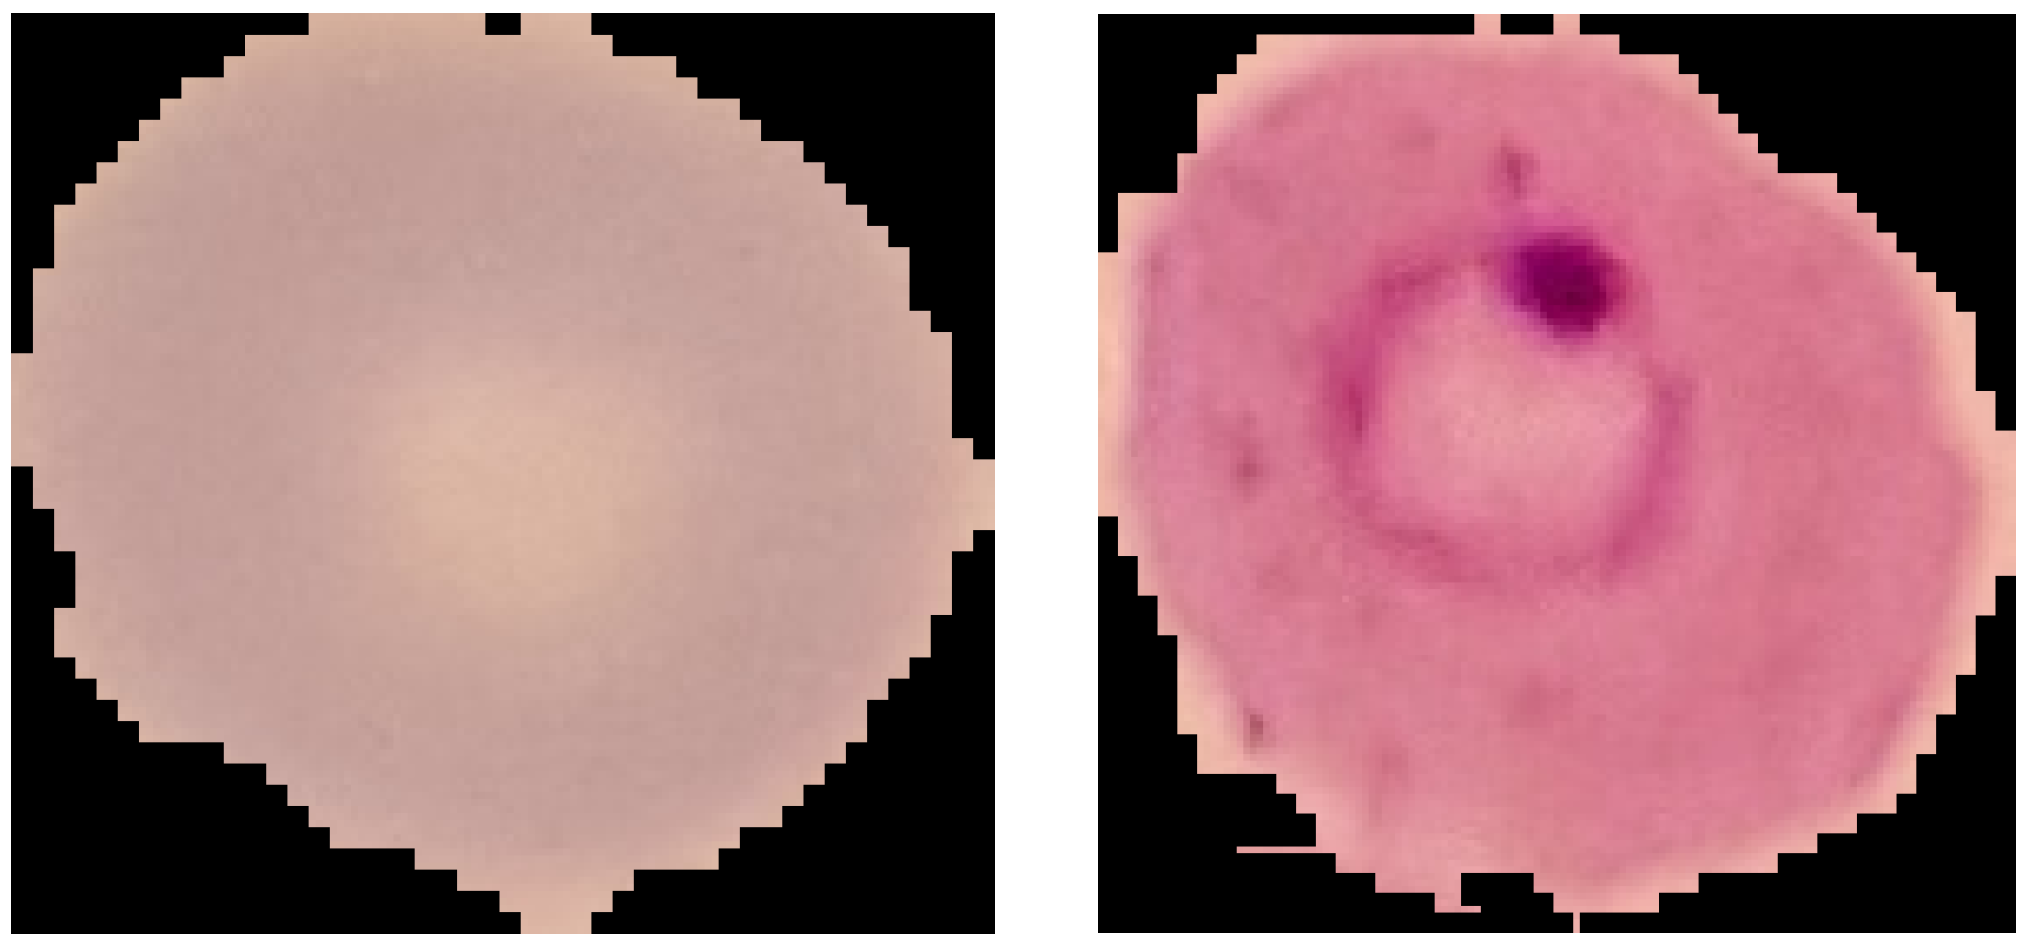
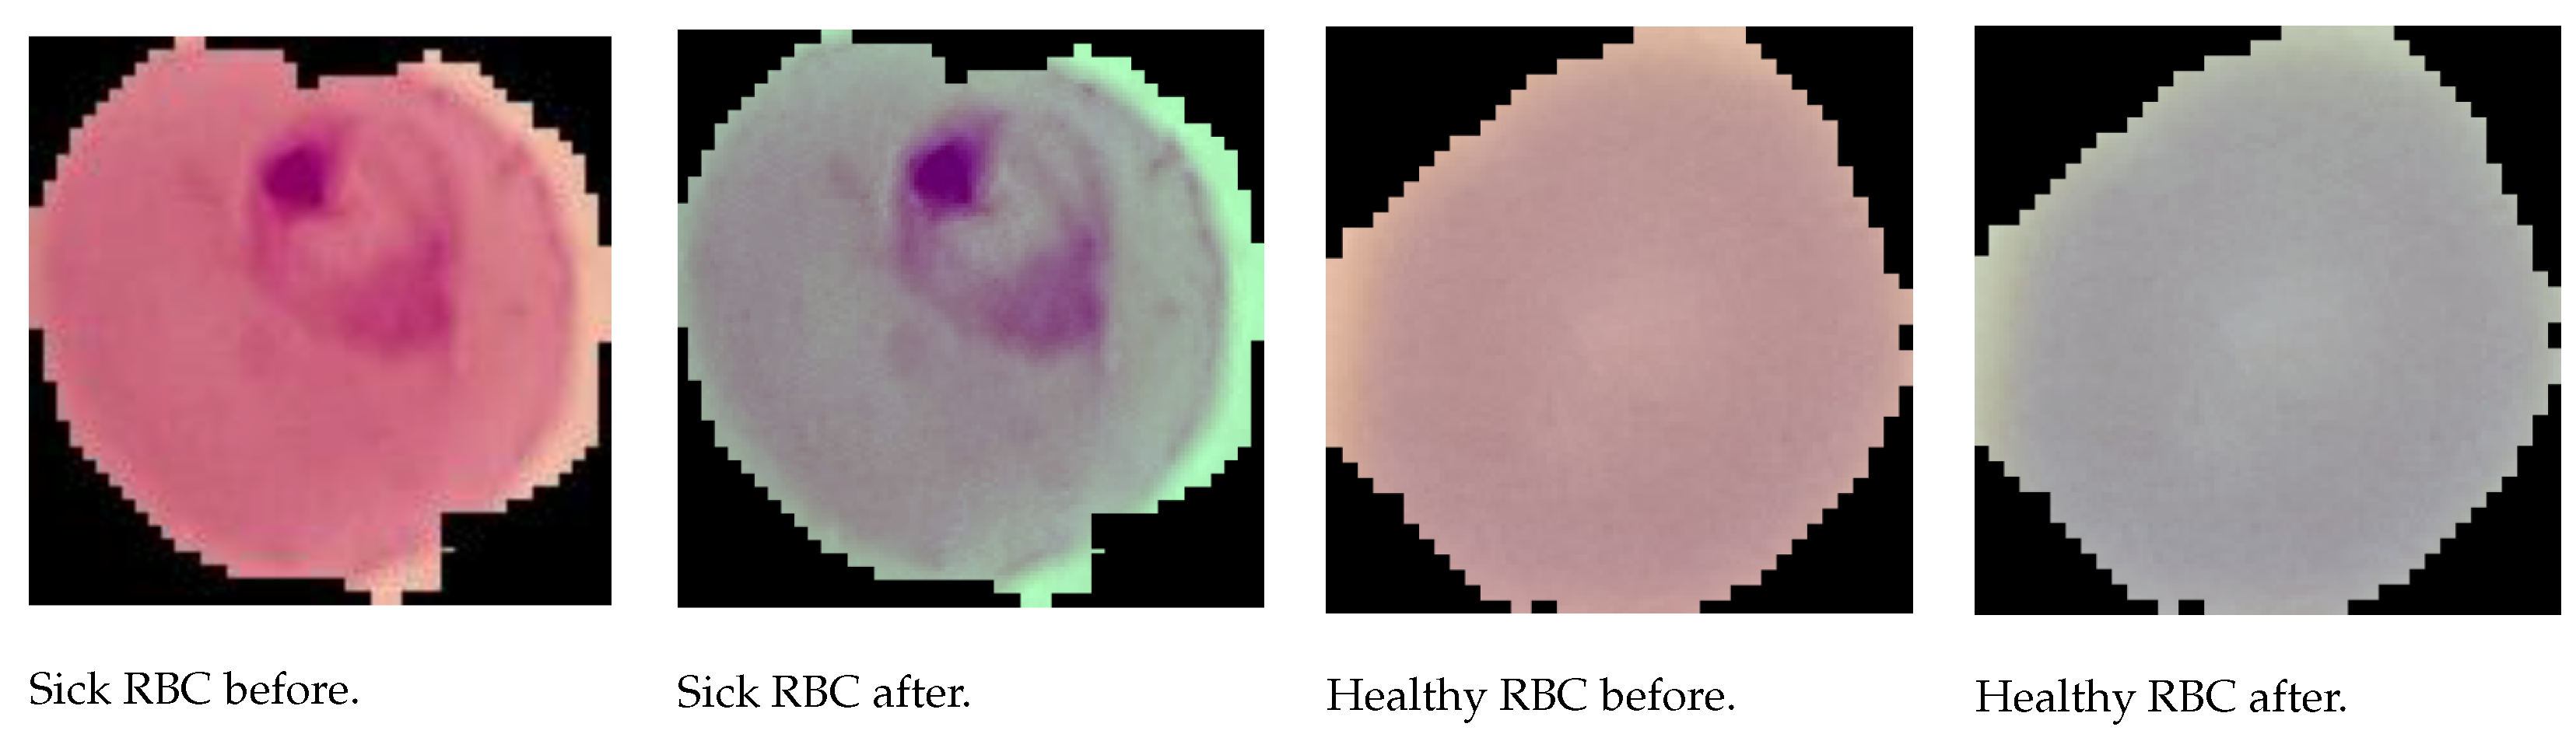
3.1.1. NIH
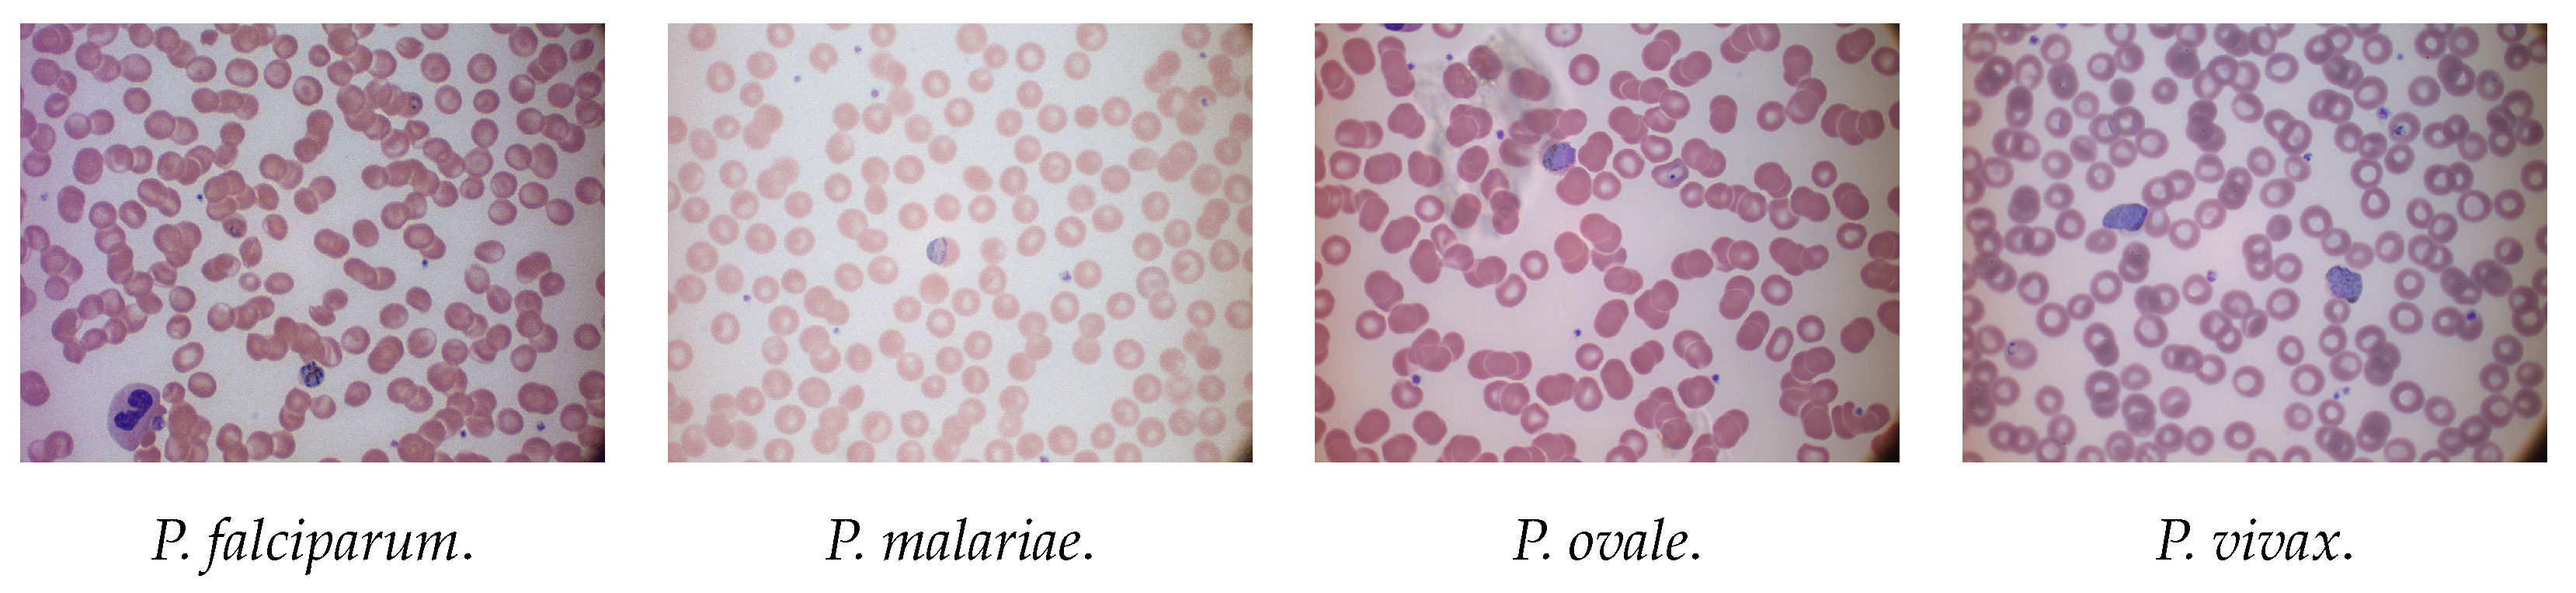
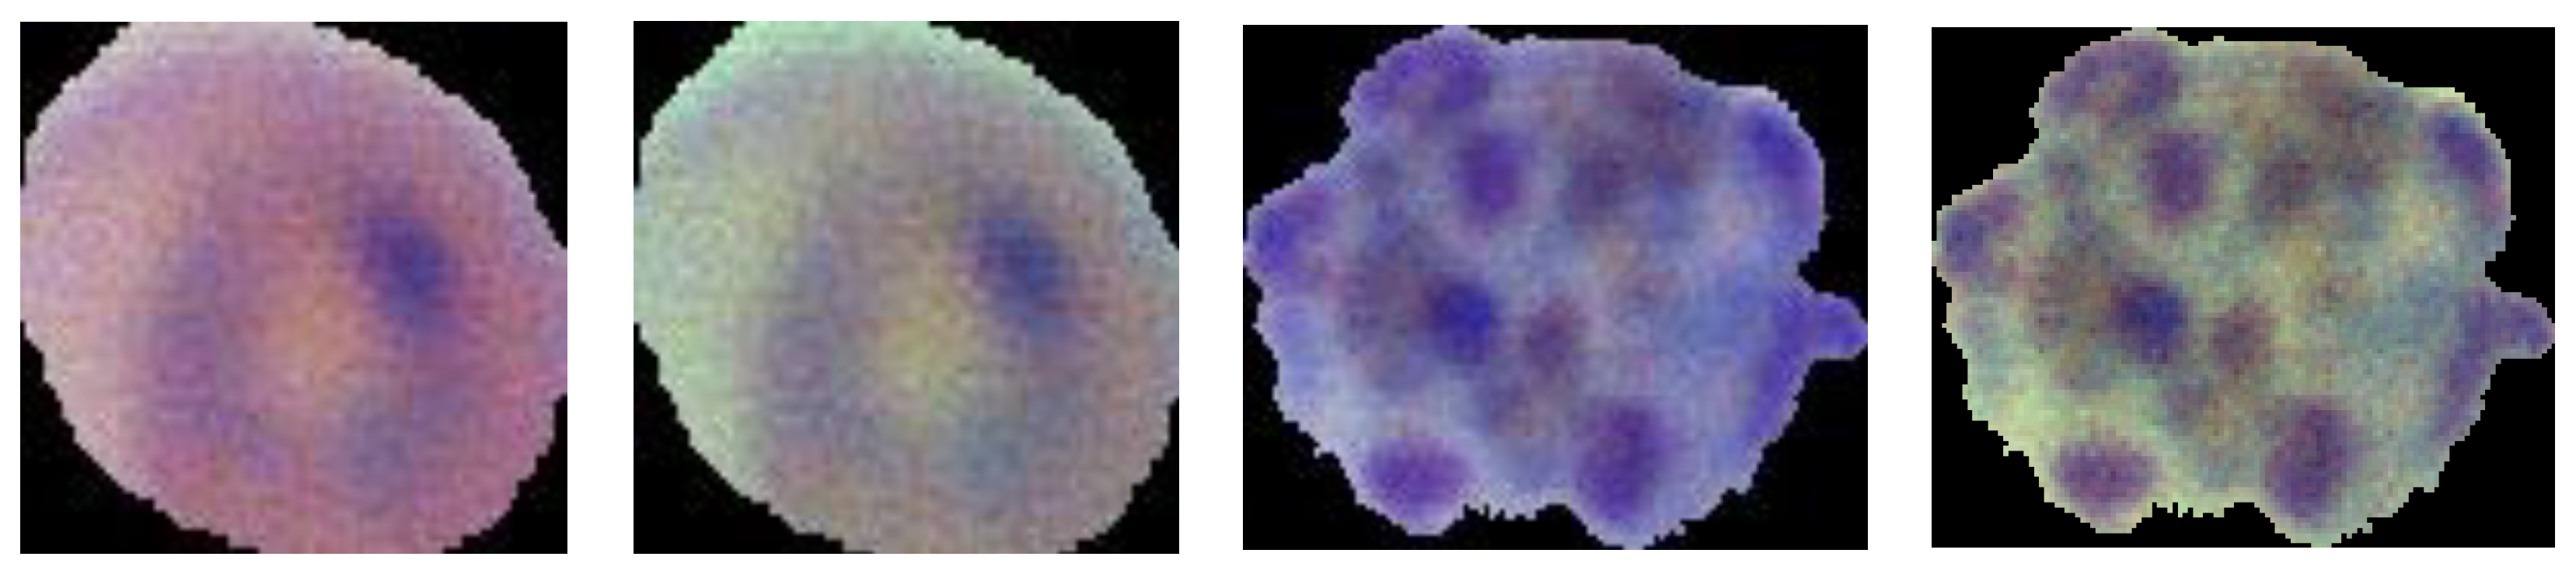
3.1.2. MP-IDB
3.2. Classification Pipeline
3.2.1. Deep Learning
3.2.2. Image Preprocessing
3.2.3. Data Augmentation
3.2.4. Experimental Setup
4. Experimental Results
- Binary classification on the NIH dataset (healthy vs. sick);
- Multiclass classification on the MP-IDB-FC dataset (four stages of life);
- Multiclass cross-dataset classification on both datasets.
4.1. Binary Classification Performance on NIH
- Extending the training phase beyond ten epochs did not improve accuracy, as the network stored individual image features rather than class features, and overfitting compromised the results;
- The ideal learning rate was 1 × 10⁻⁴. The accuracy increased too slowly for smaller values, and for larger ones, it did not converge to a specific value;
- Empirically, Adam was found as the best solver.
4.2. Multiclass Classification Performance on MP-IDB-FC
4.3. Cross-Dataset Classification Evaluation
4.3.1. MP-IDB-FC Classification with NIH Models
- Training on NIH and testing on MP-IDB-FC (Exp1);
- Training on NIH + fine-tuning on MP-IDB and testing on MP-IDB-FC (Exp2).
4.3.2. P. vivax Classification Using P. falciparum Data
- Training on MP-IDB-VC and testing on MP-IDB-FC (Exp3);
- Training on MP-IDB-VC and testing on MP-IDB-VC (Exp4);
- Training on MP-IDB-FC, fine-tuning and testing on MP-IDB-VC (Exp5).
5. Conclusions
Author Contributions
Funding
Institutional Review Board Statement
Informed Consent Statement
Data Availability Statement
Conflicts of Interest
Abbreviations
| Plasmodium | P. |
| RBC | Red Blood Cell |
| PBS | Peripheral Blood Smears |
| CAD | Computer-Aided Diagnostic |
| CNN | Convolutional Neural Network |
| TL | Transfer Learning |
| MP-IDB | Malaria Parasite Image Database for Image Processing and Analysis |
| NIH | National Institutes of Health |
References
- WHO. 2021. Available online: https://www.who.int/news-room/fact-sheets/detail/malaria (accessed on 13 September 2021).
- Stanford Healthcare. 2021. Available online: https://stanfordhealthcare.org/medical-conditions/primary-care/malaria/types.html (accessed on 13 September 2021).
- ScienceDirect. 2021. Available online: https://www.sciencedirect.com/topics/neuroscience/malaria (accessed on 10 September 2021).
- WHO. 2021. Available online: https://www.who.int/health-topics/malaria#tab=tab_1 (accessed on 10 September 2021).
- Centers for Disease Control Prevention. Available online: https://www.cdc.gov/malaria/about/biology/index.html (accessed on 10 September 2021).
- Vogado, L.H.; Veras, R.M.; Araujo, F.H.; Silva, R.R.; Aires, K.R. Leukemia diagnosis in blood slides using transfer learning in CNNs and SVM for classification. Eng. Appl. Artif. Intell. 2018, 72, 415–422. [Google Scholar] [CrossRef]
- Toğaçar, M.; Ergen, B.; Cömert, Z. Classification of white blood cells using deep features obtained from Convolutional Neural Network models based on the combination of feature selection methods. Appl. Soft Comp. J. 2020, 97, 106810. [Google Scholar] [CrossRef]
- Mondal, C.; Hasan, M.K.; Jawad, M.T.; Dutta, A.; Islam, M.R.; Awal, M.A.; Ahmad, M. Acute Lymphoblastic Leukemia Detection from Microscopic Images Using Weighted Ensemble of Convolutional Neural Networks. arXiv 2021, arXiv:2105.03995. [Google Scholar]
- Huang, Q.; Li, W.; Zhang, B.; Li, Q.; Tao, R.; Lovell, N.H. Blood Cell Classification Based on Hyperspectral Imaging with Modulated Gabor and CNN. IEEE J. Biomed. Health Inf. 2020, 24, 160–170. [Google Scholar] [CrossRef] [PubMed]
- Di Ruberto, C.; Loddo, A.; Puglisi, G. Blob Detection and Deep Learning for Leukemic Blood Image Analysis. Appl. Sci. 2020, 10, 1176. [Google Scholar] [CrossRef]
- Di Ruberto, C.; Loddo, A.; Putzu, L. Learning by Sampling for White Blood Cells Segmentation. In Proceedings of the 18th International Conference Image Analysis and Processing (ICIAP 2015), Genoa, Italy, 7–11 September 2015; Volume 9279, pp. 557–567. [Google Scholar]
- Di Ruberto, C.; Loddo, A.; Putzu, L. A leucocytes count system from blood smear images Segmentation and counting of white blood cells based on learning by sampling. Mach. Vis. Appl. 2016, 27, 1151–1160. [Google Scholar] [CrossRef]
- Di Ruberto, C.; Loddo, A.; Putzu, L. Detection of red and white blood cells from microscopic blood images using a region proposal approach. Comput. Biol. Med. 2020, 116, 103530. [Google Scholar] [CrossRef]
- Xie, W.; Noble, J.A.; Zisserman, A. Microscopy cell counting and detection with fully convolutional regression networks. Comput. Methods Biomech. Biomed. Eng. Imaging Vis. 2018, 6, 283–292. [Google Scholar] [CrossRef]
- Loddo, A.; Di Ruberto, C.; Kocher, M. Recent Advances of Malaria Parasites Detection Systems Based on Mathematical Morphology. Sensors 2018, 18, 513. [Google Scholar] [CrossRef] [Green Version]
- Maity, M.; Jaiswal, A.; Gantait, K.; Chatterjee, J.; Mukherjee, A. Quantification of malaria parasitaemia using trainable semantic segmentation and capsnet. Pattern Recognit. Lett. 2020, 138, 88–94. [Google Scholar] [CrossRef]
- Vijayalakshmi, A.; Kanna, B.R. Deep learning approach to detect malaria from microscopic images. Multim. Tools Appl. 2020, 79, 15297–15317. [Google Scholar] [CrossRef]
- Chan, Y.K.; Tsai, M.H.; Huang, D.C.; Zheng, Z.H.; Hung, K.D. Leukocyte nucleus segmentation and nucleus lobe counting. BMC Bioinform. 2010, 11, 558. [Google Scholar] [CrossRef] [PubMed] [Green Version]
- De Carneri, L. Parassitologia Generale e Umana; Casa Editrice Ambrosiana CEA: Milano, Italy, 1972. [Google Scholar]
- Faust, E.C.; Beaver, P.C.; Jung, R.C. Animal Agents and Vectors of Human Disease; Henry Kimpton Publishers Ltd.: London, UK, 1975. [Google Scholar]
- Jan, Z.; Khan, A.; Sajjad, M.; Muhammad, K.; Rho, S.; Mehmood, I. A review on automated diagnosis of malaria parasite in microscopic blood smears images. Multim. Tools Appl. 2018, 77, 9801–9826. [Google Scholar] [CrossRef]
- Poostchi, M.; Silamut, K.; Maude, R.J.; Jaeger, S.; Thoma, G. Image analysis and machine learning for detecting malaria. Transl. Res. 2018, 194, 36–55. [Google Scholar] [CrossRef] [PubMed] [Green Version]
- Somasekar, J.; Eswara Reddy, B. Segmentation of erythrocytes infected with malaria parasites for the diagnosis using microscopy imaging. Comput. Electr. Eng. 2015, 45, 336–351. [Google Scholar] [CrossRef]
- Bias, S.; Reni, S.; Kale, I. Mobile Hardware Based Implementation of a Novel, Efficient, Fuzzy Logic Inspired Edge Detection Technique for Analysis of Malaria Infected Microscopic Thin Blood Images. Procedia Comput. Sci. 2018, 141, 374–381. [Google Scholar] [CrossRef]
- Rode, K.B.; Bharkad, S.D. Automatic segmentation of malaria affected erythrocyte in thin blood films. In International Conference on ISMAC in Computational Vision and Bio-Engineering; Springer: Berlin/Heidelberg, Germany, 2018; pp. 993–1002. [Google Scholar]
- Liang, Z.; Powell, A.; Ersoy, I.; Poostchi, M.; Silamut, K.; Palaniappan, K.; Guo, P.; Hossain, M.A.; Antani, S.K.; Maude, R.J.; et al. CNN-based image analysis for malaria diagnosis. In Proceedings of the International Conference on Bioinformatics and Biomedicine (BIBM 2016), Shenzhen, China, 15–18 December 2016; pp. 493–496. [Google Scholar]
- Rajaraman, S.; Antani, S.K.; Poostchi, M.; Silamut, K.; Hossain, M.A.; Maude, R.J.; Jaeger, S.; Thoma, G.R. Pre-trained convolutional neural networks as feature extractors toward improved malaria parasite detection in thin blood smear images. PeerJ 2018, 6, e4568. [Google Scholar] [CrossRef]
- Rajaraman, S.; Jaeger, S.; Antani, S.K. Perf. eval. of deep neural ensembles toward malaria parasite detection in thin-blood smear images. PeerJ 2019, 7, e6977. [Google Scholar] [CrossRef] [Green Version]
- Krizhevsky, A.; Sutskever, I.; Hinton, G.E. ImageNet Classification with Deep Convolutional Neural Networks. In Proceedings of the 25th International Conference on Neural Information Processing Systems, Lake Tahoe, NV, USA, 3–6 December 2012; Volume 1, pp. 1097–1105. [Google Scholar]
- Rahman, A.; Zunair, H.; Reme, T.R.; Rahman, M.S.; Mahdy, M. A comparative analysis of deep learning architectures on high variation malaria parasite classification dataset. Tissue Cell 2021, 69, 101473. [Google Scholar] [CrossRef]
- Nanni, L.; Ghidoni, S.; Brahnam, S. Handcrafted vs. non-handcrafted features for computer vision classification. Pattern Recognit. 2017, 71, 158–172. [Google Scholar] [CrossRef]
- Loddo, A.; Di Ruberto, C. On the Efficacy of Handcrafted and Deep Features for Seed Image Classification. J. Imaging 2021, 7, 171. [Google Scholar] [CrossRef] [PubMed]
- Kudisthalert, W.; Pasupa, K.; Tongsima, S. Counting and Classification of Malarial Parasite From Giemsa-Stained Thin Film Images. IEEE Access 2020, 8, 78663–78682. [Google Scholar] [CrossRef]
- Abdurahman, F.; Fante, K.A.; Aliy, M. Malaria parasite detection in thick blood smear microscopic images using modified YOLOV3 and YOLOV4 models. BMC Bioinform. 2021, 22, 112. [Google Scholar] [CrossRef] [PubMed]
- Loddo, A.; Di Ruberto, C.; Kocher, M.; Prod’Hom, G. MP-IDB: The Malaria Parasite Image Database for Image Processing and Analysis. In Processing and Analysis of Biomedical Information; Springer: Berlin/Heidelberg, Germany, 2019; pp. 57–65. [Google Scholar]
- Deng, J.; Dong, W.; Socher, R.; Li, L.J.; Li, K.; Fei-Fei, L. Imagenet: A large-scale hierarchical image database. In Proceedings of the 2009 IEEE Conference on Computer Vision and Pattern Recognition, Miami, FL, USA, 20–25 June 2009; pp. 248–255. [Google Scholar]
- Shin, H.; Roth, H.R.; Gao, M.; Lu, L.; Xu, Z.; Nogues, I.; Yao, J.; Mollura, D.; Summers, R.M. Deep Convolutional Neural Networks for Computer-Aided Detection: CNN Architectures, Dataset Characteristics and Transfer Learning. IEEE Trans. Med. Imaging 2016, 35, 1285–1298. [Google Scholar] [CrossRef] [PubMed] [Green Version]
- Simonyan, K.; Zisserman, A. Very Deep Convolutional Networks for Large-Scale Image Recognition. In Proceedings of the 3rd International Conference on Learning Representations (ICLR 2015), San Diego, CA, USA, 7–9 May 2015. [Google Scholar]
- Szegedy, C.; Liu, W.; Jia, Y.; Sermanet, P.; Reed, S.; Anguelov, D.; Erhan, D.; Vanhoucke, V.; Rabinovich, A. Going deeper with convolutions. In Proceedings of the 2015 IEEE Conference on Computer Vision and Pattern Recognition (CVPR), Boston, MA, USA, 7–12 June 2015; pp. 1–9. [Google Scholar]
- Szegedy, C.; Vanhoucke, V.; Ioffe, S.; Shlens, J.; Wojna, Z. Rethinking the Inception Architecture for Computer Vision. In Proceedings of the 2016 IEEE Conference on Computer Vision and Pattern Recognition (CVPR), Las Vegas, NV, USA, 27–30 June 2016; pp. 2818–2826. [Google Scholar]
- He, K.; Zhang, X.; Ren, S.; Sun, J. Deep Residual Learning for Image Recognition. In Proceedings of the 2016 IEEE Conference on Computer Vision and Pattern Recognition (CVPR), Las Vegas, NV, USA, 27–30 June 2016; pp. 770–778. [Google Scholar]
- Huang, G.; Liu, Z.; Weinberger, K.Q. Densely Connected Convolutional Networks. In Proceedings of the 2016 IEEE Conference on Computer Vision and Pattern Recognition (CVPR), Las Vegas, NV, USA, 27–30 June 2016. [Google Scholar]
- Zhang, X.; Zhou, X.; Lin, M.; Sun, J. ShuffleNet: An Extremely Efficient Convolutional Neural Network for Mobile Devices. In Proceedings of the 2018 IEEE Conference on Computer Vision and Pattern Recognition (CVPR 2018), Salt Lake City, UT, USA, 18–22 June 2018; pp. 6848–6856. [Google Scholar]
- Iandola, F.N.; Moskewicz, M.W.; Ashraf, K.; Han, S.; Dally, W.J.; Keutzer, K. SqueezeNet: AlexNet-level accuracy with 50× fewer parameters and <1 MB model size. arXiv 2016, arXiv:1602.07360. [Google Scholar]
- Sandler, M.; Howard, A.G.; Zhu, M.; Zhmoginov, A.; Chen, L. MobileNetV2: Inverted Residuals and Linear Bottlenecks. In Proceedings of the 2018 IEEE Conference on Computer Vision and Pattern Recognition (CVPR 2018), Salt Lake City, UT, USA, 18–22 June 2018; pp. 4510–4520. [Google Scholar]
- Wong, S.C.; Gatt, A.; Stamatescu, V.; McDonnell, M.D. Understanding Data Augmentation for Classification: When to Warp? In Proceedings of the 2016 International Conference on Digital Image Computing: Techniques and Applications (DICTA 2016), Gold Coast, Australia, 30 November–2 December 2016; pp. 1–6. [Google Scholar]
- Shijie, J.; Ping, W.; Peiyi, J.; Siping, H. Research on data augmentation for image classification based on convolution neural networks. In Proceedings of the 2017 Chinese Automation Congress (CAC), Jinan, China, 20–22 October 2017; pp. 4165–4170. [Google Scholar]
- Mikołajczyk, A.; Grochowski, M. Data augmentation for improving deep learning in image classification problem. In Proceedings of the 2018 International Interdisciplinary PhD Workshop (IIPhDW), Swinoujscie, Poland, 9–12 May 2018; pp. 117–122. [Google Scholar]
- Ergen, M.B. Texture based feature extraction methods for content based medical image retrieval systems. Bio-Med. Mater. Eng. 2014, 24, 3055–3062. [Google Scholar] [CrossRef] [Green Version]
- Başaran, E.; Şengür, A.; Cömert, Z.; Budak, Ü.; Çelık, Y.; Velappan, S. Normal and Acute Tympanic Membrane Diagnosis based on Gray Level Co-Occurrence Matrix and Artificial Neural Networks. In Proceedings of the 2019 International Artificial Intelligence and Data Processing Symposium (IDAP), Malatya, Turkey, 21–22 September 2019; pp. 1–6. [Google Scholar]

| Params | Value |
|---|---|
| Solver | Adam |
| Max Epochs | 10 |
| Mini Batch Size | 32 |
| Initial Learn Rate | 1 × 10⁻⁴ |
| Learn Rate Drop Period | 10 |
| Learn Rate Drop Factor | 0.1 |
| L2 Regularisation | 0.1 |
| Network | Accuracy (%) | Time (min) |
|---|---|---|
| AlexNet | 97.35 | 10 |
| DenseNet-201 | 95.86 | 5145 |
| ResNet-18 | 97.68 | 21 |
| ResNet-50 | 97.61 | 82 |
| ResNet-101 | 97.24 | 391 |
| GoogLeNet | 96.73 | 111 |
| ShuffleNet | 97.39 | 33 |
| SqueezeNet | 97.21 | 16 |
| MobileNetV2 | 97.31 | 210 |
| Inceptionv3 | 96.70 | 151 |
| VGG-16 | 97.31 | 322 |
| Avg. | 97.25 | – |
| Accuracy ± Standard Deviation (%) | |||
|---|---|---|---|
| Network | D1 | D2 | D3 |
| AlexNet | |||
| DenseNet-201 | |||
| ResNet-18 | |||
| ResNet-50 | |||
| ResNet-101 | |||
| GoogLeNet | |||
| ShuffleNet | |||
| SqueezeNet | |||
| MobileNetV2 | |||
| Inceptionv3 | |||
| VGG-16 | |||
| Avg. | 91.42 | 91.64 | 88.75 |
| Network | Exp1 (%) | Exp2 (%) |
|---|---|---|
| AlexNet | 42.71 | |
| DenseNet-201 | 49.73 | |
| ResNet-18 | 68.23 | |
| ResNet-50 | 68.23 | |
| ResNet-101 | 69.10 | |
| GoogLeNet | 68.23 | |
| ShuffleNet | 32.23 | |
| SqueezeNet | 68.23 | |
| MobileNetV2 | 57.12 | |
| Inceptionv3 | 41.84 | |
| VGG-16 | 53.59 | |
| Avg. | 60.61 | 92.59 |
| Network | Exp3 (%) | Exp4 (%) | Exp5 (%) |
|---|---|---|---|
| AlexNet | 30.16 | ||
| DenseNet-201 | 72.94 | ||
| ResNet-18 | 30.16 | ||
| ResNet-50 | 55.56 | ||
| ResNet-101 | 57.14 | ||
| GoogLeNet | 28.57 | ||
| ShuffleNet | 58.73 | ||
| SqueezeNet | 31.75 | ||
| MobileNetV2 | 34.92 | ||
| Inceptionv3 | 57.14 | ||
| VGG-16 | 49.21 | ||
| Avg. | 46.02 | 78.60 | 79.35 |
Publisher’s Note: MDPI stays neutral with regard to jurisdictional claims in published maps and institutional affiliations. |
© 2022 by the authors. Licensee MDPI, Basel, Switzerland. This article is an open access article distributed under the terms and conditions of the Creative Commons Attribution (CC BY) license (https://creativecommons.org/licenses/by/4.0/).
Share and Cite
Loddo, A.; Fadda, C.; Di Ruberto, C. An Empirical Evaluation of Convolutional Networks for Malaria Diagnosis. J. Imaging 2022, 8, 66. https://doi.org/10.3390/jimaging8030066
Loddo A, Fadda C, Di Ruberto C. An Empirical Evaluation of Convolutional Networks for Malaria Diagnosis. Journal of Imaging. 2022; 8(3):66. https://doi.org/10.3390/jimaging8030066
Chicago/Turabian StyleLoddo, Andrea, Corrado Fadda, and Cecilia Di Ruberto. 2022. "An Empirical Evaluation of Convolutional Networks for Malaria Diagnosis" Journal of Imaging 8, no. 3: 66. https://doi.org/10.3390/jimaging8030066
APA StyleLoddo, A., Fadda, C., & Di Ruberto, C. (2022). An Empirical Evaluation of Convolutional Networks for Malaria Diagnosis. Journal of Imaging, 8(3), 66. https://doi.org/10.3390/jimaging8030066