Article

Multi-Frequency GPR Microwave Imaging of Sparse Targets through a Multi-Task Bayesian Compressive Sensing Approach

Department of Civil, Environmental and Mechanical Engineering, DICAM, ELEDIA Research Center (ELEDIA@UniTN-University of Trento), Via Mesiano 77, 38123 Trento, Italy
*
Author to whom correspondence should be addressed.
These authors contributed equally to this work.
J. Imaging 2021, 7(11), 247; https://doi.org/10.3390/jimaging7110247
Submission received: 7 October 2021 / Revised: 12 November 2021 / Accepted: 18 November 2021 / Published: 21 November 2021

Abstract

:
An innovative inverse scattering (IS) method is proposed for the quantitative imaging of pixel-sparse scatterers buried within a lossy half-space. On the one hand, such an approach leverages on the wide-band nature of ground penetrating radar (GPR) data by jointly processing the multi-frequency (MF) spectral components of the collected radargrams. On the other hand, it enforces sparsity priors on the problem unknowns to yield regularized solutions of the fully non-linear scattering equations. Towards this end, a multi-task Bayesian compressive sensing (MT-BCS) methodology is adopted and suitably customized to take full advantage of the available frequency diversity and of the a-priori information on the class of imaged targets. Representative results are reported to assess the proposed MF-MT-BCS strategy also in comparison with competitive state-of-the-art alternatives.

1. Introduction

During the last decades, many efforts have been devoted to the development of microwave imaging (MI) techniques for retrieving reliable and easy-to-interpret images of subsurface regions starting from the radargrams collected above the interface with a ground penetrating radar (GPR) [1,2,3,4,5,6,7,8,9]. The solution of the arising subsurface inverse scattering (IS) problem poses several challenges, mainly related to the intrinsic non-linearity (NL) and the ill-posedness (IP) [10]. On the one hand, the NL can be avoided by introducing Born-like approximations of the scattering equations [5], provided that weak scatterers are at hand and assuming that qualitative guesses (i.e., location and shape) are sufficient for the targeted application. Otherwise, multi-resolution strategies, integrated with both deterministic [7,9] and stochastic [8] optimization techniques, proved to be effective in mitigating the NL by reducing the ratio between unknowns and non-redundant informative data. On the other hand, the IP issue can be tackled by collecting the maximum amount of information from the scattering experiments. For instance, the wide-band nature of GPR measurements above the interface [1] provides an intrinsic frequency diversity in the collectable data. Such an information on the scenario under test can be profitably exploited with both frequency-hopping (FH) [6,7] and multi-frequency (MF) [8,9] MI techniques by processing each spectral component in a cascaded fashion or jointly, respectively.
Another effective recipe against the IP is the use of the a-priori information on the class of imaged targets. As a matter of fact, compressive sensing (CS)-based techniques [6,11,12,13,14] faithfully retrieved sparse objects (i.e., objects representable with few non-null expansion coefficients with respect to a suitably-chosen representation basis). Recently, CS-based methods have been proposed mainly to address and enhance the data acquisition speed in stepped frequency continuous wave (SFCW) GPRs [15,16,17,18]. Moreover, several deterministic CS strategies have been proposed for the tomographic imaging of buried targets that are intrinsically sparse with respect to the imaged domain including, for instance, landmines [19].
In such a framework, Bayesian CS (BCS) solvers have emerged as effective, computationally-fast, and also feasible tools since they do not require the compliance of the scattering operator with the restricted isometry property (RIP), whose check is often computationally unaffordable [11].
Following this line of reasoning, this paper presents a novel MF approach for reliably, robustly, and efficiently solving the GPR-MI of pixel-sparse subsurface objects. The proposed approach is based on a fully non-linear contrast source (CSI) formulation of the scattering equations, then solved by means of a customized multi-task BCS (MT-BCS) solver [13,14] based on a joint marginal likelihood maximization strategy that enforces the correlation between multi-static/multi-view wide-band GPR data. Therefore, to the best of the authors’ knowledge, the main novelty of this work relies on the development of a novel subsurface IS methodology combining the regularization capabilities of the BCS with those arising from the joint processing of multi-chromatic data. Accordingly, paramount challenges in GPR-MI are addressed related to (i) the implementation of an effective strategy counteracting the strong IP of the subsurface IS problem, (ii) the quantitative imaging of the subsurface domain to yield easy-to-interpret guesses of its EM composition, and (iii) the solution of the arising MF-CSI problem with high computational efficiency.

2. Mathematical Formulation

Let us consider a two-dimensional transverse magnetic (2D-TM) half-space scenario where the investigation domain D is a subsurface region within a lossy soil with relative permittivity ε r s and conductivity σ s (Figure 1).
By considering a multi-static/multi-view measurement system, D is illuminated by Vz-oriented line sources placed in an observation domain Ω at distance H above the interface (Figure 1). The v-th ( v = 1 , , V ) total electric field measured in time-domain by the m-th ( m = 1 , , M ; M = V 1 ) receiver in Ω , r ̲ m v ( r ̲ m v = x m v , y m v = H ), at the time-instant t ( 0 t T ), is given by [1]
e v r ̲ m v , t = e i v r ̲ m v , t + e s v r ̲ m v , t
where e i v and e s v are the incident and scattered fields, respectively, while T is the duration of the GPR probing window. Being
Δ f = f max f min
the 3 dB bandwidth of the transmitted waveform, the scattered field at the p-th ( p = 1 , , P ) frequency,
f p = f min + p 1 Δ f P 1
turns out to be
E s , p v r ̲ m v = Φ p e v r ̲ m v , t e i v r ̲ m v , t ; m = 1 , , M ; v = 1 , , V
where Φ p a r ̲ , t = a r ̲ , t exp j 2 π f p d t is the Fourier transform. Moreover, it is related to the contrast function,
τ p r ̲ = ε r r ̲ ε r s + j σ s σ r ̲ 2 π f p ε 0
modeling the unknown dielectric distribution in the investigation domain D at frequency f p ( p = 1 , , P ), by the data equation [1]
E s , p v r ̲ m v = D G p v r ̲ m v , r ̲ J p v r ̲ d r ̲
where G p v r ̲ m v , r ̲ is the half-space Green’s function [1], while
J p v r ̲ = τ p r ̲ E p v r ̲ = τ p r ̲ Φ p e v r ̲ , t
is the v-th ( v = 1 , , V ) equivalent current induced within the investigation domain.

Inverse Problem Solution Approach

To numerically solve the inverse problem at hand, the Equation (6) is first recast into the following matrix expression
ξ ̲ p v = Ψ ̲ ̲ p v υ ̲ p v
by partitioning D into N square sub-domains centered at r ̲ n ; n = 1 , , N so that
ξ ̲ p v = E ̲ s , p v , E ̲ s , p v T
being E ̲ s , p v = E s , p v r ̲ m v ; m = 1 , , M ,
υ ̲ p v = J ̲ p v , J ̲ p v T
being J ̲ p v = J p v r ̲ n ; n = 1 , , N , and
Ψ ̲ ̲ p v = G ̲ ̲ p v G ̲ ̲ p v G ̲ ̲ p v G ̲ ̲ p v ,
G ̲ ̲ p v being the v , p -th ( v = 1 , , V ; p = 1 , , P ) M × N half-space Green’s matrix [1], while . T stands for the transpose operator and . / . denotes the real/imaginary part.
Successively, the solution of (8) is found with a customized multi-frequency multi-task BCS (MF-MT-BCS) technique [14] by jointly enforcing the spatial sparsity of the unknown components of the equivalent currents
υ ̲ p v ; v = 1 , , V ; p = 1 , , P
( υ ˜ ̲ p v = υ ˜ p , n v ; n = 1 , , 2 N ; υ ˜ p , n v = J ˜ p v r ̲ n and υ ˜ p , n + N v = J ˜ p v r ̲ n ), and their correlation among the different illuminations and spectral components, the number of “tasks” solved in parallel being equal to L = V × P . More specifically, the v-th ( v = 1 , , V ) equivalent current at the p-th ( p = 1 , , P ) frequency is computed as
υ ˜ ̲ p v = diag α ˜ ̲ + Ψ ̲ ̲ p v Ψ ̲ ̲ p v 1 Ψ ̲ ̲ p v ξ ̲ p v
by applying a fast relevant vector machine (RVM) method [14] to solve the following optimization problem
α ˜ ̲ = arg max α ̲ 0.5 p = 1 P v = 1 V 2 M + 2 δ 1 log ξ ̲ p v U ̲ ̲ p v 1 ξ ̲ p v + 2 δ 2 + log U ̲ ̲ p v
for retrieving the set of 2 N hyper-parameters α ̲ = α n ; n = 1 , , 2 N shared among the V views and P frequencies. In (14),
U ̲ ̲ p v = I ̲ ̲ + Ψ ̲ ̲ p v diag α ̲ 1 Ψ ̲ ̲ p v ,
I ̲ ̲ being the identity matrix, is an auxiliary matrix analogous to (14) in [14], while δ 1 and δ 2 are BCS control parameters. Moreover, . and . indicate the conjugate transpose and the determinant, respectively.
Finally, the contrast distribution ( n = 1 , , N ) at the central frequency,
f c = f min + f max 2
is derived as
τ ˜ r ̲ n = 1 P p = 1 P τ ˜ p r ̲ n + j f p f c τ ˜ p r ̲ n
where
τ ˜ p r ̲ n = 1 V v = 1 V J ˜ p v r ̲ n E ˜ p v r ̲ n
J ˜ p v r ̲ n = υ ˜ p , n v + j υ ˜ p , n + N v and E ˜ p v r ̲ n being the v , p -th ( v = 1 , , V ; p = 1 , , P ) retrieved current and the corresponding total electric field in the n-th ( n = 1 , , N ) cell of the investigation domain ( r ̲ n D ), respectively.

3. Numerical Assessment

To assess the proposed MF-MT-BCS approach, representative numerical results are shown and discussed in this Section. A square investigation domain D of side 0.8 m buried in a medium with ε r s = 4.0 and σ s = 10 3 (S/m) [9] has been considered as a reference benchmark scenario. Moreover, a set of V = 20 sources and M = V 1 = 19 probes (for each illumination), located in an observation domain Ω placed at H = 0.1 m above the interface (Figure 1), has been chosen for the sensing setup to collect the time-domain GPR radargrams. These latter have been simulated with the GPRMax2D SW [20], while the scattered spectrum has been sampled at P = 9 uniformly-spaced frequencies within the 3 dB band f max , f min = 200 , 600 MHz ( Δ f = 400 MHz, f c = 400 MHz of the Gaussian monocycle excitation centered at f 0 = 300 MHz [6]. As for the setting of the MF-MT-BCS control parameters (14), the optimal trade-off values δ 1 , δ 2 = 6 × 10 1 , 9 × 10 5 have been derived from a preliminary calibration performed by blurring the time-domain total field data samples with different levels of white Gaussian noise. Finally, to provide a quantitative measure of the reconstruction accuracy, the following integral error has been considered [9]
Ξ r e g = 1 N r e g n = 1 N r e g τ r ̲ n τ ˜ r ̲ n τ r ̲ n + 1
where τ r ̲ n and τ ˜ r ̲ n denote the actual and retrieved contrast at frequency f c , respectively, while “reg” indicates that the computation considers the whole imaged domain (“reg” ⇒ “tot”), the target support (“reg” ⇒ “int”), or the external background (“reg” ⇒ “ext”).
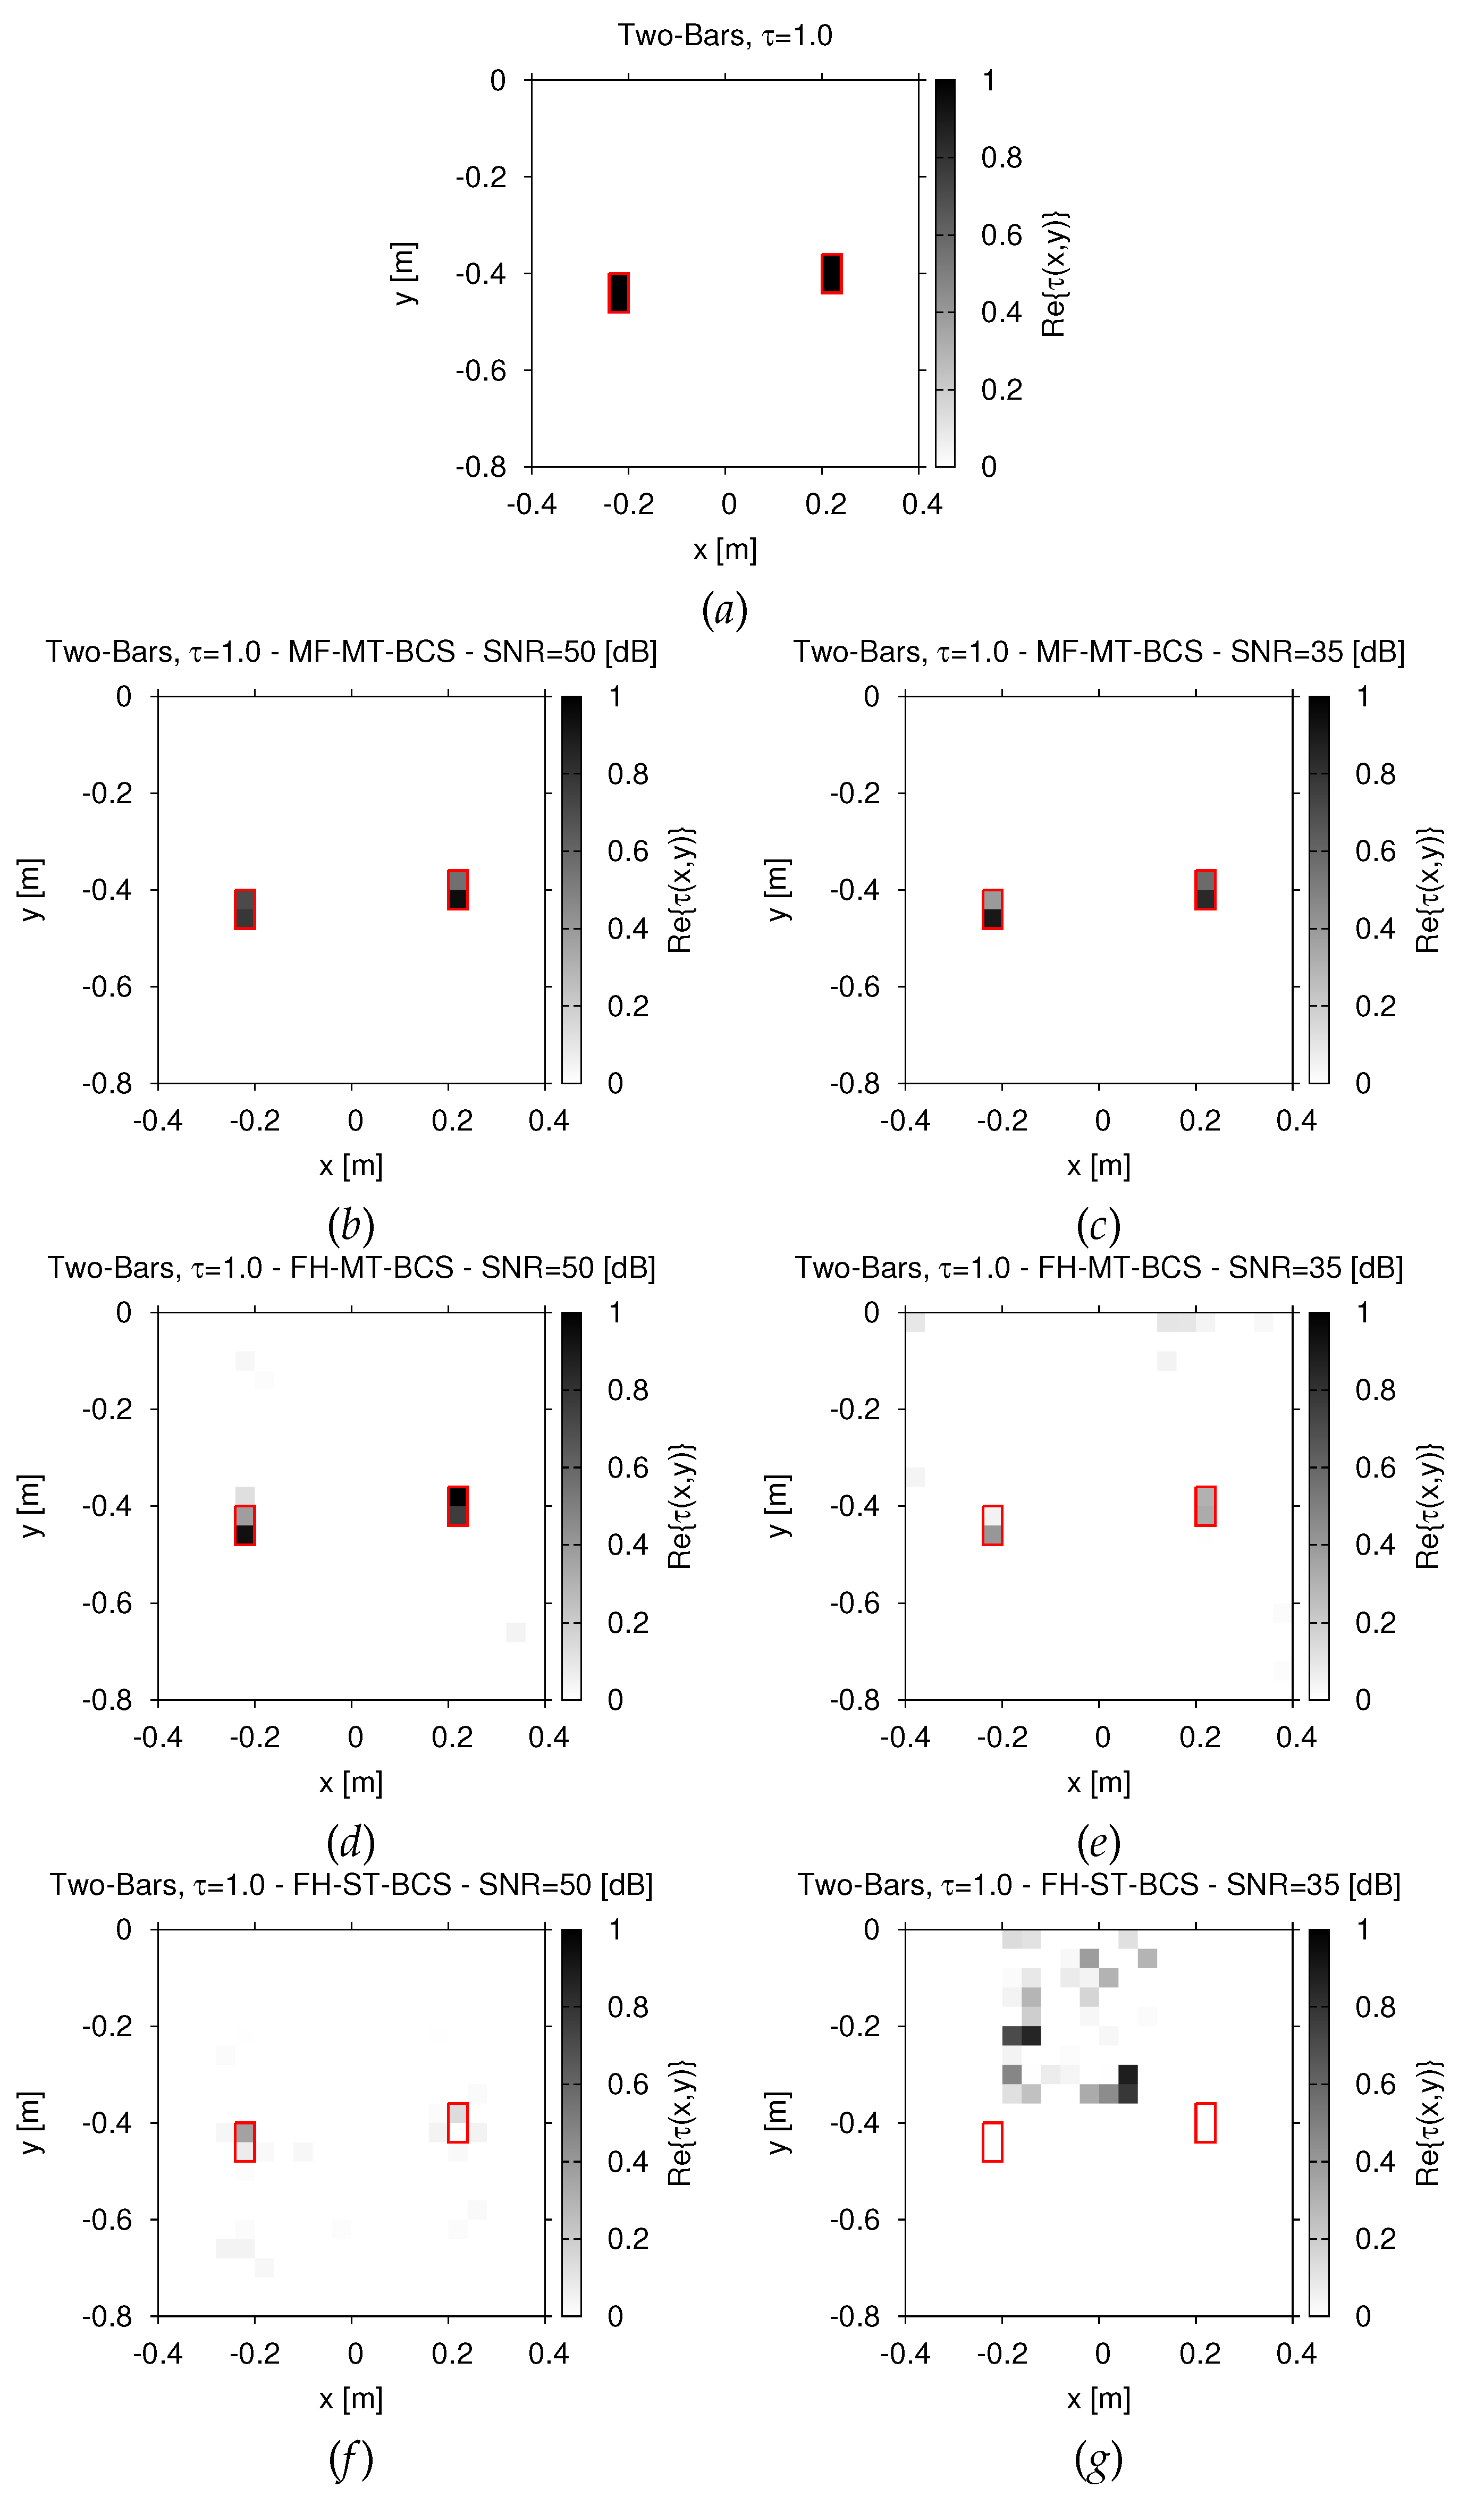
The first test case is concerned with the “Two-Bars” scattering profile of Figure 2a ( ε r = 5 , σ = 10 3 (S/m) ⇒ τ = 1.0 ). The MF-MT-BCS data inversion gives a very accurate image of D independently on the data signal-to-noise ratio (SNR) and it faithfully recovers the support, as well as the contrast value of the two buried scatterers (Figure 2b,c vs. Figure 2a).
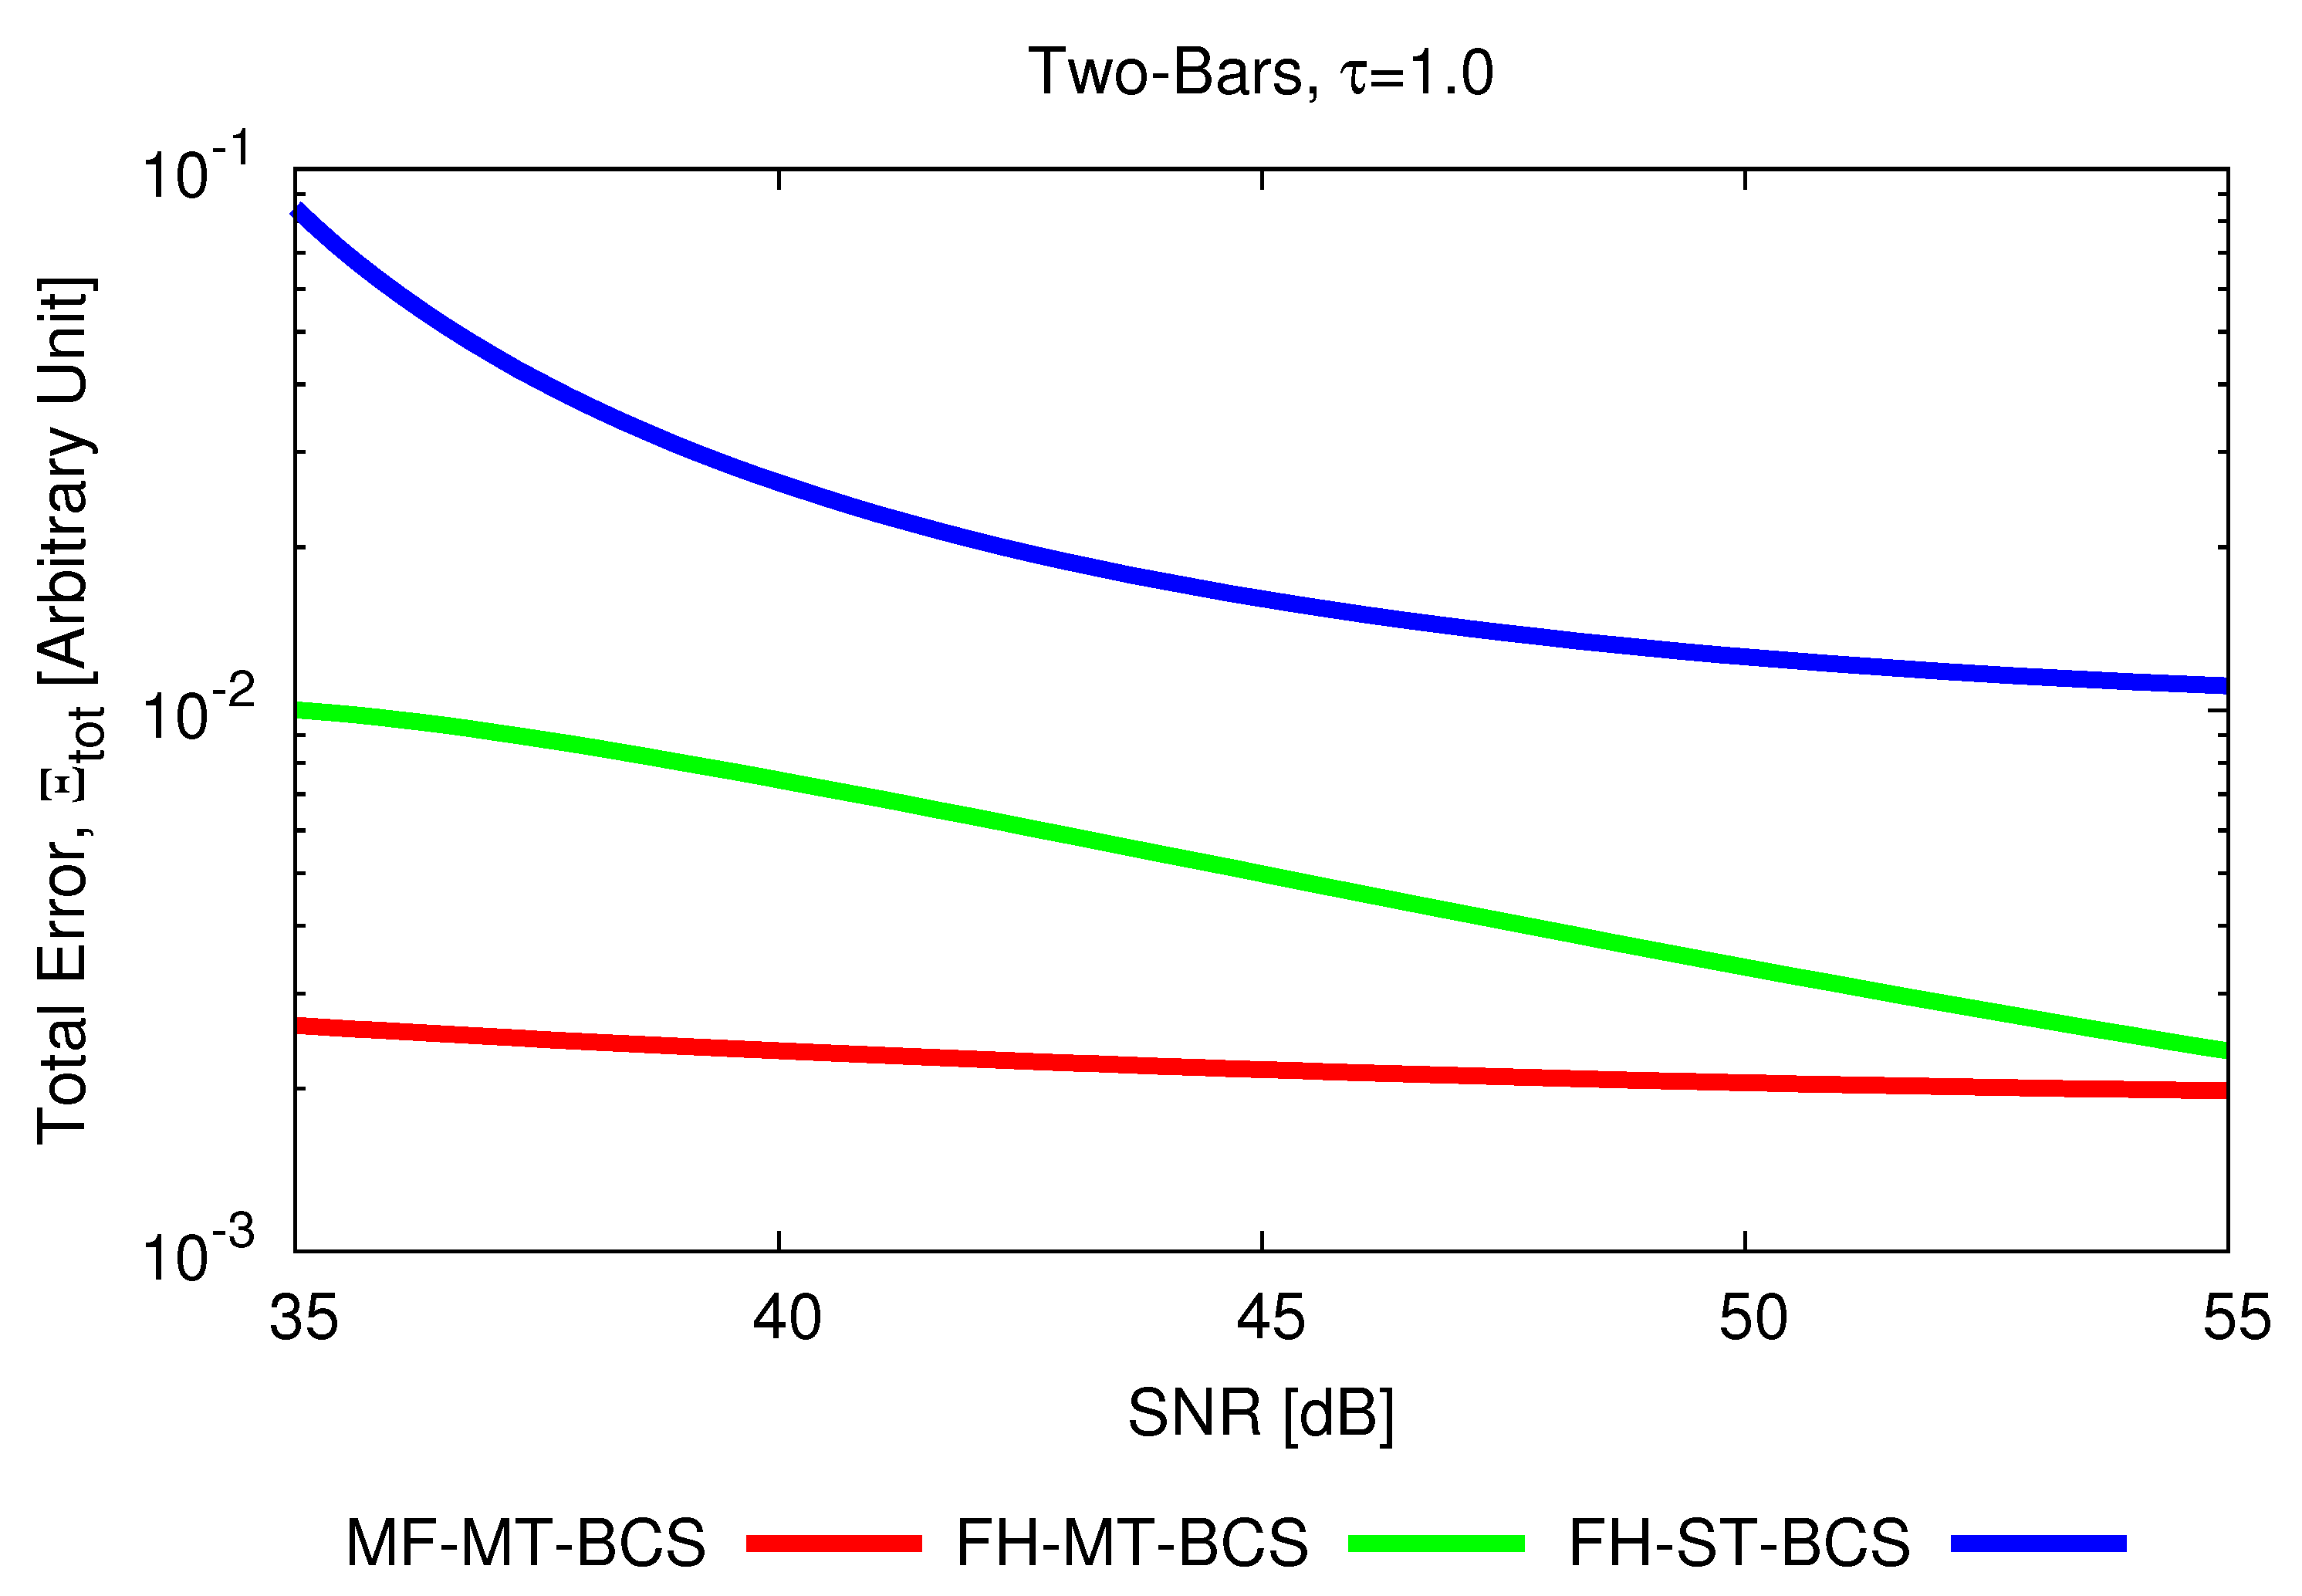
To better point out the advantage of jointly processing all spectral components of the scattered field, as done by the proposed MF inversion scheme, the results of two FH-based state-of-art BCS solution strategies are reported in Figure 2 for comparison purposes. It is worthwhile to remind oneself that these methods process each p-th ( p = 1 , , P ) frequency in a cascaded fashion, from the lowest to the highest one, by either enforcing the correlation between multiple views ( L = V tasks—FH-MT-BCS method [6]) or considering each view as a single task ( L = 1 FH-ST-BCS method [6]). As it can be observed, the MF-MT-BCS outperforms both FH strategies, the worst inversion being performed by the FH-ST-BCS (Figure 2f,g). Such outcomes are quantitatively confirmed by the values of the total error, Ξ t o t , reported in Figure 3 versus the SNR. The MF-MT-BCS does not only provide the lowest errors, but it is also significantly more robust against the data noise since, for instance, Ξ t o t M F M T B C S S N R = 35 [ dB ] Ξ t o t F H M T B C S S N R = 35 [ dB ] = 2.5 × 10 1 (Figure 2e vs. Figure 2c) and Ξ t o t M F M T B C S S N R = 35 [ dB ] Ξ t o t F H S T B C S S N R = 35 [ dB ] = 3.0 × 10 2 (Figure 2g vs. Figure 2c) in the most critical working conditions (i.e., S N R = 35 dB on time-domain total field).
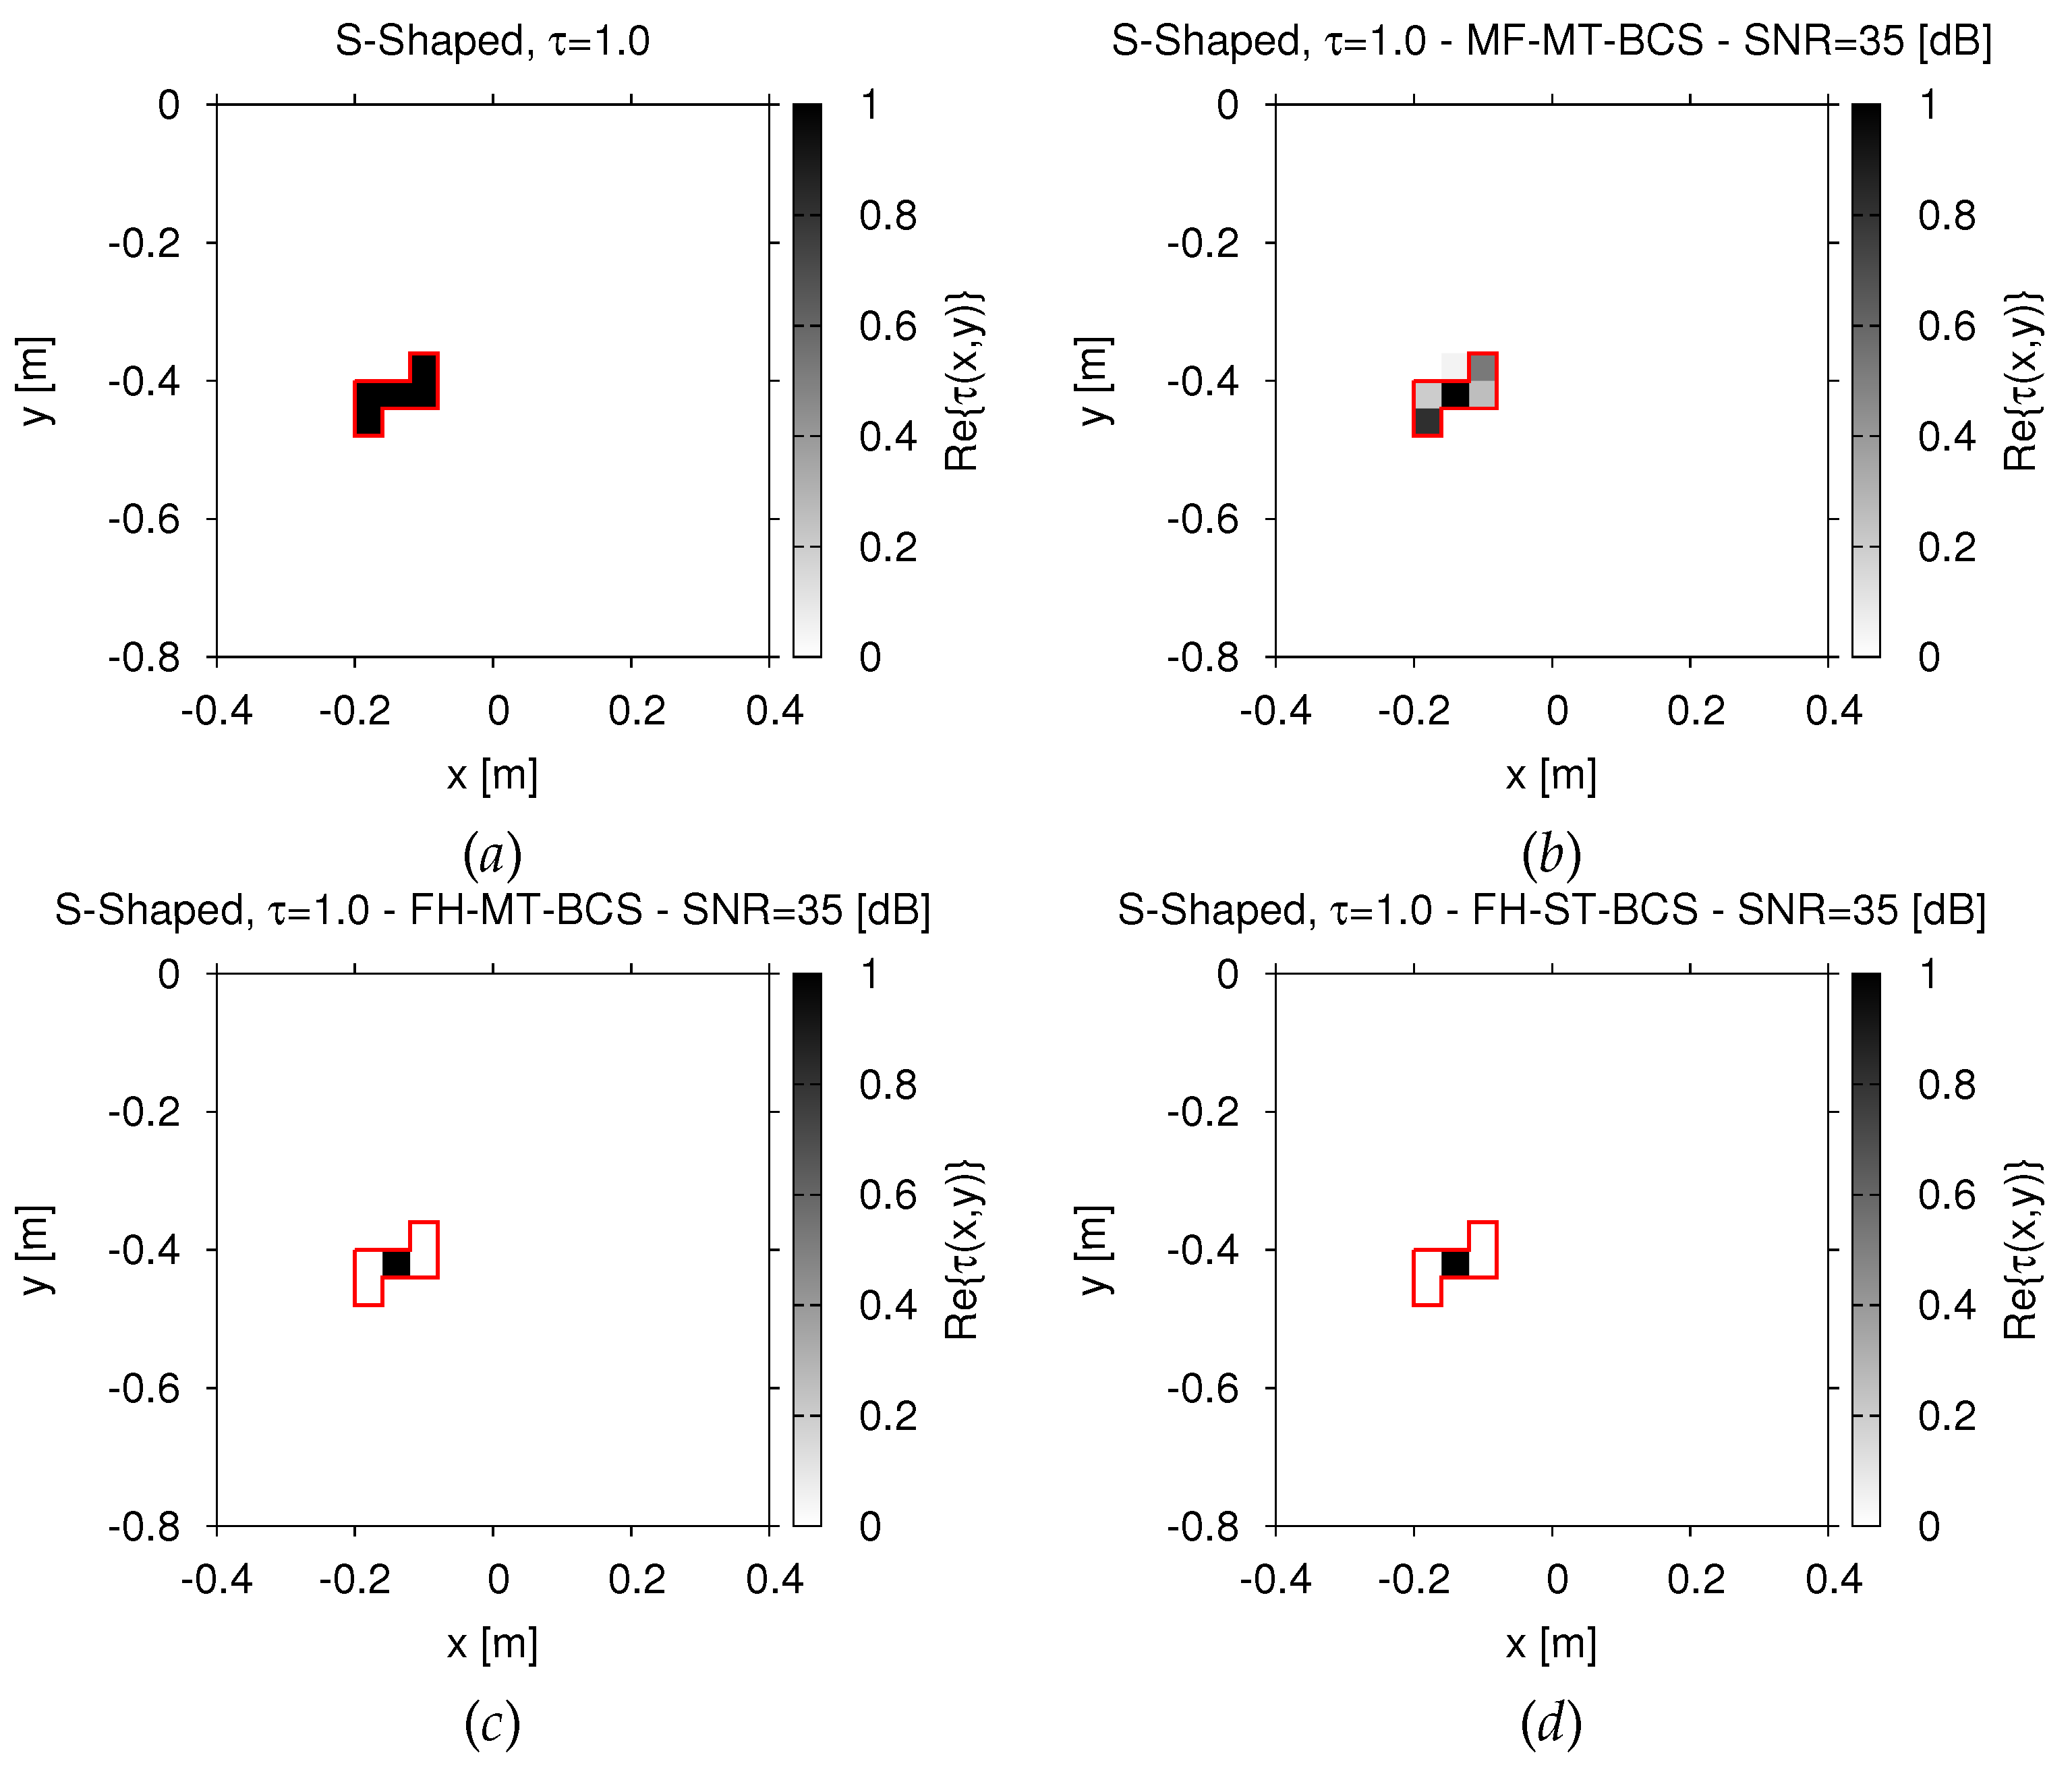
Similar conclusions can be drawn also when dealing with a more complex-shaped scatterer. As a matter of fact, the “S-shaped” object ( τ = 1.0 , Figure 4a) has been imaged by the MF-MT-BCS (Figure 4b vs. Figure 4a) remarkably better than the FH-MT-BCS (Figure 4c) and the FH-ST-BCS (Figure 4d), both FH methods failing in retrieving the actual support of the scatterer.
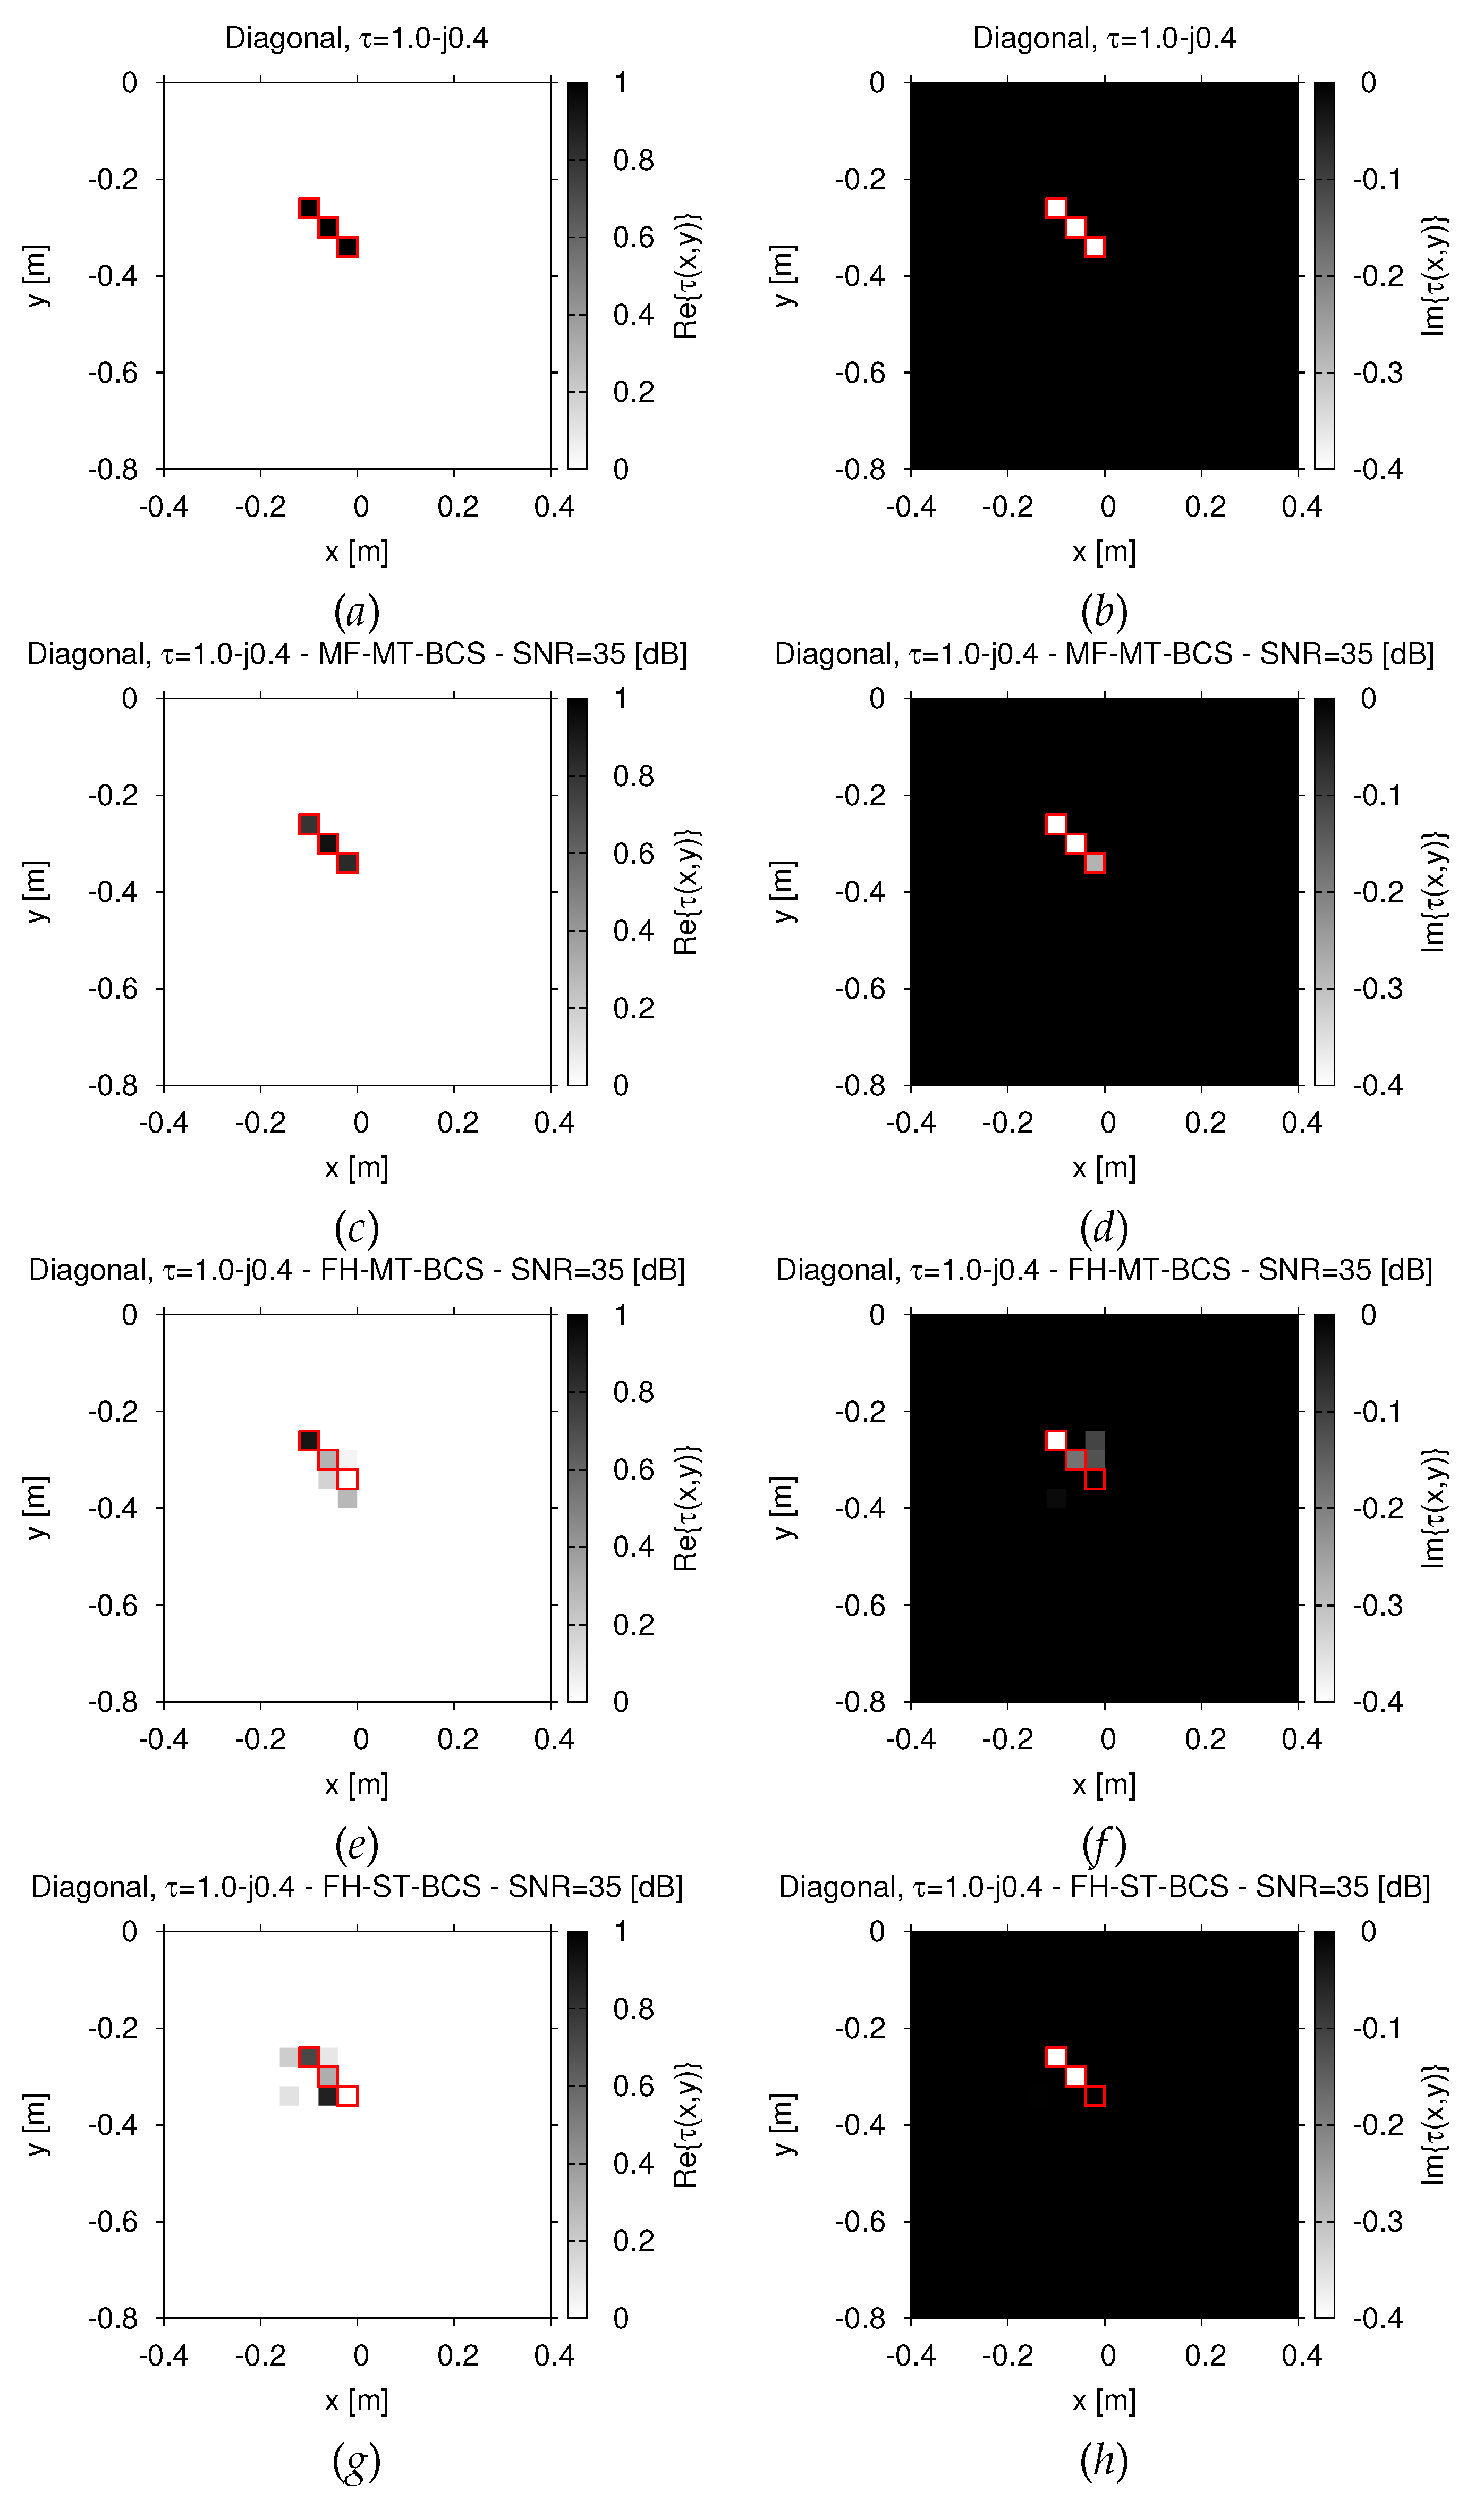
The MF-MT-BCS is more effective to recover objects with a higher conductivity than the hosting medium, as well. Indeed, despite the increased complexity due to the presence of a non-null imaginary part of the contrast and the non-negligible amount of noise, it is the only method able to provide an accurate guess of both the real part (Figure 5c vs. Figure 5a) and the imaginary one (Figure 5d vs. Figure 5b) of the “Diagonal” scatterer ( ε r = 5 , σ = 10 2 (S/m) ⇒ τ = 1.0 j 0.4 Figure 5a,b). In addition to the pictorial representations in Figure 5, the performance of each inversion method have been quantified in terms of the total, the internal (i.e., within the target support), and the external (i.e., in the background) errors [9], the corresponding values being reported in Table 1. Finally, it is worth pointing out the higher efficiency exhibited by the MF-MT-BCS thanks to the “one-shot” inversion of all P frequency components of the GPR spectrum. As a representative example, let us consider that the reduction in the inversion time on a standard laptop with Intel(R) Core(TM) i5-8250U CPU @ 1.60GHz and 16 (GB) of RAM memory amounts to Δ t F H M T B C S Δ t M F M T B C S = 22.1 and Δ t F H S T B C S Δ t M F M T B C S = 85.8 , respectively (Table 1).
Having assessed the superior performance of the MT-MT-BCS over the two FH-based methods, the last set of numerical benchmarks is aimed at verifying the robustness of the proposed IS strategy when taking into account the effects of soil inhomogeneity and non-planar air–soil interfaces.
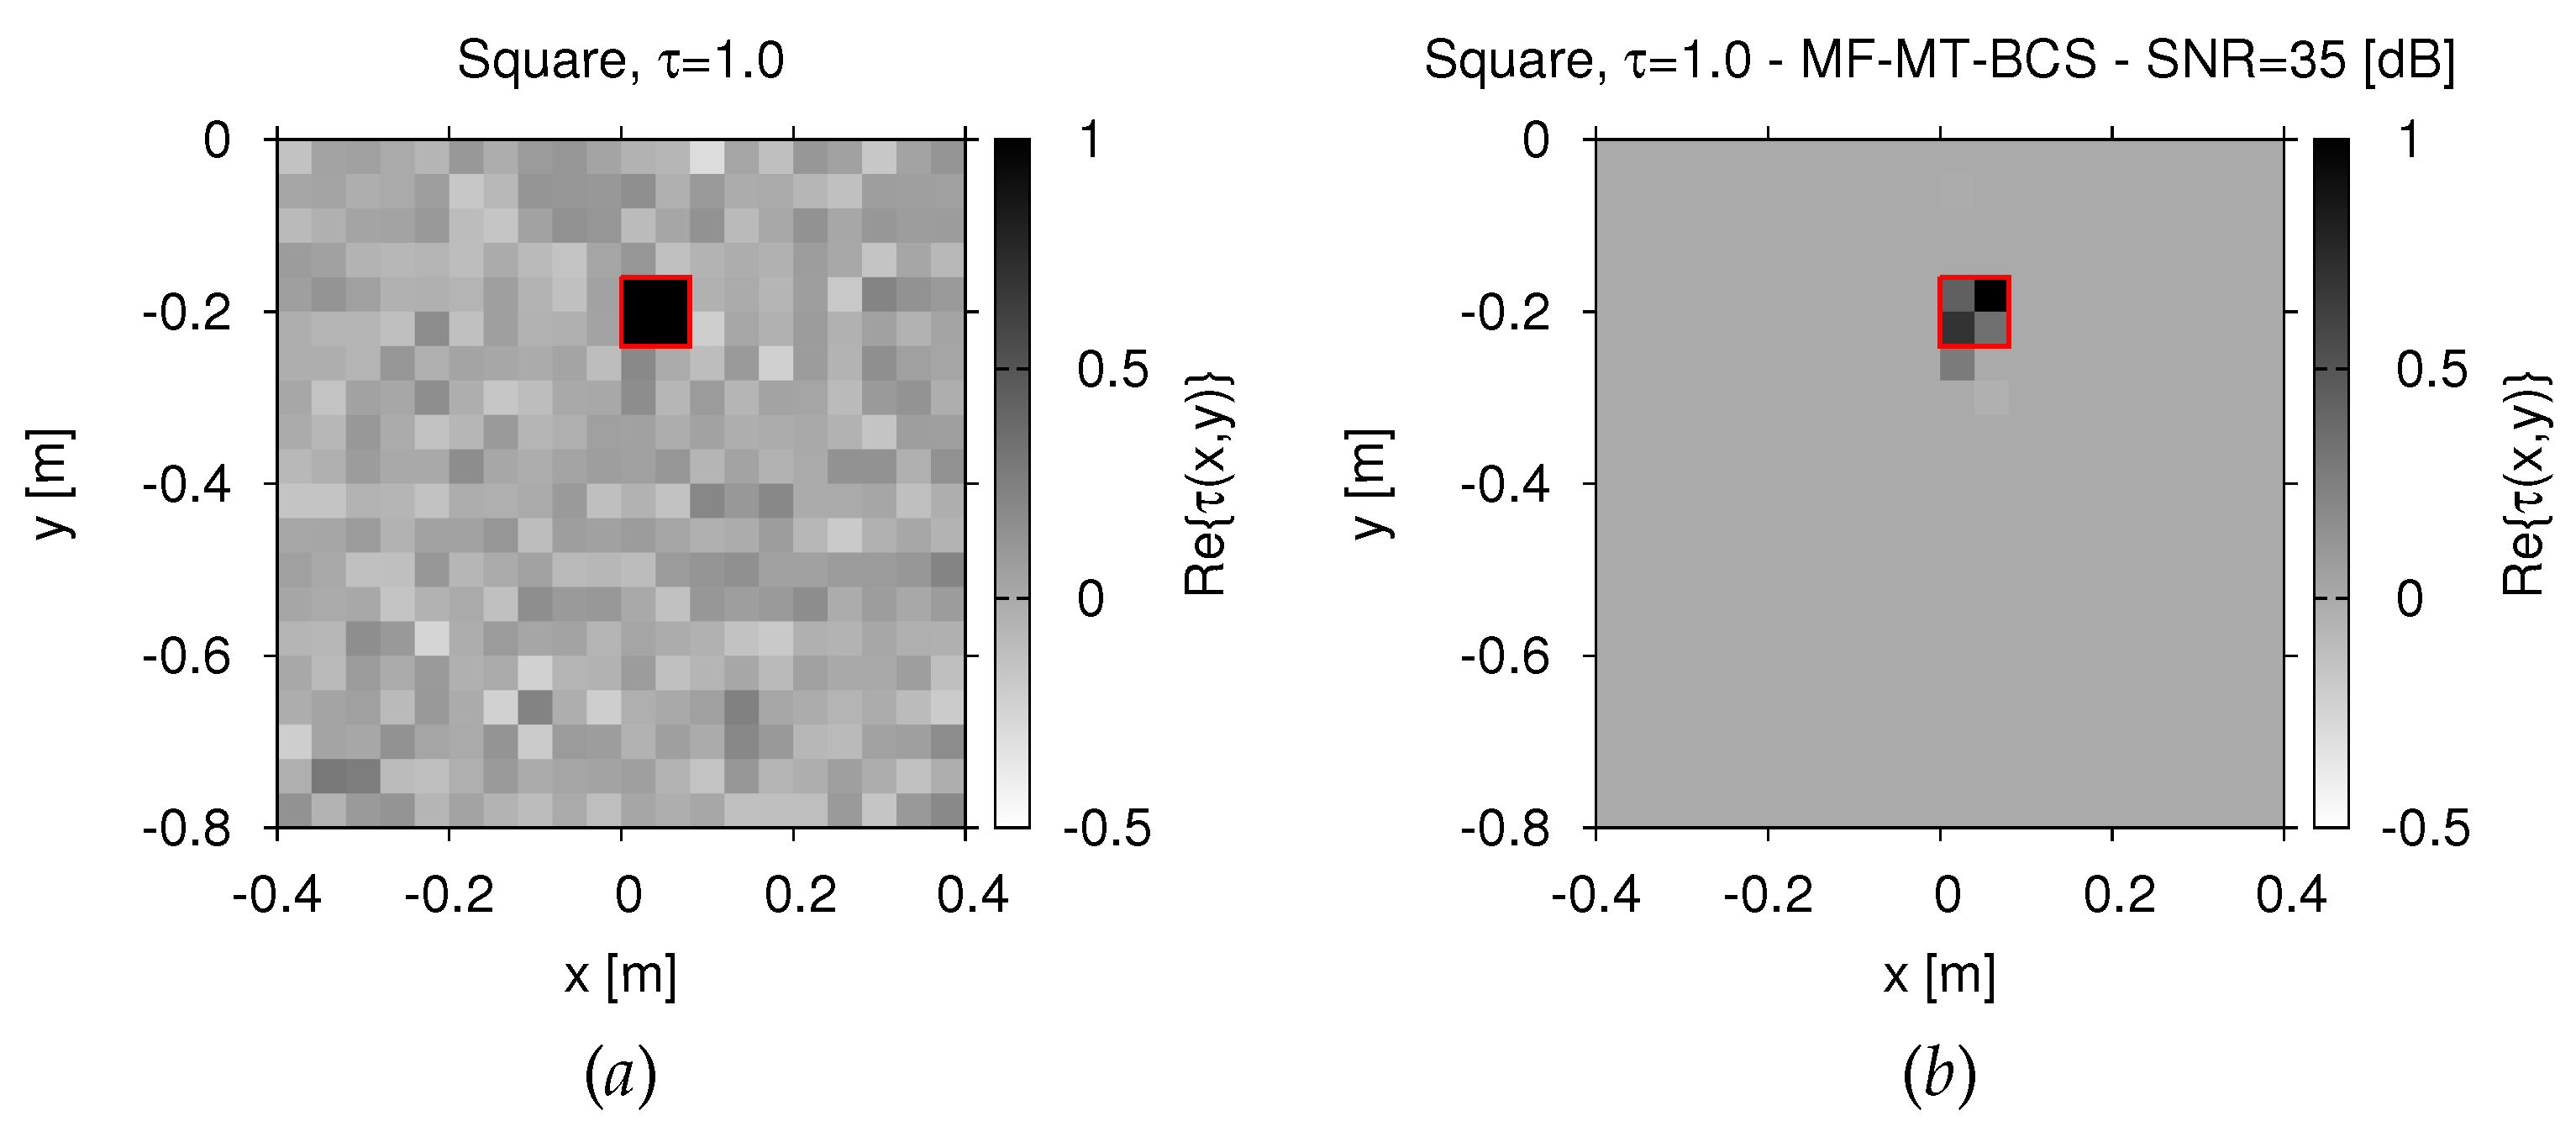
Towards this end, a square-shaped target with τ = 1.0 has been imaged when considering a uniform random perturbation of the soil permittivity within the range ε r s 3.5 , 4.5 , as shown in Figure 6a. Despite the higher complexity of the problem at hand and the non-negligible amount of noise on measurements, the retrieved contrast distribution in Figure 6a indicates that the MF-MT-BCS is capable of retrieving the unknown target with a remarkable accuracy, as also quantitatively verified by the computed internal error ( Ξ i n t = 2.17 × 10 1 ).
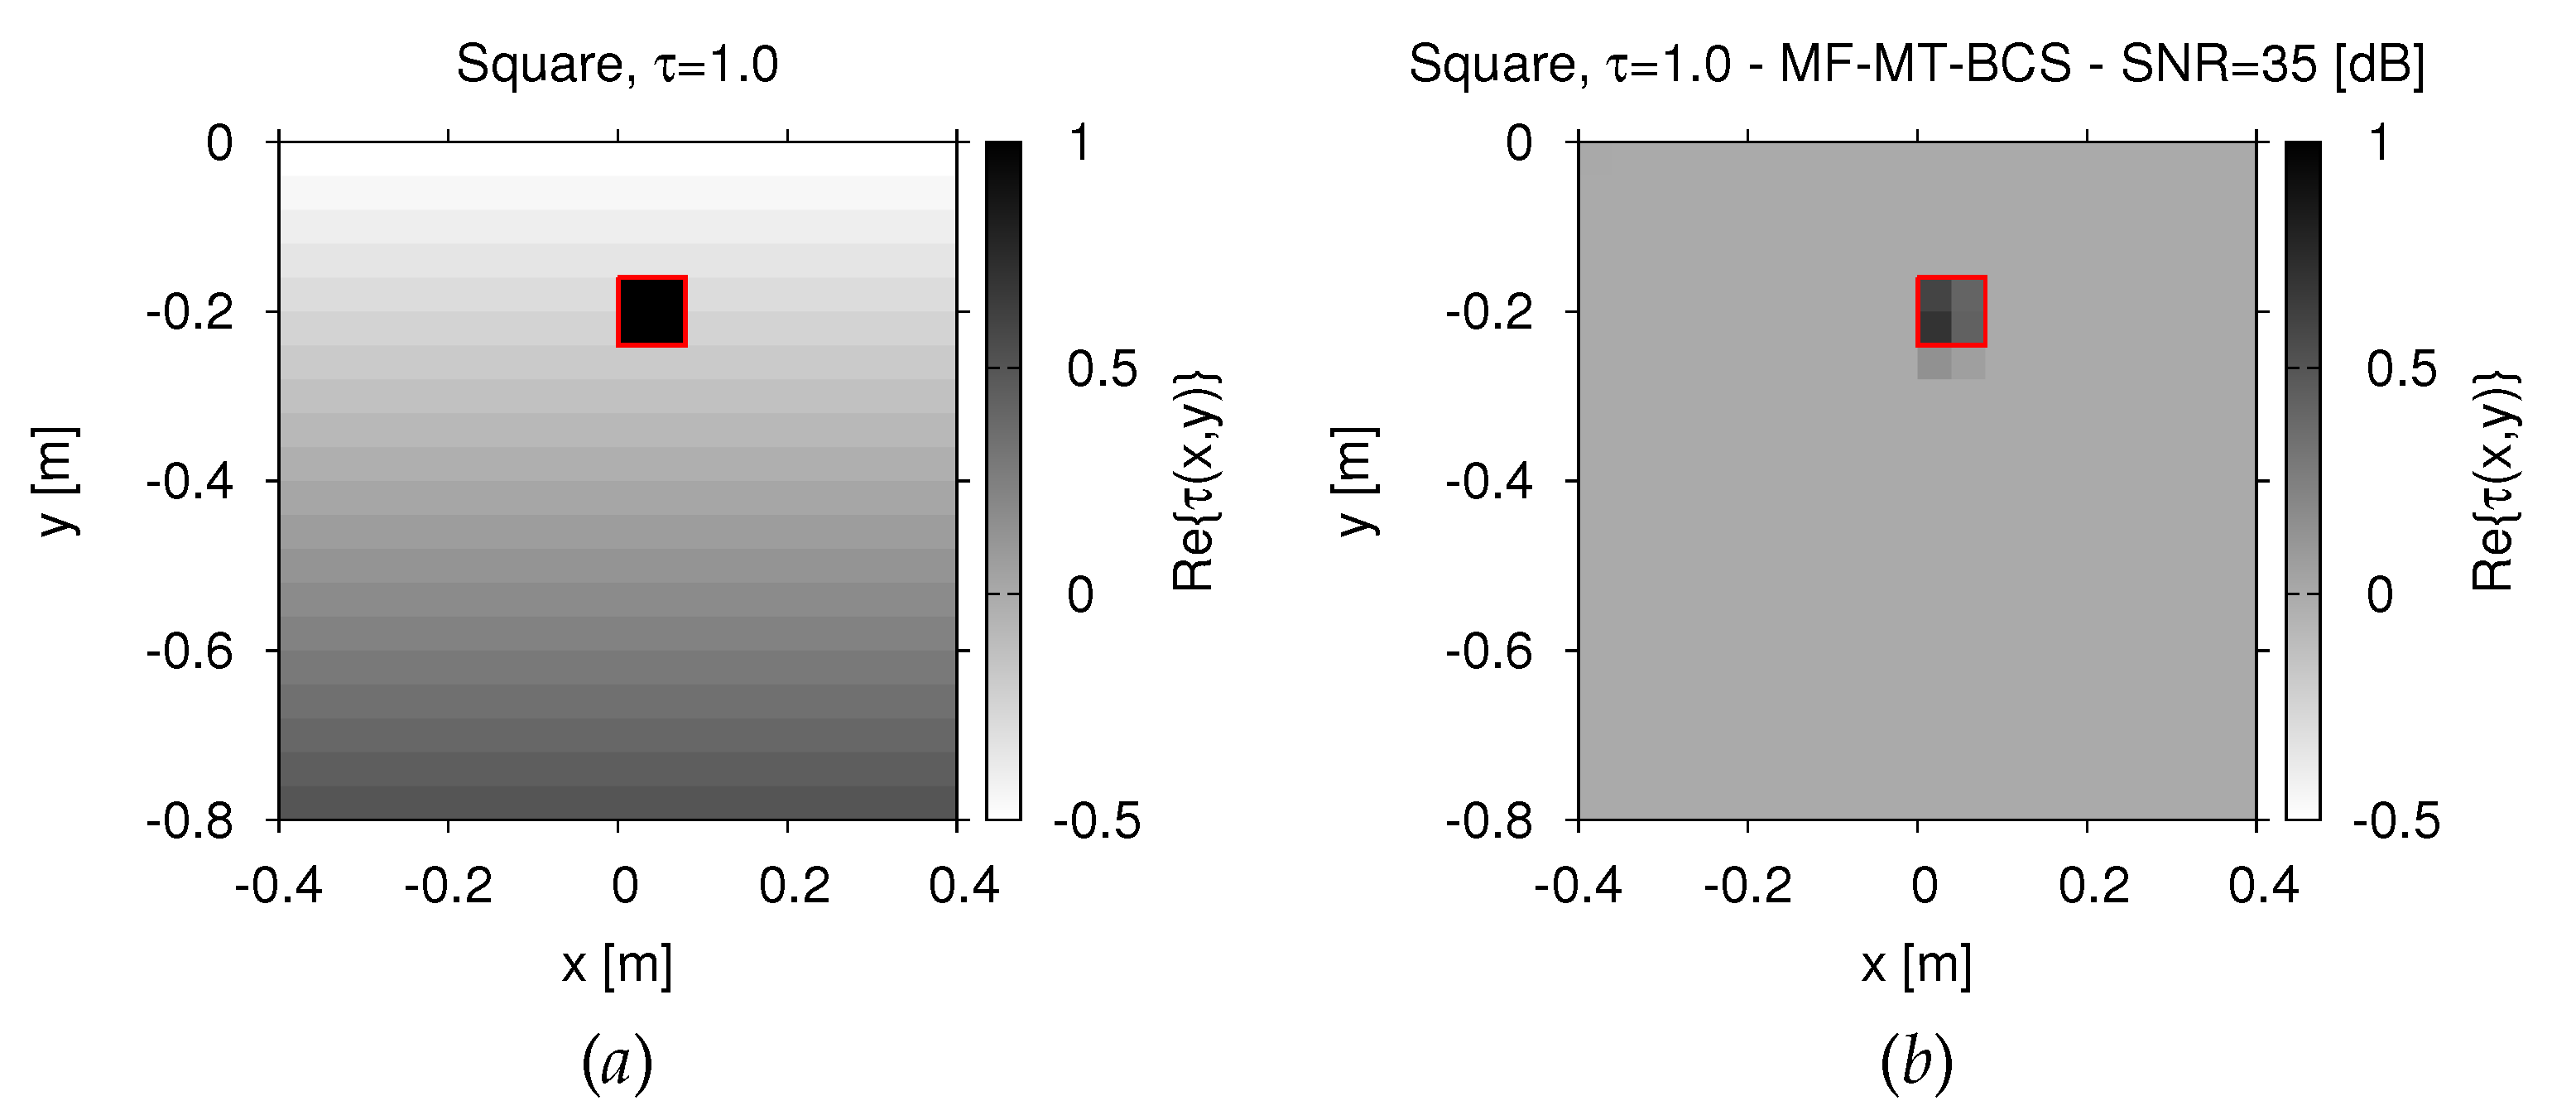
Similar outcomes are obtainable also when dealing with a smoothly-varying background medium [7], as shown in Figure 7a. As a matter of fact, the plot of the retrieved dielectric profile in Figure 7b indicates that the performance of the MF-MT-BCS is not jeopardized in such operative conditions, with Ξ i n t = 2.33 × 10 1 .
The MF-MT-BCS exhibits a high robustness also when the air–soil interface is not planar as in previous test cases. To prove it, let us consider in the following the subsurface scattering scenario depicted in Figure 8a, where random perturbations of the air–soil interface have been considered when imaging an investigation domain D buried at a depth of d = 0.1 m. Regardless of the presence of the non-planar interface (not modeled by the considered half-space Green’s operator used in the inversion [1]), a highly accurate guess of the actual target has been yielded by the MF-MT-BCS ( Ξ i n t = 1.88 × 10 1 Figure 8c vs. Figure 8b).

4. Conclusions

A novel sparsity-promoting strategy has been proposed to effectively solve the 2D GPR-MI problem. Thanks to the adopted MF strategy, the MF-MT-BCS method allows a computationally-efficient exploitation of the frequency-diversity of the GPR data by correlating all the multi-chromatic components extracted from the measured radargrams. As a result, it outperforms available FH-based solution strategies formulated within the BCS framework by exhibiting remarkably higher accuracy, robustness, and computational efficiency. It is worth pointing out that the main assumption for the successful application of the proposed method is that the unknown targets are intrinsically sparse (i.e., they are small-sized with respect to the investigation domain D or, in other words, their support occupies a low percentage of total number of pixels, N). However, depending on the targeted application, such a limitation can be easily overcome by exploiting other (i.e., non-pixel) representations allowing to represent the problem unknowns with few non-null expansion coefficients and thus enabling a proficient application of the CS paradigm [21].

Author Contributions

Conceptualization, M.S. and N.A.; methodology, M.S. and N.A.; software, M.S. and N.A.; validation, M.S. and N.A.; formal analysis, M.S. and N.A.; investigation, M.S. and N.A.; resources, M.S. and N.A.; data curation, M.S. and N.A.; writing—original draft preparation, M.S. and N.A.; writing—review and editing, M.S. and N.A.; visualization, M.S. and N.A.; supervision, M.S. and N.A.. All authors have read and agreed to the published version of the manuscript.

Funding

This research received no external funding.

Institutional Review Board Statement

Not applicable.

Informed Consent Statement

Not applicable.

Data Availability Statement

Not applicable.

Acknowledgments

This work benefited from the networking activities carried out within the Project “CYBER-PHYSICAL ELECTROMAGNETIC VISION: Context-Aware Electromagnetic Sensing and Smart Reaction (EMvisioning)” (Grant No. 2017HZJXSZ) funded by the Italian Ministry of Education, University, and Research within the PRIN2017 Program (CUP: E64I19002530001), the Project “SMARTOUR—Piattaforma Intelligente per il Turismo” (Grant No. SCN_00166) funded by the Italian Ministry of Education, University, and Research within the Program “Smart cities and communities and Social Innovation” (CUP: E44G14000040008), and the Project “WATERTECH—Smart Community per lo Sviluppo e l’Applicazione di Tecnologie di Monitoraggio Innovative per le Reti di Distribuzione Idrica negli usi idropotabili ed agricoli” (Grant No. SCN_00489) funded by the Italian Ministry of Education, University, and Research within the Program “Smart cities and communities and Social Innovation” (CUP: E44G14000060008).

Conflicts of Interest

The authors declare no conflict of interest.

References

  1. Persico, R. Introduction to Ground Penetrating Radar: Inverse Scattering and Data Processing; Wiley-IEEE Press: London, UK, 2014. [Google Scholar]
  2. Baussard, A.; Miller, E.L.; Lesselier, D. Adaptive multiscale reconstruction of buried objects. Inverse Prob. 2004, 20, S1–S15. [Google Scholar] [CrossRef]
  3. Li, M.; Abubakar, A.; Habashy, T.M. Application of a two-and-half dimensional model-based algorithm to crosswell electromagnetic data inversion. Inverse Prob. 2010, 26, 074013. [Google Scholar] [CrossRef]
  4. Abubakar, A.; Habashy, T.M.; Li, M.; Liu, J. Inversion algorithm for large-scale geophysical electromagnetic measurements. Inverse Prob. 2009, 25, 123012. [Google Scholar] [CrossRef]
  5. Meincke, P. Linear GPR inversion for lossy soil and a planar air-soil interface. IEEE Trans. Geosci. Remote Sens. 2001, 39, 2713–2721. [Google Scholar] [CrossRef]
  6. Salucci, M.; Gelmini, A.; Poli, L.; Oliveri, G.; Massa, A. Progressive compressive sensing for exploiting frequency-diversity in GPR imaging. J. Electromagn. Waves Appl. 2018, 32, 1164–1193. [Google Scholar] [CrossRef]
  7. Salucci, M.; Oliveri, G.; Massa, A. GPR prospecting through an inverse scattering frequency-hopping multi-focusing approach. IEEE Trans. Geosci. Remote Sens. 2015, 53, 6573–6592. [Google Scholar] [CrossRef]
  8. Salucci, M.; Poli, L.; Anselmi, N.; Massa, A. Multifrequency particle swarm optimization for enhanced multiresolution GPR microwave imaging. IEEE Trans. Geosci. Remote Sens. 2017, 55, 1305–1317. [Google Scholar] [CrossRef]
  9. Salucci, M.; Estatico, C.; Fedeli, A.; Oliveri, G.; Pastorino, M.; Povoli, S.; Randazzo, A.; Rocca, P. 2D TM GPR imaging through a multi-scaling multi-frequency approach in Lp-spaces. IEEE Trans. Geosci. Remote Sens. 2021. [Google Scholar] [CrossRef]
  10. Chen, X. Computational Methods for Electromagnetic Inverse Scattering; Wiley: Hoboken, NJ, USA, 2018. [Google Scholar]
  11. Massa, A.; Rocca, P.; Oliveri, G. Compressive sensing in electromagnetics—A review. IEEE Antennas Propag. Mag. 2015, 57, 224–238. [Google Scholar] [CrossRef]
  12. Ambrosanio, M.; Pascazio, V. A compressive-sensing-based approach for the detection and characterization of buried objects. IEEE J Selected Top. Appl. Earth Observ. Remote Sens. 2015, 8, 3386–3395. [Google Scholar] [CrossRef]
  13. Sun, Y.; Qu, L.; Zhang, S.; Yin, Y. MT-BCS-based two-dimensional diffraction tomographic GPR imaging algorithm with multiview-multistatic configuration. IEEE Geosci. Remote Sens. Lett. 2016, 13, 831–835. [Google Scholar] [CrossRef]
  14. Ji, S.; Dunson, D.; Carin, L. Multitask compressive sensing. IEEE Trans. Signal Process. 2009, 57, 92–106. [Google Scholar] [CrossRef]
  15. Gurbuz, A.C.; McClellan, J.H.; Scott, W.R. A compressive sensing data acquisition and imaging method for stepped frequency GPRs. IEEE Trans. Signal Process. 2009, 57, 2640–2650. [Google Scholar] [CrossRef]
  16. Tuncer, M.A.C.; Gurbuz, A.C. Ground reflection removal in compressive sensing ground penetrating radars. IEEE Geosci. Remote Sens. Lett. 2012, 9, 23–27. [Google Scholar] [CrossRef]
  17. Qu, L.; Yang, T. Investigation of air/ground reflection and antenna beamwidth for compressive sensing SFCW GPR migration imaging. IEEE Trans. Geosci. Remote Sens. 2012, 50, 3143–3149. [Google Scholar] [CrossRef]
  18. Suksmono, A.B.; Bharata, E.; Lestari, A.A.; Yarovoy, A.G.; Ligthart, L.P. Compressive stepped-frequency continuous-wave ground-penetrating radar. IEEE Geosci. Remote Sens. Lett. 2010, 7, 665–669. [Google Scholar] [CrossRef]
  19. Karlina, R.; Sato, M. Model-based Compressive Sensing applied to landmine detection by GPR. IEICE Trans. Electron. 2016, 99, 44–51. [Google Scholar] [CrossRef] [Green Version]
  20. Giannopoulos A, Modelling ground penetrating radar by GprMax. Constr. Build. Mater. 2005, 19, 755–762. [CrossRef]
  21. Anselmi, N.; Oliveri, G.; Hannan, M.A.; Salucci, M.; Massa, A. Color compressive sensing imaging of arbitrary-shaped scatterers. IEEE Trans. Microw. Theory Tech. 2017, 65, 1986–1999. [Google Scholar] [CrossRef] [Green Version]
Figure 1. Geometry of the 2D-TM GPR-MI problem.
Jimaging 07 00247 g001
Figure 2. Numerical assessment (“Two-BarsScatterer, τ = 1.0 , N = 400 )—Actual (a) and retrieved (bg) dielectric profile by (b,c) the MF-MT-BCS, (d,e) the FH-MT-BCS, and (f,g) the FH-ST-BCS when processing noisy data at (b,d,f) S N R = 50 dB and (c,e,g) S N R = 35 dB.
Jimaging 07 00247 g002
Figure 3. Numerical assessment (“Two-Bars” Scatterer, τ = 1.0 , N = 400 , S N R 35 , 55 dB)—Behavior of the total integral error as a function of the SNR on time-domain total field for the MF-MT-BCS, FH-MT-BCS, and FH-ST-BCS methods.
Jimaging 07 00247 g003
Figure 4. Numerical assessment (“S-ShapedScatterer, τ = 1.0 , N = 400 , S N R = 35 dB)—Actual (a) and retrieved (b,d) dielectric profile by (b) the MF-MT-BCS, (c) the FH-MT-BCS, and (d) the FH-ST-BCS.
Jimaging 07 00247 g004
Figure 5. Numerical assessment (“DiagonalScatterer, τ = 1.0 j 0.4 , N = 400 , S N R = 35 dB)—Actual (a,b) and retrieved (ch) real part (a,c,e,g) and imaginary part (b,d,f,h) of the contrast outputted by (c,d) the MF-MT-BCS, (e,f) the FH-MT-BCS, and (g,h) the FH-ST-BCS.
Jimaging 07 00247 g005
Figure 6. Numerical assessment (“Square-ShapedScatterer, τ = 1.0 , N = 400 , S N R = 35 dB)—Actual (a) and retrieved (b) dielectric profile by the MF-MT-BCS when considering a randomly-varying inhomogeneous soil permittivity.
Jimaging 07 00247 g006
Figure 7. Numerical assessment (“Square-ShapedScatterer, τ = 1.0 , N = 400 , S N R = 35 dB)—Actual (a) and retrieved (b) dielectric profile by the MF-MT-BCS when considering a smoothly-varying inhomogeneous soil.
Jimaging 07 00247 g007
Figure 8. Numerical assessment (“Square-ShapedScatterer, τ = 1.0 , N = 400 , S N R = 35 dB)—Imaging scenario (a) and actual (b) and retrieved (c) dielectric profile by the MF-MT-BCS when considering a non-planar air–soil interface.
Jimaging 07 00247 g008
Table 1. Numerical assessment (“DiagonalScatterer, τ = 1.0 j 0.4 , N = 400 , S N R = 35 dB)—Total, internal, and external reconstruction errors [9] and inversion time for the MF-MT-BCS, the FH-MT-BCS, and the FH-ST-BCS methods.
MF-MT-BCSFH-MT-BCSFH-ST-BCS
Ξ t o t 5.94 × 10 4 6.11 × 10 3 1.09 × 10 2
Ξ i n t 7.92 × 10 2 3.37 × 10 1 3.57 × 10 1
Ξ e x t 0.0 3.60 × 10 3 8.24 × 10 3
Δ t (s) 3.1 68.5 266
Publisher’s Note: MDPI stays neutral with regard to jurisdictional claims in published maps and institutional affiliations.