Understanding the Effects of Optimal Combination of Spectral Bands on Deep Learning Model Predictions: A Case Study Based on Permafrost Tundra Landform Mapping Using High Resolution Multispectral Satellite Imagery

 ,
, 

Abstract
1. Introduction
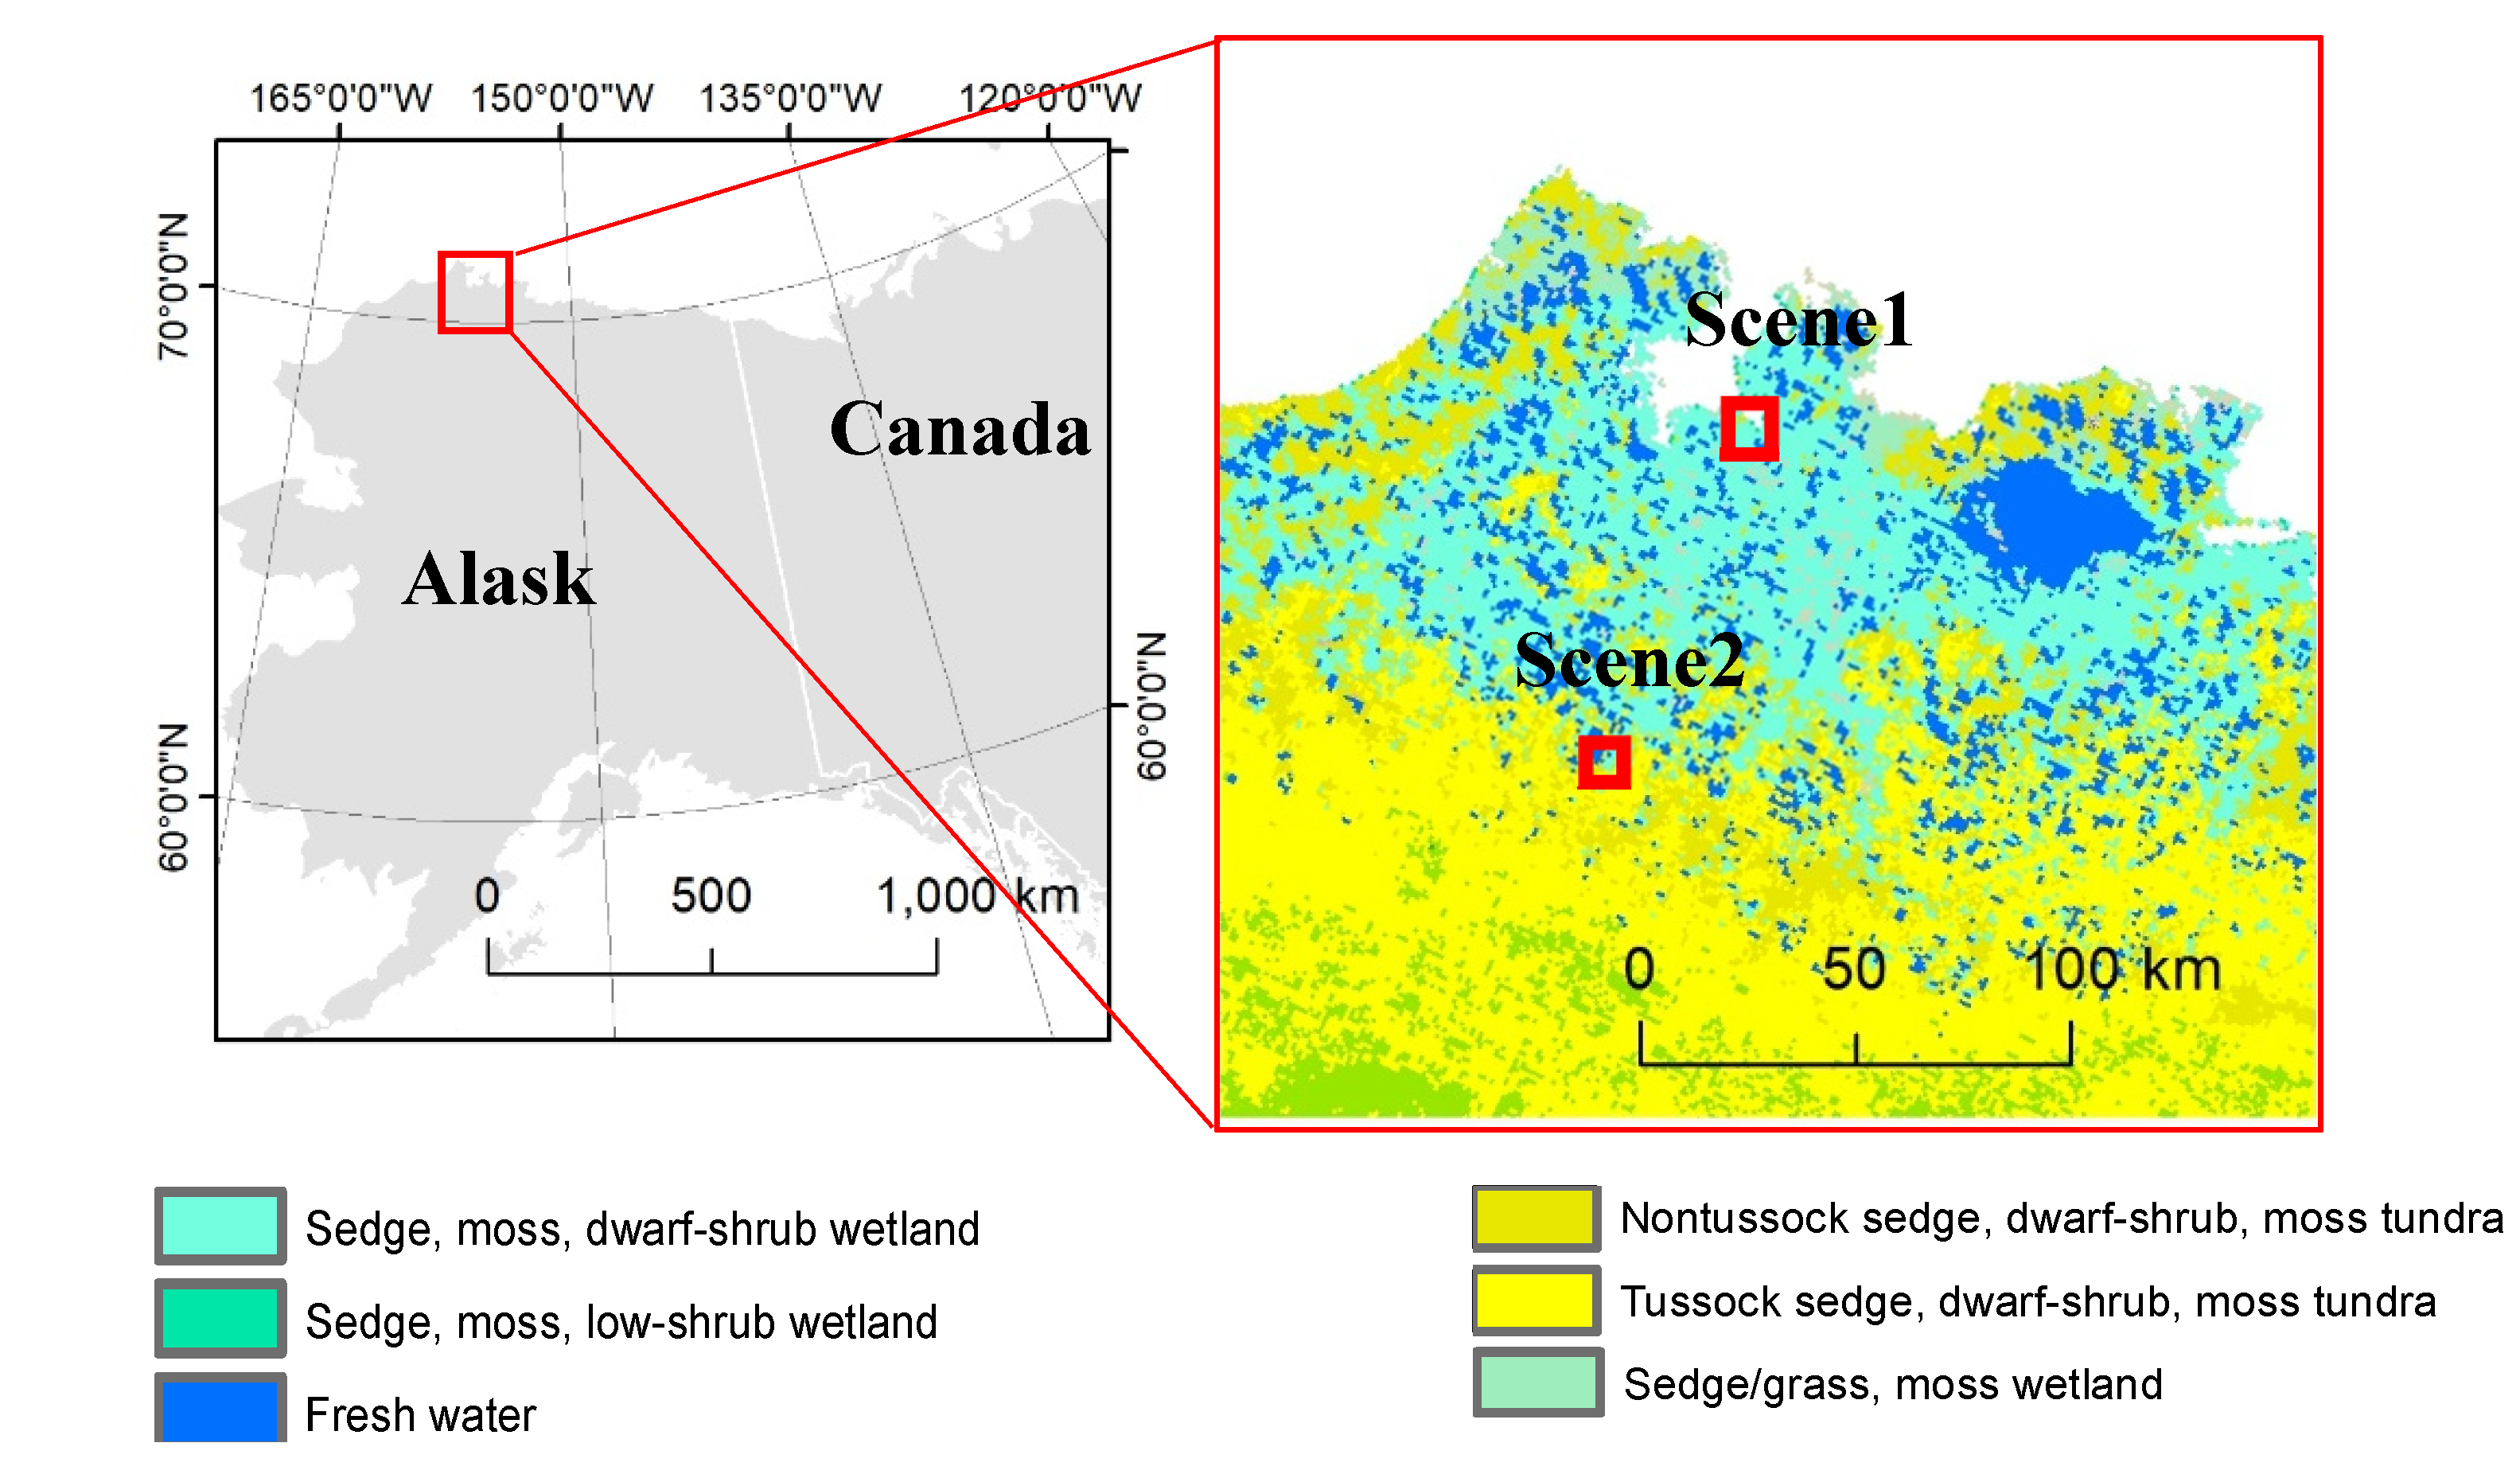
2. Study Area and Image Data
3. Methodology
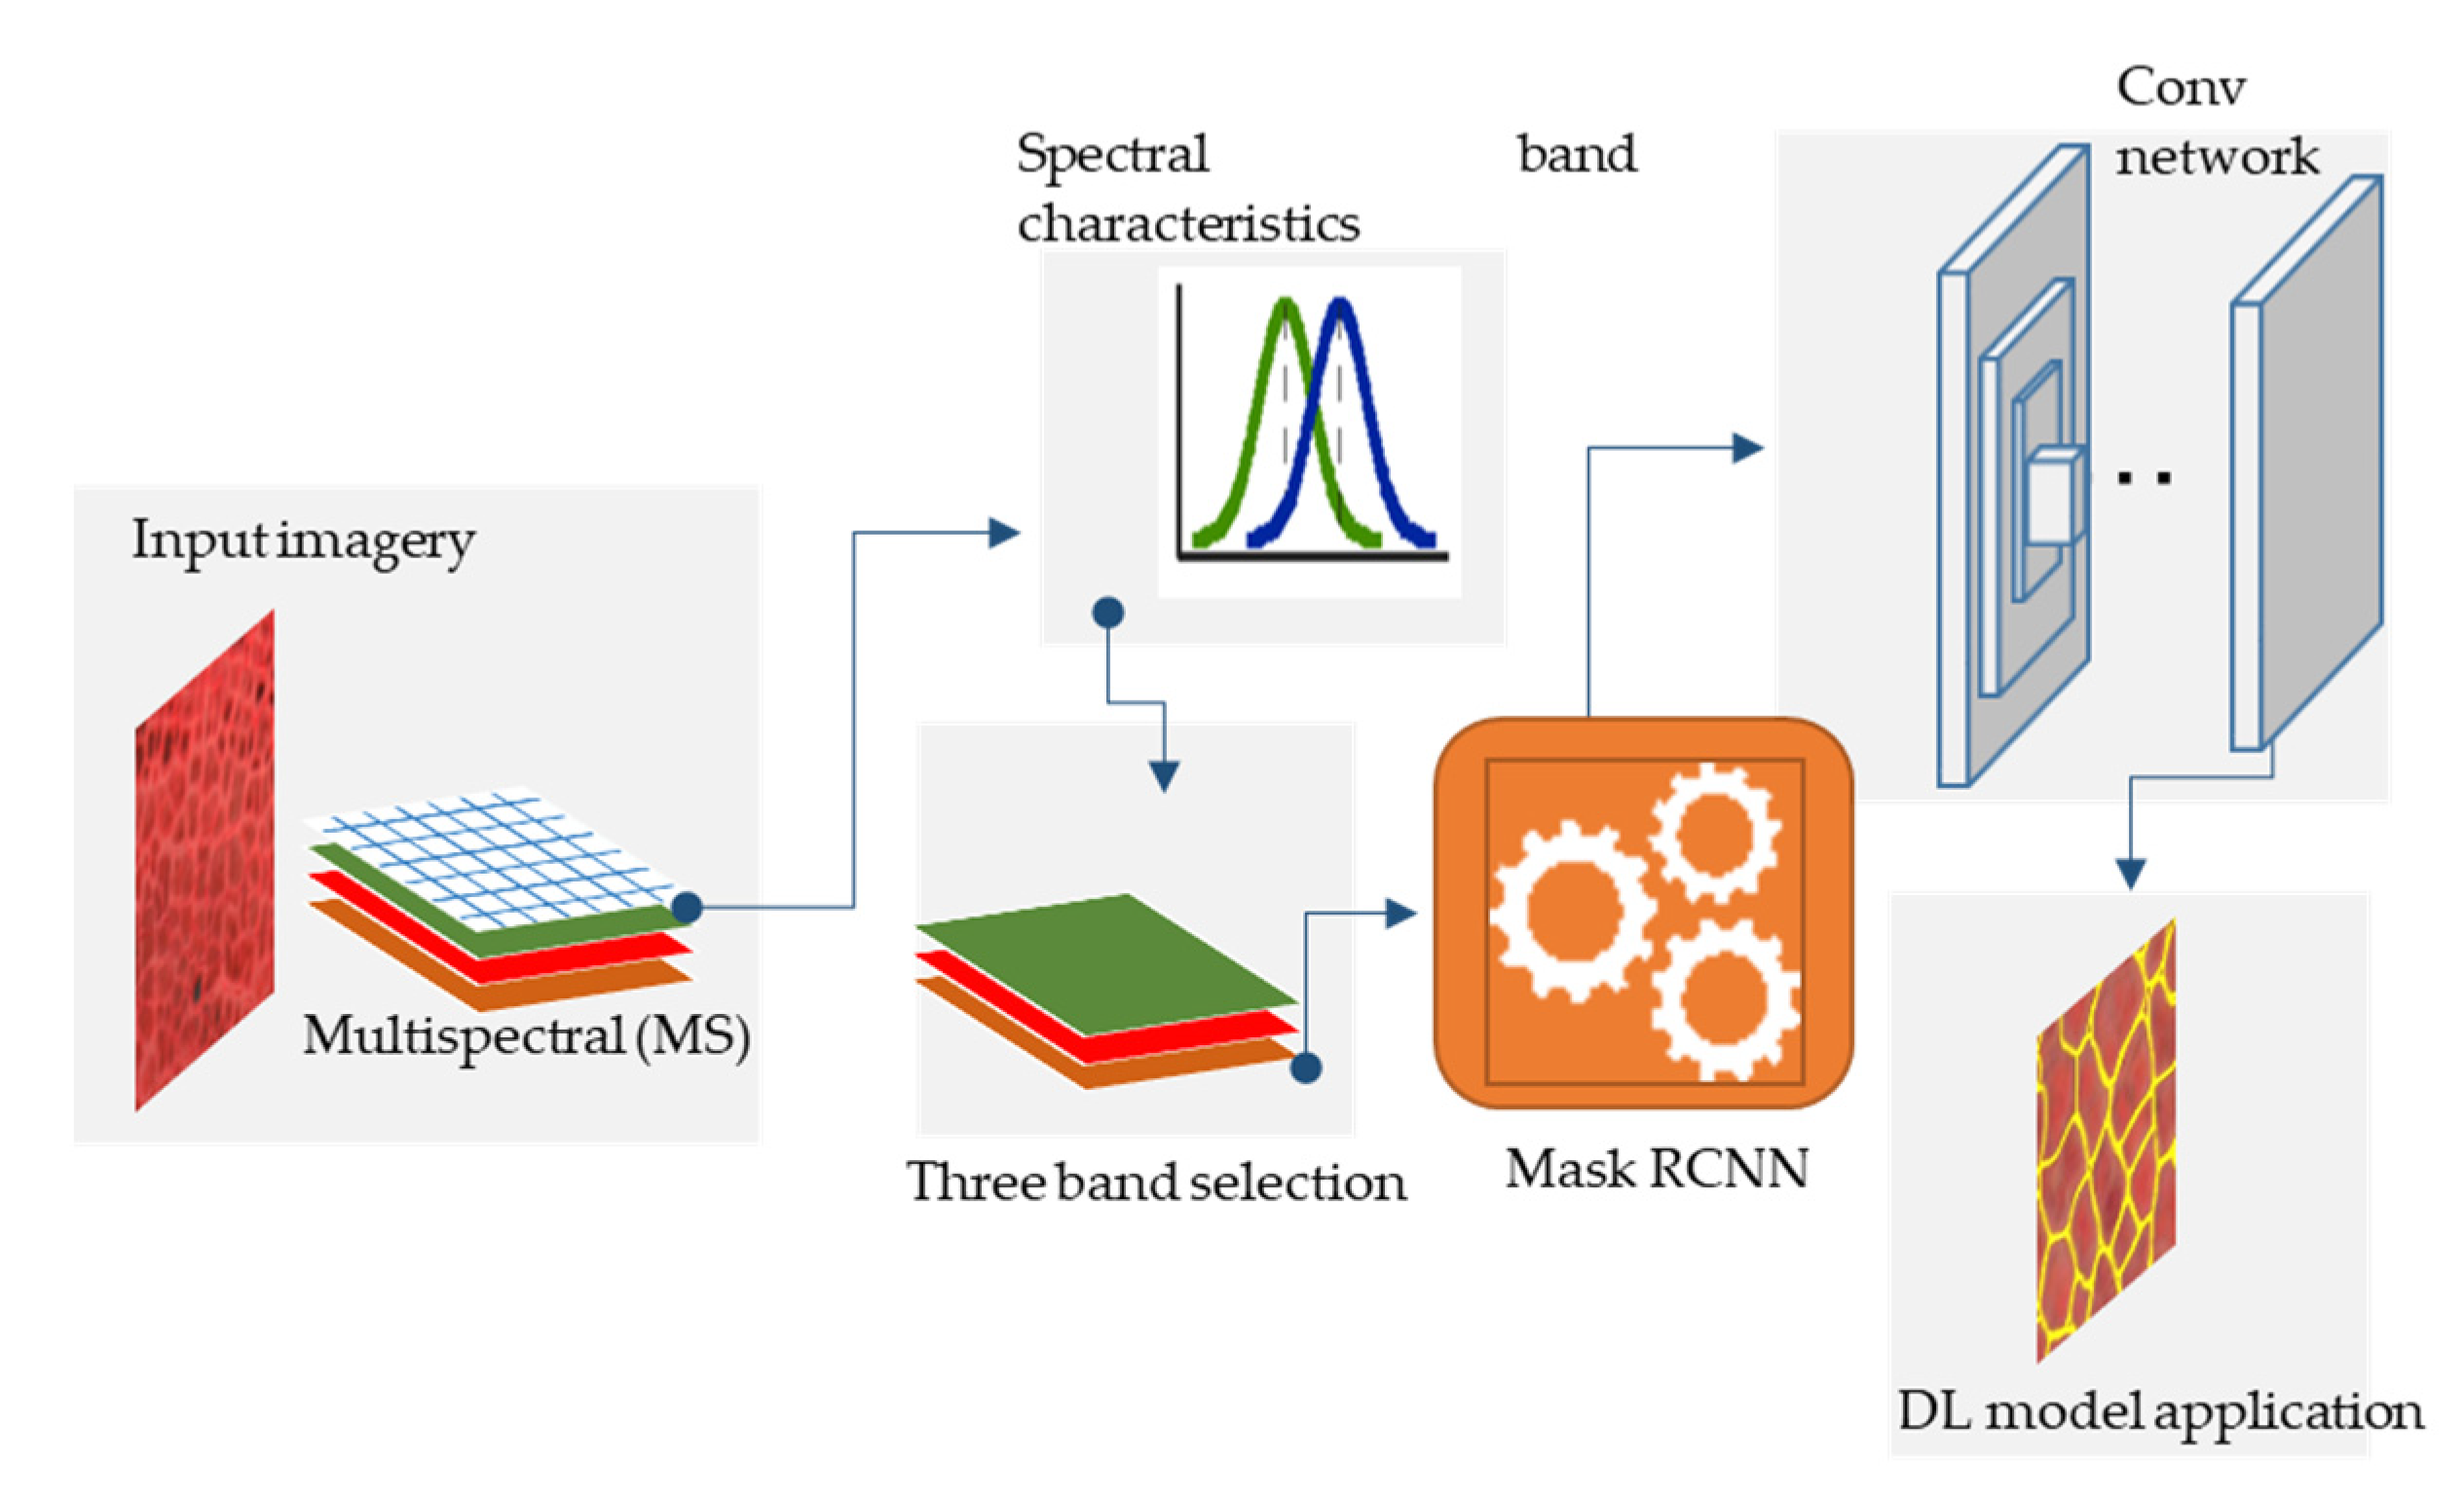
3.1. Mapping Workflow
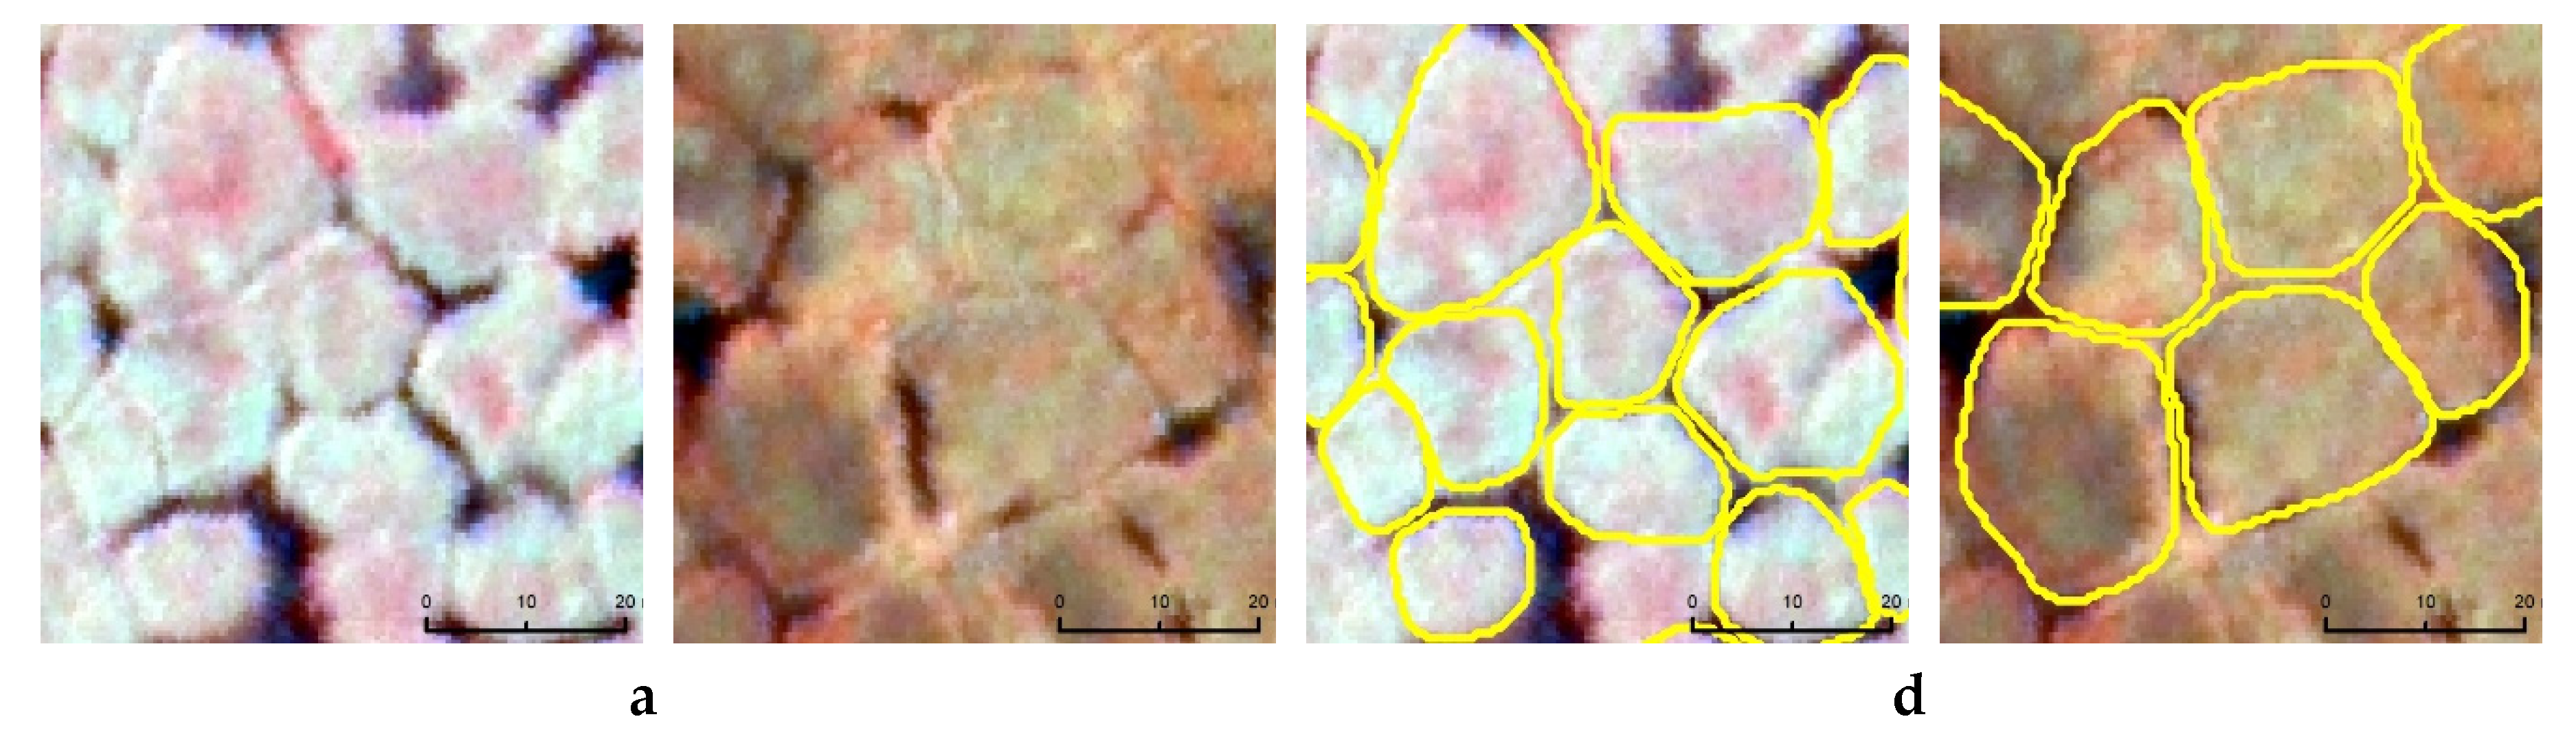
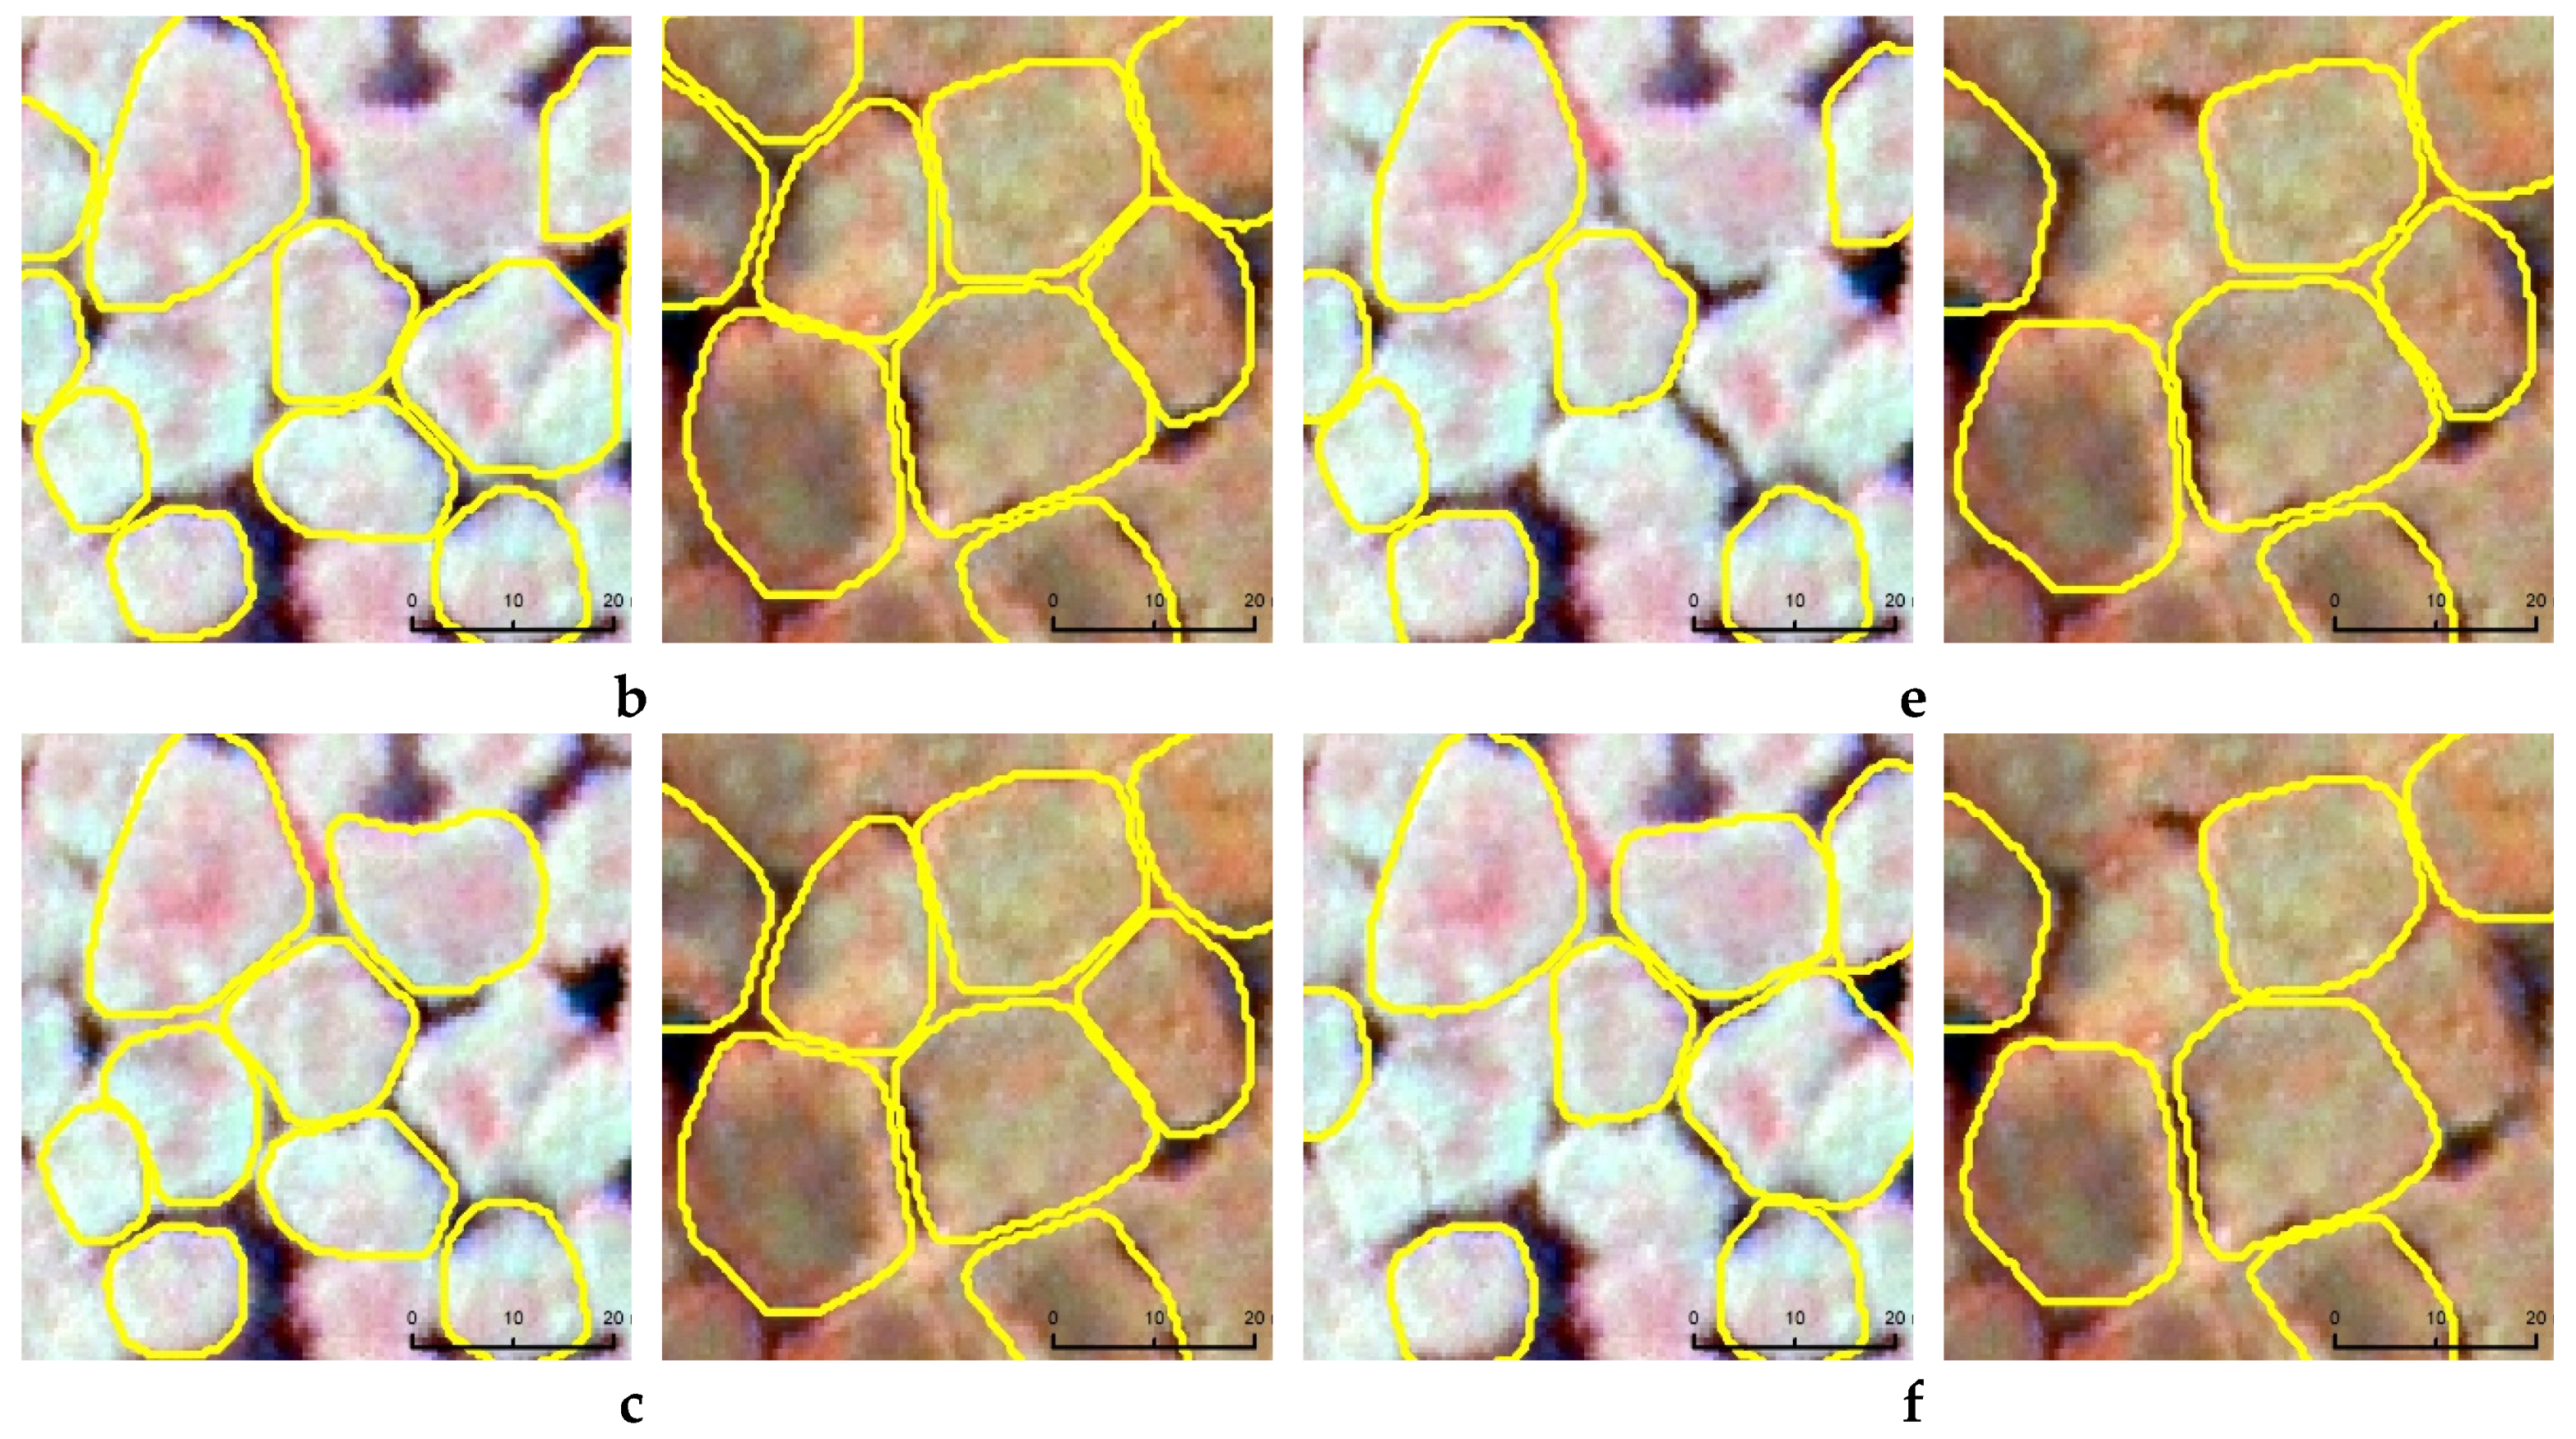
3.2. Accuracy Estimates for Model Prediction
4. Results and Discussion
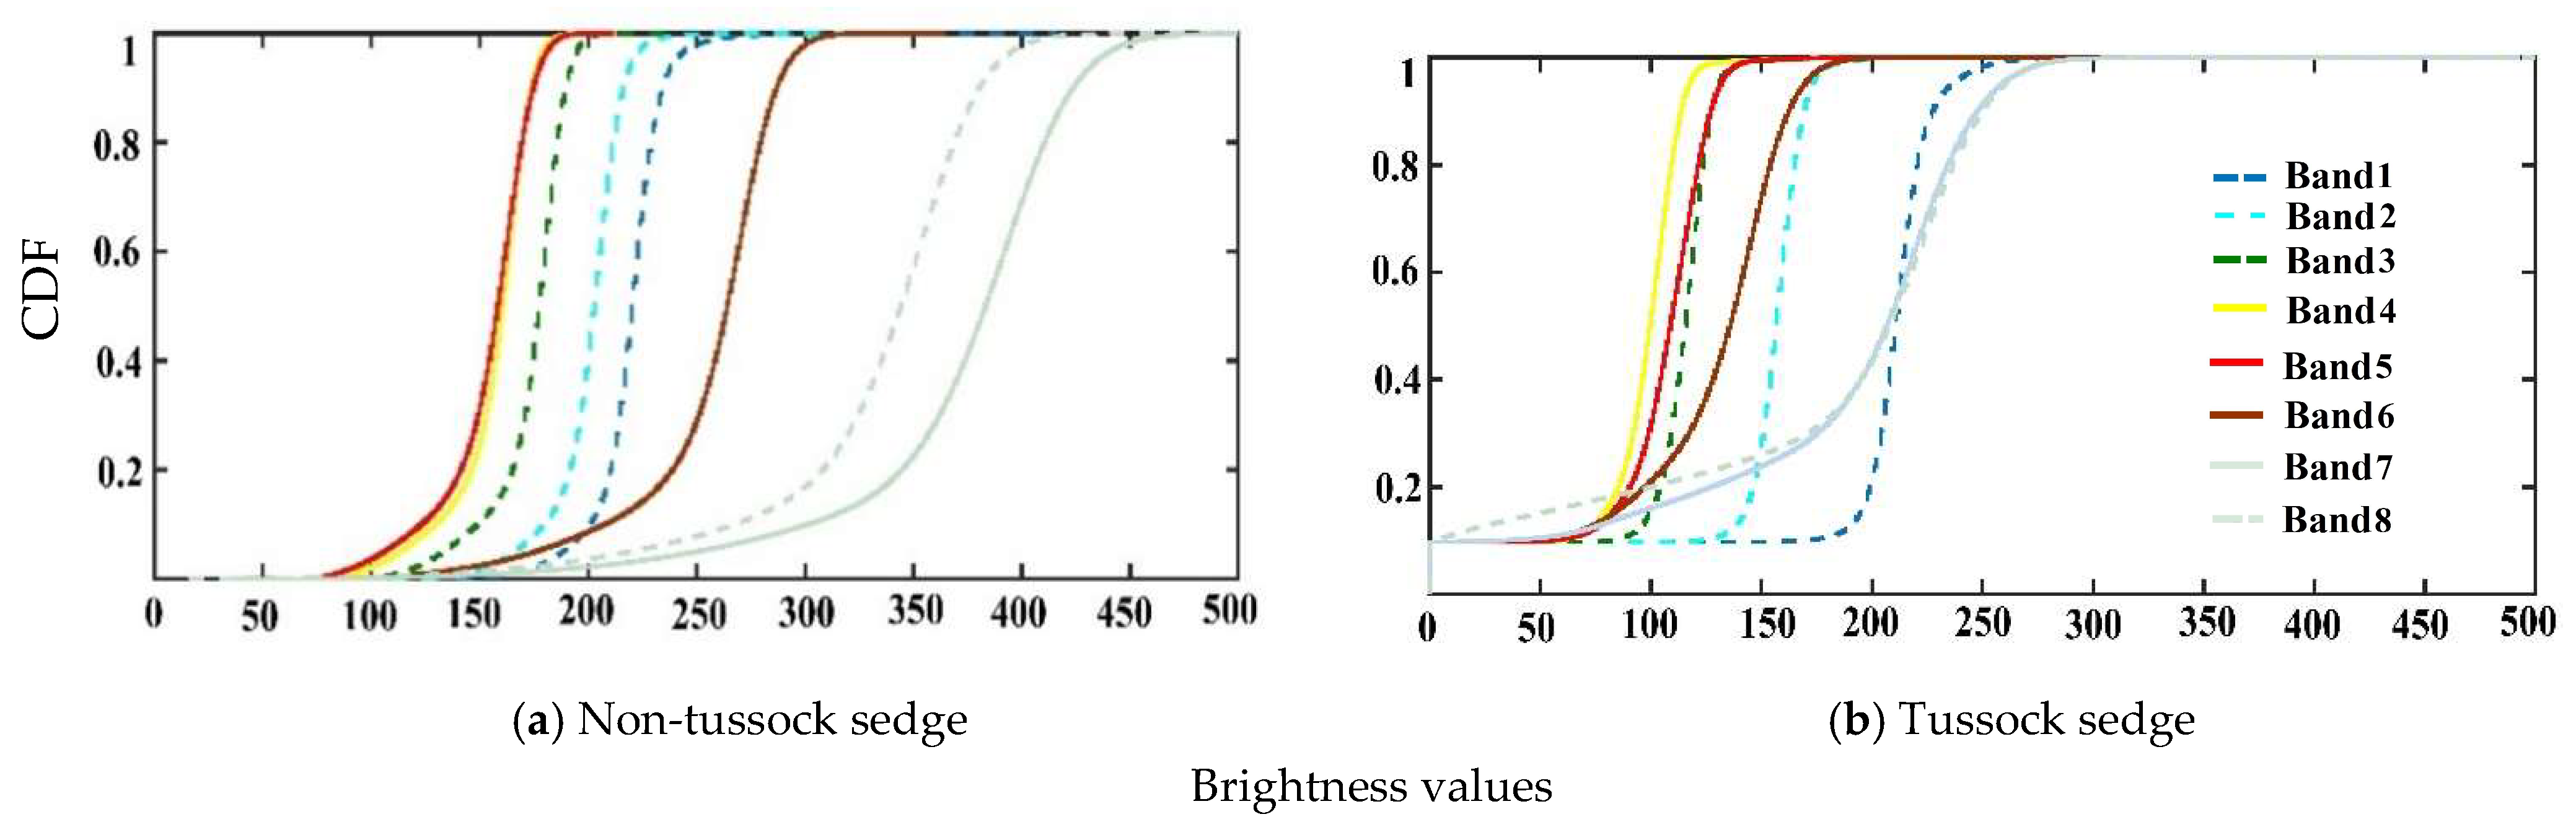
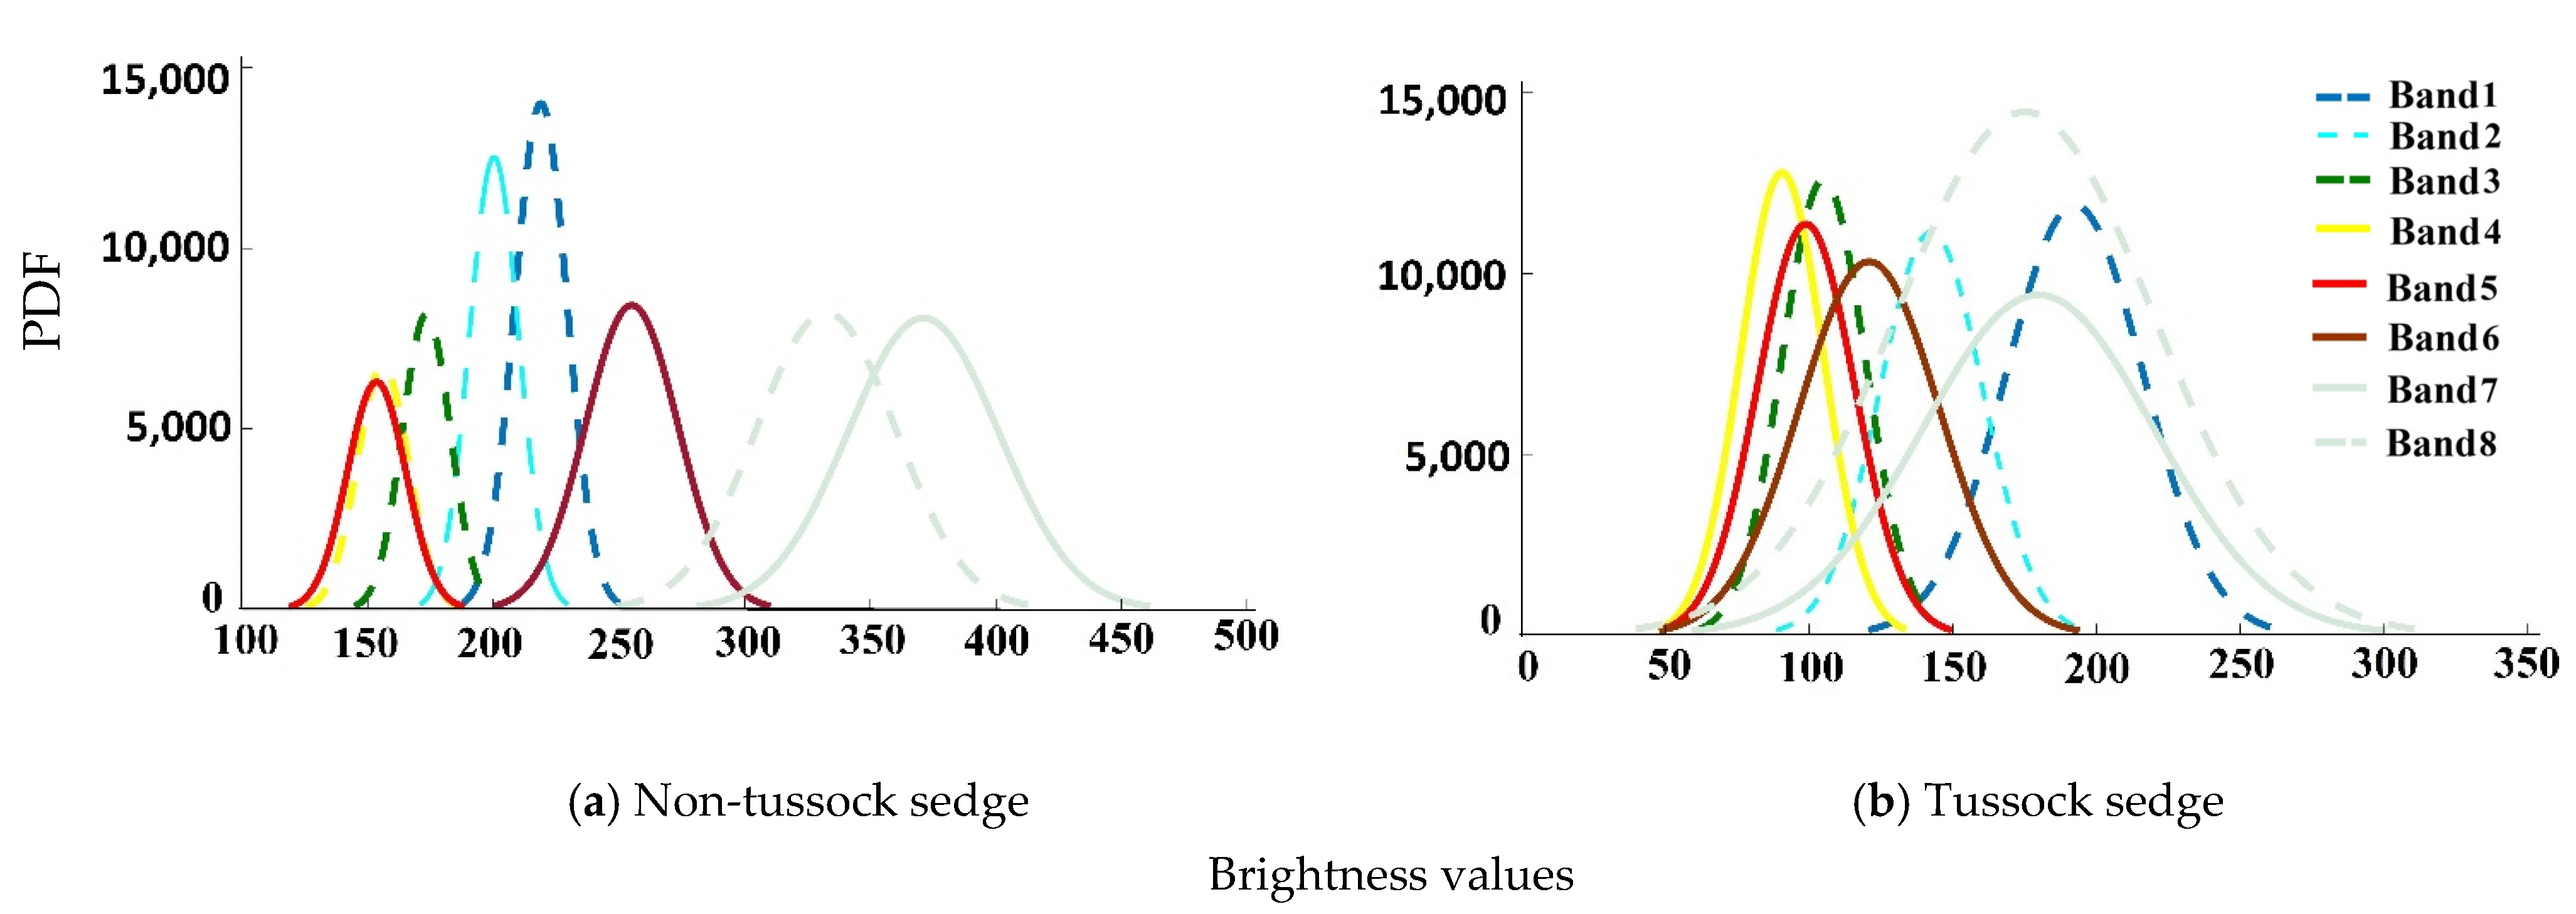
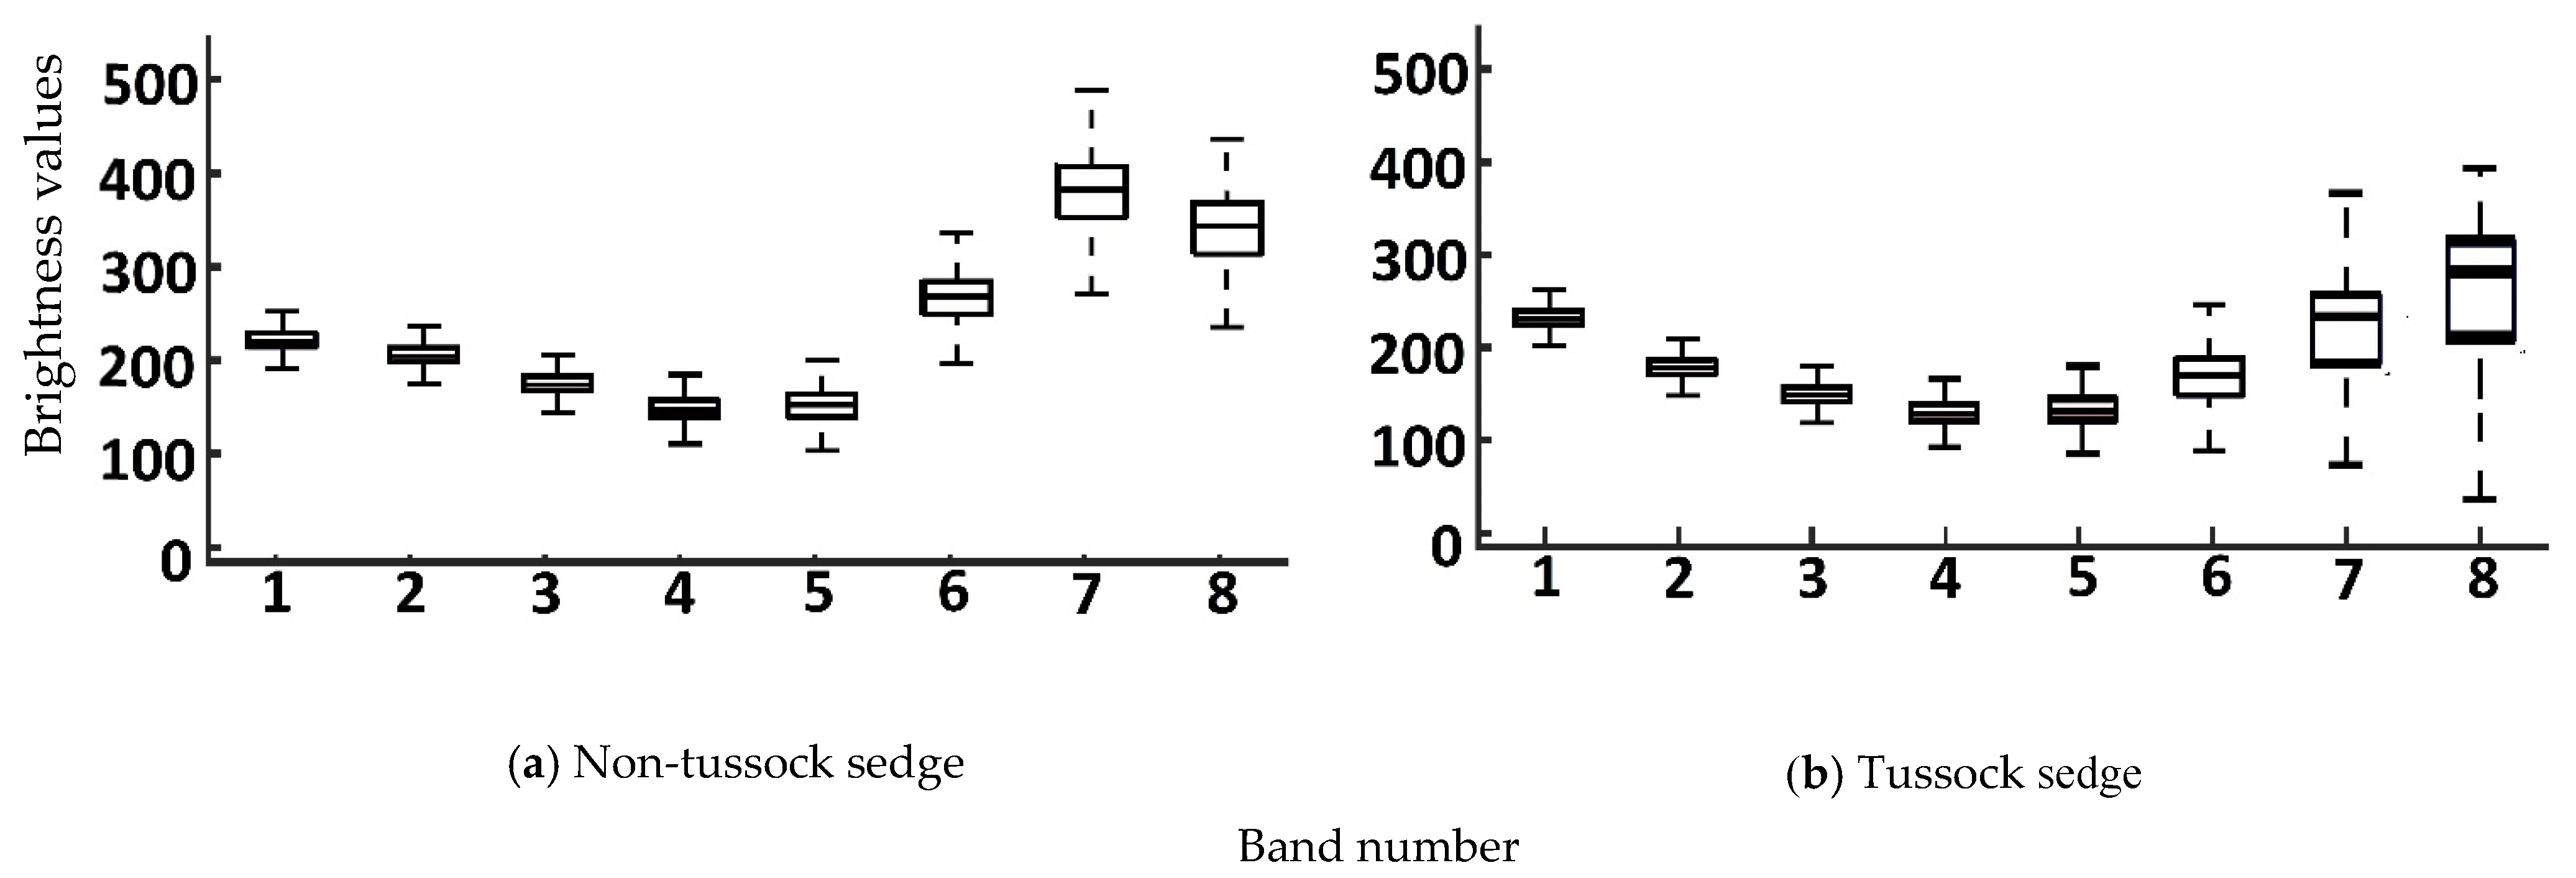
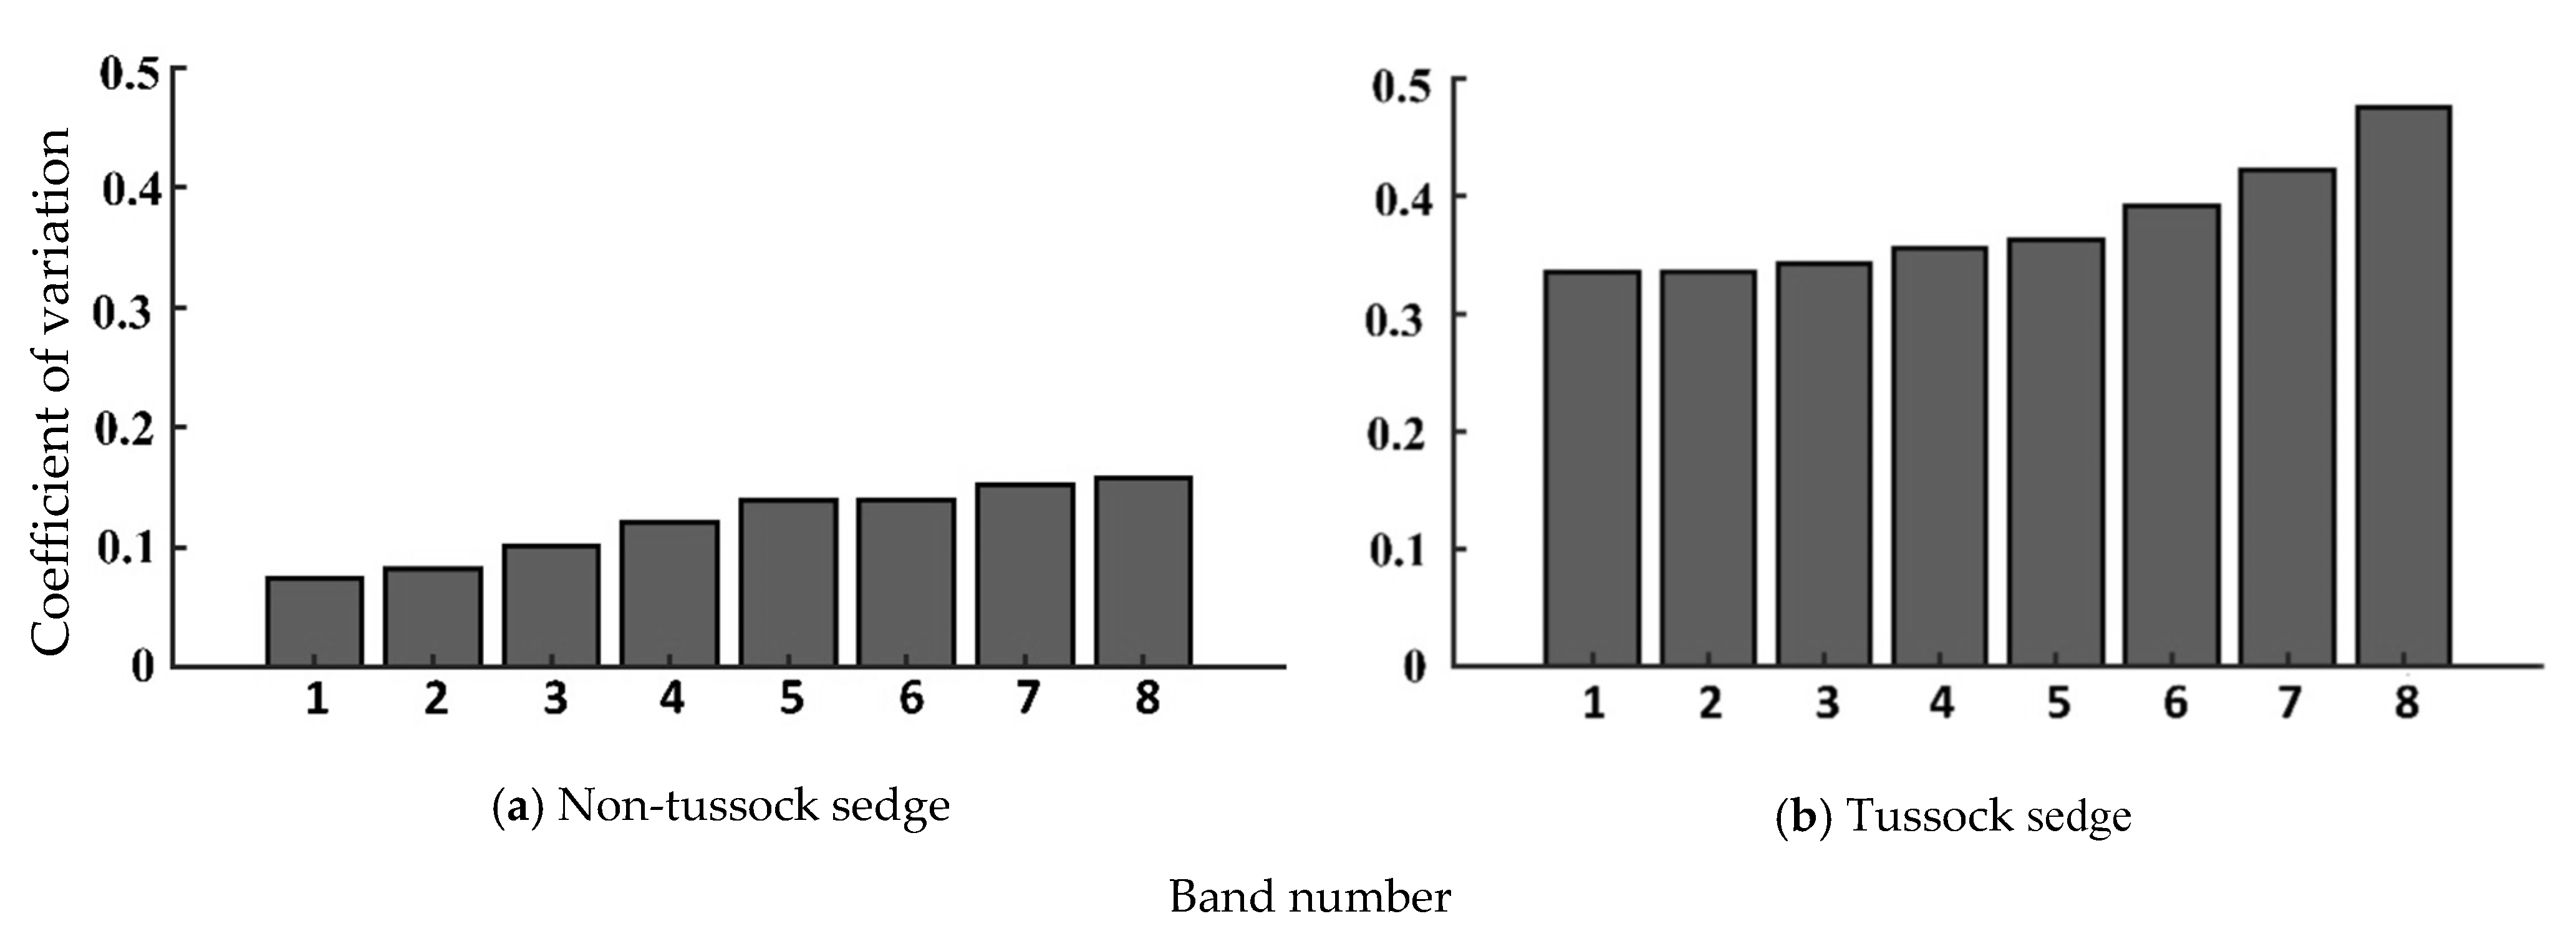
4.1. Statistical Measures for Input Image
4.2. Statistical Measures for Model Prediction
5. Conclusions
Author Contributions
Funding
Acknowledgments
Conflicts of Interest
References
- LeCun, Y.; Bengio, Y.; Hinton, G. Deep learning. Nature 2015, 521, 436–444. [Google Scholar] [CrossRef]
- Blaschke, T. Object based image analysis for remote sensing. ISPRS J. Photogramm. Remote Sens. 2010, 65, 2–16. [Google Scholar] [CrossRef]
- Lang, S.; Baraldi, A.; Tiede, D.; Hay, G.; Blaschke, T. Towards a (GE) OBIA 2.0 manifesto—Achievements and open challenges in information & knowledge extraction from big Earth data. In Proceedings of the GEOBIA, Montpellier, France, 18–22 June 2018. [Google Scholar]
- Witharana, C.; Lynch, H. An object-based image analysis approach for detecting penguin guano in very high spatial resolution satellite images. Remote Sens. 2016, 8, 375. [Google Scholar] [CrossRef]
- Ma, L.; Liu, Y.; Zhang, X.; Ye, Y.; Yin, G.; Johnson, B.A. Deep learning in remote sensing applications: A meta-analysis and review. ISPRS J. Photogramm. Remote Sens. 2019, 152, 166–177. [Google Scholar] [CrossRef]
- Kussul, N.; Lavreniuk, M.; Skakun, S.; Shelestov, A. Deep learning classification of land cover and crop types using remote sensing data. IEEE Geosci. Remote Sens. Lett. 2017, 14, 778–782. [Google Scholar] [CrossRef]
- Li, Y.; Qi, H.; Dai, J.; Ji, X.; Wei, Y. Fully convolutional instance-aware semantic segmentation. arXiv 2016, arXiv:1611.07709. [Google Scholar]
- Yang, B.; Kim, M.; Madden, M. Assessing optimal image fusion methods for very high spatial resolution satellite images to support coastal monitoring. Giscience Remote Sens. 2012, 49, 687–710. [Google Scholar] [CrossRef]
- Wei, X.; Fu, K.; Gao, X.; Yan, M.; Sun, X.; Chen, K.; Sun, H. Semantic pixel labelling in remote sensing images using a deep convolutional encoder-decoder model. Remote Sens. Lett. 2018, 9, 199–208. [Google Scholar] [CrossRef]
- Abdulla, W. Mask R-Cnn for Object Detection and Instance Segmentation on Keras and Tensorflow. Available online: https://github.com/matterport/Mask_RCNN (accessed on 25 August 2020).
- Dai, J.; He, K.; Sun, J. Instance-aware semantic segmentation via multi-task network cascades. In Proceedings of the 2016 IEEE Conference on Computer Vision and Pattern Recognition, Las Vegas, NV, USA, 27–30 June 2016; IEEE: Piscataway, NJ, USA, 2016. [Google Scholar]
- Ren, Z.; Sudderth, E.B. Three-dimensional object detection and layout prediction using clouds of oriented gradients. In Proceedings of the IEEE Conference on Computer Vision and Pattern Recognition, Las Vegas, NV, USA, 27–30 June 2016; pp. 1525–1533. [Google Scholar]
- Vuola, A.O.; Akram, S.U.; Kannala, J. Mask-RCNN and U-net ensembled for nuclei segmentation. In Proceedings of the 2019 IEEE 16th International Symposium on Biomedical Imaging, Venice, Italy, 8–11 April 2019; pp. 208–212. [Google Scholar]
- Ronneberger, O.; Fischer, P.; Brox, T. U-Net: Convolutional networks for biomedical image segmentation. In Proceedings of the MICCAI 2015, Munich, Germany, 5–9 October 2015; Navab, N., Hornegger, J., Wells, W.M., Frangi, A.F., Eds.; LNCS: New York, NY, USA, 2015; Volume 9351, pp. 234–241. [Google Scholar] [CrossRef]
- Woodcock, C.E.; Strahler, A.H. The factor of scale in remote sensing. Remote Sens. Environ. 1987, 21, 311–332. [Google Scholar] [CrossRef]
- Blaschke, T.; Hay, G.J.; Kelly, M.; Lang, S.; Hofmann, P.; Addink, E.; Feitosa, R.Q.; Van der Meer, F.; Van der Werff, H.; Van Coillie, F.; et al. Geographic object-based image analysis–Towards a new paradigm. ISPRS J. Photogramm. Remote Sens 2014, 87, 180–191. [Google Scholar] [CrossRef]
- Hay, G.J. Visualizing ScaleDomain Manifolds: A multiscale geoobjectbased approach. Scale Issues Remote Sens. 2014, 139–169. [Google Scholar] [CrossRef]
- Bhuiyan, M.A.E.; Witharana, C.; Liljedahl, A.K. Big Imagery as a Resource to Understand Patterns, Dynamics, and Vulnerability of Arctic Polygonal Tundra. In Proceedings of the AGUFM 2019, San Francisco, CA, USA, 9–13 December 2019; p. C13E-1374. [Google Scholar]
- Witharana, C.; Bhuiyan, M.A.E.; Liljedahl, A.K. Towards First pan-Arctic Ice-wedge Polygon Map: Understanding the Synergies of Data Fusion and Deep Learning in Automated Ice-wedge Polygon Detection from High Resolution Commercial Satellite Imagery. In Proceedings of the AGUFM 2019, San Francisco, CA, USA, 9–13 December 2019; p. C22C-07. [Google Scholar]
- Zhang, W.; Witharana, C.; Liljedahl, A.; Kanevskiy, M. Deep convolutional neural networks for automated characterization of arctic ice-wedge polygons in very high spatial resolution aerial imagery. Remote Sens. 2018, 10, 1487. [Google Scholar] [CrossRef]
- Zhang, W.; Liljedahl, A.K.; Kanevskiy, M.; Epstein, H.E.; Jones, B.M.; Jorgenson, M.T.; Kent, K. Transferability of the deep learning mask R-CNN model for automated mapping of ice-wedge polygons in high-resolution satellite and UAV images. Remote Sens. 2020, 12, 1085. [Google Scholar] [CrossRef]
- Liljedahl, A.K.; Boike, J.; Daanen, R.P.; Fedorov, A.N.; Frost, G.V.; Grosse, G.; Hinzman, L.D.; Iijma, Y.; Jorgenson, J.C.; Matveyeva, N.; et al. Pan-Arctic ice-wedge degradation in warming permafrost and its influence on tundra hydrology. Nat. Geosci. 2016, 9, 312–318. [Google Scholar] [CrossRef]
- Turetsky, M.R.; Abbott, B.W.; Jones, M.C.; Anthony, K.W.; Olefeldt, D.; Schuur, E.A.G.; Koven, C.; McGuire, A.D.; Grosse, G.; Kuhry, P. Permafrost Collapse is Accelerating Carbon Release; Nature Publishing Group: London, UK, 2019. [Google Scholar]
- Jones, B.M.; Grosse, G.; Arp, C.D.; Miller, E.; Liu, L.; Hayes, D.J.; Larsen, C.F. Recent Arctic tundra fire initiates widespread thermokarst development. Sci. Rep. 2015, 5, 15865. [Google Scholar] [CrossRef]
- Ulrich, M.; Grosse, G.; Strauss, J.; Schirrmeister, L. Quantifying Wedge-Ice Volumes in Yedoma and Thermokarst Basin Deposits. Permafr. Periglac. Process. 2014, 25, 151–161. [Google Scholar] [CrossRef]
- Muster, S.; Heim, B.; Abnizova, A.; Boike, J. Water body distributions across scales: A remote sensing based comparison of three arctic tundra wetlands. Remote Sens. 2013, 5, 1498–1523. [Google Scholar] [CrossRef]
- Lousada, M.; Pina, P.; Vieira, G.; Bandeira, L.; Mora, C. Evaluation of the use of very high resolution aerial imagery for accurate ice-wedge polygon mapping (Adventdalen, Svalbard). Sci. Total Environ. 2018, 615, 1574–1583. [Google Scholar] [CrossRef]
- Skurikhin, A.N.; Wilson, C.J.; Liljedahl, A.; Rowland, J.C. Recursive active contours for hierarchical segmentation of wetlands in high-resolution satellite imagery of arctic landscapes. In Proceedings of the Southwest Symposium on Image Analysis and Interpretation 2014, San Diego, CA, USA, 6–8 April 2014; pp. 137–140. [Google Scholar]
- Abolt, C.J.; Young, M.H.; Atchley, A.L.; Wilson, C.J. Brief communication: Rapid machine-learning-based extraction and measurement of ice wedge polygons in high-resolution digital elevation models. Cryosphere 2019, 13, 237–245. [Google Scholar] [CrossRef]
- Huang, F.; Zhang, J.; Zhou, C.; Wang, Y.; Huang, J.; Zhu, L. A deep learning algorithm using a fully connected sparse autoencoder neural network for landslide susceptibility prediction. Landslides 2020, 17, 217–229. [Google Scholar] [CrossRef]
- Jiang, P.; Chen, Y.; Liu, B.; He, D.; Liang, C. Real-time detection of apple leaf diseases using deep learning approach based on improved convolutional neural networks. IEEE Access 2019, 7, 59069–59080. [Google Scholar] [CrossRef]
- Samuel, D.; Karam, L. Understanding how image quality affects deep neural networks. In Proceedings of the 2016 Eighth International Conference on Quality of Multimedia Experience (QoMEX), Lisbon, Portugal, 6–8 June 2016. [Google Scholar]
- Dodge, S.; Karam, L. A study and comparison of human and deep learning recognition performance under visual distortions. In Proceedings of the 2017 26th International Conference on Computer Communication and Networks (ICCCN), Vancouver, BC, Canada, 31 July–3 August 2017; pp. 1–7. [Google Scholar]
- Vasiljevic, I.; Chakrabarti, A.; Shakhnarovich, G. Examining the impact of blur on recognition by convolutional networks. arXiv 2016, arXiv:1611.05760. [Google Scholar]
- Karahan, S.; Yildirum, M.K.; Kirtac, K.; Rende, F.S.; Butun, G.; Ekenel, H.K. September. How image degradations affect deep cnn-based face recognition? In Proceedings of the 2016 International Conference of the Biometrics Special Interest Group (BIOSIG), Darmstadt, Germany, 21–23 September 2016; pp. 1–5. [Google Scholar]
- Gu, Y.; Wang, Y.; Li, Y. A Survey on Deep Learning-Driven Remote Sensing Image Scene Understanding: Scene Classification, Scene Retrieval and Scene-Guided Object Detection. Appl. Sci. 2019, 9, 2110. [Google Scholar] [CrossRef]
- Russakovsky, O.J.; Deng, H.; Su, J.; Krause, S.; Satheesh, S.; Ma, Z.; Huang, A.; Karpathy, A.; Khosla, M.; Bernstein, A.C.; et al. ImageNet Large Scale Visual Recognition Challenge. Int. J. Comput. Vis. 2015, 115, 211–252. [Google Scholar] [CrossRef]
- Krizhevsky, A.; Sutskever, I.; Hinton, G.E. Imagenet classification with deep convolutional neural networks. In Proceedings of the 2012 Advances in Neural Information Processing Systems, Lake Tahoe, NV, USA, 3–8 December 2012; pp. 1097–1105. [Google Scholar]
- Simonyan, K.; Zisserman, A. Very deep convolutional networks for large-scale image recognition. arXiv 2014, arXiv:1409.1556. [Google Scholar]
- Raynolds, M.K.; Walker, D.A.; Balser, A.; Bay, C.; Campbell, M.; Cherosov, M.M.; Daniëls, F.J.; Eidesen, P.B.; Ermokhina, K.A.; Frost, G.V.; et al. A raster version of the Circumpolar Arctic Vegetation Map (CAVM). Remote Sens. Environ. 2019, 232, 111297. [Google Scholar] [CrossRef]
- Walker, D.A.F.J.A.; Daniëls, N.V.; Matveyeva, J.; Šibík, M.D.; Walker, A.L.; Breen, L.A.; Druckenmiller, M.K.; Raynolds, H.; Bültmann, S.; Hennekens, M.; et al. Wirth Circumpolar arctic vegetation classification Phytocoenologia. Phytocoenologia 2018, 48, 181–201. [Google Scholar] [CrossRef]
- He, K.; Gkioxari, G.; Dollár, P.; Girshick, R. Mask RCNN. In Proceedings of the IEEE International Conference on Computer Vision, Venice, Italy, 22–29 October 2017; pp. 2961–2969. [Google Scholar]
- Rumelhart, D.E.; Hinton, G.E.; Williams, R.J. Learning Internal Representations by Error Propagation. Available online: https://web.stanford.edu/class/psych209a/ReadingsByDate/02_06/PDPVolIChapter8.pdf (accessed on 15 August 2020).
- Ehlers, M.; Klonus, S.; Ãstrand, P.J.; Rosso, P. Multi-sensor image fusion for pansharpening in remote sensing. Int. J. Image Data Fusion 2010, 1, 25–45. [Google Scholar] [CrossRef]
- Wang, S.; Quan, D.; Liang, X.; Ning, M.; Guo, Y.; Jiao, L. A deep learning framework for remote sensing image registration. ISPRS J. Photogramm. Remote Sens. 2018, 145, 48–164. [Google Scholar] [CrossRef]
- Arnall, D.B. Relationship between Coefficient of Variation Measured by Spectral Reflectance and Plant Density at Early Growth Stages. Doctoral Dissertation, Oklahoma State University, Stillwater, OK, USA, 2004. [Google Scholar]
- Chuvieco, E. Fundamentals of Satellite Remote Sensing: An Environmental Approach; CRC Press: Boca Raton, FL, USA, 2016. [Google Scholar]
- Bovolo, F.; Bruzzone, L. A detail-preserving scale-driven approach to change detection in multitemporal SAR images. IEEE Trans. Geosci. Remote Sens. 2005, 43, 2963–2972. [Google Scholar] [CrossRef]
- Jhan, J.P.; Rau, J.Y. A normalized surf for multispectral image matching and band Co-Registration. International Archives of the Photogrammetry. Remote Sens. Spat. Inf. Sci. 2019. [Google Scholar] [CrossRef]
- Inamdar, S.; Bovolo, F.; Bruzzone, L.; Chaudhuri, S. Multidimensional probability density function matching for preprocessing of multitemporal remote sensing images. IEEE Trans. Geosci. Remote Sens. 2008, 46, 1243–1252. [Google Scholar] [CrossRef]
- Pitié, F.; Kokaram, A.; Dahyot, R. N-dimensional probability function transfer and its application to color transfer. In Proceedings of the IEEE International Conference Comput Vision, Santiago, Chile, 7–13 December 2005; Volume 2, pp. 1434–1439. [Google Scholar]
- Pitié, F.; Kokaram, A.; Dahyot, R. Automated colour grading using colour distribution transfer. Comput. Vis. Image Underst. 2007, 107, 123–137. [Google Scholar] [CrossRef]
- Liang, Y.; Sun, K.; Zeng, Y.; Li, G.; Xing, M. An Adaptive hierarchical detection method for ship targets in high-resolution SAR images. Remote Sens. 2020, 12, 303. [Google Scholar] [CrossRef]
- McKight, P.E.; Najab, J. Kruskal-wallis test. In The Corsini Encyclopedia of Psychology; Wiley: Hoboken, NJ, USA, 2010; p. 1. [Google Scholar] [CrossRef]
- Fagerland, M.W.; Sandvik, L. The Wilcoxon-Mann-Whitney test under scrutiny. Stat. Med. 2009, 28, 1487–1497. [Google Scholar] [CrossRef]
- Bhuiyan, M.A.; Nikolopoulos, E.I.; Anagnostou, E.N. Machine learning–based blending of satellite and reanalysis precipitation datasets: A multiregional tropical complex terrain evaluation. J. Hydrometeor. 2019, 20, 2147–2161. [Google Scholar] [CrossRef]
- Bhuiyan, M.A.; Begum, F.; Ilham, S.J.; Khan, R.S. Advanced wind speed prediction using convective weather variables through machine learning application. Appl. Comput. Geosci. 2019, 1, 100002. [Google Scholar]
- Bhuiyan, M.A.E.; Nikolopoulos, E.I.; Anagnostou, E.N.; Quintana-Seguí, P.; Barella-Ortiz, A. A nonparametric statistical technique for combining global precipitation datasets: Development and hydrological evaluation over the Iberian Peninsula. Hydrol. Earth Syst. Sci. 2018, 22, 1371–1389. [Google Scholar] [CrossRef]
- Bhuiyan, M.A.E.; Yang, F.; Biswas, N.K.; Rahat, S.H.; Neelam, T.J. Machine learning-based error modeling to improve GPM IMERG precipitation product over the brahmaputra river basin. Forecasting 2020, 2, 14. [Google Scholar] [CrossRef]
- Powers, D. Evaluation: From precision, recall and f-measure to ROC, informedness, markedness & correlation. J. Mach. Learn. Technol. 2011, 2, 37–63. [Google Scholar]


| Image Scene | Three Band Combination | ||||
|---|---|---|---|---|---|
| 1,2,3 | 2,3,5 | 2,3,7 | 3,4,5 | 3,5,7 | |
| Non-tussock sedge | 0.17 | 0.35 | 0.33 | 0.16 | 0.38 |
| Tussock sedge | 0.19 | 0.38 | 0.35 | 0.19 | 0.38 |
| Image Scene | Three Band Combination | ||||
|---|---|---|---|---|---|
| 1,2,3 | 2,3,5 | 2,3,7 | 3,4,5 | 3,5,7 | |
| Non-tussock sedge | 0.20 | 0.38 | 0.34 | 0.19 | 0.42 |
| Tussock sedge | 0.21 | 0.39 | 0.35 | 0.17 | 0.47 |
| Band Combination | Non-Tussock Sedge | Tussock Sedge | ||||
|---|---|---|---|---|---|---|
| Correctness | Completeness | F1 Score | Correctness | Completeness | F1 Score | |
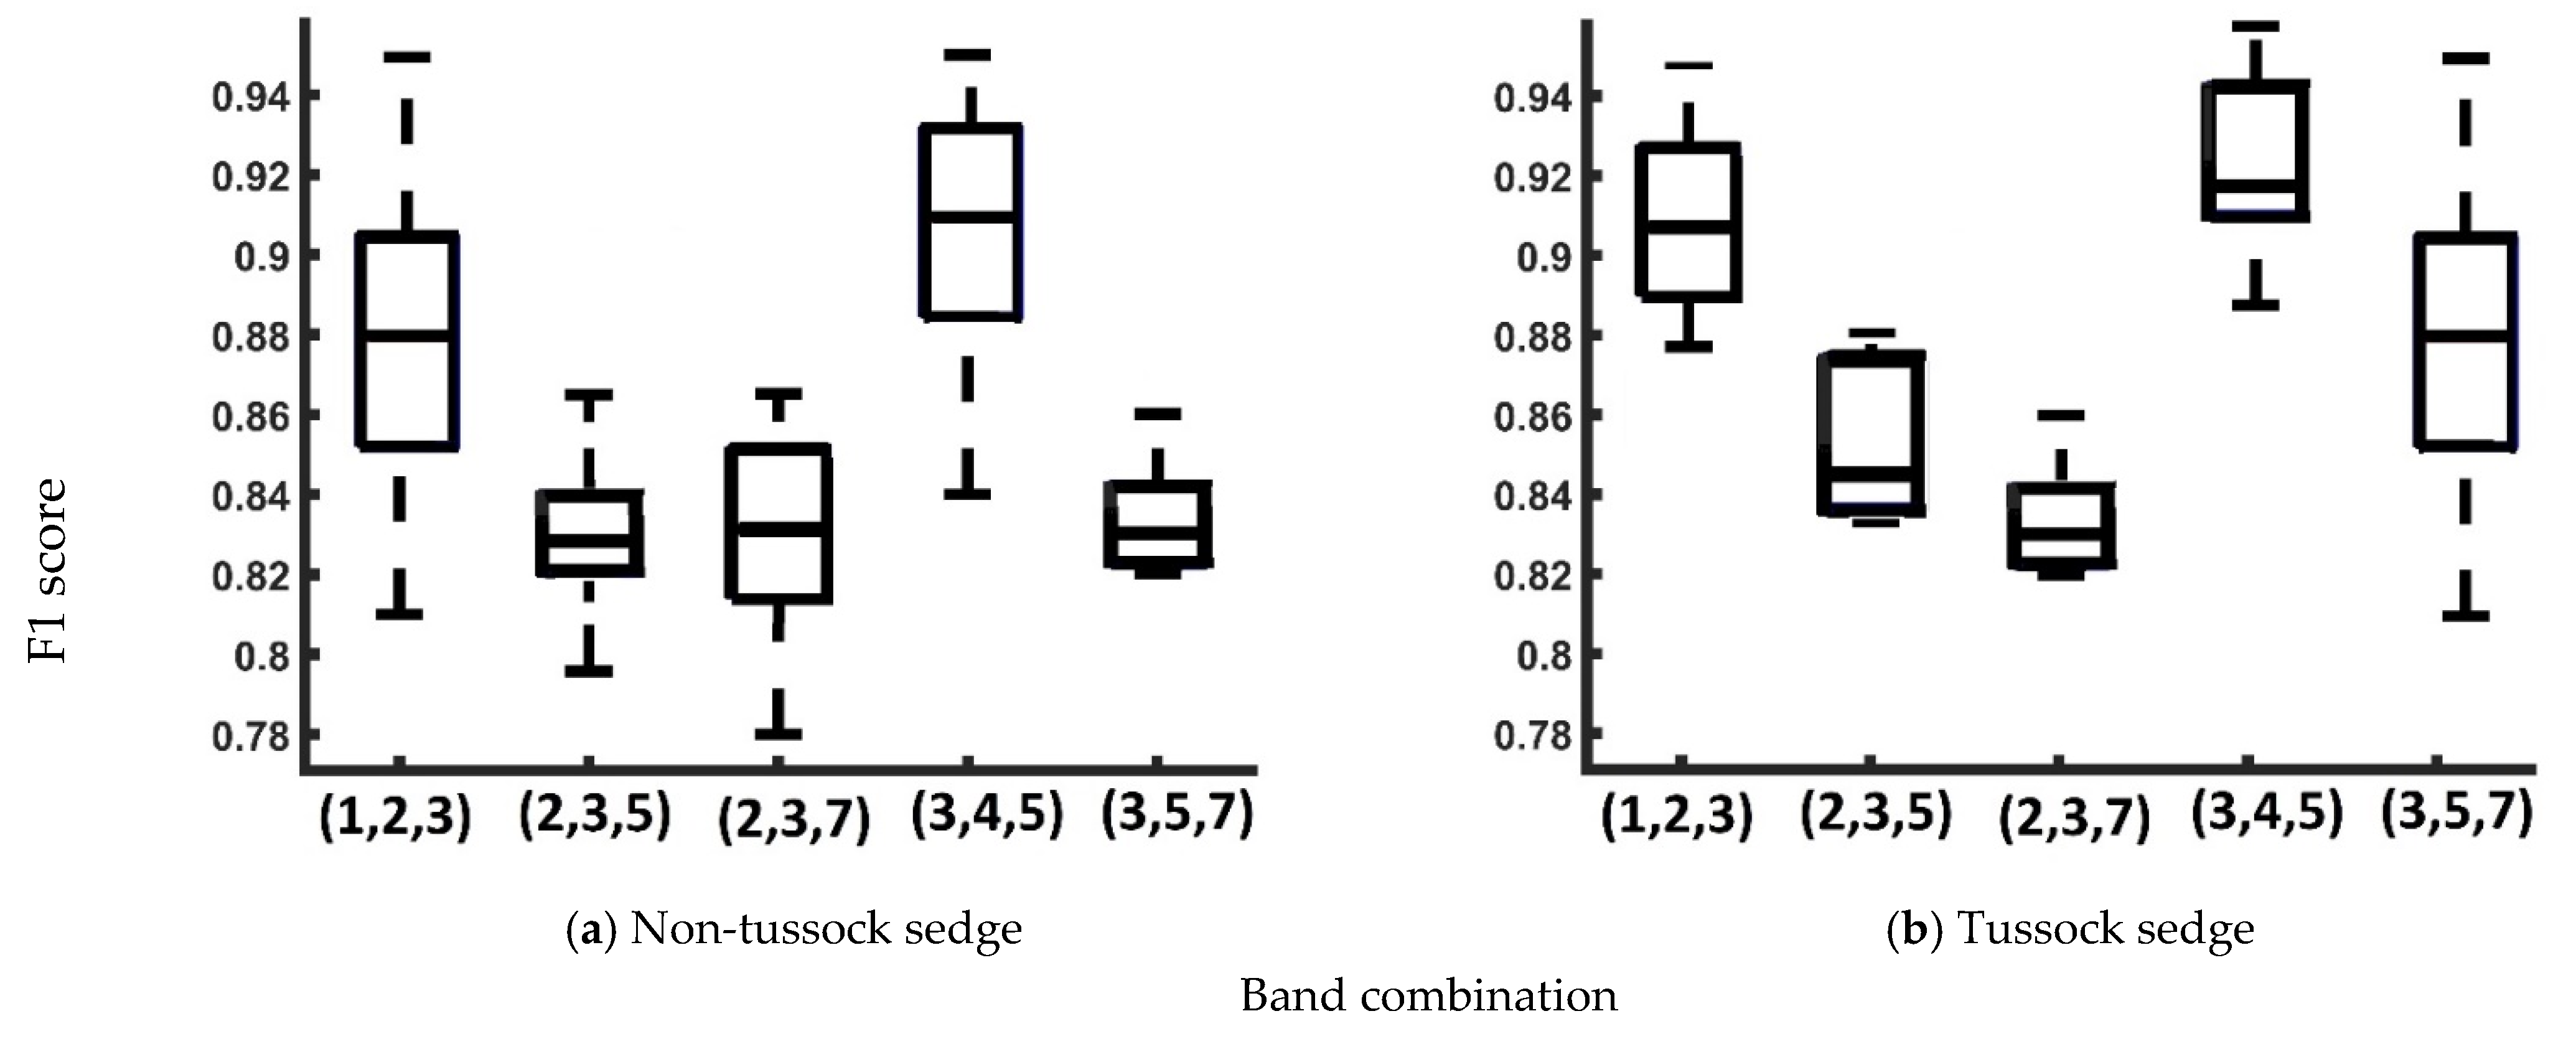
| 1,2,3 | 1 | 85% | 0.89 | 1 | 89% | 0.92 |
| 2,3,5 | 1 | 81% | 0.84 | 1 | 82% | 0.85 |
| 2,3,7 | 1 | 82% | 0.84 | 1 | 82% | 0.83 |
| 3,4,5 | 1 | 86% | 0.91 | 1 | 91% | 0.95 |
| 3,5,7 | 1 | 82% | 0.83 | 1 | 82% | 0.88 |
| Non-Tussock Sedge | Tussock Sedge | ||||
|---|---|---|---|---|---|
| Band Combination | 1,2,3 | 3,4,5 | Band Combination | 1,2,3 | 3,4,5 |
| 1,2,3 | 1 | 0.0824 | 1,2,3 | 1 | 0.0189 |
| 2,3,5 | 4.22 × 10⁻⁴ | 2.33 × 10⁻⁵ | 2,3,5 | 0.0 | 0.0 |
| 2,3,7 | 0.0011 | 4.01 × 10⁻⁵ | 2,3,7 | 0.0 | 0.0 |
| 3,4,5 | 0.0824 | 1 | 3,4,5 | 0.0189 | 1 |
| 3,5,7 | 3.77 × 10⁻⁴ | 7.83 × 10⁻⁵ | 3,5,7 | 1.40 × 10⁻³ | 4.11 × 10⁻⁵ |
© 2020 by the authors. Licensee MDPI, Basel, Switzerland. This article is an open access article distributed under the terms and conditions of the Creative Commons Attribution (CC BY) license (http://creativecommons.org/licenses/by/4.0/).
Share and Cite
Bhuiyan, M.A.E.; Witharana, C.; Liljedahl, A.K.; Jones, B.M.; Daanen, R.; Epstein, H.E.; Kent, K.; Griffin, C.G.; Agnew, A. Understanding the Effects of Optimal Combination of Spectral Bands on Deep Learning Model Predictions: A Case Study Based on Permafrost Tundra Landform Mapping Using High Resolution Multispectral Satellite Imagery. J. Imaging 2020, 6, 97. https://doi.org/10.3390/jimaging6090097
Bhuiyan MAE, Witharana C, Liljedahl AK, Jones BM, Daanen R, Epstein HE, Kent K, Griffin CG, Agnew A. Understanding the Effects of Optimal Combination of Spectral Bands on Deep Learning Model Predictions: A Case Study Based on Permafrost Tundra Landform Mapping Using High Resolution Multispectral Satellite Imagery. Journal of Imaging. 2020; 6(9):97. https://doi.org/10.3390/jimaging6090097
Chicago/Turabian StyleBhuiyan, Md Abul Ehsan, Chandi Witharana, Anna K. Liljedahl, Benjamin M. Jones, Ronald Daanen, Howard E. Epstein, Kelcy Kent, Claire G. Griffin, and Amber Agnew. 2020. "Understanding the Effects of Optimal Combination of Spectral Bands on Deep Learning Model Predictions: A Case Study Based on Permafrost Tundra Landform Mapping Using High Resolution Multispectral Satellite Imagery" Journal of Imaging 6, no. 9: 97. https://doi.org/10.3390/jimaging6090097
APA StyleBhuiyan, M. A. E., Witharana, C., Liljedahl, A. K., Jones, B. M., Daanen, R., Epstein, H. E., Kent, K., Griffin, C. G., & Agnew, A. (2020). Understanding the Effects of Optimal Combination of Spectral Bands on Deep Learning Model Predictions: A Case Study Based on Permafrost Tundra Landform Mapping Using High Resolution Multispectral Satellite Imagery. Journal of Imaging, 6(9), 97. https://doi.org/10.3390/jimaging6090097