Imaging Membrane Curvature inside a FcεRI-Centric Synapse in RBL-2H3 Cells Using TIRF Microscopy with Polarized Excitation

 and
and 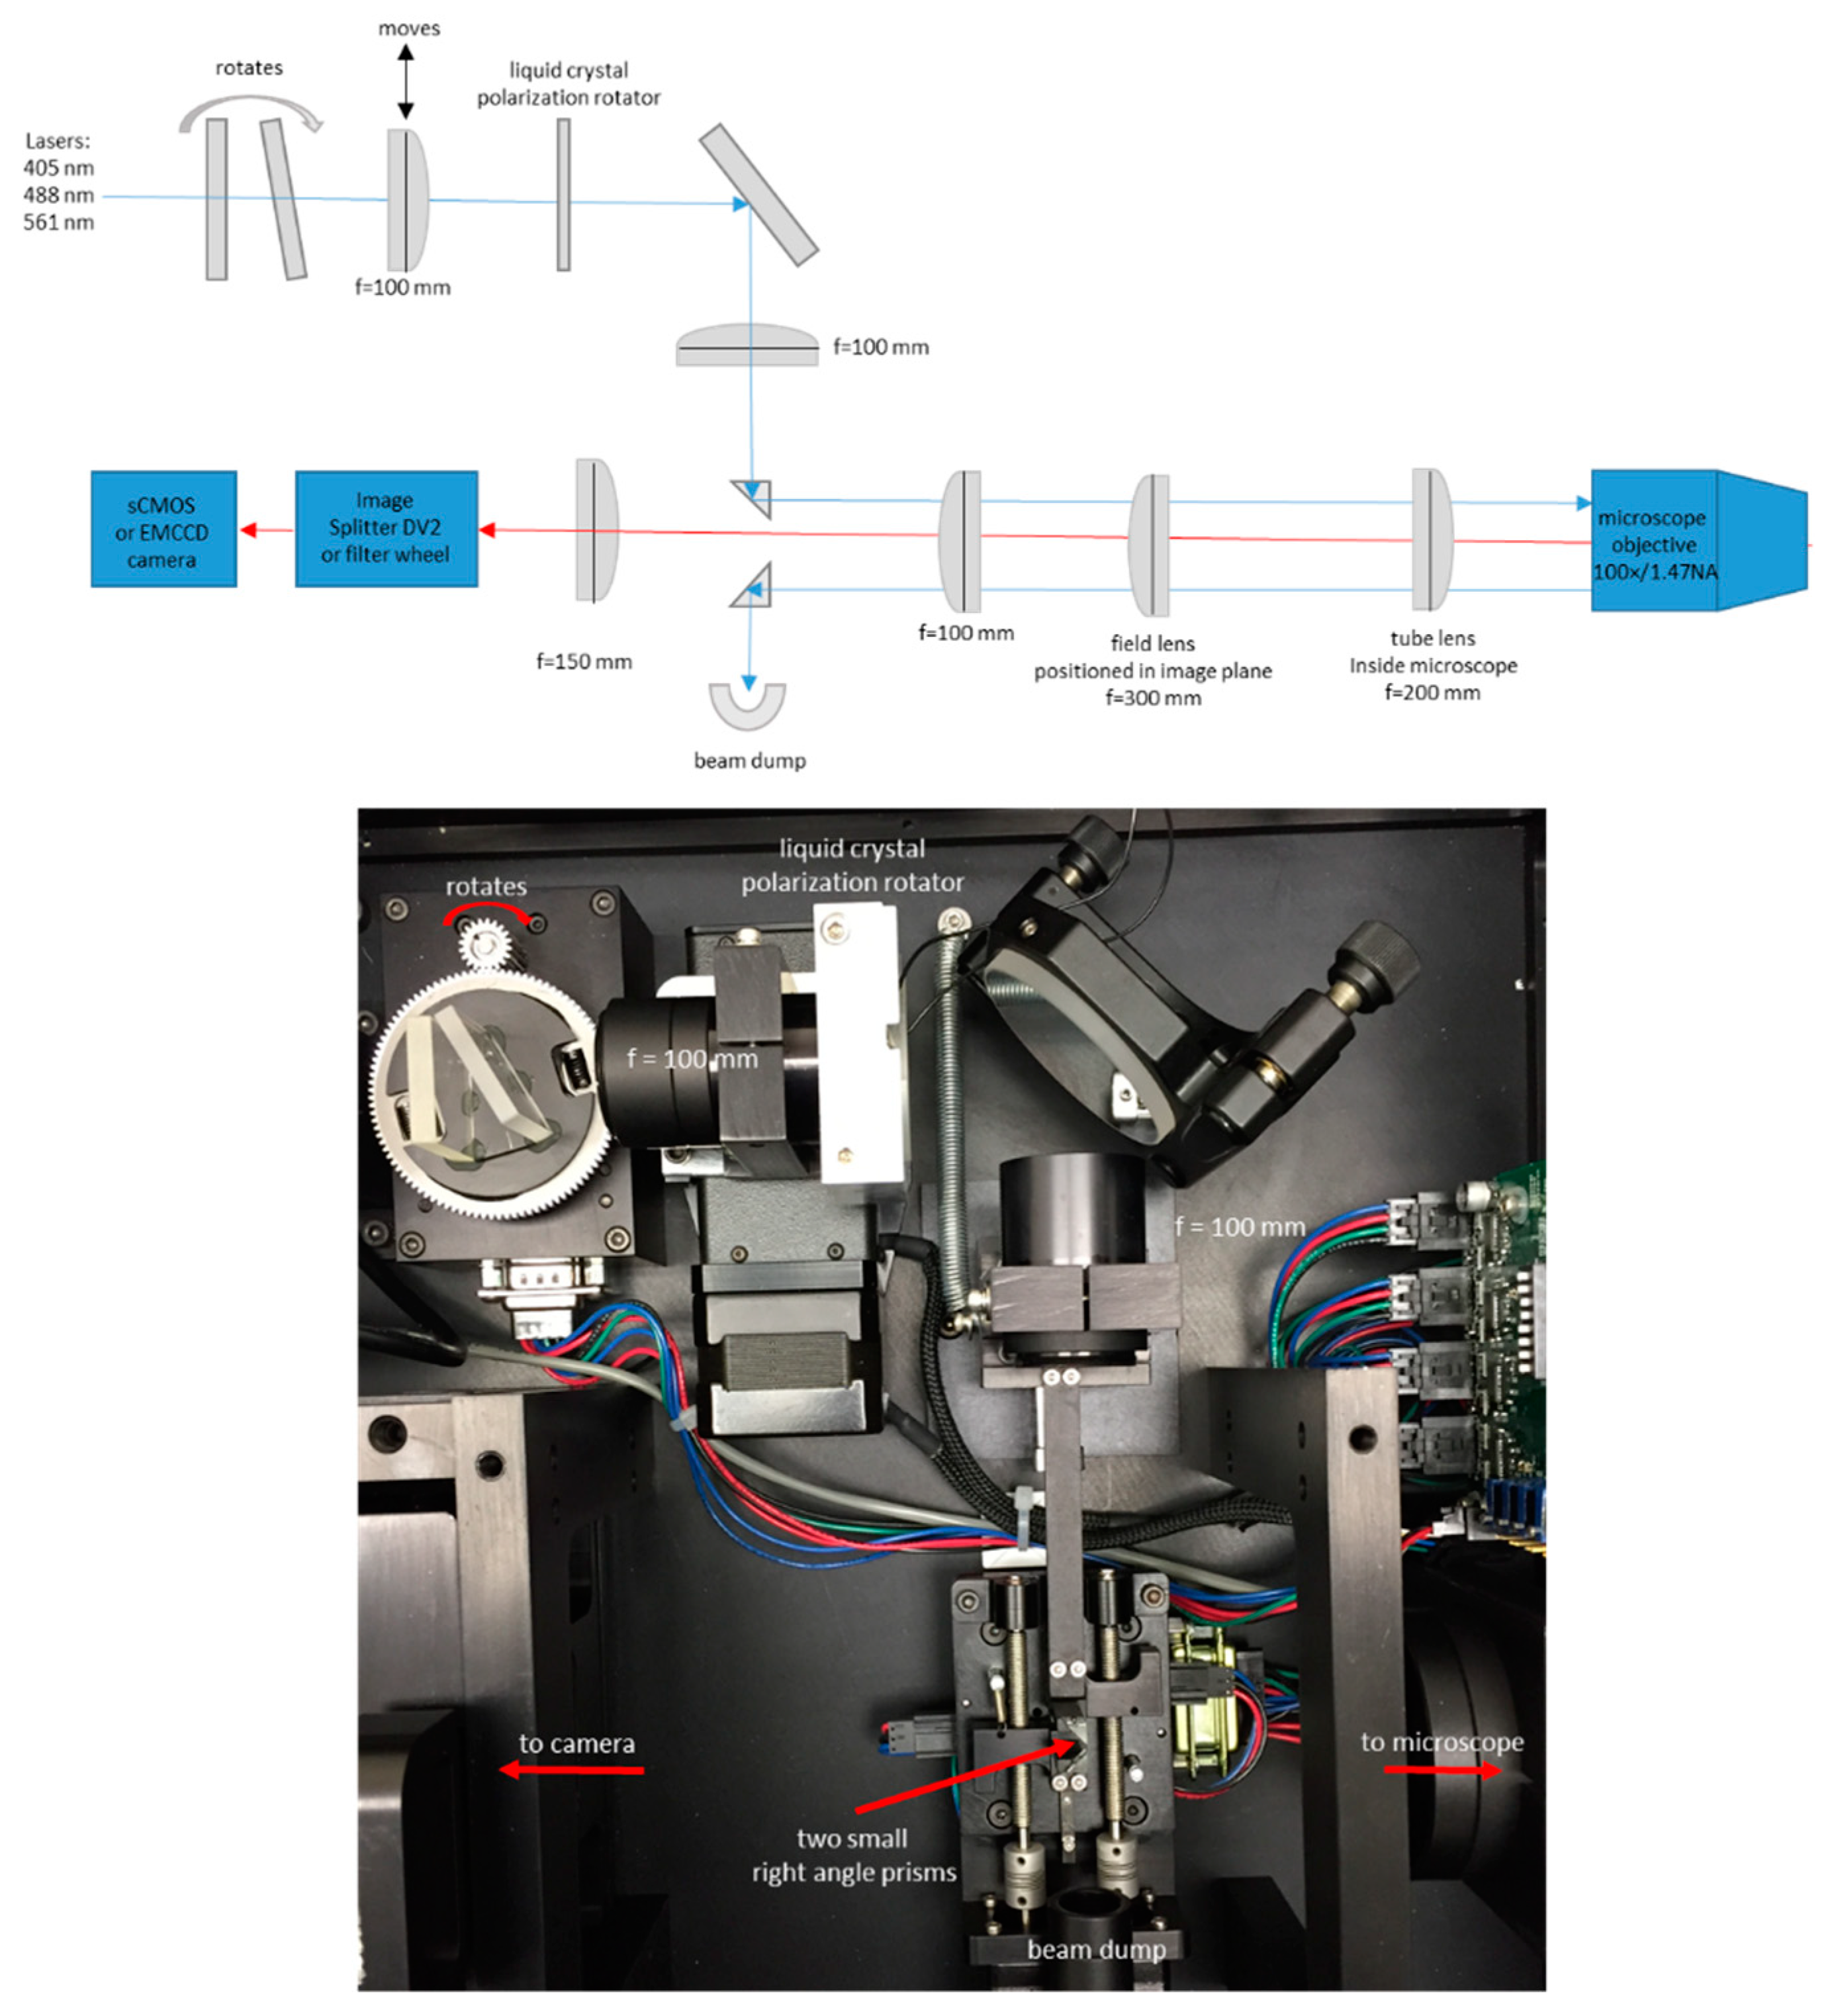
Abstract
1. Introduction
2. Materials and Methods
2.1. Samples
2.2. Microscope Setup and Acquisition
2.3. Membrane Curvature Visualization
3. Results
3.1. Membrane Curvature Can Be Detected Using P-TIRF and the Dye DiI-C16
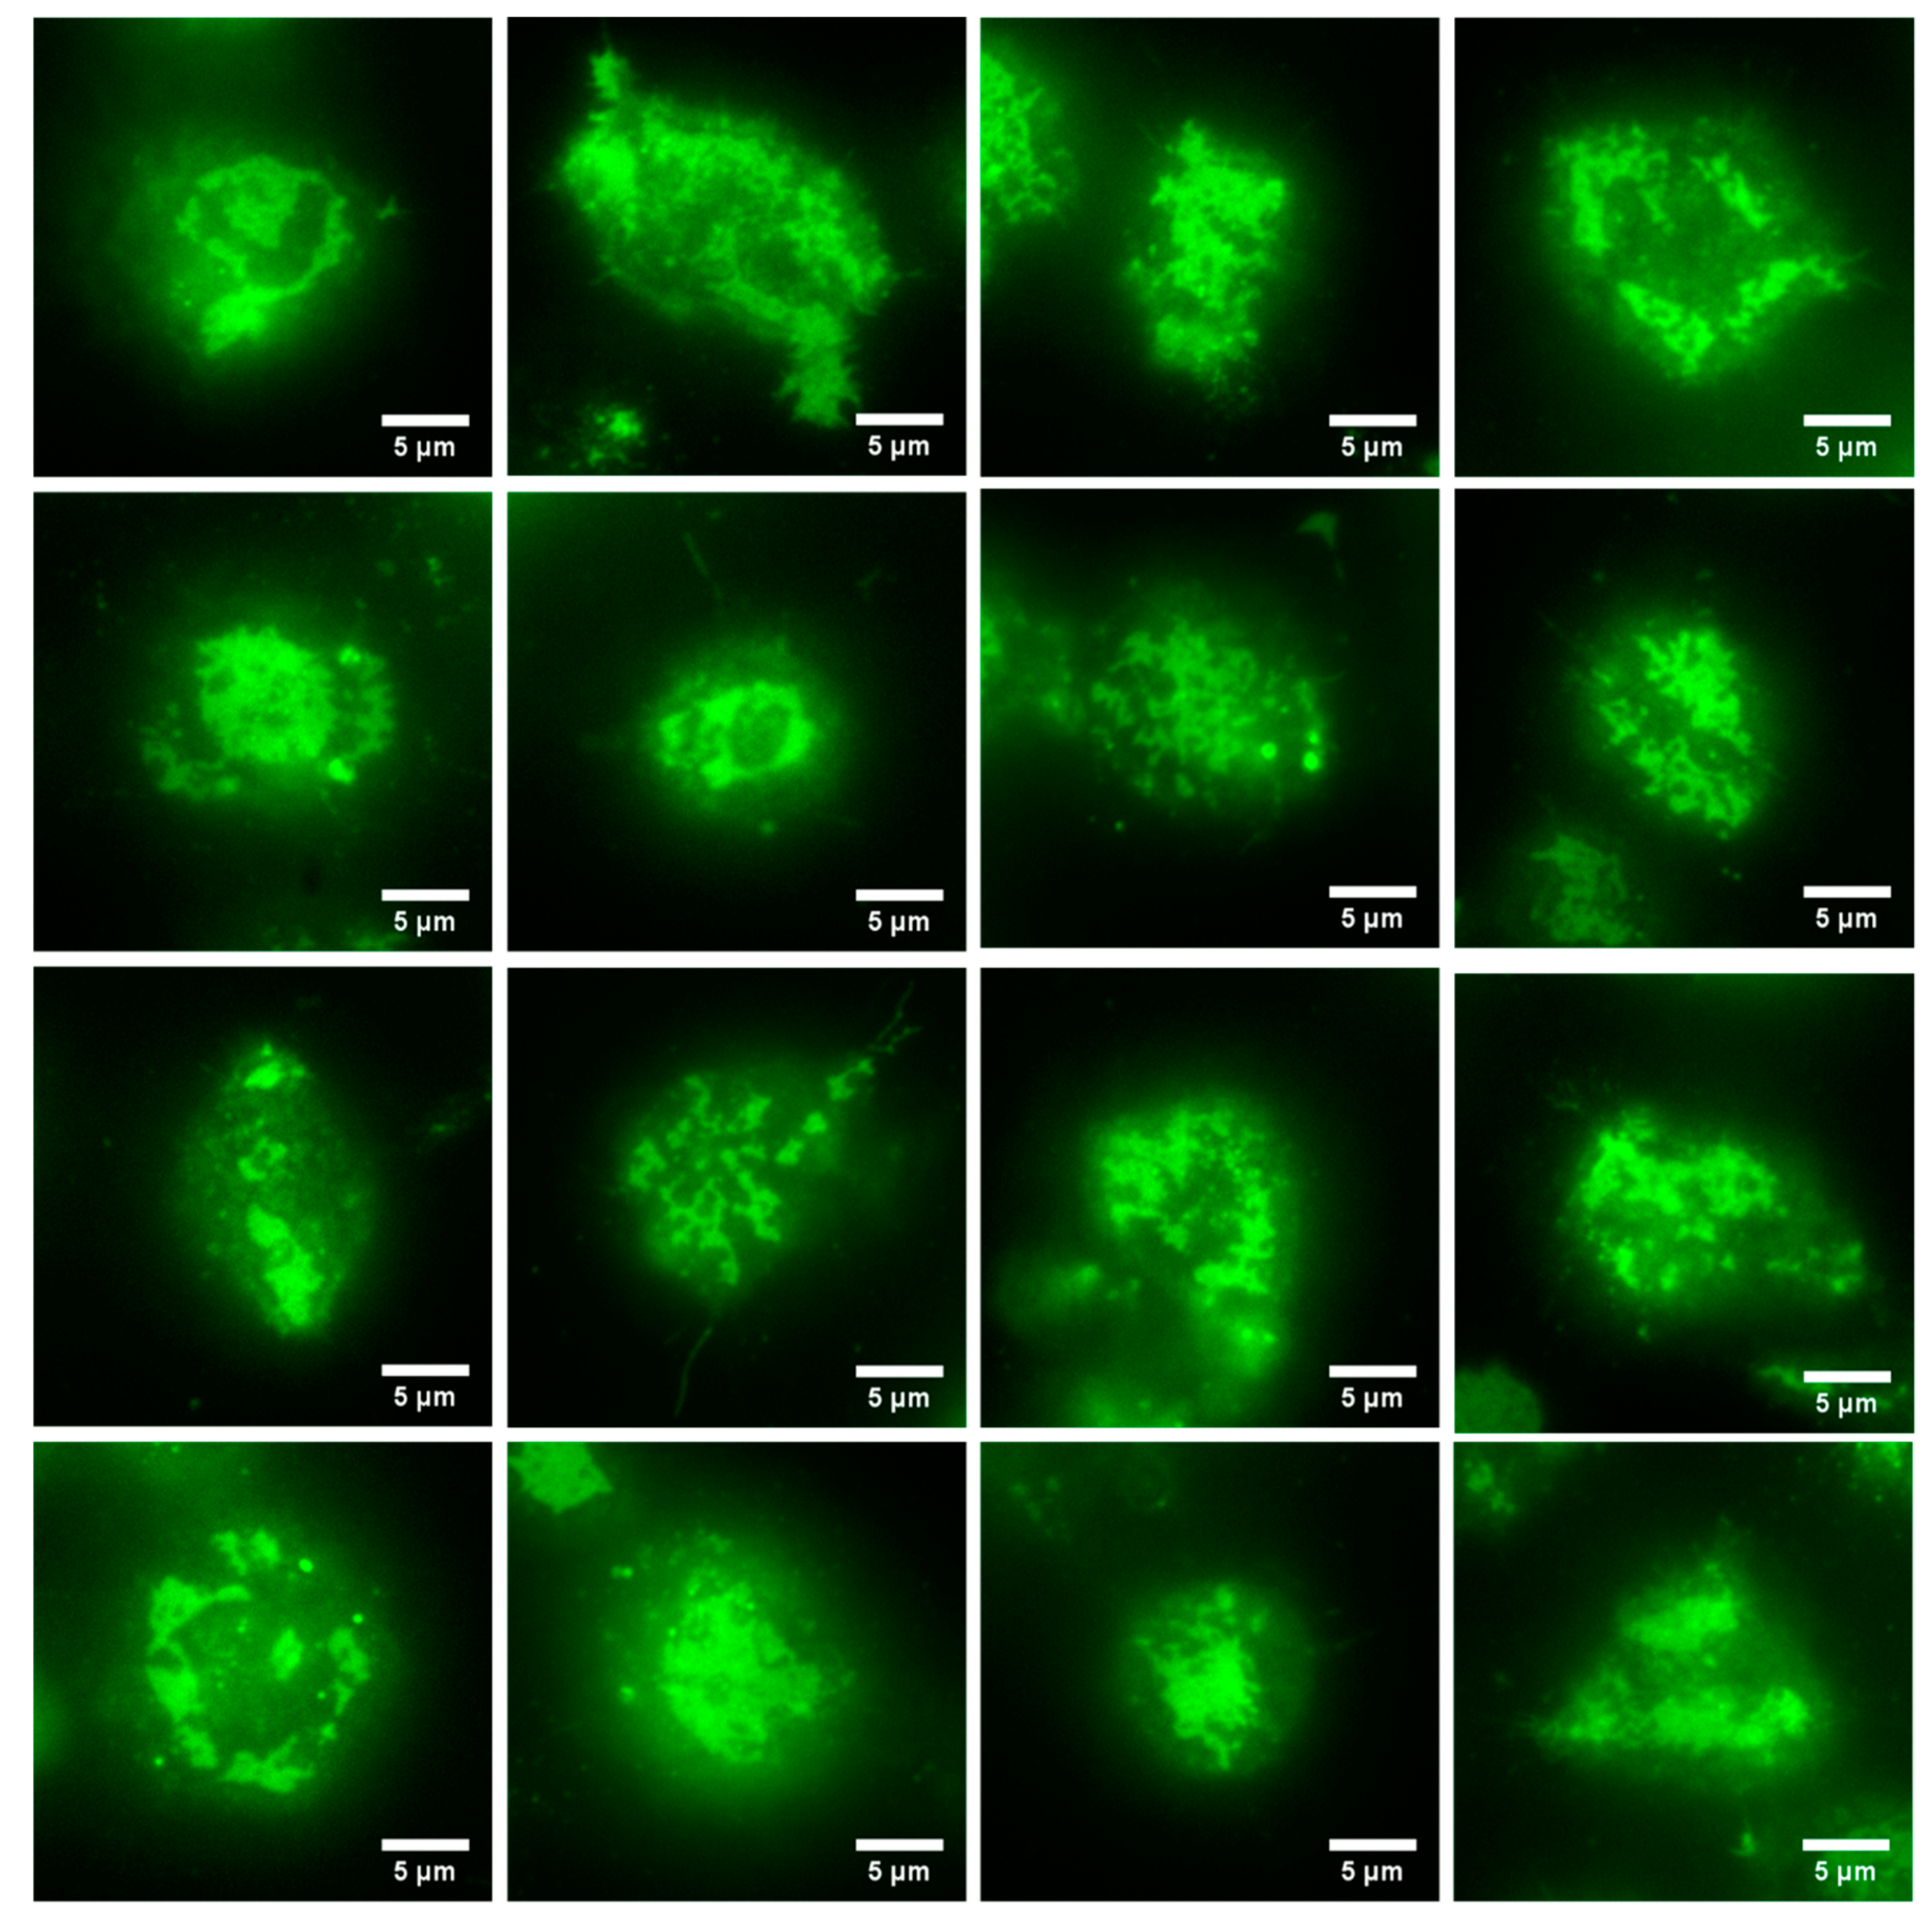
3.2. Formation of a FcεRI-Centric Synapse on A Supported Lipid Bilayer
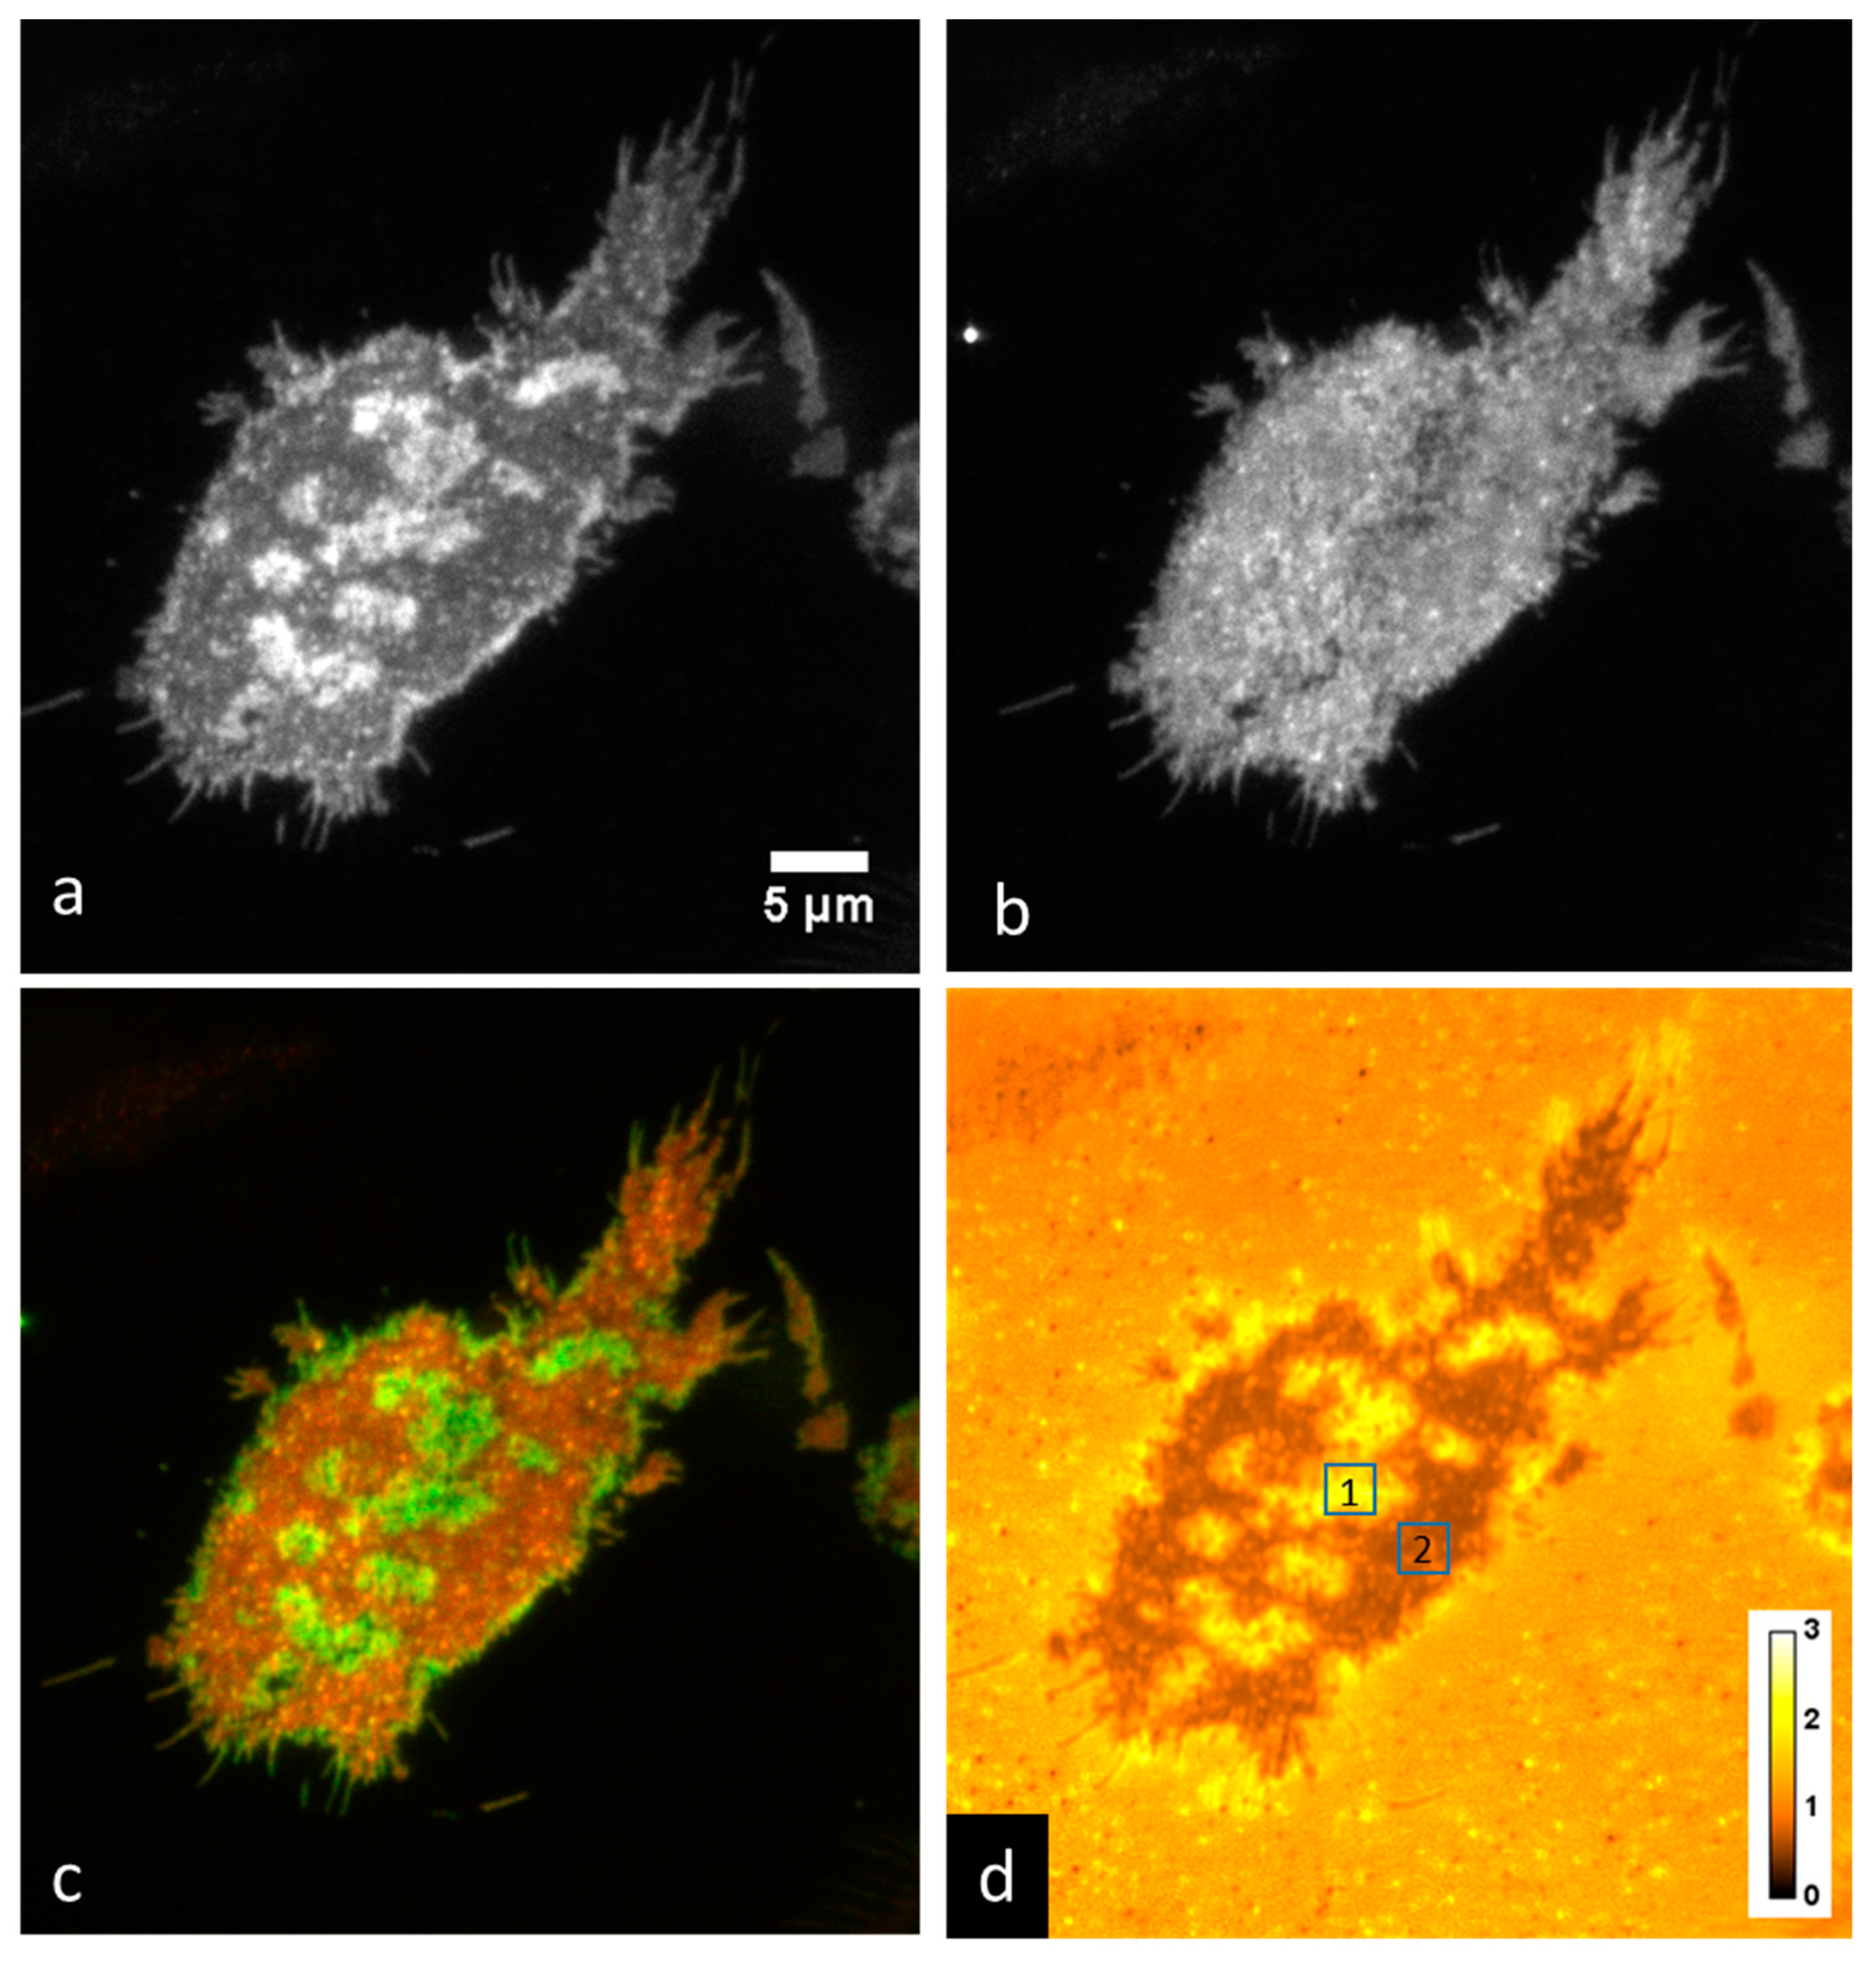
3.3. Imaging of IgE-488 Labeled FcεRI with Simultaneous Imaging of Membrane Curvature
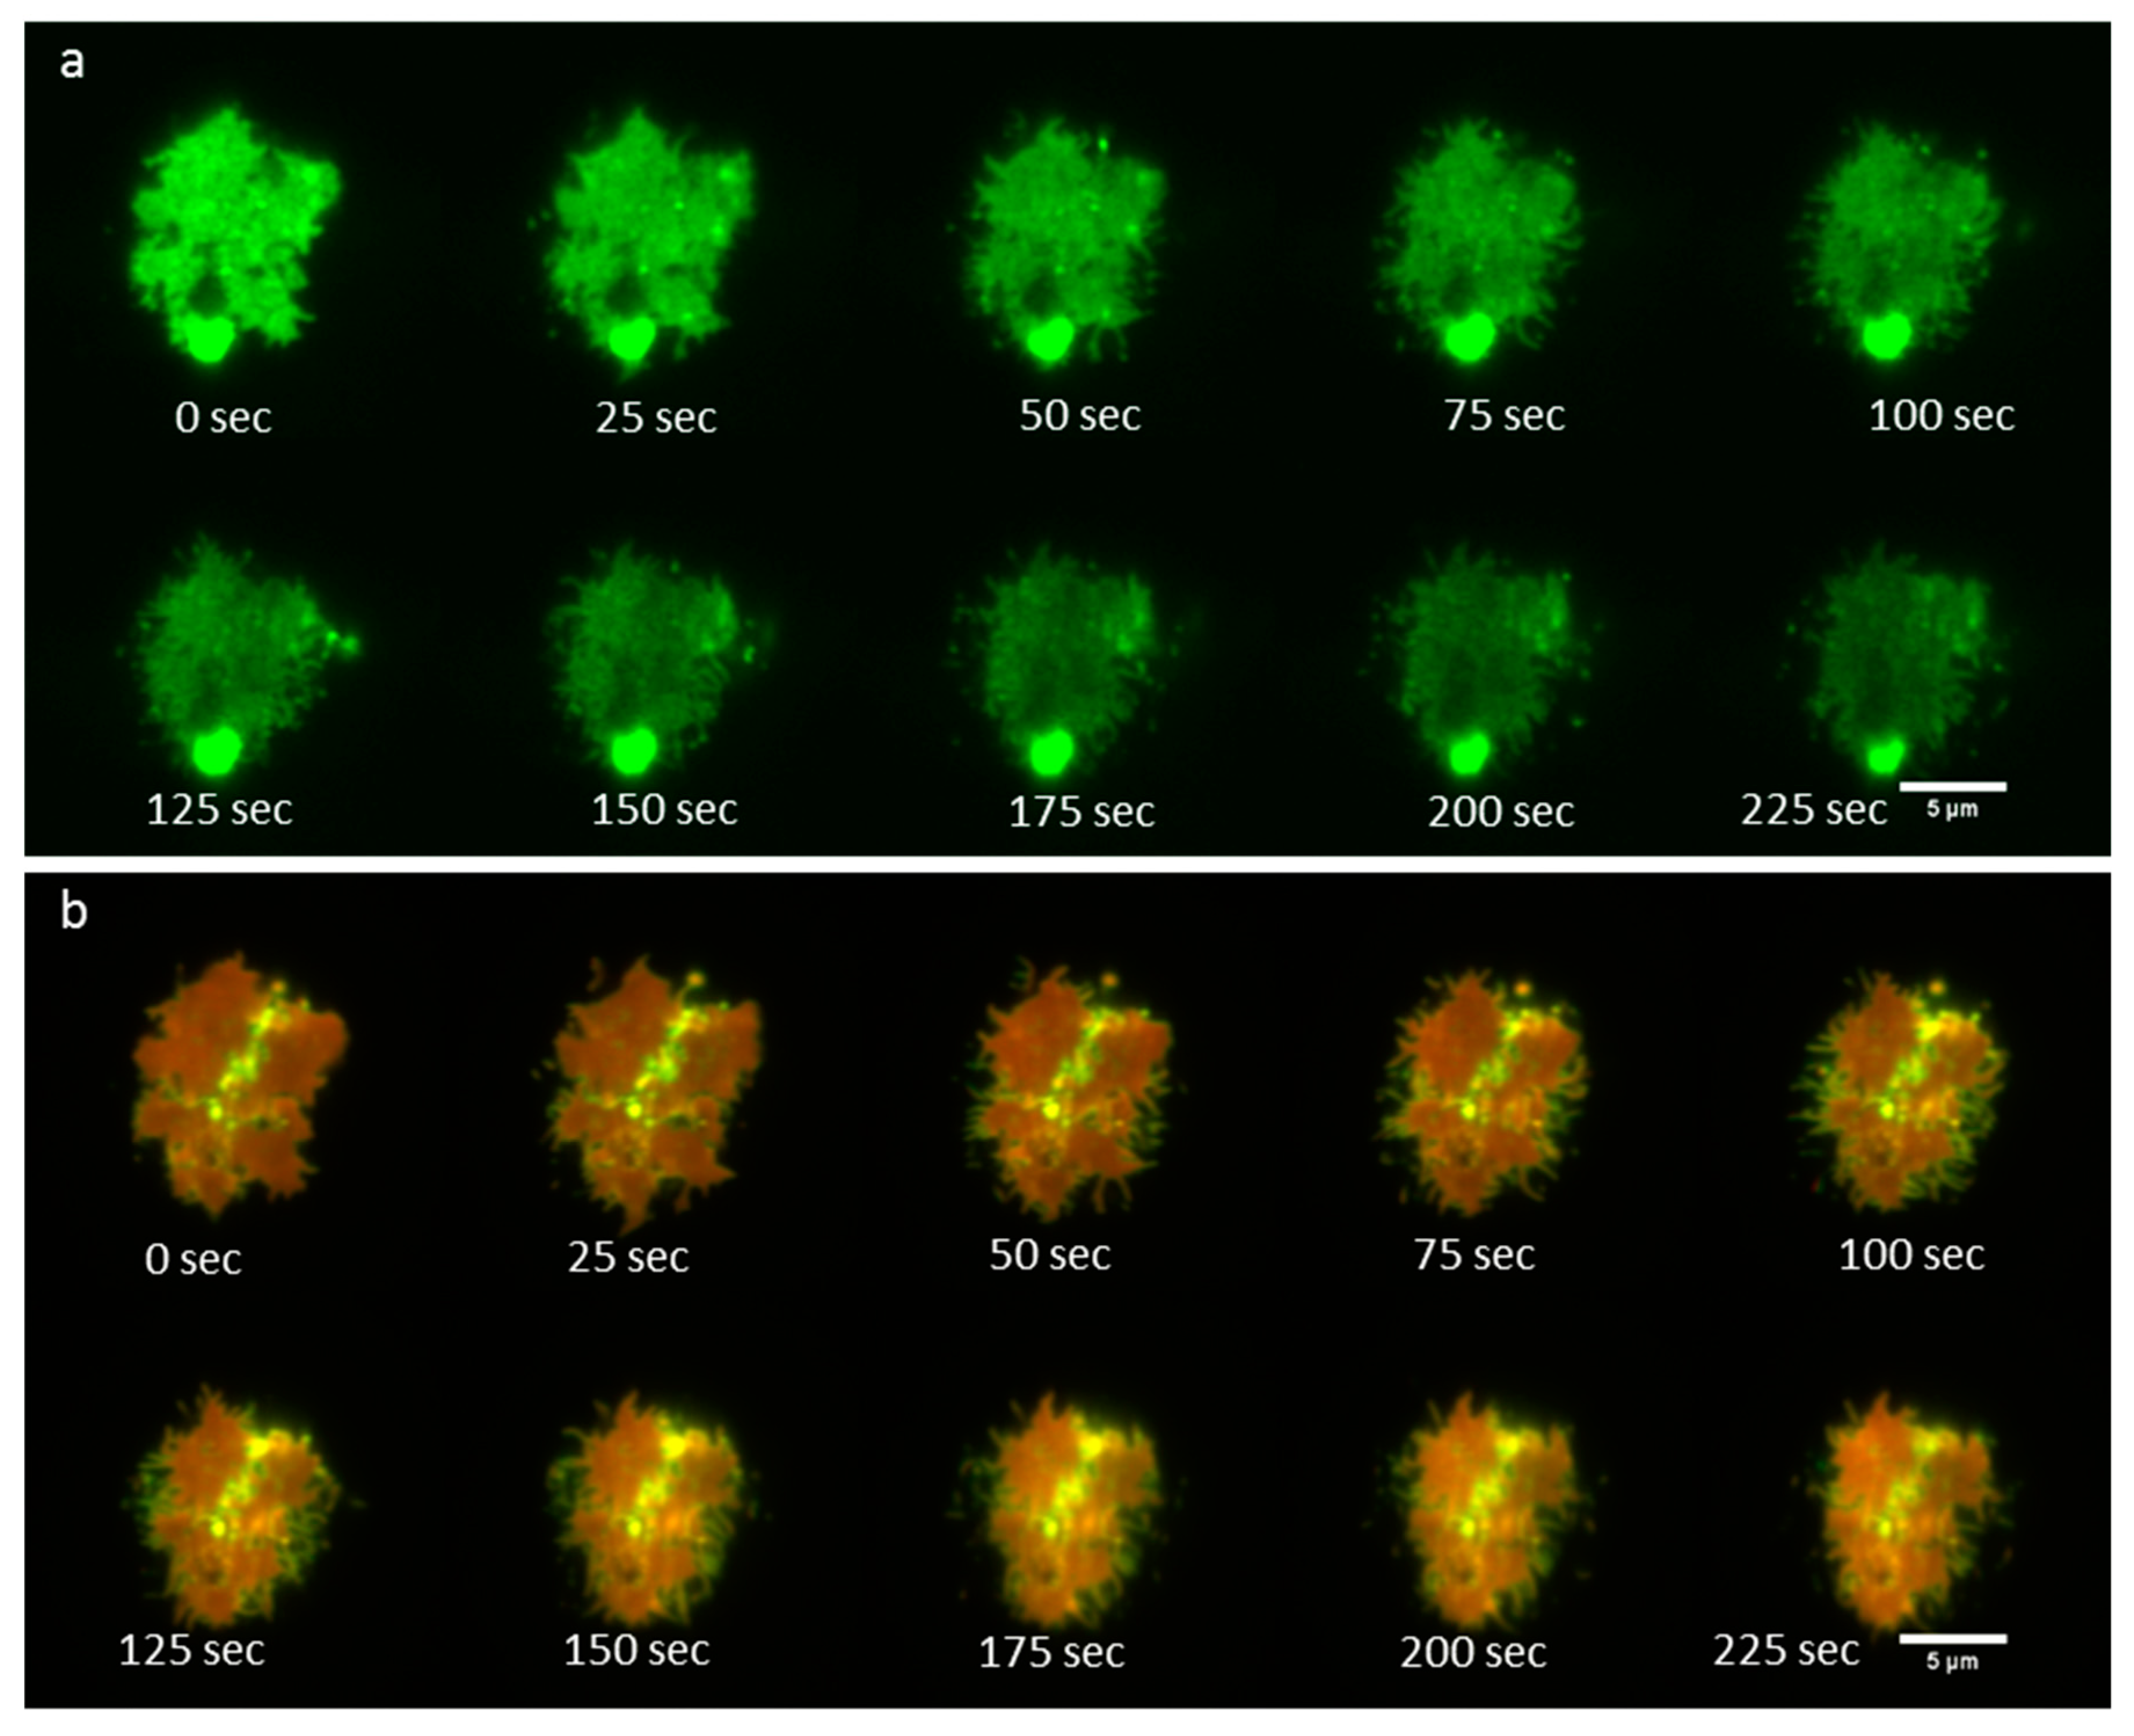
3.4. Time-Lapse Imaging of A FcεRI-Centric Synapse
4. Discussion
Supplementary Materials
Author Contributions
Funding
Conflicts of Interest
References
- Monks, C.R.F.; Freiberg, B.A.; Kupfer, H.; Sciaky, N.; Kupfer, A. Three-dimensional segregation of supramolecular activation clusters in T cells. Nature 1998, 395, 82–86. [Google Scholar] [CrossRef] [PubMed]
- Kaizuka, Y.; Douglass, A.D.; Varma, R.; Dustin, M.L.; Vale, R.D. Mechanisms for segregating T cell receptor and adhesion molecules during immunological synapse formation in Jurkat T cells. Proc. Natl. Acad. Sci. USA 2007, 104, 20296–20301. [Google Scholar] [CrossRef] [PubMed]
- Carroll-Portillo, A.; Cannon, J.L.; Te Riet, J.; Holmes, A.; Kawakami, Y.; Kawakami, T.; Cambi, A.; Lidke, D.S. Mast cells and dendritic cells form synapses that facilitate antigen transfer for T cell activation. J. Cell Biol. 2015, 210, 851–864. [Google Scholar] [CrossRef] [PubMed]
- Mantri, C.K.; John, A.L., St. Immune synapses between mast cells and γδ T cells limit viral infection. J. Clin. Investig. 2019, 129, 1094–1108. [Google Scholar] [CrossRef] [PubMed]
- Carroll-Portillo, A.; Spendier, K.; Pfeiffer, J.; Griffiths, G.; Li, H.; Lidke, K.A.; Oliver, J.M.; Lidke, D.S.; Thomas, J.L.; Wilson, B.S.; et al. Formation of a mast cell synapse: Fc epsilon RI membrane dynamics upon binding mobile or immobilized ligands on surfaces. J. Immunol. 2010, 184, 1328–1338. [Google Scholar] [CrossRef] [PubMed]
- Spendier, K.; Lidke, K.A.; Lidke, D.S.; Thomas, J.L. Single-particle tracking of immunoglobulin E receptors (FcεRI) in micron-sized clusters and receptor patches. FEBS Lett. 2012, 586, 416–421. [Google Scholar] [CrossRef] [PubMed]
- Spendier, K.; Carroll-Portillo, A.; Lidke, K.A.; Wilson, B.S.; Timlin, J.A.; Thomas, J.L. Distribution and dynamics of rat basophilic leukemia immunoglobulin E receptors (FcepsilonRI) on planar ligand-presenting surfaces. Biophys. J. 2010, 99, 388–397. [Google Scholar] [CrossRef]
- Song, J.; Hagen, G.M.; Roess, D.A.; Pecht, I.; Barisas, B.G. The mast cell function-associated antigen and its interactions with the type I FcE receptor. Biochemistry 2002, 41, 881–889. [Google Scholar] [CrossRef]
- Balakrishnan, K.; Hsu, F.J.; Cooper, A.D.; McConnell, H.M. Lipid hapten containing membrane targets can trigger specific immunoglobulin E-dependent degranulation of rat basophil leukemia cells. J. Biol. Chem. 1982, 257, 6427–6433. [Google Scholar]
- Thomas, J.L.; Feder, T.J.; Webb, W.W. Effects of protein concentration on IgE receptor mobility in rat basophilic leukemia cell plasma membranes. Biophys. J. 1992, 61, 1402–1412. [Google Scholar] [CrossRef][Green Version]
- Weis, R.M.; Balakrishnan, K.; Smith, B.A.; Mcconnell, H.M.; Smithy, B.A.; Mcconnell, H.M. Stimulation of fluorescence in a small contact region between rat basophil leukemia cells and planar lipid membrane targets by coherent evanescent radiation. J. Biol. Chem. 1982, 257, 6440–6445. [Google Scholar] [PubMed]
- Pfeiffer, J.R.; Seagrave, J.C.; Davis, B.H.; Deanin, G.G.; Oliver, J.M. Membrane and cytoskeletal changes associated with IgE-mediated serotonin release from rat basophilic leukemia cells. J. Cell Biol. 1985, 101, 2145–2155. [Google Scholar] [CrossRef] [PubMed]
- Bassereau, P.; Jin, R.; Baumgart, T.; Deserno, M.; Dimova, R.; Frolov, V.A.; Bashkirov, P.V.; Grubmüller, H.; Jahn, R.; Risselada, H.J.; et al. The 2018 biomembrane curvature and remodeling roadmap. J. Phys. D Appl. Phys. 2018, 51, 343001. [Google Scholar] [CrossRef] [PubMed]
- Spendier, K. N-terminal amphipathic helix of Amphiphysin can change the spatial distribution of immunoglobulin E receptors (FcεRI) in the RBL-2H3 mast cell synapse. Results Immunol. 2016, 6, 1–4. [Google Scholar] [CrossRef] [PubMed][Green Version]
- Schmick, M.; Bastiaens, P.I.H. The interdependence of membrane shape and cellular signal processing. Cell 2014, 156, 1132–1138. [Google Scholar] [CrossRef] [PubMed]
- Axelrod, D. Carbocyanine dye orientation in red cell membrane studied by microscopic fluorescence polarization. Biophys. J. 1979, 26, 557–573. [Google Scholar] [CrossRef]
- Sund, S.E.; Swanson, J.A.; Axelrod, D. Cell membrane orientation visualized by polarized total internal reflection fluorescence. Biophys. J. 1999, 77, 2266–2283. [Google Scholar] [CrossRef]
- Axelrod, D. Chapter 7: Total internal reflection fluorescence microscopy. Methods Cell Biol. 2008, 89, 169–221. [Google Scholar] [PubMed]
- Passmore, D.R.; Rao, T.C.; Peleman, A.R.; Anantharam, A. Imaging plasma membrane deformations with pTIRFM. J. Vis. Exp. 2014, 86, e51334. [Google Scholar] [CrossRef]
- Anantharam, A.; Axelrod, D.; Holz, R.W. Real-time imaging of plasma membrane deformations reveals pre-fusion membrane curvature changes and a role for dynamin in the regulation of fusion pore expansion. J. Neurochem. 2012, 122, 661–671. [Google Scholar] [CrossRef]
- Anantharam, A.; Axelrod, D.; Holz, R.W. Polarized TIRFM reveals changes in plasma membrane topology before and during granule fusion. Cell. Mol. Neurobiol. 2010, 30, 1343–1349. [Google Scholar] [CrossRef] [PubMed][Green Version]
- Anantharam, A.; Onoa, B.; Edwards, R.H.; Holz, R.W.; Axelrod, D. Localized topological changes of the plasma membrane upon exocytosis visualized by polarized TIRFM. J. Cell Biol. 2010, 188, 415–428. [Google Scholar] [CrossRef] [PubMed]
- Johnson, D.S.; Toledo-Crow, R.; Mattheyses, A.L.; Simon, S.M. Polarization-controlled TIRFM with focal drift and spatial field intensity correction. Biophys. J. 2014, 106, 1008–1019. [Google Scholar] [CrossRef] [PubMed][Green Version]
- Oreopoulos, J.; Yip, C.M. Probing membrane order and topography in supported lipid bilayers by combined polarized total internal reflection fluorescence-atomic force microscopy. Biophys. J. 2009, 96, 1970–1984. [Google Scholar] [CrossRef] [PubMed]
- Ramirez, D.M.C.; Jakubek, Z.J.; Lu, Z.; Ogilvie, W.W.; Johnston, L.J. Changes in order parameters associated with ceramide-mediated membrane reorganization measured using pTIRFM. Langmuir 2013, 29, 15907–15918. [Google Scholar] [CrossRef] [PubMed][Green Version]
- Werner, J.H.; Montaño, G.A.; Garcia, A.L.; Zurek, N.A.; Akhadov, E.A.; Lopez, G.P.; Shreve, A.P. Formation and Dynamics of Supported Phospholipid Membranes on a Periodic Nanotextured Substrate. Langmuir 2009, 25, 2986–2993. [Google Scholar] [CrossRef] [PubMed]
- Edelstein, A.; Amodaj, N.; Hoover, K.; Vale, R.; Stuurman, N. Computer control of microscopes using µManager. Curr. Protoc. Mol. Biol. 2010, 92, 14.20.1–14.20.17. [Google Scholar]
- Edelstein, A.D.; Tsuchida, M.A.; Amodaj, N.; Pinkard, H.; Vale, R.D.; Stuurman, N. Advanced methods of microscope control using μManager software. J. Biol. Methods 2014. [Google Scholar] [CrossRef]
- Friedman, L.J.; Chung, J.; Gelles, J. Viewing dynamic assembly of molecular complexes by multi-wavelength single-molecule fluorescence. Biophys. J. 2006, 91, 1023–1031. [Google Scholar] [CrossRef]
- Ellefsen, K.L.; Dynes, J.L.; Parker, I. Spinning-spot shadowless TIRF microscopy. PLoS ONE 2015, 10, e0136055. [Google Scholar] [CrossRef]
- Hendriks, C.L.L.; van Vliet, L.J.; Rieger, B.; van Kempen, G.M.P.; van Ginkel, M. Dipimage: A Scientific Image Processing Toolbox for MATLAB; Quantitative Imaging Group, Faculty of Applied Sciences, Delft University of Technology: Delft, The Netherlands, 1999. [Google Scholar]
- Pospíšil, J.; Lukeš, T.; Bendesky, J.; Fliegel, K.; Spendier, K.; Hagen, G.M. Imaging tissues and cells beyond the diffraction limit with structured illumination microscopy and Bayesian image reconstruction. Gigascience 2019, 8, giy126. [Google Scholar] [CrossRef] [PubMed]
- Gustafsson, M.G.L. Surpassing the lateral resolution limit by a factor of two using structured illumination microscopy. J. Microsc. 2000, 198, 82–87. [Google Scholar] [CrossRef] [PubMed]
- Ovesný, M.; Křížek, P.; Borkovec, J.; Švindrych, Z.; Hagen, G.M. ThunderSTORM: A comprehensive ImageJ plug-in for PALM and STORM data analysis and super-resolution imaging. Bioinformatics 2014, 30, 2389–2390. [Google Scholar] [CrossRef] [PubMed]
- Rust, M.J.; Bates, M.; Zhuang, X. Sub-diffraction-limit imaging by stochastic optical reconstruction microscopy (STORM). Nat. Methods 2006, 3, 793–795. [Google Scholar] [CrossRef] [PubMed]


© 2019 by the authors. Licensee MDPI, Basel, Switzerland. This article is an open access article distributed under the terms and conditions of the Creative Commons Attribution (CC BY) license (http://creativecommons.org/licenses/by/4.0/).
Share and Cite
Machado, R.; Bendesky, J.; Brown, M.; Spendier, K.; Hagen, G.M. Imaging Membrane Curvature inside a FcεRI-Centric Synapse in RBL-2H3 Cells Using TIRF Microscopy with Polarized Excitation. J. Imaging 2019, 5, 63. https://doi.org/10.3390/jimaging5070063
Machado R, Bendesky J, Brown M, Spendier K, Hagen GM. Imaging Membrane Curvature inside a FcεRI-Centric Synapse in RBL-2H3 Cells Using TIRF Microscopy with Polarized Excitation. Journal of Imaging. 2019; 5(7):63. https://doi.org/10.3390/jimaging5070063
Chicago/Turabian StyleMachado, Rosa, Justin Bendesky, Madison Brown, Kathrin Spendier, and Guy M. Hagen. 2019. "Imaging Membrane Curvature inside a FcεRI-Centric Synapse in RBL-2H3 Cells Using TIRF Microscopy with Polarized Excitation" Journal of Imaging 5, no. 7: 63. https://doi.org/10.3390/jimaging5070063
APA StyleMachado, R., Bendesky, J., Brown, M., Spendier, K., & Hagen, G. M. (2019). Imaging Membrane Curvature inside a FcεRI-Centric Synapse in RBL-2H3 Cells Using TIRF Microscopy with Polarized Excitation. Journal of Imaging, 5(7), 63. https://doi.org/10.3390/jimaging5070063