Article

Developing Forest Cover Composites through a Combination of Landsat-8 Optical and Sentinel-1 SAR Data for the Visualization and Extraction of Forested Areas

1
Department of Informatics, Tokyo University of Information Sciences, 4-1 Onaridai, Wakaba-ku, Chiba 265-8501, Japan
2
Center for Environmental Remote Sensing (CEReS), Chiba University, 1-33 Yayoi-cho, Inage-ku, Chiba 263-8522, Japan
*
Author to whom correspondence should be addressed.
J. Imaging 2018, 4(9), 105; https://doi.org/10.3390/jimaging4090105
Submission received: 25 June 2018 / Revised: 21 August 2018 / Accepted: 23 August 2018 / Published: 26 August 2018

Abstract

:
Mapping the distribution of forested areas and monitoring their spatio-temporal changes are necessary for the conservation and management of forests. This paper presents two new image composites for the visualization and extraction of forest cover. By exploiting the Landsat-8 satellite-based multi-temporal and multi-spectral reflectance datasets, the Forest Cover Composite (FCC) was designed in this research. The FCC is an RGB (red, green, blue) color composite made up of short-wave infrared reflectance and green reflectance, specially selected from the day when the Normalized Difference Vegetation Index (NDVI) is at a maximum, as the red and blue bands, respectively. The annual mean NDVI values are used as the green band. The FCC is designed in such a way that the forested areas appear greener than other vegetation types, such as grasses and shrubs. On the other hand, the croplands and barren lands are usually seen as red and water/snow is seen as blue. However, forests may not necessarily be greener than other perennial vegetation. To cope with this problem, an Enhanced Forest Cover Composite (EFCC) was designed by combining the annual median backscattering intensity of the VH (vertical transmit, horizontal receive) polarization data from the Sentinel-1 satellite with the green term of the FCC to suppress the green component (mean NDVI values) of the FCC over the non-forested vegetative areas. The performances of the FCC and EFCC were evaluated for the discrimination and classification of forested areas all over Japan with the support of reference data. The FCC and EFCC provided promising results, and the high-resolution forest map newly produced in the research provided better accuracy than the extant MODIS (Moderate Resolution Imaging Spectroradiometer) Land Cover Type product (MCD12Q1) in Japan. The composite images proposed in the research are expected to improve forest monitoring activities in other regions as well.

1. Introduction

Forests are the prominent terrestrial plant communities dominated by trees, and they are essential for sustaining the life on Earth. Forests have been in a constant state of change with a variety of natural, climatic, and anthropogenic factors worldwide [1,2,3]. The global forest area fell by 3% from 1990 (4128 M ha) to 2015 (3999 M ha); the rate of net forest loss between 2010 and 2015 was half that in the 1990s, and net forest loss mainly occurred in the tropics. Conversely, temperate forest area has increased. Meanwhile, rates of forest loss are highest in low income countries [4]. The unprecedented changes in forested areas due to human activities over the past couple of centuries have attracted great attention worldwide [5,6,7,8,9]. Up-to-date and precise information on forest cover dynamics is necessary to the conservation and management of forests as well as essential to a better understanding of future climates [10,11,12,13].
Over the past few decades, satellite remote sensing has been widely used for the detection and monitoring of vegetation and forested areas [14,15,16,17,18,19,20]. Spectral indices such as the combination of multiple spectral bands are one of the techniques mostly used for the detection and discrimination of forests. The Normalized Difference Vegetation Index (NDVI), proposed by Rouse et al. [21], is a widely used spectral index for the detection and mapping of vegetation. The NDVI is the normalized difference between the near infrared (Nir) and red (Red) reflectance. It has been used for the classification of land cover and forest types at broad spatial scales [22,23,24]. Many researchers have adopted the mapping of the forest cover from multi-temporal and moderate-resolution satellite data using a supervised classification approach with the support of training data [25,26,27]. Higher spatial resolution satellite data such as Landsat have also been utilized for forest mapping using supervised classifications [28,29]. Microwave satellite data combined with or without optical data have shown promise for forest mapping, especially in cloudy tropical regions [30,31,32].
The MODIS-based Land Cover Type product (MCD12Q1) is one of the recently available global land cover products from which forested areas can be extracted [33,34]. The MODIS Vegetation Continuous Fields product (MOD44B) also provides percent tree cover information globally [35]. Satellite remote sensing data have also been applicable for the estimation and monitoring of the gross and net primary production of vegetation globally [36], and a continuous decline of the net primary production has been reported [37]. The satellite-based estimates of vegetation productivity have also proven to be effective in quantifying forest productivity [38].
Large-scale forest mapping is a challenging field as forests exhibit diverse spectral characteristics and phenological variations. This paper proposes new composite images for the simultaneous visualization and discrimination of forested areas from other land cover types by exploiting multi-temporal optical and radar satellite data. The potential of the newly generated composite images for the discrimination and high-resolution mapping of forested areas in Japan is discussed.

2. Materials and Methods
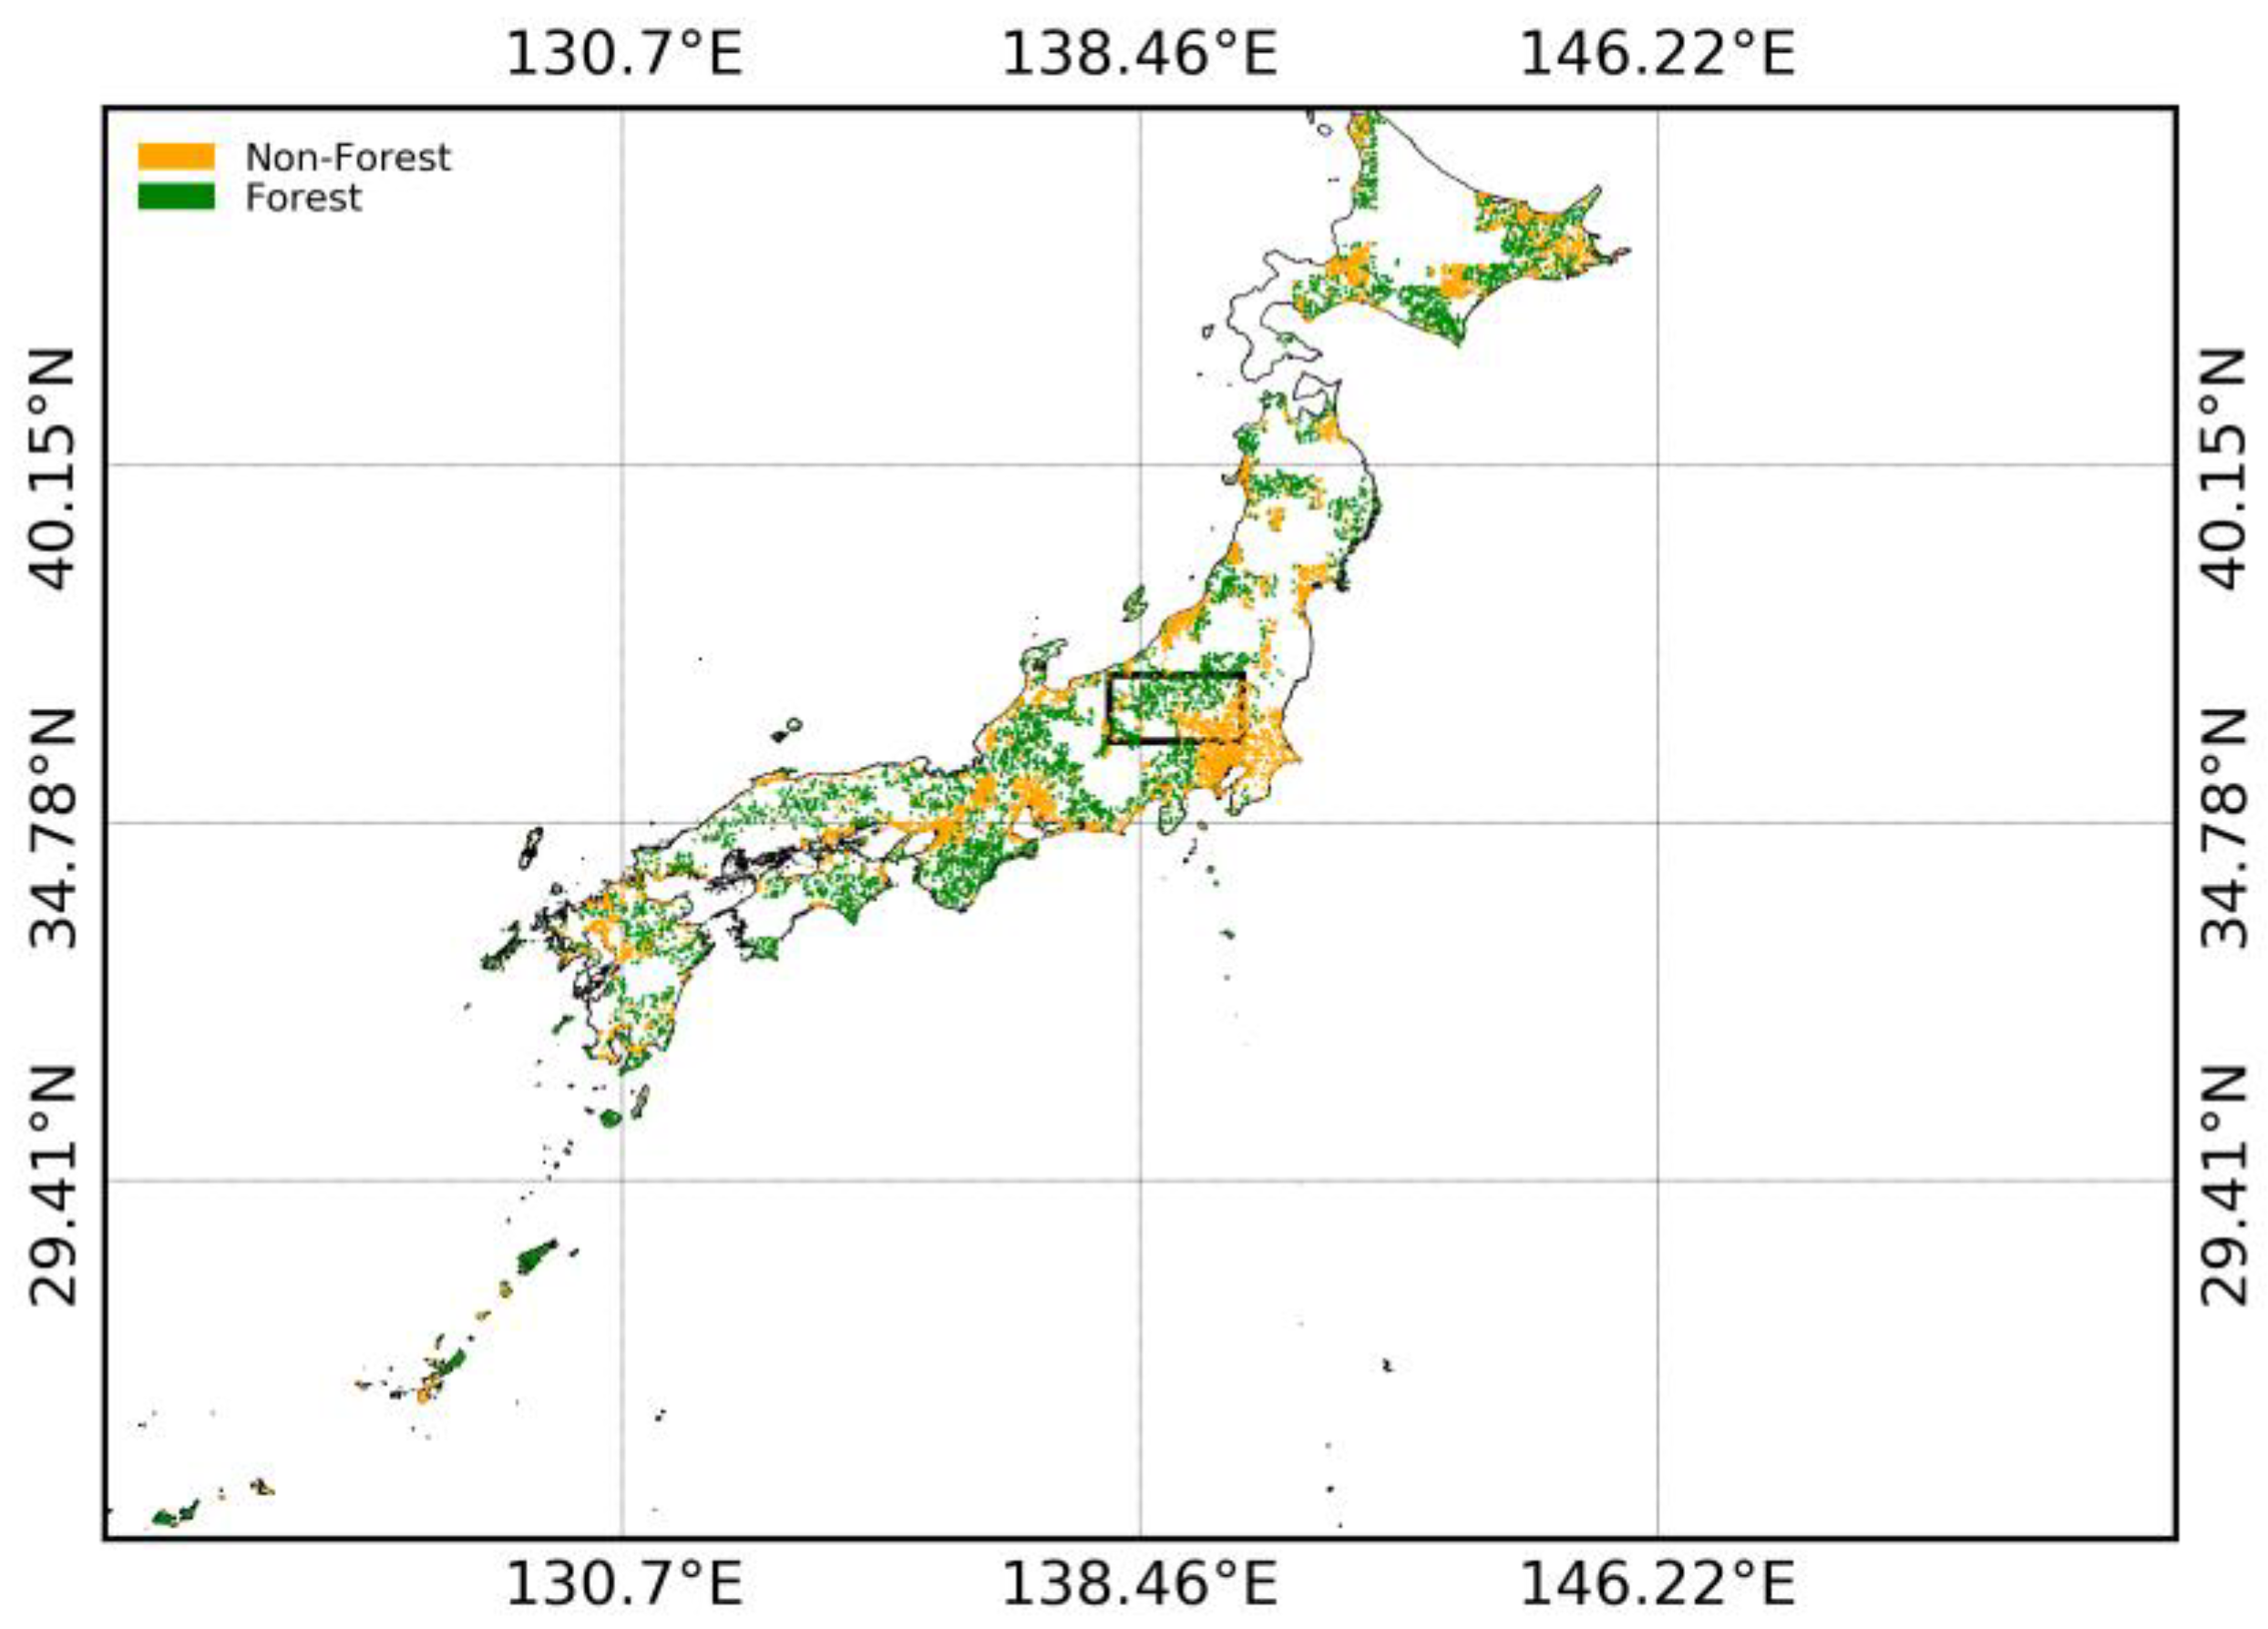
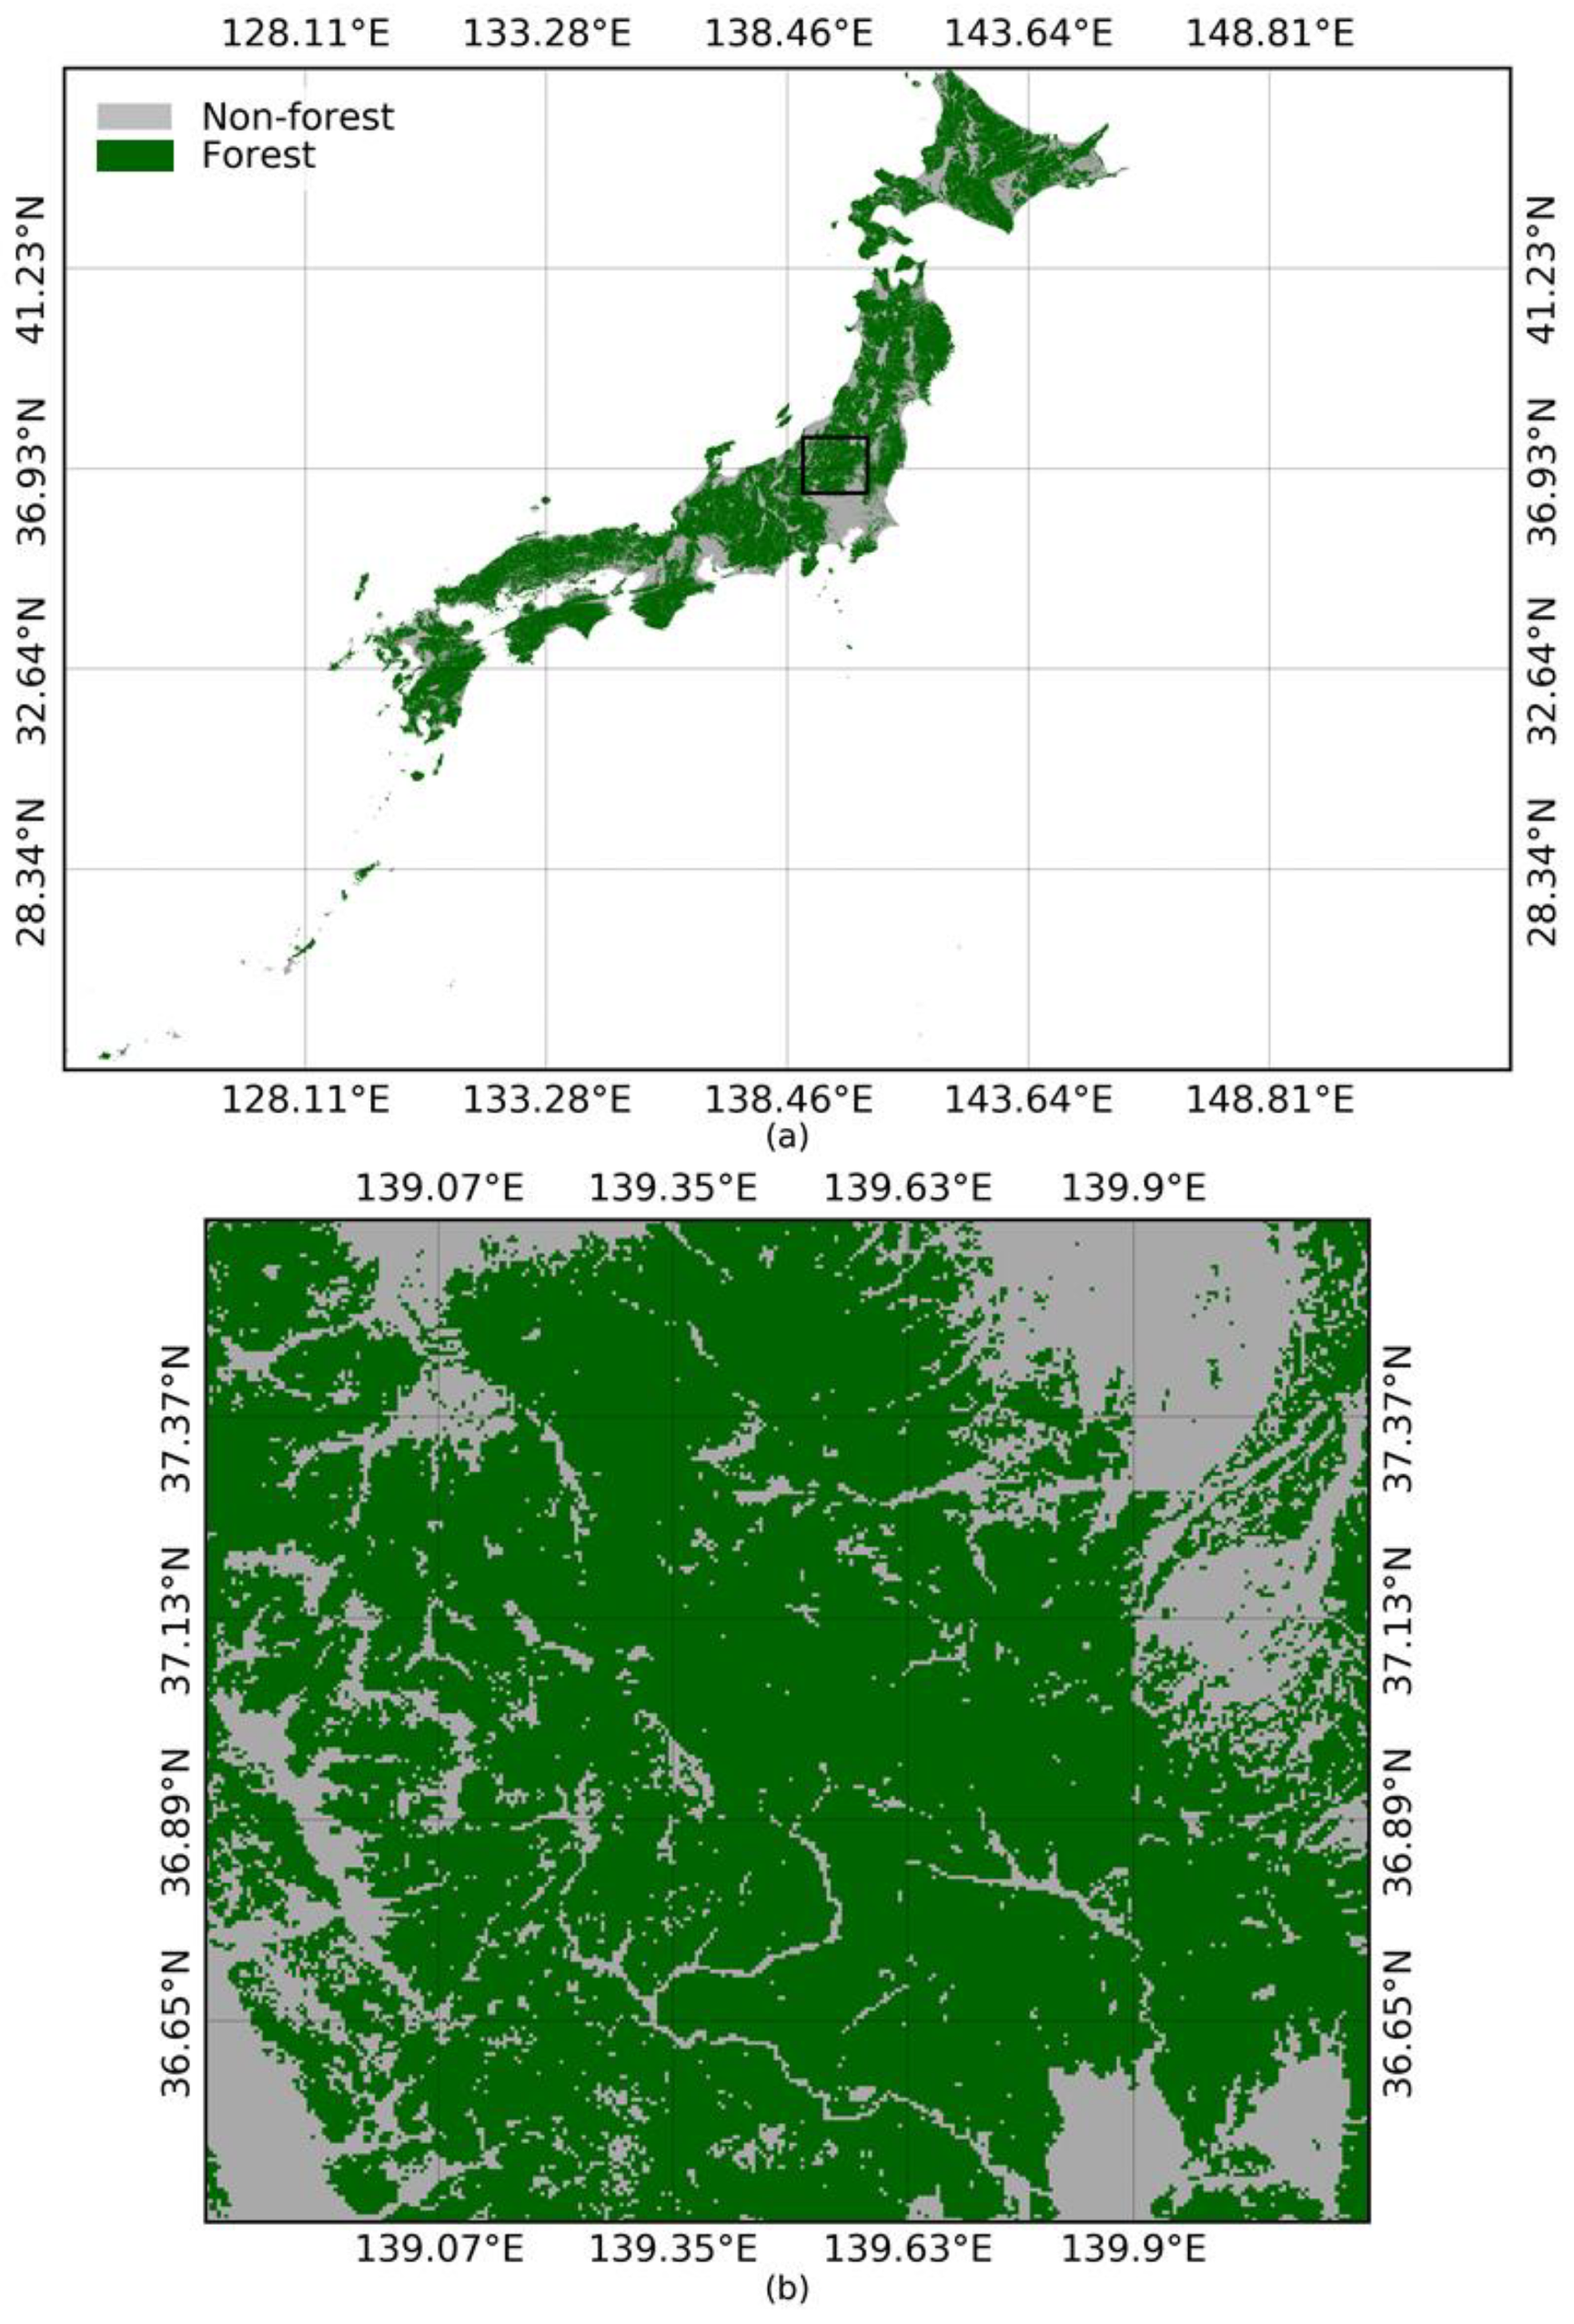
2.1. Study Area

The research was implemented for all of Japan, including the Ryukyu Islands. The climate of Japan is mostly temperate, though arctic and subtropical climates are found in the northern and southern parts, respectively. The annual mean temperature ranges from 0 °C (Hokkaido) to 18 °C (Kyushu), and the annual precipitation ranges from 600 mm to 4000 mm. Topographically, around 77% of land falls between 0 and 700 m elevation, whereas around 5% comprises highlands with an elevation over 1300 m. The study area is comprised of evergreen coniferous, evergreen broadleaf, deciduous coniferous, and deciduous broadleaf forest types.

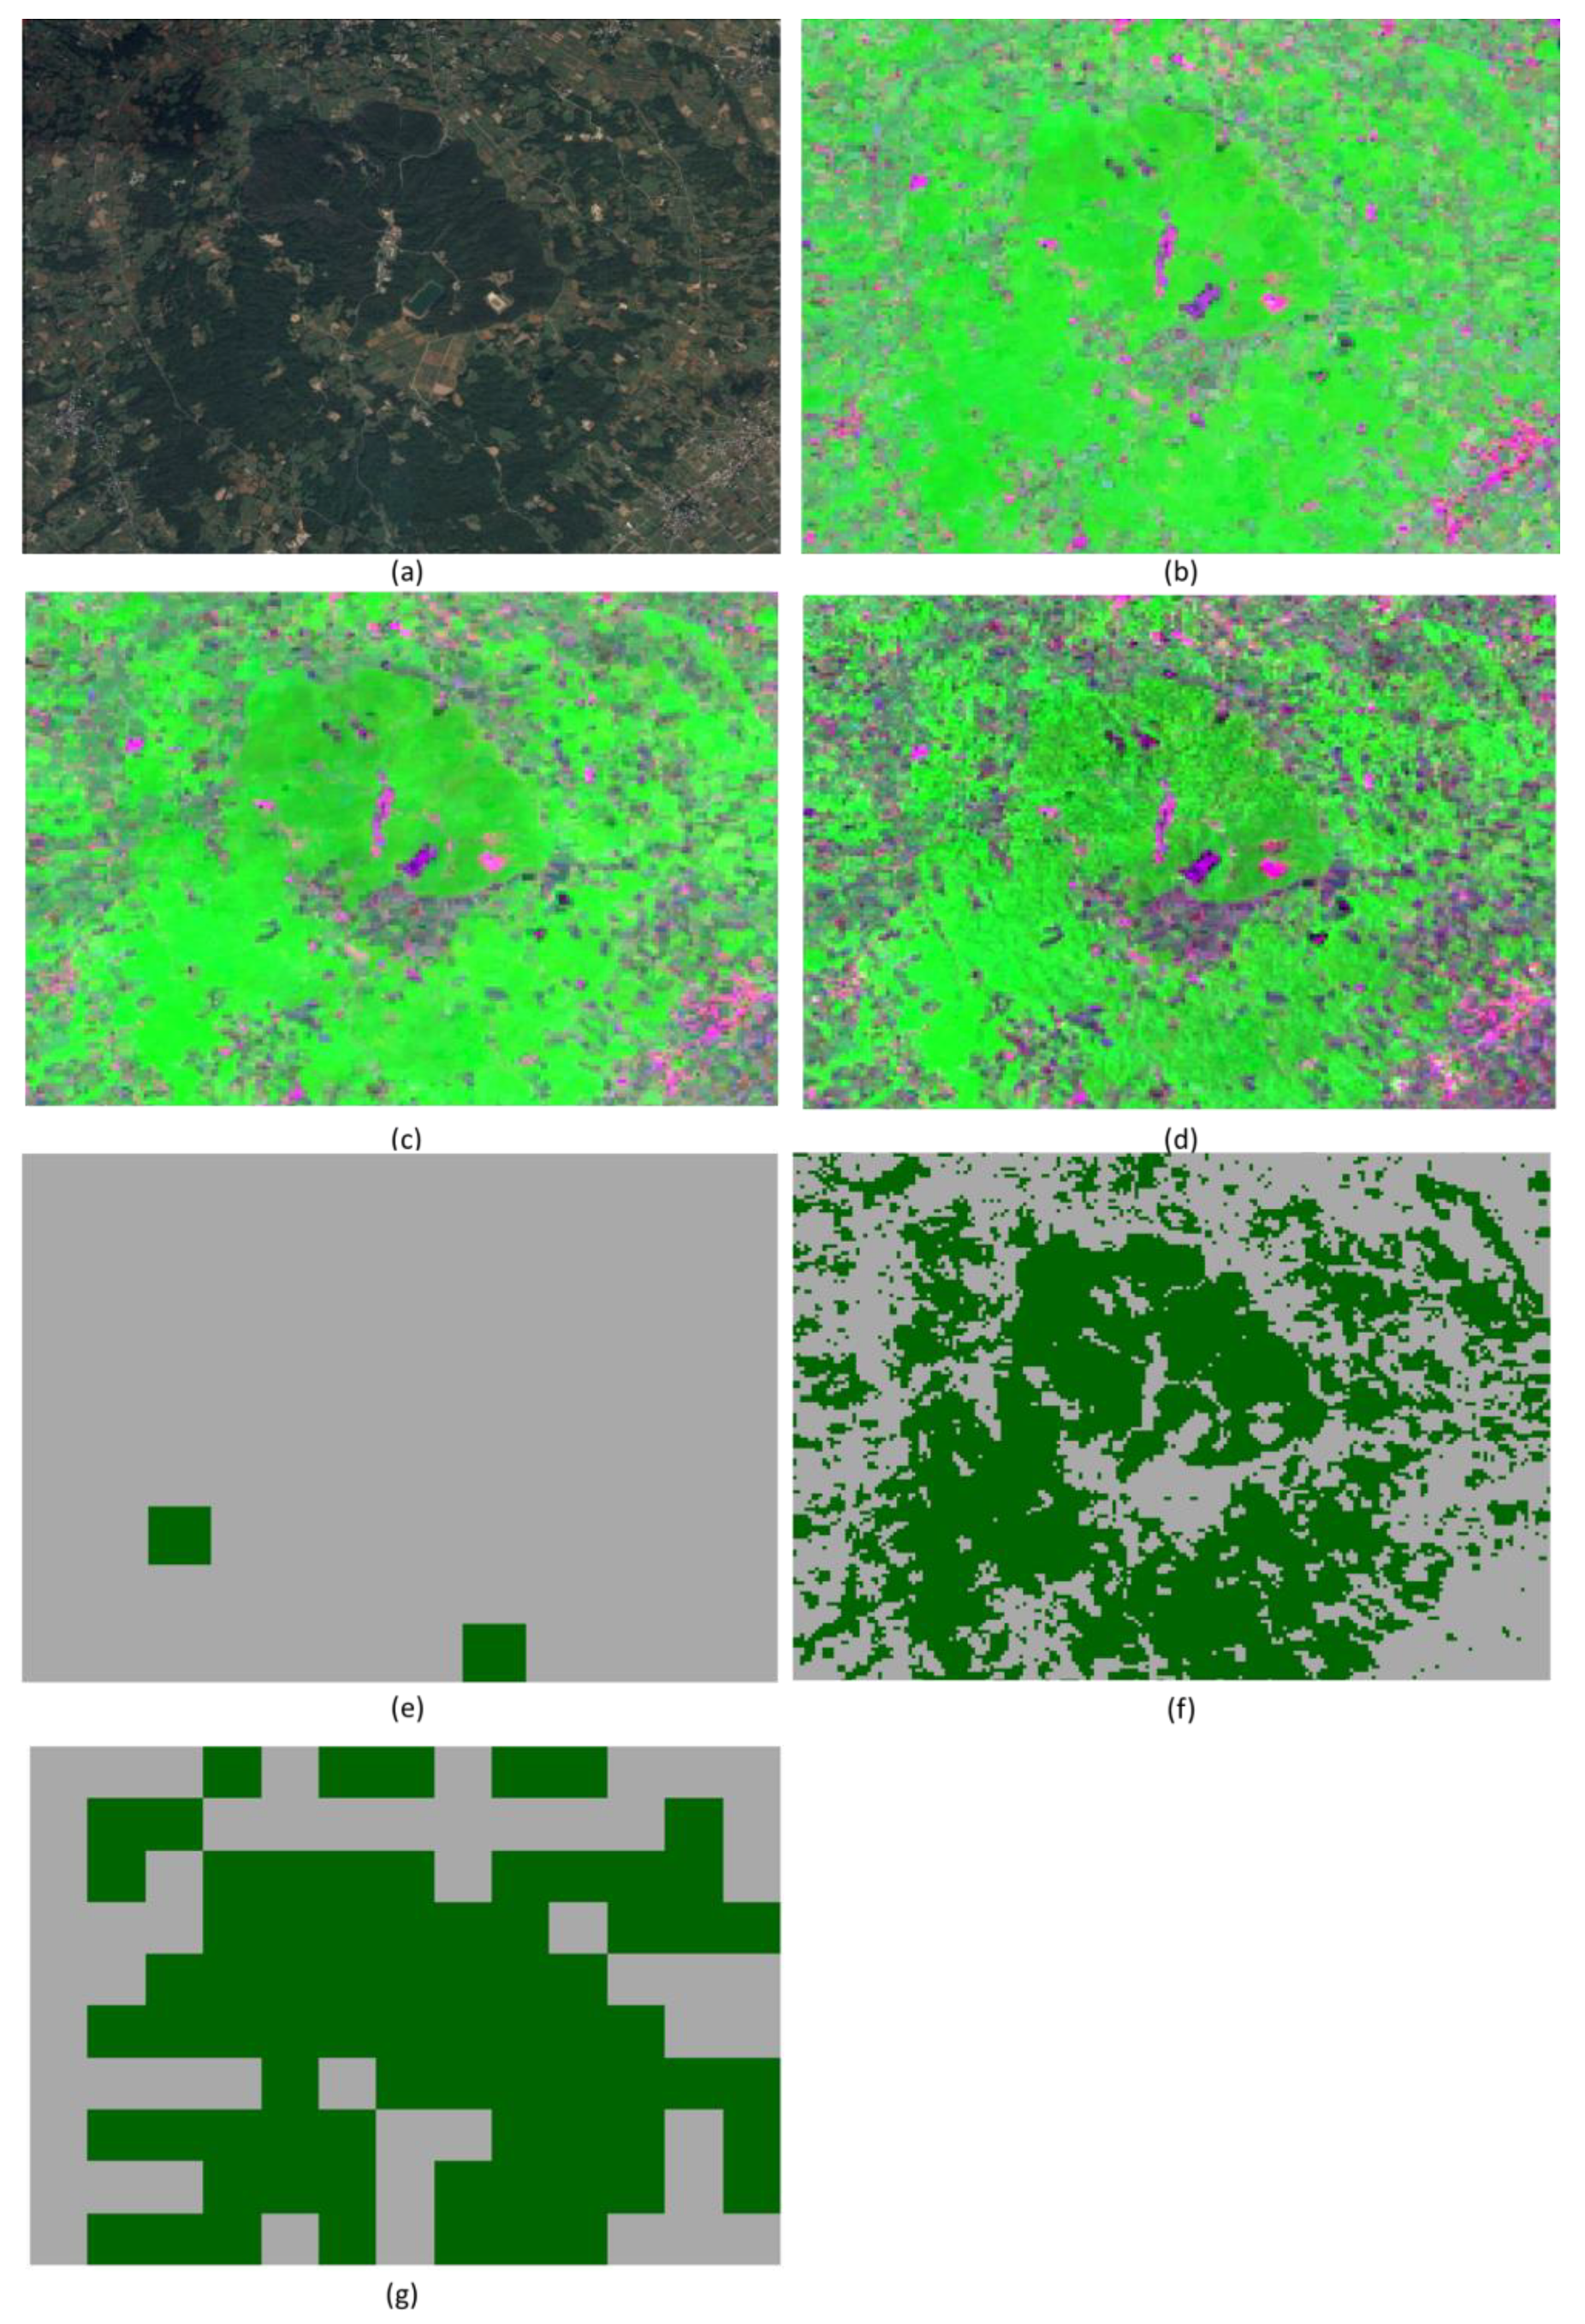
2.2. Image Compositing Technique

For the visualization and discrimination of forest cover, new RGB (red, green, and blue) color composites were designed in the research. They build on the Biophysical Image Composite (BIC) developed by Sharma et al. [39]. The BIC is a RGB color composite image made up of the Normalized Difference Vegetation Index (NDVI), shortwave infrared reflectance, and green reflectance, which were specially selected from the highest vegetation activity period over the entire year, as expressed by Equation (1).
  BIC =   { Red ( R )   =   Swir NDVI   max Green   ( G ) = NDVI max Blue   ( B ) =   Green NDVI   max
The BIC was designed for the extraction of vegetative areas (forests, crops, shrubs/herbs) from non-vegetative areas (barren, urban, and water/snow). However, it is difficult to discriminate the forested areas from other vegetative areas such as crops, shrubs, and herbs using the BIC. To overcome this problem, a new image composite called the Forest Cover Composite (FCC) was designed in this research. The FCC is made by changing the green (G) term of the BIC according to the annual mean NDVI value. The composition of the FCC is shown in Equation (2).
  FCC =   { Red ( R )   =   Swir NDVI   max Green   ( G ) = NDVI mean Blue   ( B ) =   Green NDVI   max
The annual mean NDVI values are used to discriminate forested areas from other vegetative areas such as grasses and shrubs. The specially selected shortwave infrared ( Swir NDVI   max ) and green ( Green NDVI   max ) reflectance from the day when the NDVI is at a maximum are used to expose the barren and water/snow areas, respectively. The FCC is designed in such a way that the forested areas appear greener due to the higher mean NDVI values over a year, whereas other land cover types such as croplands and barren lands are seen as red, and non-forested vegetation types such as grasses and shrubs appear to be not as green as the forests.
However, forests may not necessarily appear greener than other perennial vegetation, as the annual mean NDVI values over forested areas may be similar to those over such vegetated areas. To cope with this problem, an Enhanced Forest Cover Composite (EFCC) was also proposed in the research by combining the FCC with synthetic aperture radar (SAR) data. The annual median backscattering intensity of the VH (vertical transmit, horizontal receive) polarization data were combined with the FCC, as shown in Equation (3).
  EFCC =   { Red ( R )   =   Swir NDVI   max     Green   ( G ) = NDVI mean × VH med Blue   ( B ) =   Green NDVI   max
The median VH data were normalized into a unit scale (0–1) using the calibrated range values in decibels. Forests have higher backscattering intensity than other vegetation types (grasses and shrubs). The radar data were combined with the FCC in order to suppress the green component (mean NDVI values) of the FCC over the non-forested vegetative areas while also intensifying the red component ( Swir NDVI   max ) . We used the C-band SAR (synthetic aperture data) data from the Sentinel-1 mission in the research.
Many previous studies have reported that cross-polarized backscattering (HV or VH) is more sensitive to vegetation structure than co-polarized backscattering (HH or VV) [40,41,42,43]. Therefore, we selected VH polarization for the formulation of the EFCC. However, HV polarization images are not available over Japan from the Sentinel-1 Ground Range Detected (GRD) product (European Space Agency (ESA): Paris, France).

2.3. Processing of Satellite Data

For the generation of the BIC and FCC, we used all Landsat-8 scenes (2396) available for Japan in 2016. The Landsat-8 has been monitoring global land surface with a standard 16-day repeat cycle at a spatial resolution of 30 m. The data were converted into top-of-atmosphere (TOA) spectral reflectance using the rescaling coefficients found in the metadata file. The clouds were removed by using separate quality assessment (QA) band information available in the Landsat-8 data.
The VH polarization data were obtained from the Sentinel-1 A/B satellites which provide C-band SAR data. We used all Sentinel-1 scenes (1230) available for Japan in 2016. We used Sentinel-1 Ground Range Detected (GRD) scenes, processed using the Sentinel-1 Toolbox, which involves thermal noise removal, radiometric calibration, and terrain correction, to generate a calibrated and ortho-corrected product. We extracted VH (vertical transmit, horizontal receive) polarization data, and resampled the data to have a 30-m resolution to combine with Landsat-8 data.

2.4. Preparation of Reference Data

This research deals with the classification of forest and non-forest types. Reference data belonging to forested and non-forested areas were extracted from a previous study [44] which is based on an extant vegetation survey map. The reference data were further refined and strengthened by the visual interpretation of Google Earth imagery. Altogether, 18,000 reference points were prepared for each class. The distribution of the reference points is displayed in Figure 1.

2.5. Performance Analysis

The performances of the BIC, FCC, and EFCC for the discrimination of forested and non-forested areas were evaluated by employing supervised classification with the support of reference data. We used the multilayer perceptron (MLP) neural networks classifier-based 10-fold cross-validation approach for the quantitative evaluation of the composite images. A multilayer perceptron (MLP) is a class of feedforward artificial neural network, which utilizes a supervised learning technique called backpropagation for training [45,46,47]. For the cross-validation, given features were grouped into 10 folds and learning was carried out only on nine folds—the remaining fold was used for validation. Finally, predictions were collected from the cross-validation loops, and the validation metrics (confusion matrix, overall accuracy, and kappa coefficient [48]) were calculated. Hyper-parameters of the neural network model were tuned by a repeated hit and trial method with reference to the validation metrics. The same procedure was repeated for the BIC, FCC, and EFCC individually, as well as different combinations of the three.
We produced a high-resolution (30 m) seamless forests and non-forests map for all of Japan employing the neural network-based supervised classification method with the support of reference data. The newly produced map was resampled into a resolution of 500 m and compared to an extant MCD12Q1 product-based forest map. We used the International Geosphere-Biosphere Programme (IGBP) classification layer of the MCD12Q1 (version 6.0, product of 2016) and extracted the forest and non-forest classes for comparison.

3. Results and Discussion

3.1. Cross-Validation Results

The neural networks classifier-based accuracy assessments are summarized in Table 1. As seen in Table 1, the FCC (overall accuracy = 0.96, Kappa coefficient = 0.92) provided substantial improvement over the BIC (overall accuracy = 0.94, Kappa coefficient = 0.89) for the discrimination of forested and non-forested areas; whereas the EFCC provided the best results (overall accuracy = 0.97, Kappa coefficient = 0.94). Combinations of FCC and EFCC, or BIC, FCC, and EFCC did not provide improvements over the EFCC alone. This analysis confirmed that the FCC and EFCC are efficient composite images for the extraction and visualization of forested areas.

3.2. EFCC-Based Forest Mapping

We produced a new forest map for all of Japan solely based on the EFCC, by employing a neural networks classifier with the support of reference data. The newly produced high-resolution (30 m) map is displayed in Figure 2.

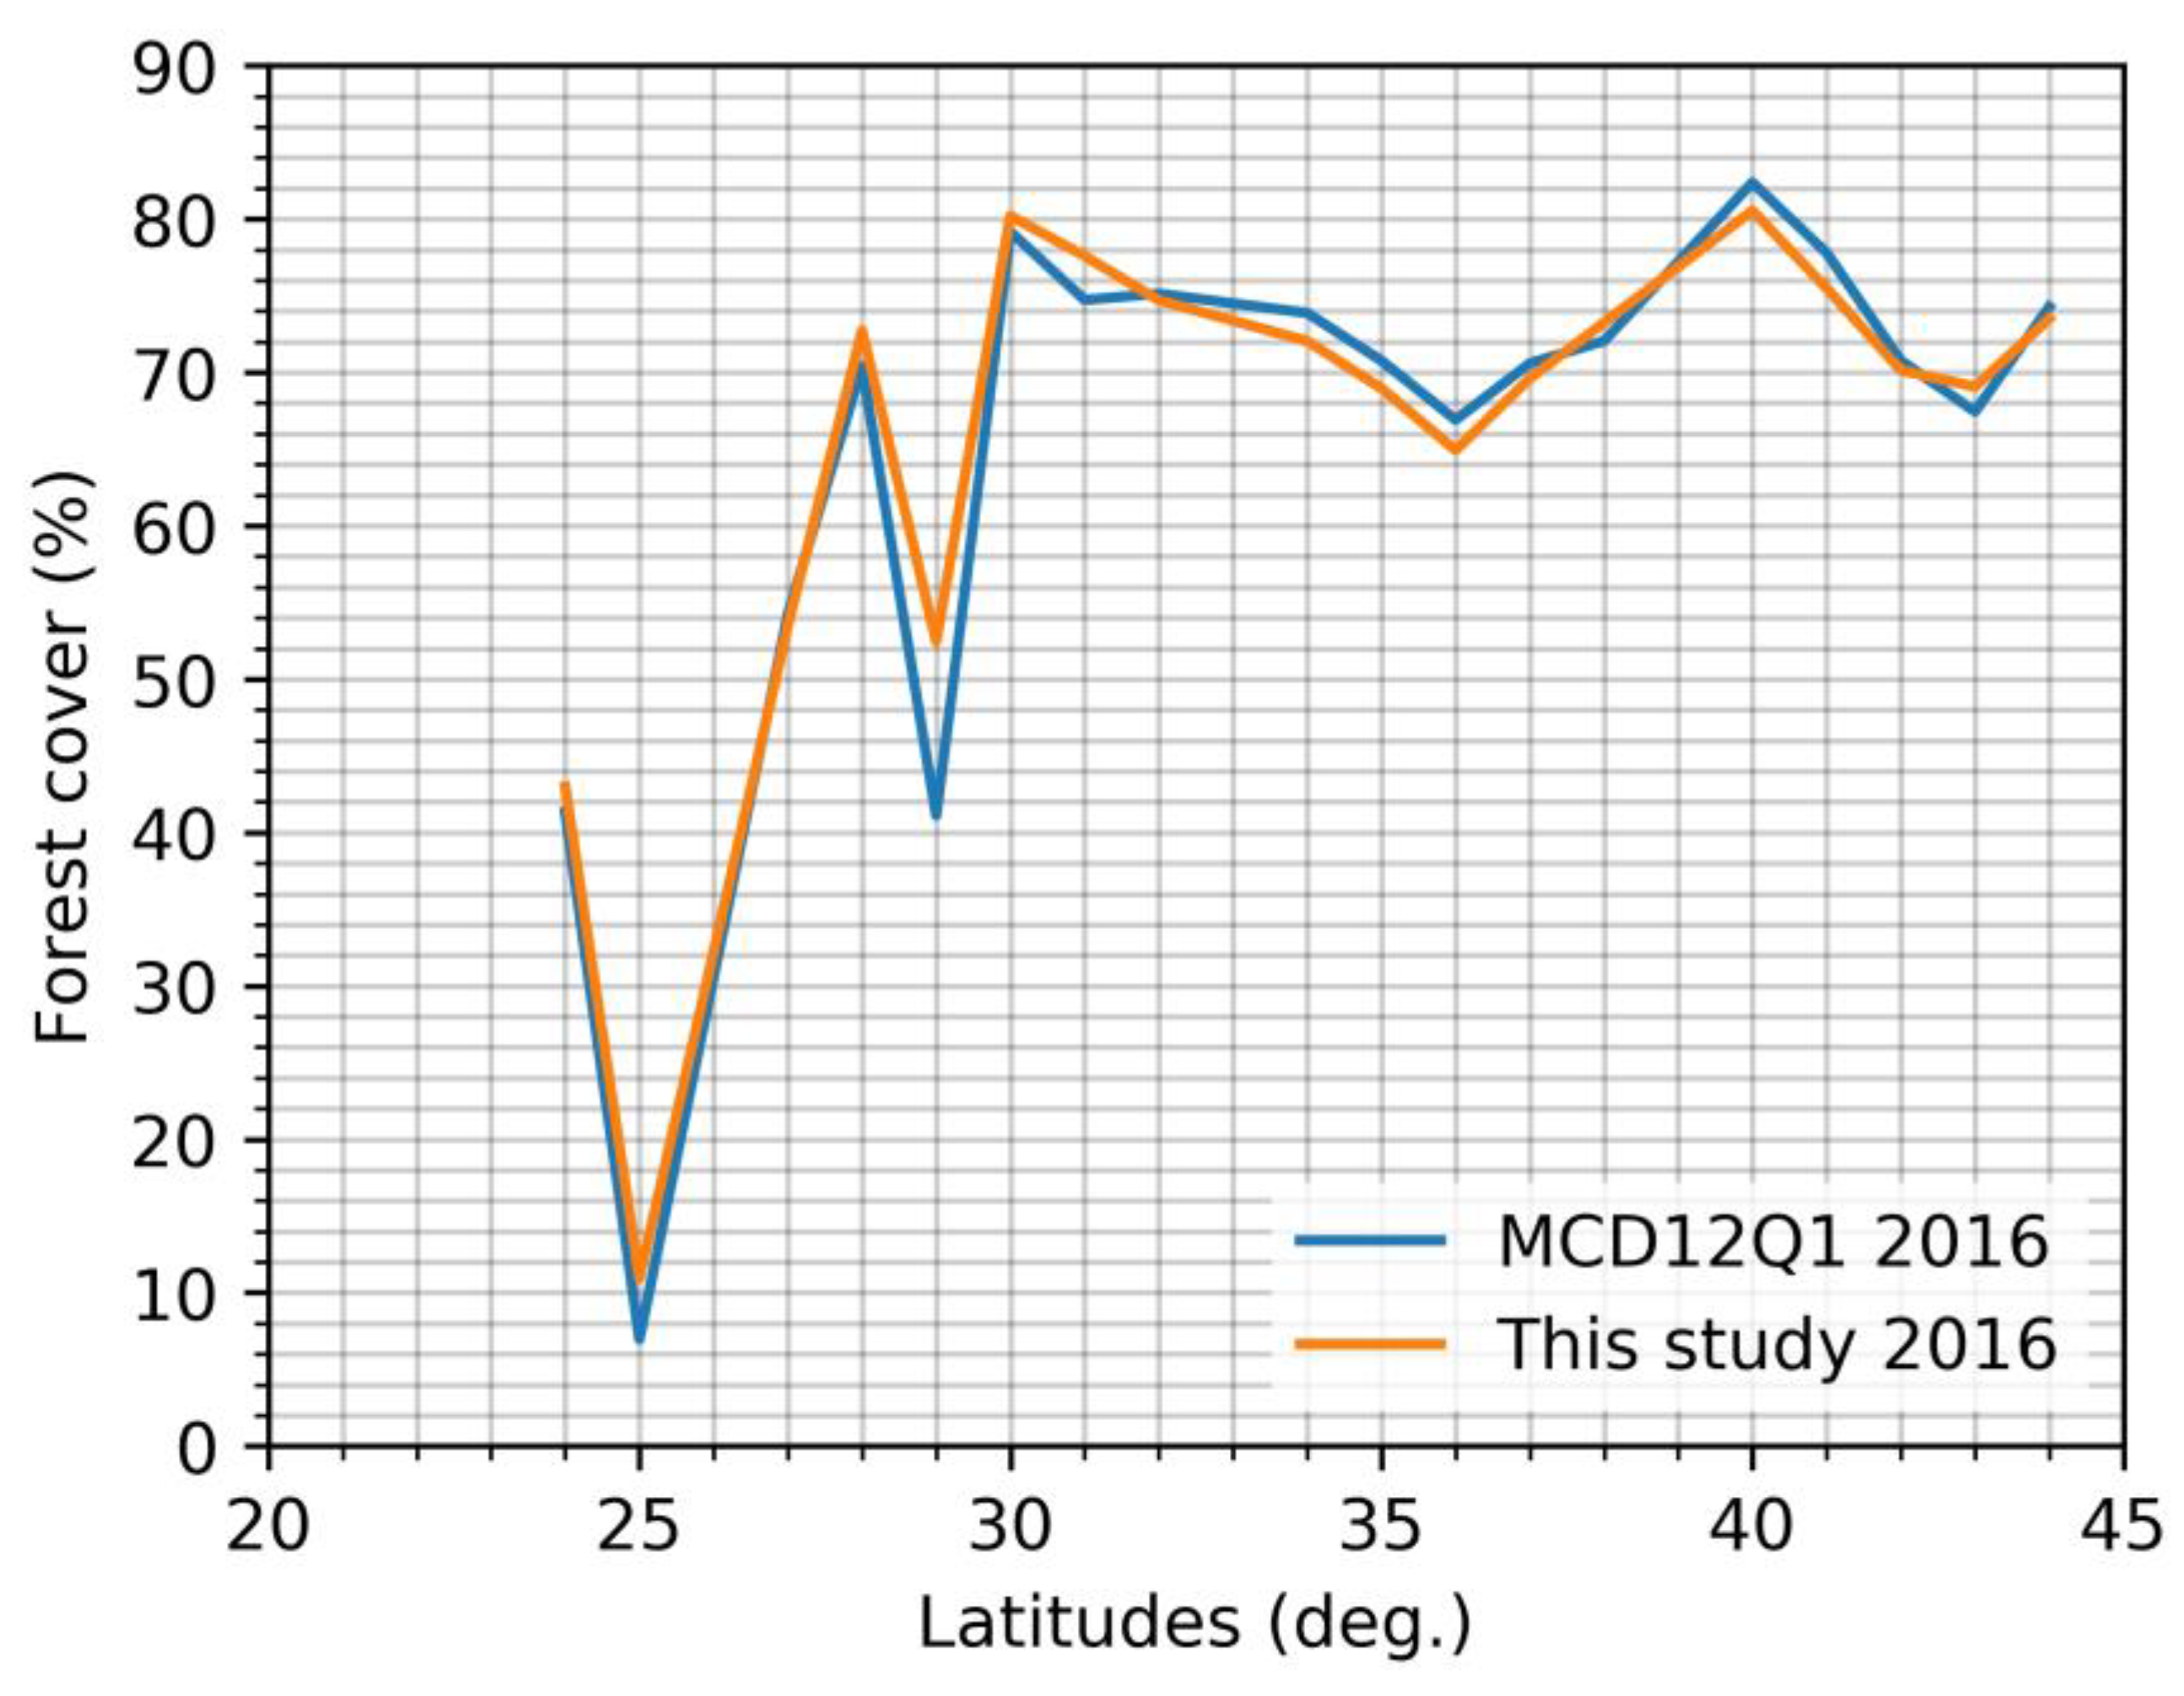
3.3. Comparison to the MCD12Q1 Product

The comparison of the newly produced map to the extant 500-m resolution MCD12Q1 product shows that our map followed a distribution trend similar to that of the MCD12Q1 product except in the region around 29° N latitude (Figure 3), where the MCD12Q1 product estimated a lower forest cover.
We further explored the region (around 29° N latitude in Figure 3) where a large discrepancy was found between the extant MCD12Q1 product and our map. Figure 4 demonstrates an example of the discrepancy in that region. With reference to the newly produced map (Figure 4f,g), the MCD12Q1 product (Figure 4e) could not estimate the forested areas correctly as almost all pixels were misclassified as non-forested areas.
With reference to the true color image (Figure 4a), the BIC was capable to discriminate the vegetative areas (forests, crops, and grasses) from non-vegetative areas. However, it was not effective in discriminating between the forested and other vegetation areas (Figure 4b). The FCC showed improved capability to discriminate the forested areas from other vegetative areas (Figure 4c). However, the EFCC showed most efficient results (Figure 4d). The EFCC-based forest map (Figure 4f) produced in the research also correctly classified forested and non-forested areas. This demonstration further confirmed that new composite images (FCC and EFCC) are very efficient in discriminating forested and non-forested areas.
Based on the reference data (18,000 points for each class) prepared in the research, we also computed the confusion matrices for the MCD12Q1 product-based forests and non-forests map, as well as for the newly produced EFCC-based map. The EFCC-based map provided slightly better accuracy (overall accuracy = 97.8%, Table 2) than the extant MCD12Q1 product (overall accuracy = 96.2%, Table 3). It should be noted that the newly produced map misclassified only 439 non-forested points as forests, while the extant MCD12Q1 product misclassified 794 non-forested points as forests.

4. Discussion

A standalone method for the visualization and discrimination of forested areas is useful for mapping forests and detecting changes in forests over the years. With the increase in Earth-observing satellites, massive volumes of multi-temporal satellite images are being collecting. To deliver concise biophysical information such as forest cover data from the huge volume of satellite images, image compositing techniques are immensely important. The image compositing techniques extract the required information from a huge volume of multi-temporal data. In previous study by Sharma et al. [39], the Biophysical Image Composite (BIC) was designed by exploiting the multi-temporal optical images. The BIC is made up of Normalized Difference Vegetation Index (NDVI), shortwave infrared reflectance, and green reflectance, specially chosen from the day when NDVI is at a maximum. NDVI is widely used spectral index for the detection of vegetation [21,23,24]. However, the discrimination of forest cover from other non-forested vegetative cover such as crops, shrubs, and herbs is not straightforward, and hence the visualization of forest cover is challenging. In this research, the Forest Cover Composite (FCC) was designed, by replacing the green (maximum NDVI) term of the BIC with the mean NDVI. Forests usually have higher annual mean NDVI values than other vegetation types. The shortwave infrared reflectance and green reflectance from the day of highest vegetation activity were selected to expose barren and water/snow areas, respectively, thus allowing the visualization of the forested areas.
However, other vegetation types, for instance croplands, may have similar annual mean NDVI values to forests. In this case, the FCC cannot discriminate the forested areas efficiently. To cope with this limitation of the FCC, an Enhanced Forest Cover Composite (EFCC) was also designed in the research by combining annual mean NDVI values with synthetic aperture radar (SAR)-based backscattering data. The combination of SAR data with optical data has been suggested by previous studies for improving forest mapping, especially for the tropical areas where the availability of optical images is restricted due to cloud cover [30,32].
The distribution of Japanese forests is in a highly fragmented condition. The moderate spatial resolution (500 m) satellite data cannot provide detailed information on the distribution of forests in Japan, as they miss small patches of forests. On the contrary, the high-spatial resolution (30 m) forest map produced in the research can describe the distribution of forests more precisely.

5. Conclusions

This paper presented image compositing techniques for the visualization and extraction of forested areas on a national scale. Two composite images, the Forest Cover Composite (FCC) and the Enhanced Forest Cover Composite (EFCC) were designed by exploiting multi-temporal Landsat-8 optical and Sentinel-1 SAR data in the research. The efficiency of the newly developed composite images (FCC and EFCC) for the discrimination between forested and non-forested areas was confirmed by implementing a multilayer perceptron (MLP) neural network-based supervised classification approach with the support of the reference data. The FCC and EFCC were designed in such a way that forested areas appear greener than other vegetative areas, thus allowing the visual interpretation of forests. The EFCC-based forest map provided better accuracy than the extant MCD12Q1 product in Japan. It is expected that the FCC and EFCC will contribute to the achievement of better monitoring of forested areas globally.

Author Contributions

R.C.S. conceptualized the research, performed the analyses, and wrote the manuscript. K.H. and R.T. revised the manuscript. All authors contributed and approved final manuscript before submission.

Acknowledgments

This research was supported by a JSPS (Japan Society for the Promotion of Science) grant-in-aid for scientific research (No. P17F17109). Landsat-8 data were available from the United States Geological Survey, and Sentinel-1 data were available from European Space Agency (ESA) Copernicus program. The MCD12Q1 data product was retrieved from the online Data Pool, courtesy of the NASA Land Processes Distributed Active Archive Center (LP DAAC), USGS/Earth Resources Observation and Science (EROS) Center, Sioux Falls, South Dakota, https://lpdaac.usgs.gov/data_access/data_pool.

Conflicts of Interest

The authors declare no conflict of interest.

References

  1. Houghton, R.A.; Skole, D.L.; Lefkowitz, D.S. Changes in the landscape of Latin America between 1850 and 1985 II. Net release of CO2 to the atmosphere. For. Ecol. Manag. 1991, 38, 173–199. [Google Scholar] [CrossRef]
  2. Dale, V.H.; Joyce, L.A.; Mcnulty, S.; Neilson, R.P.; Ayres, M.P.; Flannigan, M.D.; Hanson, P.J.; Irland, L.C.; Lugo, A.E.; Peterson, C.J.; et al. Climate Change and Forest Disturbances. BioScience 2001, 51, 723. [Google Scholar] [CrossRef] [Green Version]
  3. Bonan, G.B. Forests and Climate Change: Forcings, Feedbacks, and the Climate Benefits of Forests. Science 2008, 320, 1444–1449. [Google Scholar] [CrossRef] [PubMed] [Green Version]
  4. Keenan, R.J.; Reams, G.A.; Achard, F.; de Freitas, J.V.; Grainger, A.; Lindquist, E. Dynamics of global forest area: Results from the FAO Global Forest Resources Assessment 2015. For. Ecol. Manag. 2015, 352, 9–20. [Google Scholar] [CrossRef]
  5. Curran, L.M. Lowland Forest Loss in Protected Areas of Indonesian Borneo. Science 2004, 303, 1000–1003. [Google Scholar] [CrossRef] [PubMed]
  6. Meyfroidt, P.; Lambin, E.F. Forest transition in Vietnam and displacement of deforestation abroad. Proc. Natl. Acad. Sci. USA 2009, 106, 16139–16144. [Google Scholar] [CrossRef] [PubMed] [Green Version]
  7. Miettinen, J.; Shi, C.; Liew, S.C. Deforestation rates in insular Southeast Asia between 2000 and 2010: Deforestation in Insular Southeast Asia 2000—2010. Glob. Chang. Biol. 2011, 17, 2261–2270. [Google Scholar] [CrossRef]
  8. Margono, B.A.; Potapov, P.V.; Turubanova, S.; Stolle, F.; Hansen, M.C. Primary forest cover loss in Indonesia over 2000–2012. Nat. Clim. Chang. 2014, 4, 730–735. [Google Scholar] [CrossRef]
  9. Stibig, H.J.; Achard, F.; Carboni, S.; Raši, R.; Miettinen, J. Change in tropical forest cover of Southeast Asia from 1990 to 2010. Biogeoscience 2014, 11, 247–258. [Google Scholar] [CrossRef] [Green Version]
  10. Defries, R.S.; Townshend, J.R.G. NDVI-derived land cover classifications at a global scale. Int. J. Remote Sens. 1994, 15, 3567–3586. [Google Scholar] [CrossRef]
  11. Edwards, D.P.; Larsen, T.H.; Docherty, T.D.S.; Ansell, F.A.; Hsu, W.W.; Derhe, M.A.; Hamer, K.C.; Wilcove, D.S. Degraded lands worth protecting: The biological importance of Southeast Asia’s repeatedly logged forests. Proc. R. Soc. B Biol. Sci. 2011, 278, 82–90. [Google Scholar] [CrossRef] [PubMed]
  12. Sexton, J.O.; Noojipady, P.; Song, X.P.; Feng, M.; Song, D.X.; Kim, D.H.; Anand, A.; Huang, C.; Channan, S.; Pimm, S.L.; et al. Conservation policy and the measurement of forests. Nat. Clim. Chang. 2015. [Google Scholar] [CrossRef]
  13. Feddema, J.J. The Importance of Land-Cover Change in Simulating Future Climates. Science 2005, 310, 1674–1678. [Google Scholar] [CrossRef] [PubMed]
  14. Tucker, C.J.; Holben, B.N.; Goff, T.E. Intensive forest clearing in Rondonia, Brazil, as detected by satellite remote sensing. Remote Sens. Environ. 1984, 15, 255–261. [Google Scholar] [CrossRef]
  15. Running, S.W.; Loveland, T.R.; Pierce, L.L.; Nemani, R.R.; Hunt, E.R. A remote sensing based vegetation classification logic for global land cover analysis. Remote Sens. Environ. 1995, 51, 39–48. [Google Scholar] [CrossRef]
  16. Hansen, M.C.; Defries, R.S.; Townshend, J.R.G.; Sohlberg, R. Global land cover classification at 1 km spatial resolution using a classification tree approach. Int. J. Remote Sens. 2000, 21, 1331–1364. [Google Scholar] [CrossRef] [Green Version]
  17. Xiao, X.; Boles, S.; Liu, J.; Zhuang, D.; Liu, M. Characterization of forest types in Northeastern China, using multi-temporal SPOT-4 VEGETATION sensor data. Remote Sens. Environ. 2002, 82, 335–348. [Google Scholar] [CrossRef] [Green Version]
  18. Betbeder, J.; Gond, V.; Frappart, F.; Baghdadi, N.N.; Briant, G.; Bartholome, E. Mapping of Central Africa Forested Wetlands Using Remote Sensing. IEEE J. Sel. Top. Appl. Earth Obs. Remote Sens. 2014, 7, 531–542. [Google Scholar] [CrossRef] [Green Version]
  19. McRoberts, R.E.; Liknes, G.C.; Domke, G.M. Using a remote sensing-based, percent tree cover map to enhance forest inventory estimation. For. Ecol. Manag. 2014, 331, 12–18. [Google Scholar] [CrossRef]
  20. Zhang, Y.; Atkinson, P.M.; Li, X.; Ling, F.; Wang, Q.; Du, Y. Learning-Based Spatial–Temporal Superresolution Mapping of Forest Cover With MODIS Images. IEEE Trans. Geosci. Remote Sens. 2017, 55, 600–614. [Google Scholar] [CrossRef]
  21. Monitoring Vegetation Systems in the Great Plains with ERTS. Available online: https://ntrs.nasa.gov/archive/nasa/casi.ntrs.nasa.gov/19740022614.pdf (accessed on 24 August 2018).
  22. Lambin, E.F.; Ehrlich, D. Combining vegetation indices and surface temperature for land-cover mapping at broad spatial scales. Int. J. Remote Sens. 1995, 16, 573–579. [Google Scholar] [CrossRef]
  23. Boyd, D.S.; Ripple, W.J. Potential vegetation indices for determining global forest cover. Int. J. Remote Sens. 1997, 18, 1395–1401. [Google Scholar] [CrossRef]
  24. Beck, P.S.A.; Atzberger, C.; Høgda, K.A.; Johansen, B.; Skidmore, A.K. Improved monitoring of vegetation dynamics at very high latitudes: A new method using MODIS NDVI. Remote Sens. Environ. 2006, 100, 321–334. [Google Scholar] [CrossRef]
  25. Muchoney, D.; Borak, J.; Chi, H.; Friedl, M.; Gopal, S.; Hodges, J.; Morrow, N.; Strahler, A. Application of the MODIS global supervised classification model to vegetation and land cover mapping of Central America. Int. J. Remote Sens. 2000, 21, 1115–1138. [Google Scholar] [CrossRef]
  26. Wessels, K. Mapping regional land cover with MODIS data for biological conservation: Examples from the Greater Yellowstone Ecosystem, USA and Par State, Brazil. Remote Sens. Environ. 2004, 92, 67–83. [Google Scholar] [CrossRef]
  27. Carrão, H.; Gonçalves, P.; Caetano, M. Contribution of multispectral and multitemporal information from MODIS images to land cover classification. Remote Sens. Environ. 2008, 112, 986–997. [Google Scholar] [CrossRef]
  28. Pax-Lenney, M.; Woodcock, C.E.; Macomber, S.A.; Gopal, S.; Song, C. Forest mapping with a generalized classifier and Landsat TM data. Remote Sens. Environ. 2001, 77, 241–250. [Google Scholar] [CrossRef]
  29. Gjertsen, A. Accuracy of forest mapping based on Landsat TM data and a kNN-based method. Remote Sens. Environ. 2007, 110, 420–430. [Google Scholar] [CrossRef]
  30. Hoan, N.T.; Tateishi, R.; Alsaaideh, B.; Ngigi, T.; Alimuddin, I.; Johnson, B. Tropical forest mapping using a combination of optical and microwave data of ALOS. Int. J. Remote Sens. 2013, 34, 139–153. [Google Scholar] [CrossRef]
  31. Shimada, M.; Itoh, T.; Motooka, T.; Watanabe, M.; Shiraishi, T.; Thapa, R.; Lucas, R. New global forest/non-forest maps from ALOS PALSAR data (2007–2010). Remote Sens. Environ. 2014, 155, 13–31. [Google Scholar] [CrossRef]
  32. Qin, Y.; Xiao, X.; Dong, J.; Zhang, G.; Roy, P.S.; Joshi, P.K.; Gilani, H.; Murthy, M.S.R.; Jin, C.; Wang, J.; et al. Mapping forests in monsoon Asia with ALOS PALSAR 50 m mosaic images and MODIS imagery in 2010. Sci. Rep. 2016, 6. [Google Scholar] [CrossRef] [PubMed]
  33. MCD12Q1 MODIS Terra + Aqua Land Cover Type Yearly L3 Global 500 m SIN Grid V006; U.S. Geological Survey: Reston, VA, USA, 2015. [CrossRef]
  34. Friedl, M.A.; Sulla-Menashe, D.; Tan, B.; Schneider, A.; Ramankutty, N.; Sibley, A.; Huang, X. MODIS Collection 5 global land cover: Algorithm refinements and characterization of new datasets. Remote Sens. Environ. 2010, 114, 168–182. [Google Scholar] [CrossRef]
  35. MOD44B MODIS/Terra Vegetation Continuous Fields Yearly L3 Global 250 m SIN Grid V006; U.S. Geological Survey: Reston, VA, USA, 2015. [CrossRef]
  36. Running, S.W.; Nemani, R.R.; Heinsch, F.A.; Zhao, M.; Reeves, M.; Hashimoto, H. A Continuous Satellite-Derived Measure of Global Terrestrial Primary Production. BioScience 2004, 54, 547. [Google Scholar] [CrossRef] [Green Version]
  37. Zhao, M.; Running, S.W. Drought-Induced Reduction in Global Terrestrial Net Primary Production from 2000 through 2009. Science 2010, 329, 940–943. [Google Scholar] [CrossRef] [PubMed]
  38. Neumann, M.; Moreno, A.; Thurnher, C.; Mues, V.; Härkönen, S.; Mura, M.; Bouriaud, O.; Lang, M.; Cardellini, G.; Thivolle-Cazat, A.; et al. Creating a Regional MODIS Satellite-Driven Net Primary Production Dataset for European Forests. Remote Sens. 2016, 8, 554. [Google Scholar] [CrossRef]
  39. Sharma, R.; Tateishi, R.; Hara, K. A Biophysical Image Compositing Technique for the Global-Scale Extraction and Mapping of Barren Lands. ISPRS Int. J. Geo-Inf. 2016, 5, 225. [Google Scholar] [CrossRef]
  40. Patel, P.; Srivastava, H.S.; Panigrahy, S.; Parihar, J.S. Comparative evaluation of the sensitivity of multi-polarized multi-frequency SAR backscatter to plant density. Int. J. Remote Sens. 2006, 27, 293–305. [Google Scholar] [CrossRef]
  41. Duguay, Y.; Bernier, M.; Lévesque, E.; Tremblay, B. Potential of C and X Band SAR for Shrub Growth Monitoring in Sub-Arctic Environments. Remote Sens. 2015, 7, 9410–9430. [Google Scholar] [CrossRef] [Green Version]
  42. Viet Nguyen, L.; Tateishi, R.; Thanh Nguyen, H.; Sharma, R.C.; Trong To, T.; Mai Le, S. Estimation of Tropical Forest Structural Characteristics Using ALOS-2 SAR Data. Adv. Remote Sens. 2016, 5, 131–144. [Google Scholar] [CrossRef]
  43. Prajapati, R.; Kumar, S.; Agrawal, S. Simulation of SAR backscatter for forest vegetation. In Proceedings of the Earth Observing Missions and Sensors: Development, Implementation, and Characterization IV, New Delhi, India, 2 May 2016; Volume 9881. [Google Scholar]
  44. Sharma, R.C.; Hara, K.; Hirayama, H.; Harada, I.; Hasegawa, D.; Tomita, M.; Geol Park, J.; Asanuma, I.; Short, K.M.; Hara, M.; et al. Production of Multi-Features Driven Nationwide Vegetation Physiognomic Map and Comparison to MODIS Land Cover Type Product. Adv. Remote Sens. 2017, 6, 54–65. [Google Scholar] [CrossRef]
  45. Rosenblatt, F. Principles of Neurodynamics Perceptrons and the Theory of Brain Mechanisms; Cornell Aeronautical Lab Inc.: Buffalo, NY, USA, 1961. [Google Scholar]
  46. Hinton, G.E. Connectionist learning procedures. In Machine Learning, Volume III; Elsevier: New York, NY, USA, 1990; pp. 555–610. [Google Scholar]
  47. Understanding the Difficulty of Training Deep Feedforward Neural Networks. Available online: http://proceedings.mlr.press/v9/glorot10a/glorot10a.pdf (accessed on 24 August 2018).
  48. Cohen, J. A Coefficient of Agreement for Nominal Scales. Educ. Psychol. Meas. 1960, 20, 37–46. [Google Scholar] [CrossRef]
Figure 1. Distribution of reference points used in the research over the national territory. The national boundary is based on the Global Administrative Areas database (GADM) version 3.6, May 2018.
Jimaging 04 00105 g001
Figure 2. Countrywide forests and non-forests map produced in the research. (a) Display over the national territory; (b) magnification of the black polygon region in (a). The national boundary is based on the Global Administrative Areas database (GADM) version 3.6, May 2018.
Jimaging 04 00105 g002
Figure 3. Variation of the percentage forest cover with respect to latitude estimated by two different maps (MCD12Q1 and our map).
Jimaging 04 00105 g003
Figure 4. An example demonstrating the performance of the image composites for the detection of forested areas. (a) Google Earth true-color imagery dated 31 December 2016 provided by Google, DigitalGlobe; (b) 30-m resolution Biophysical Image Composite (BIC); (c) 30-m resolution Forest Cover Composite (FCC); (d) 30-m resolution Enhanced Forest Cover Composite (EFCC); (e) 500-m resolution MCD12Q1 product-based extraction of forested (green pixels) and non-forested (gray pixels) areas; (f) newly produced map (30 m)-based extraction of forested (green pixels) and non-forested (gray pixels) areas; (g) newly produced map resampled into a resolution of 500 m.
Jimaging 04 00105 g004
Table 1. Comparison of different composite images using 18,000 reference points for each class.
Composite ImagesOverall AccuracyKappa Coefficient
Biophysical Iimage Composite (BIC)0.94 0.89
Forest Cover Composite (FCC)0.96 0.92
Enhanced Forest Cover Composite (EFCC)0.97 0.94
BIC + FCC 0.96 0.92
FCC + EFCC0.97 0.94
BIC + FCC + EFCC0.97 0.94
Table 2. Confusion matrix of the newly produced forests and non-forests cover map.
Predicted ResultsReference Data
Forest (18,000 Points)Non-Forest (18,000 Points)User’s Accuracy (%)
Forest17,63143997.6
Non-Forest36917,56197.9
Producer’s Accuracy (%)98.097.697.8
(Overall)
Table 3. Confusion matrix of the MCD12Q1 product-based forests and non-forests cover map.
Predicted ResultsReference Data
Forest (18,000 Points)Non-Forest (18,000 Points)User’s Accuracy (%)
Forest 17,43679495.6
Non-Forest 56417,20696.8
Producer’s Accuracy (%)96.995.696.2
(Overall)

