Article

A Comparative Study of Two State-of-the-Art Feature Selection Algorithms for Texture-Based Pixel-Labeling Task of Ancient Documents

1
LATIS-Laboratory of Advanced Technology and Intelligent Systems, ENISo-National Engineering School of Sousse, Sousse University, 4023 Sousse, Tunisia
2
LITIS Laboratory, Normandie University, Avenue de l’Université, 76800 Saint-Etienne-du-Rouvray, France
3
L3i Laboratory, University of La Rochelle, Avenue Michel Crépeau, 17042 La Rochelle, France
*
Author to whom correspondence should be addressed.
J. Imaging 2018, 4(8), 97; https://doi.org/10.3390/jimaging4080097
Submission received: 28 June 2018 / Revised: 21 July 2018 / Accepted: 25 July 2018 / Published: 1 August 2018
(This article belongs to the Special Issue New Trends in Image Processing for Cultural Heritage)

Abstract

:
Recently, texture features have been widely used for historical document image analysis. However, few studies have focused exclusively on feature selection algorithms for historical document image analysis. Indeed, an important need has emerged to use a feature selection algorithm in data mining and machine learning tasks, since it helps to reduce the data dimensionality and to increase the algorithm performance such as a pixel classification algorithm. Therefore, in this paper we propose a comparative study of two conventional feature selection algorithms, genetic algorithm and ReliefF algorithm, using a classical pixel-labeling scheme based on analyzing and selecting texture features. The two assessed feature selection algorithms in this study have been applied on a training set of the HBR dataset in order to deduce the most selected texture features of each analyzed texture-based feature set. The evaluated feature sets in this study consist of numerous state-of-the-art texture features (Tamura, local binary patterns, gray-level run-length matrix, auto-correlation function, gray-level co-occurrence matrix, Gabor filters, Three-level Haar wavelet transform, three-level wavelet transform using 3-tap Daubechies filter and three-level wavelet transform using 4-tap Daubechies filter). In our experiments, a public corpus of historical document images provided in the context of the historical book recognition contest (HBR2013 dataset: PRImA, Salford, UK) has been used. Qualitative and numerical experiments are given in this study in order to provide a set of comprehensive guidelines on the strengths and the weaknesses of each assessed feature selection algorithm according to the used texture feature set.

1. Introduction

Providing reliable computer-based access and analysis of cultural heritage documents has been flagged as a very important need for the library and the information science community, spanning educationalists, students, practitioners, researchers in book history, computer scientists, historians, librarians, end-users and decision makers. More specifically, there is a consistent and clear need for robust and accurate document image analysis (DIA) methods that deal with the idiosyncrasies of historical document images [1,2]. Indeed, historical DIA remains an open issue due to the particularities of historical documents, such as the superimposition of information layers (e.g., stamps, handwritten notes, noise, back-to-front interference, page skew) and the variability of their contents and/or layouts. Moreover, analyzing historical document images and characterizing their layouts and contents under significant degradation levels and different noise types and with no a priori knowledge about the layout, content, typography, font styles, scanning resolution or DI size, etc. is not a straightforward task. Therefore, researchers specialized in historical DIA keep proposing novel reliable approaches and rigorous techniques for historical DIA, segmentation and characterization. Recently, there has been increasing interest in using deep architectures for solving various sub-fields and tasks related to the issues surrounding computer vision and pattern recognition and particularly document image analysis and handwritten text recognition. For instance, deep neural networks have been used for feature learning [3] and document layout and content analysis [4,5]. For instance, Chen et al. [4] proposed a pixel-labeling approach for handwritten historical document images segmentation based on using a convolutional neural network (CNN). Calvo-Zaragoza et al. [5] presented a CNN-based method for automatic document processing of music score images. Wei et al. [3] proposed a layout analysis method of historical document images using the sequential forward selection algorithm and the autoencoder technique as a deep neural network for feature selection and learning. Nevertheless, these methods based on deep architectures are hindered by many issues related to the computational cost in terms of memory consumption, processing time and computational complexity on the one hand, and the need for large datasets.
In the literature, the methods used for DIA have been classified into two categories: texture and non-texture-based [6]. Kise [7] stated that the most relevant DIA methods used to analyze documents with unconstrained layouts and overlapping layers are based on texture features. It has been demonstrated that the text/graphic region separation task can be performed efficiently by using a texture-based method. On the other hand, the textual regions with different fonts can be segmented using texture features which are often used for text font characterization. A text font is mainly characterized by its weight, style, condensation, width, slant, italicization, ornamentation, and designer or foundry [8].
However, using a texture-based method has quite high computational complexity since it often involves a large number of features. Indeed, two criteria can be identified when using a texture-based method: object to be analyzed (i.e., foreground or background) and primitive of analysis (i.e., pixels, superpixels, connected components, etc.). These two criteria entail large volumes of data to be processed when using a texture-based method. Moreover, the processing time of a texture-based method depends entirely on the image size and resolution due to the use of a primitive-based computation. However, there is awareness that maybe there are redundant and non-relevant indices when extracting and analyzing texture features which may reduce the performance of a texture-based algorithm. Feature selection meets this real need by selecting relevant features and by removing redundant ones in order to reduce the data dimensionality, to improve the quality of the feature set and to increase the algorithm performance, such as a texture-based pixel-labeling algorithm.
Thus, in this paper a comparative study of two conventional feature selection algorithms, genetic algorithm (GA) and ReliefF algorithm (RA), is proposed in order to provide a set of comprehensive guidelines on the strengths and the weaknesses of each assessed feature selection algorithm according to the used texture feature set. The texture-based feature sets which have been compared and evaluated in this study have been derived from the Tamura, local binary patterns (LBP), gray-level run-length matrix (GLRLM), auto-correlation, gray-level co-occurrence matrix (GLCM), Gabor filters and three wavelet-based approaches: three-level Haar wavelet transform (Haar), three-level wavelet transform using 3-tap Daubechies filter (Db3) and three-level wavelet transform using 4-tap Daubechies filter (Db4).
In our comparative study, a public corpus of historical document images (called the HBR2013 dataset) which was provided by the pattern recognition and image analysis research lab (PRIma) [9] has been used [1,2]. The HBR2013 dataset has been proposed in the context of the historical book recognition (HBR) contest held in conjunction with the ICDAR conference (2011 and 2013). The HBR2013 dataset is a subset of the IMPACT dataset [10], representing key holdings of major European libraries and consisting of printed documents of various types (e.g., books, newspapers, journals, legal documents), in 25 languages from the 17th century to the early 20th century. It contains a large diversity of historical document contents (variety of layouts and contents). The HBR2013 dataset presents many particularities and challenges which motivates us to conduct our thorough study on it.
The remainder of this article is organized as follows. Section 2 and Section 3 review firstly the texture-based methods and feature selection algorithms proposed in the literature, respectively, with a particular focus on those related to historical DIA. A brief report of the different texture-based feature sets and feature selection algorithms evaluated in this study is also given. Section 4 describes the experimental protocol by firstly presenting the main phases of the proposed pixel-labeling scheme used for analyzing and comparing the performance of each texture feature set according to the use of a full texture feature set, the use of a subset of texture features selected by means of the GA, and the use of a subset of texture features selected by means of the RA (cf. Section 4.1). Secondly, the experimental corpus and the defined ground truth used in our experiments are detailed in Section 4.2. Then, qualitative results are given to demonstrate the performance of each texture-based feature set according to the use or not of a feature selection algorithm (cf. Section 4.4). Afterwards, we discuss quantitatively the obtained performance of the texture feature analysis experiments (cf. Section 4.4). Finally, our conclusions and future work are presented in Section 5.

2. Texture Features

Recently, many DIA issues have been focused on using texture-based approaches for segmentation and classification tasks [6]. Indeed, the use of texture analysis techniques for historical document images has become an appropriate choice, since it has been shown that texture-based approaches work effectively with no a priori knowledge about the layout, content, typography, font and graphic styles, scanning resolution, document image size, etc. Moreover, the use of a texture-based approach has been shown to be effective with skewed and degraded images. Therefore, the interest in using a texture-based method for historical DIA is continuously increasing [11].
In the literature, based on extracting and analyzing texture features a texture-based method has been usually used to partition the analyzed image into regions. The obtained regions have similar properties and characteristics with respect to the extracted texture features [12]. Thus, this study is based on the two following assumptions: text regions have different texture features from non-text ones and textual regions with different fonts are also distinguishable [6].
Relatively a limited number of comparative studies address the problem of presenting quantitative comparisons of texture-based algorithms, although it is commonly agreed that texture analysis plays a fundamental role for DIA [13]. Visual or qualitative results of seven texture-based methods (run-lengths, multi-channel Gabor filters, texture co-occurrence spectrum, white tiles, texture masks, structured wavelet packet analysis and laws masks) have been reported in [6]. Mehri et al. [11] presented a benchmarking of the most classical and widely used texture-based feature sets which had been conducted using a classical texture-based pixel-labeling scheme on a corpus of historical document images. This comparative study has been carried out for selecting the most relevant texture feature set based on the best trade-off between the best performance and the lowest computation time.
Therefore, the texture-based features which are compared and evaluated in this article have been derived from the Tamura, LBP, GLRLM, auto-correlation, GLCM, Gabor filters and three wavelet-based approaches: Haar, Db3 and Db4.

3. Feature Selection Algorithms

Using a texture-based method often involves a large number of texture features in high-dimensional spaces to be analyzed. Indeed, each analyzed image will be described by a set of multi-dimensional texture-based feature vectors. This will induce greater computational cost and occupy a lot of storage space since a large and complex feature space has been generated. Moreover, it is worth noting that the smaller the dimension of the analyzed texture-based space, the easier it will be to deal with the specified task. Besides, if the number of dimensions becomes very large, this will make it more difficult to compute data similarity and perform data mining tasks. Indeed, the data similarity is sensitive to the number of dimensions (curse of dimensionality) since it is based on computing distance between vectors (i.e., the higher the number of dimensions, the higher the values of distance between vectors and the more difficult it will be to group data).
Based on these findings, redundant or even irrelevant features may affect the learning process and consequently reduce the pixel classification accuracy in the case of our work. For instance, Journet et al. [14] extracted three auto-correlation features and two frequency descriptors by using a multi-scale analysis for classifying pixels into text, graphics and background in historical document images. Then, they proposed to reduce the dimension space of the extracted features using the principal component analysis technique. They demonstrated that only 78 % of the extracted features are relevant. In order to classify pixels from historical document images into four classes (periphery, background, text block, and decoration), Wei et al. [15] used the convolutional auto-encoder features and concluded that more than 80 % of the analyzed features are redundant or irrelevant.
Therefore, a feature selection phase is often required to avoid these problems by selecting the most relevant features and remove redundant ones from the original large set of texture-based features [16]. Sequential forward selection, sequential backward selection, tabu search, genetic algorithm and ReliefF algorithm are the most well-known and widely used feature selection algorithms [17]. A feature selection algorithm is based on using a search technique to evaluate different proposals of feature subsets by means of an evaluation measure in order to determine the one that has the best performance [18].
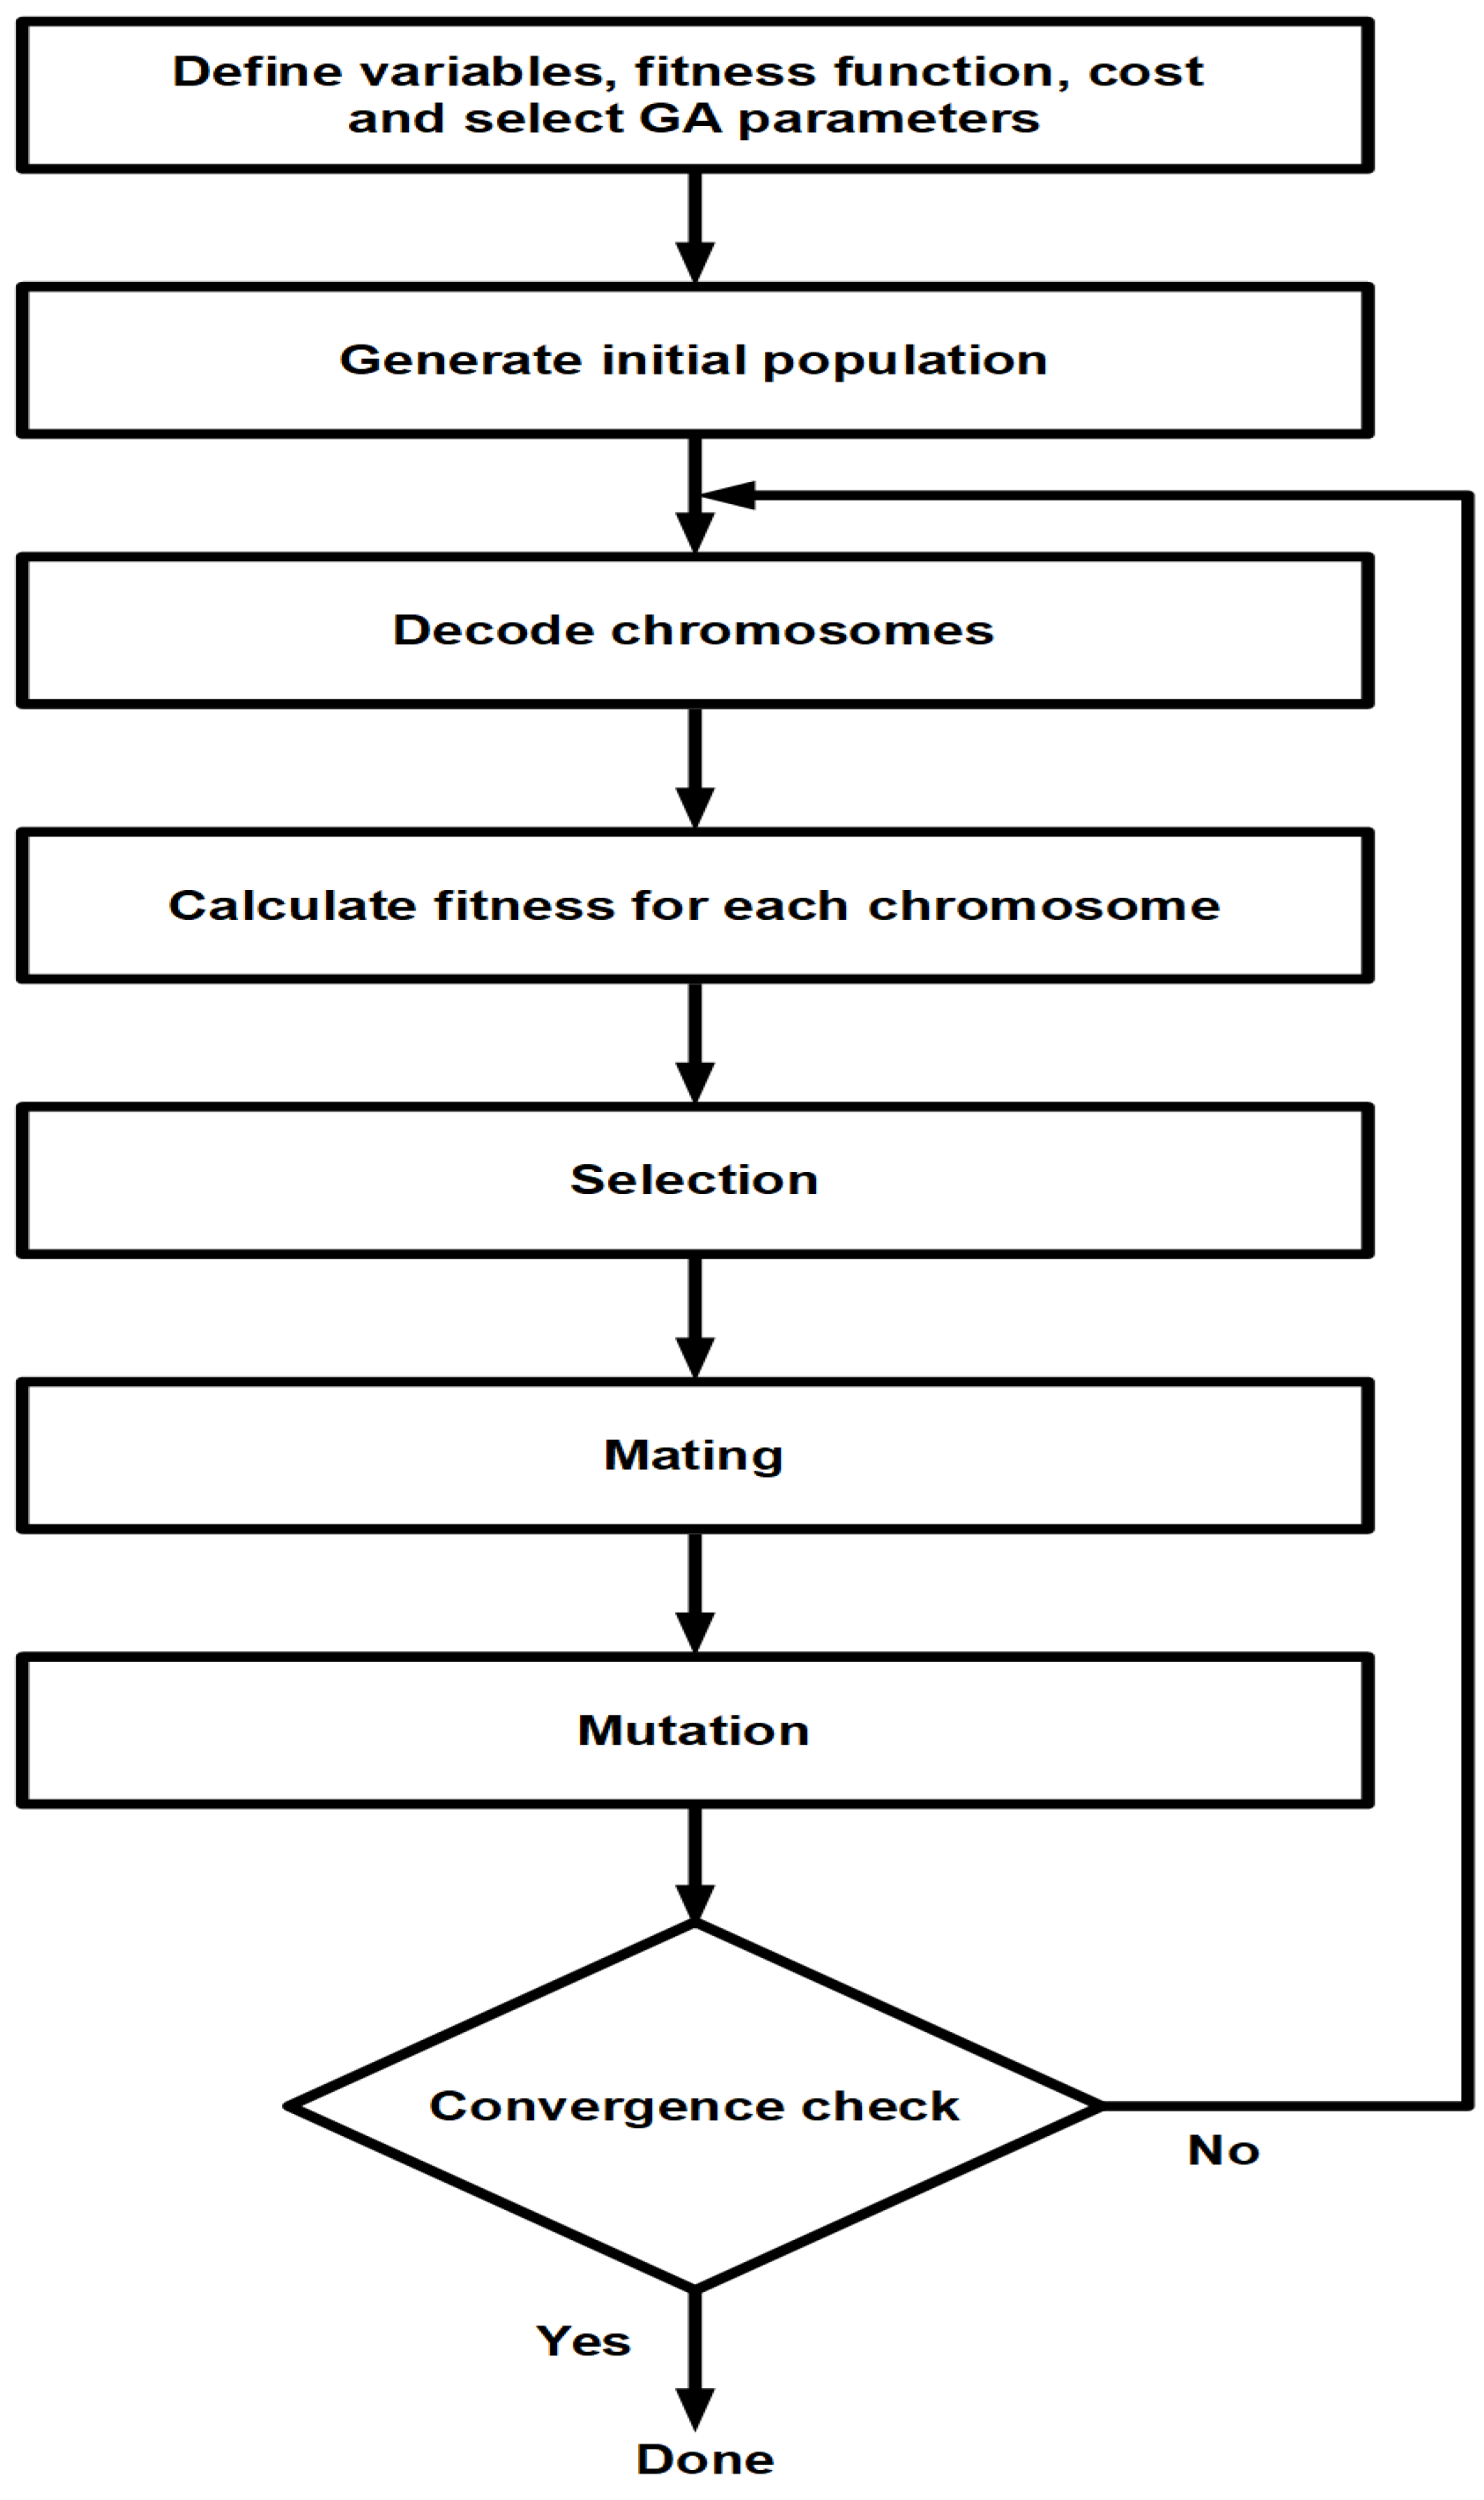
Figure 1 depicts the common key steps of a feature selection process. The general procedure for feature selection starts by creating a candidate feature subset for evaluation. Each candidate subset is evaluated by using an evaluation criterion to measure the quality of the selected features. The process of subset generation and evaluation is repeated until a predefined stopping criterion is satisfied. The feature selection process ends by outputting the selected subset of features to a validation procedure.
Few researchers have addressed feature selection issues for historical DIA. For instance, Tao et al. [19] proposed a feature selection algorithm based on using the LBP operator and dimension reduction technique for Chinese character font categorization. A hybrid feature selection method was proposed by Wei et al. [20] for historical DIA. The proposed feature selection method was based on using an adapted greedy forward selection method and the genetic selection algorithm in a cascading way to select different kinds of features including color, gradient, and LBP. By comparing their method with four conventional feature selection methods (genetic selection, linear forward Selection, best first forward selection and best first backward selection), Wei et al. [20] concluded that their method selected significantly fewer features and provided lower error rates. They also concluded that the most discriminative features for layout analysis of documents of diverse nature are the LBP ones. In our paper, we have focused on the multi-scale texture analysis of historical document images using nine texture feature sets (Tamura, LBP, GLRLM, auto-correlation, GLCM, Gabor filters, Haar, Db3 and Db4). However, Wei et al. [20] investigated three main sets of texture features (color, gradient and LBP features) without using a multi-scale analysis. They combined all these features in a 204-dimensional feature vector. Furthermore, we have investigated separately the two feature selection algorithms (genetic and ReliefF algorithms) on each texture feature set. However, a cascading feature selection method (a cascade of an adapted forward selection and a genetic selection algorithms) was proposed in [20]. Besides, comparing to [20] we have used more images (60 images) during the training phase.
To the best of our knowledge, there is no comparative study that has been carried out to investigate jointly the most well-known texture-based feature sets and widely used feature selection algorithms for historical DIA. Therefore, we propose in this article to evaluate the use of two conventional feature selection algorithms, genetic algorithm and ReliefF algorithm, in order to select an optimal subset of each texture-based feature set for pixel-labeling task in ancient document images.

3.1. Genetic Algorithm

The genetic algorithm (GA) is a search heuristic that mimics the process of natural evolution. First, a population of chromosomes which encodes candidate solutions is created. A chromosome is a string of bits (1 and 0 indicate whether a feature is selected or not, respectively) whose size corresponds to the number of features. Then, the solutions are evolved by applying genetic operators such as crossover and mutation to find the best solution based on a predefined fitness function. Commonly, the GA terminates when either a maximum number of generations has been produced or a satisfactory fitness level has been reached for the population [21]. Algorithm 1 details the different parameters used in the GA. More details were given in [22] with a thorough description of the different parameters used in the GA.
Figure 2 presents a flowchart summarizing the fundamental steps of the GA used in this study. The GA starts by creating an initial population of randomly generated individuals using the following formula:
P = r o u n d ( ( L 1 ) × r a n d ( D F , 200 × D F ) ) + 1
where L and D F represent the number of input features and the desired number of selected features, respectively. In the GA experiments, D F is set to L / 2 .
Algorithm 1 Basic genetic algorithm [21]
Input: Crossover probability ( P c o )
            Mutation probability ( P m u t )
            Population size (L-chromosomes- or classifier- by N-bits)
            Criteria function ( F i t ( ) )
            Fitness threshold ( θ )
Output: Set of highest fitness chromosomes (best classifier)
1:repeat
2:    Determine the fitness of each chromosome: F i t ( i ) , i = 1 , , L
3:    Rank the chromosomes
4:    repeat
5:        Select two chromosomes with highest score
6:        if R a n d [ 0 , 1 ] < P c o then
7:           Crossover the pair at a randomly chosen bit
8:        else
9:           Change each bit with the probability P m u t
10:           Remove the parent chromosomes
11:    until N offspring have been created
12:until Any chromosome’s score F i t ( ) exceeds θ
13:return Highest fitness chromosome (best classifier)
In each generation, a proportion of the existing population is selected to breed a new generation. Each selected individual solution is evaluated on the basis of its overall fitness. In the GA experiments, a fitness function based on the principle of Minimum Redundancy Maximum Relevance ( m R M R ) is used [22]. The key idea of m R M R is to select the set S with m features { x i } that satisfies the maximization problem:
m a x Φ i ( D , R ) ; Φ ( D , R ) = D R
where D and R represent the max-relevance and min-redundancy, respectively. D and R are defined as follows:
D = 1 S x i S I ( x i , y )
R = 1 S 2 x i , x j S I ( x i , x j )
where I ( x i , y ) and I ( x i , x j ) represent the mutual information, which is the quantity that measures the mutual dependence of the two random variables and is calculated as follows:
I ( x , y ) = H ( x ) + H ( y ) H ( x , y )
where H ( . ) is the entropy.

3.2. ReliefF Algorithm

The ReliefF algorithm (RA) is one of the most famous feature weighting methods. It assigns a weight to each feature, and the features values over a particular threshold are selected. The key idea of the RA is to select features randomly, and then based on nearest neighbors the relevance of features according to how well their values distinguish among the instances of the same and different classes that are near to each other is estimated [23]. The bigger the weight value, the better the feature is. Algorithm 2 gives a more detailed description of the process of the RA method. More details were given in [24] with a thorough description of the key steps of the investigated RA.
Algorithm 2 ReliefF algorithm [24]
    Input: For each training instance:
                 Vector of attribute values ( A i , i = 1 , , a )
                 Class value (C)
    Output: Vector W of the estimations of the qualities of attributes
1: Set all weights W [ A ] : = 0.0
2: for i:=1 to m do
3:       Randomly select an instance R i
4:       Find k nearest hits H j
5: for each class C c l a s s ( R i ) do
6:       From class C find k nearest misses M j ( C )
7: for A:=1 to a do
W [ A ] : = W [ A ] j = 1 k d i f f ( A , R i , H j ) m × k + C c l a s s ( R i ) P ( C ) 1 P ( c l a s s ( R i ) ) j = 1 k d i f f ( A , R i , M j ( C ) ) m × k
where m is a user-defined parameter. d i f f ( A , I 1 , I 2 ) is a function that computes the difference between the values of the attribute A for two instances I 1 and I 2 . P ( . ) denotes the prior probability.

4. Evaluation and Results

In this section, a brief description of the main phases of the pixel-labeling scheme used for analyzing and selecting texture features is presented. Then, qualitative results are given to demonstrate the performance of each texture-based feature set according to the use or not of a feature selection algorithm. Subsequently, the performance of each texture feature set according to the use of a full texture feature set, the use of a subset of texture features selected by means of the GA, and the use of a subset of texture features selected by means of the RA is discussed after describing our experimental corpus and its associated ground truth, and presenting the used accuracy metrics for performance evaluation.

4.1. Pixel-Labeling Scheme

In order to investigate the importance of using a feature selection algorithm for historical DIA, a generic and standard framework that ensures a fair analysis and comparison of performance is required. The proposed framework is presented in this study as a pixel-labeling scheme based on analyzing and selecting texture features. It aims at analyzing and comparing of the performance of each texture feature set according to the use of a full texture feature set, the use of a subset of texture features selected by means of the GA, and the use of a subset of texture features selected by means of the RA.
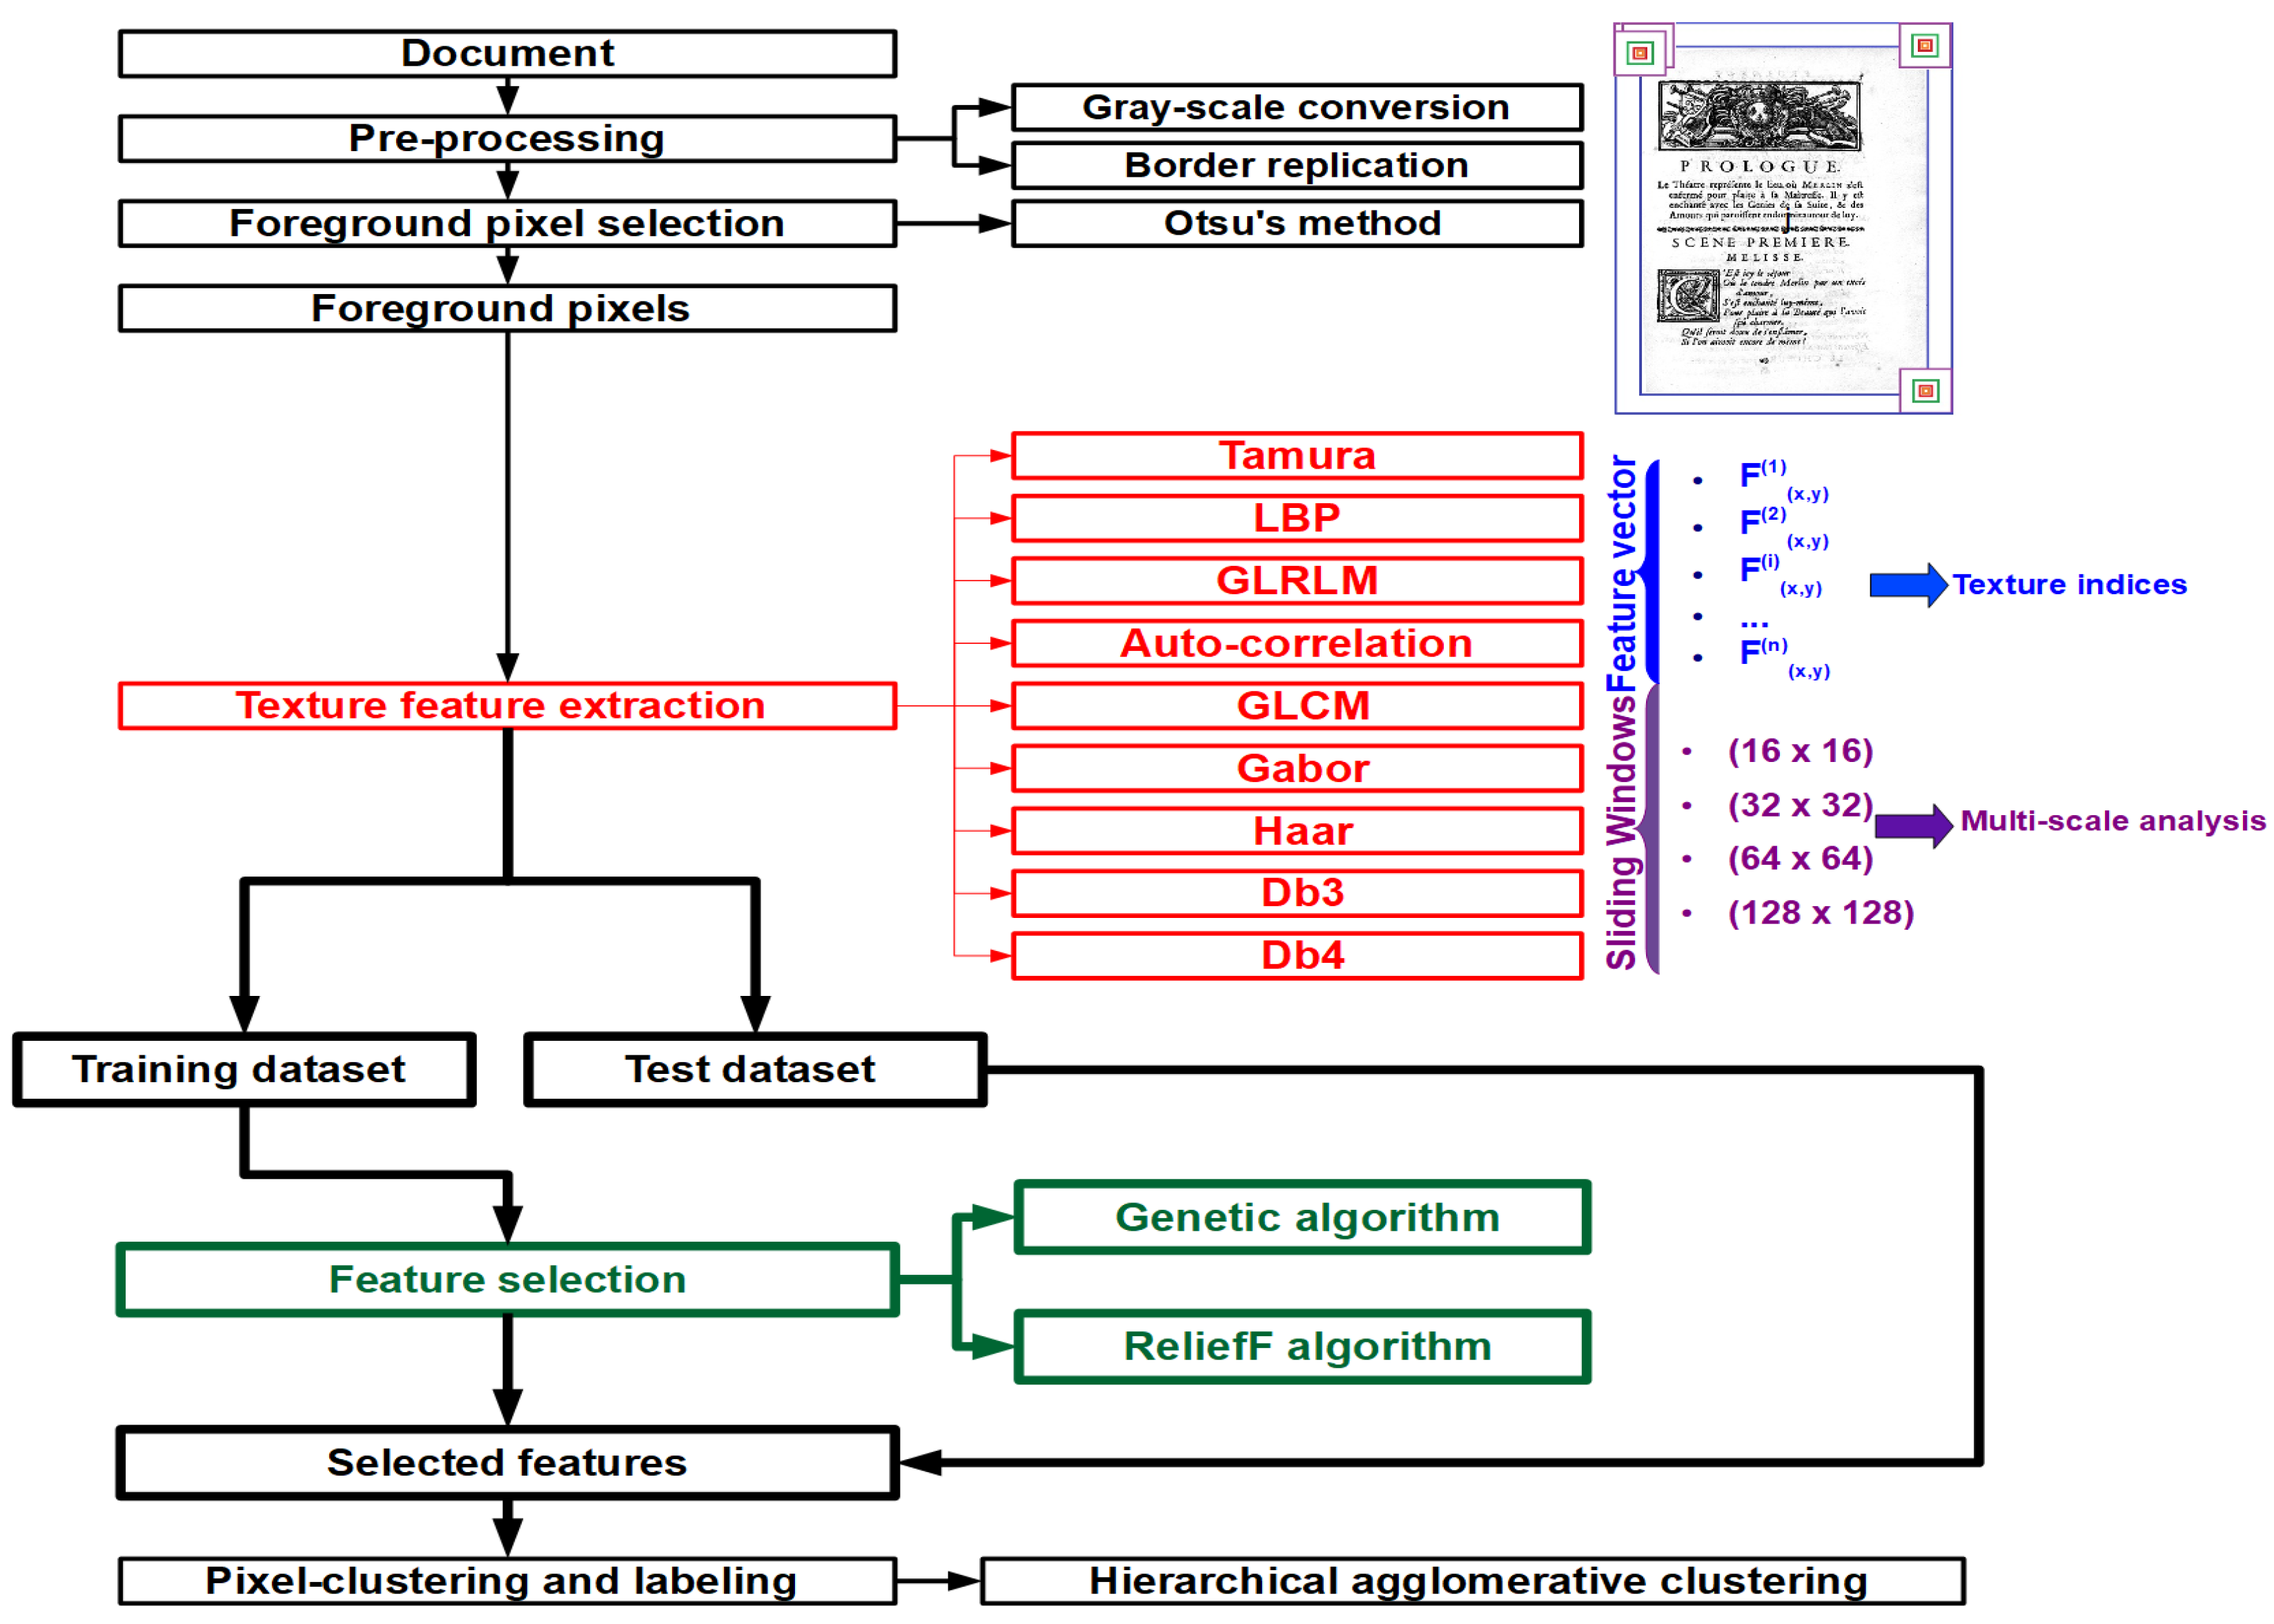
The main goal of the proposed pixel-labeling consists of structuring the texture feature space within a clustering technique in order to group pixels sharing similar characteristics. The proposed pixel-labeling scheme forms the basis of a classical layout analysis approach and cornerstone of different DIA tasks related to segmentation, analysis, classification and recognition of historical document images, etc. The pixel-labeling scheme used in our experiments to analyze and select texture features is illustrated in Figure 3.
First of all, each historical document image of our experimental corpus is fed as input of our proposed pixel-labeling scheme. Then, texture feature have been extracted only from the foreground pixels of gray-scale images without using any binarization step. By using analysis windows of varying sizes (i.e., a pixel-wise technique), the texture feature extraction step is performed in order to adopt a multi-resolution/multi-scale approach. By using a multi-scale approach, more reliable information can be obtained and region boundaries can be identified more accurately since textural characteristics can be perceived differently at varying scales. A border replication step is applied on each image in order to deal with foreground pixels located at image borders when computing texture features.
Then, all extracted features have been used as input for both the GA and the RA individually. Two separate datasets, namely, the training dataset ( 60 % ) and the testing dataset ( 40 % ) that our experimental corpus comprises have been used separately in our experiments. A learning phase is introduced in the proposed pixel-labeling scheme that the most selected texture features will be identified according to the textural characteristics of a 60 % of document images selected randomly from the HBR2013 dataset. For each document image in the training dataset, only 50 % of all the features have been selected when performing separately the GA and the RA iterations. Afterwards, the subset of the most selected texture features used on evaluating the testing dataset is deduced based on the following heuristic: a texture feature would be counted among the subset of the most selected texture features by using a feature selection algorithm, if it was chosen by over half the images of the training dataset.
Given the results of the most selected texture features from the training dataset, an unsupervised clustering step is afterwards performed based on analyzing the subset of the most selected texture features extracted from the foreground pixels of the testing dataset. The clustering step is performed by using the hierarchical ascendant classification (HAC) algorithm and by setting the number of homogeneous and similar content regions (k) equal to the one defined in the ground truth in order to avoid inconsistencies and bias in assessments caused by estimating automatically the number of homogeneous and similar content regions and subsequently to ensure an objective understanding of the behavior of the evaluated texture feature sets and feature selection algorithms. The HAC algorithm is performed on the computed texture features without taking into account the spatial coordinates. The HAC algorithm process consists of successively merging pairs of existing clusters where at each cluster grouping step, the choice of cluster pairs depends on the smallest distance (i.e., clusters are grouped if the intra-cluster inertia is minimal). This linkage between clusters is performed using the Ward criterion along with the weighted Euclidean distance [25].
By using the HAC algorithm the obtained texture-based feature vector sets are partitioned into k compact and well-separated clusters in the multi-dimensional feature space, producing a pixel-labeled image as output. Since the used classifier process in the pixel-labeling scheme is unsupervised, the colors attributed to the different document image contents (text or graphics) may differ from one document image to another.

4.2. Corpus and Preparation of Ground Truth

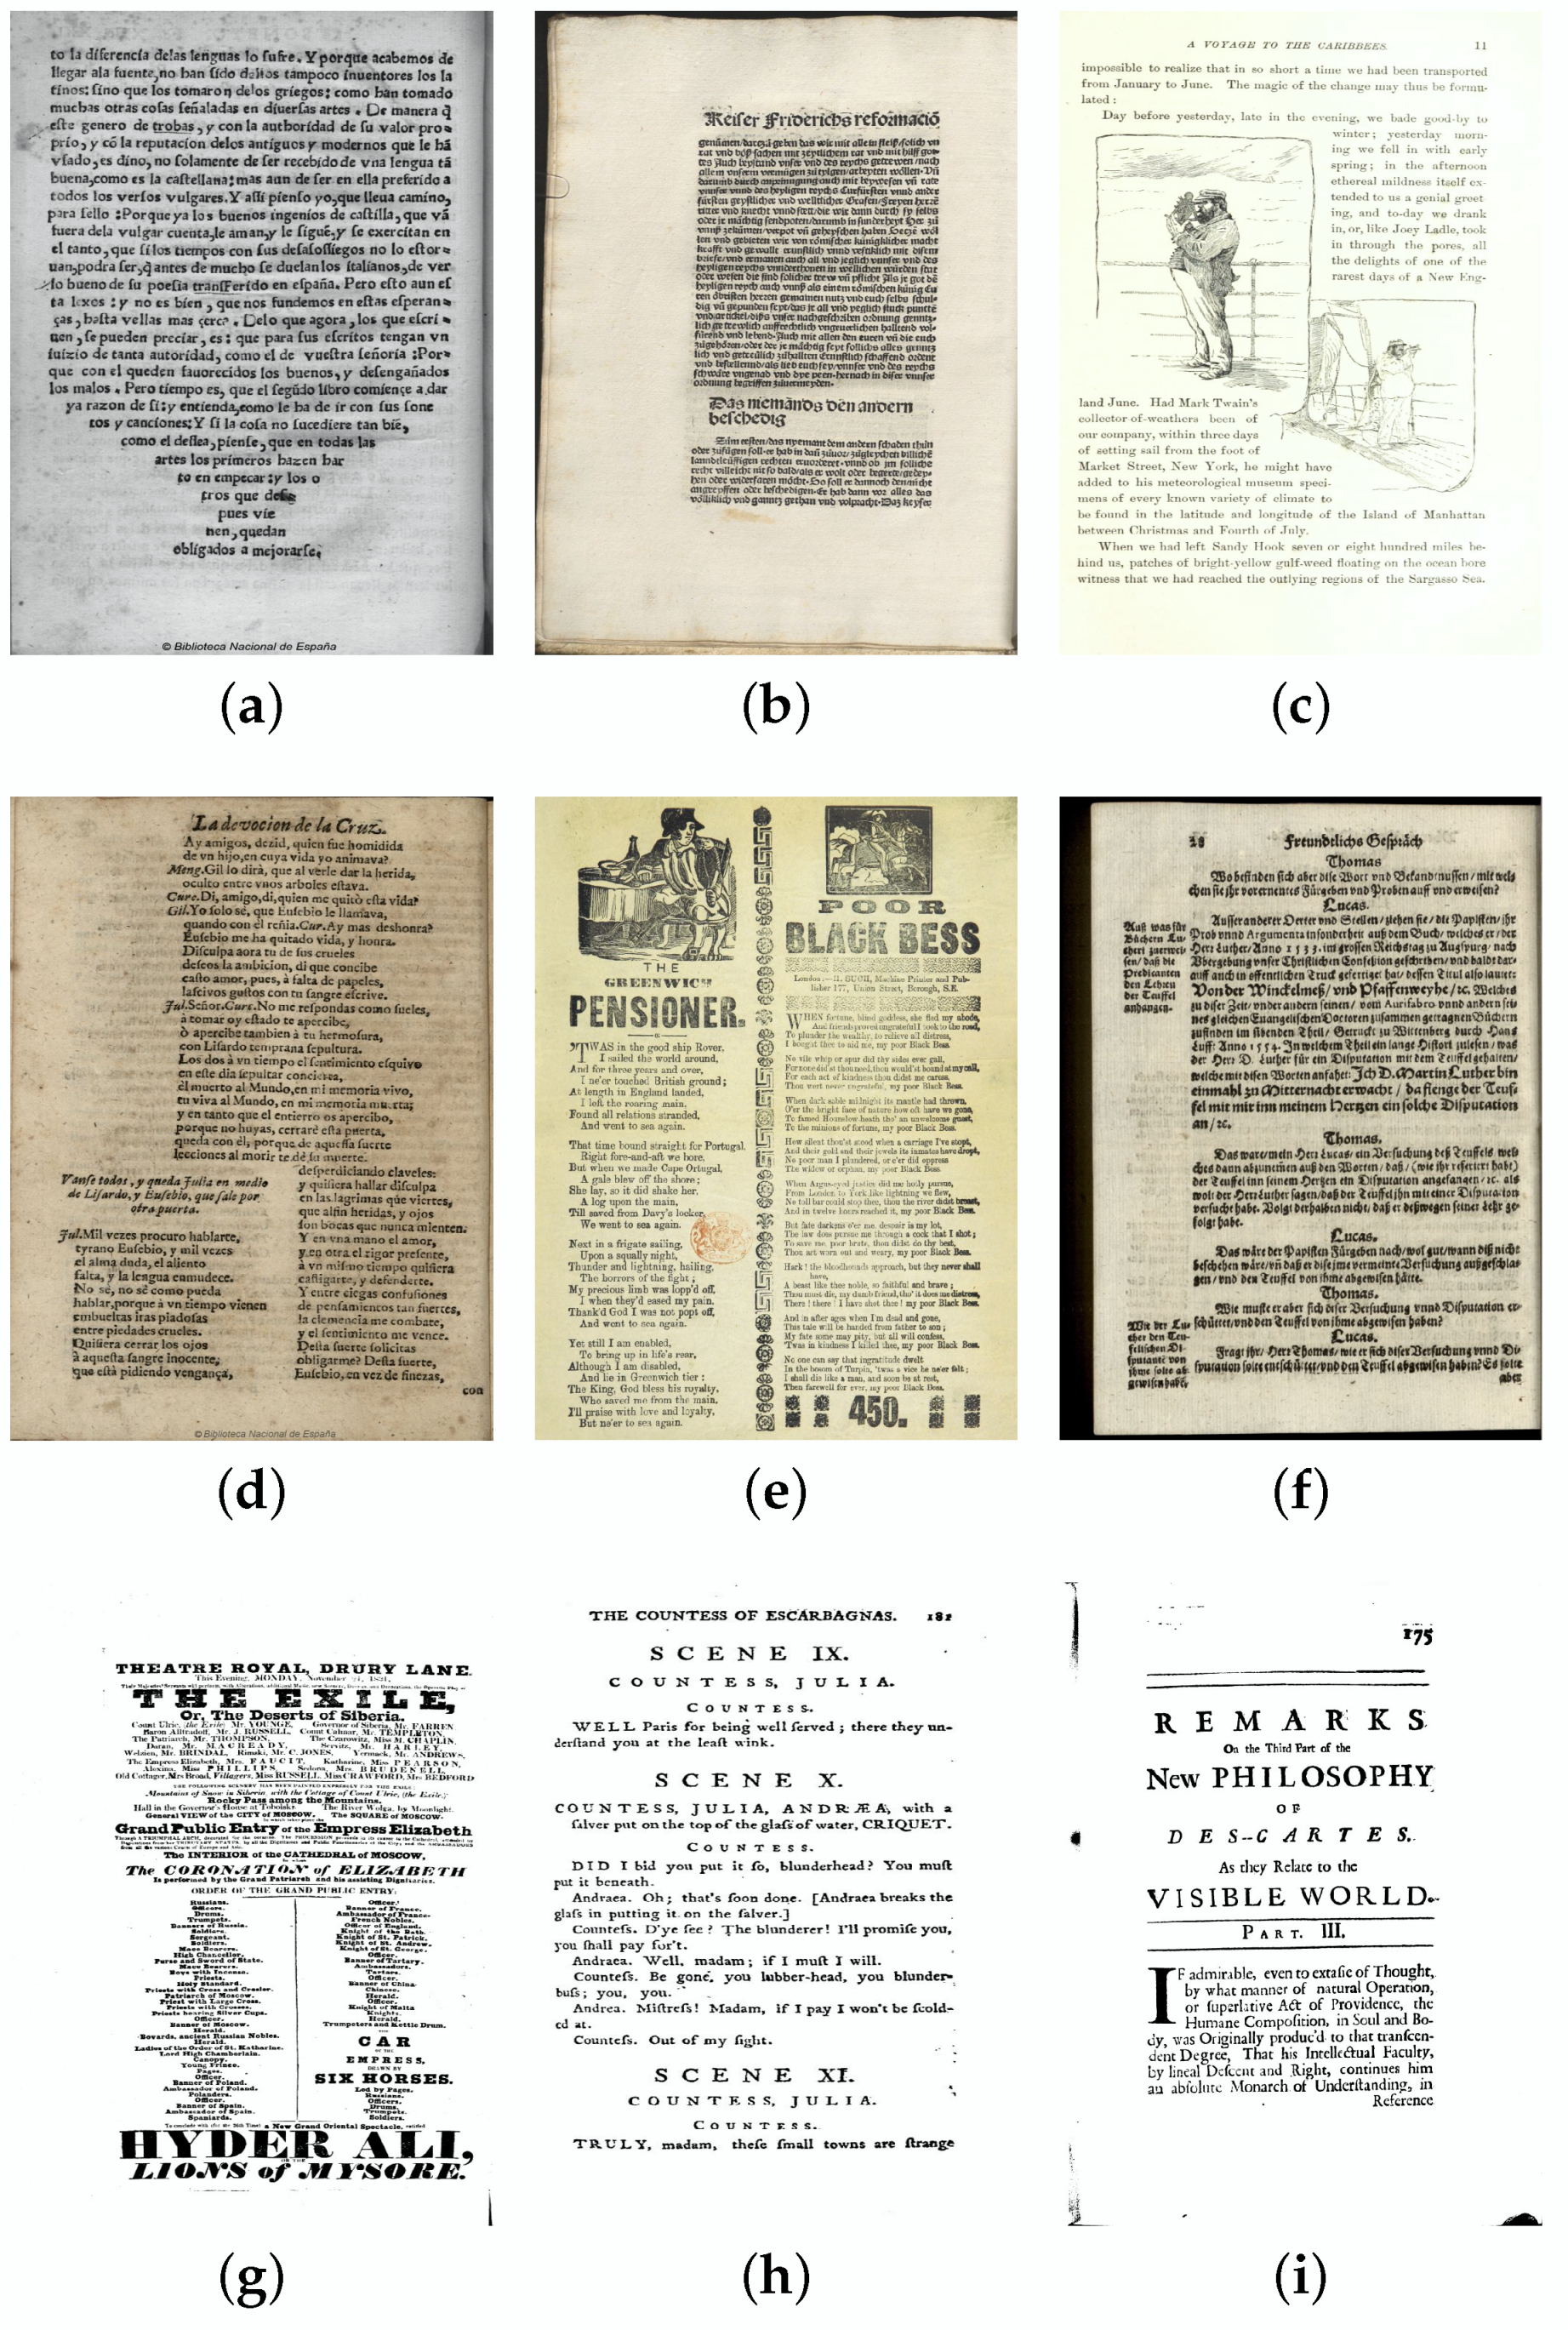
In our experiments, a public corpus of historical document images provided in the context of the HBR contest (HBR2013 dataset) has been used. The HBR2013 dataset contains 100 binary, gray-scale or color historical document images which were digitized at 150/300 dpi. Table 1 details the HBR2013 dataset characteristics. Figure 4 illustrates samples of pages of the HBR2013 dataset.
To analyze the performance of each texture-based feature set according to the use or not of a feature selection algorithm in the proposed pixel-labeling scheme, a pixel-based ground truth is required. For this purpose, the ground truthing environment for document images (GEDI) [26] has been used in our experiments.
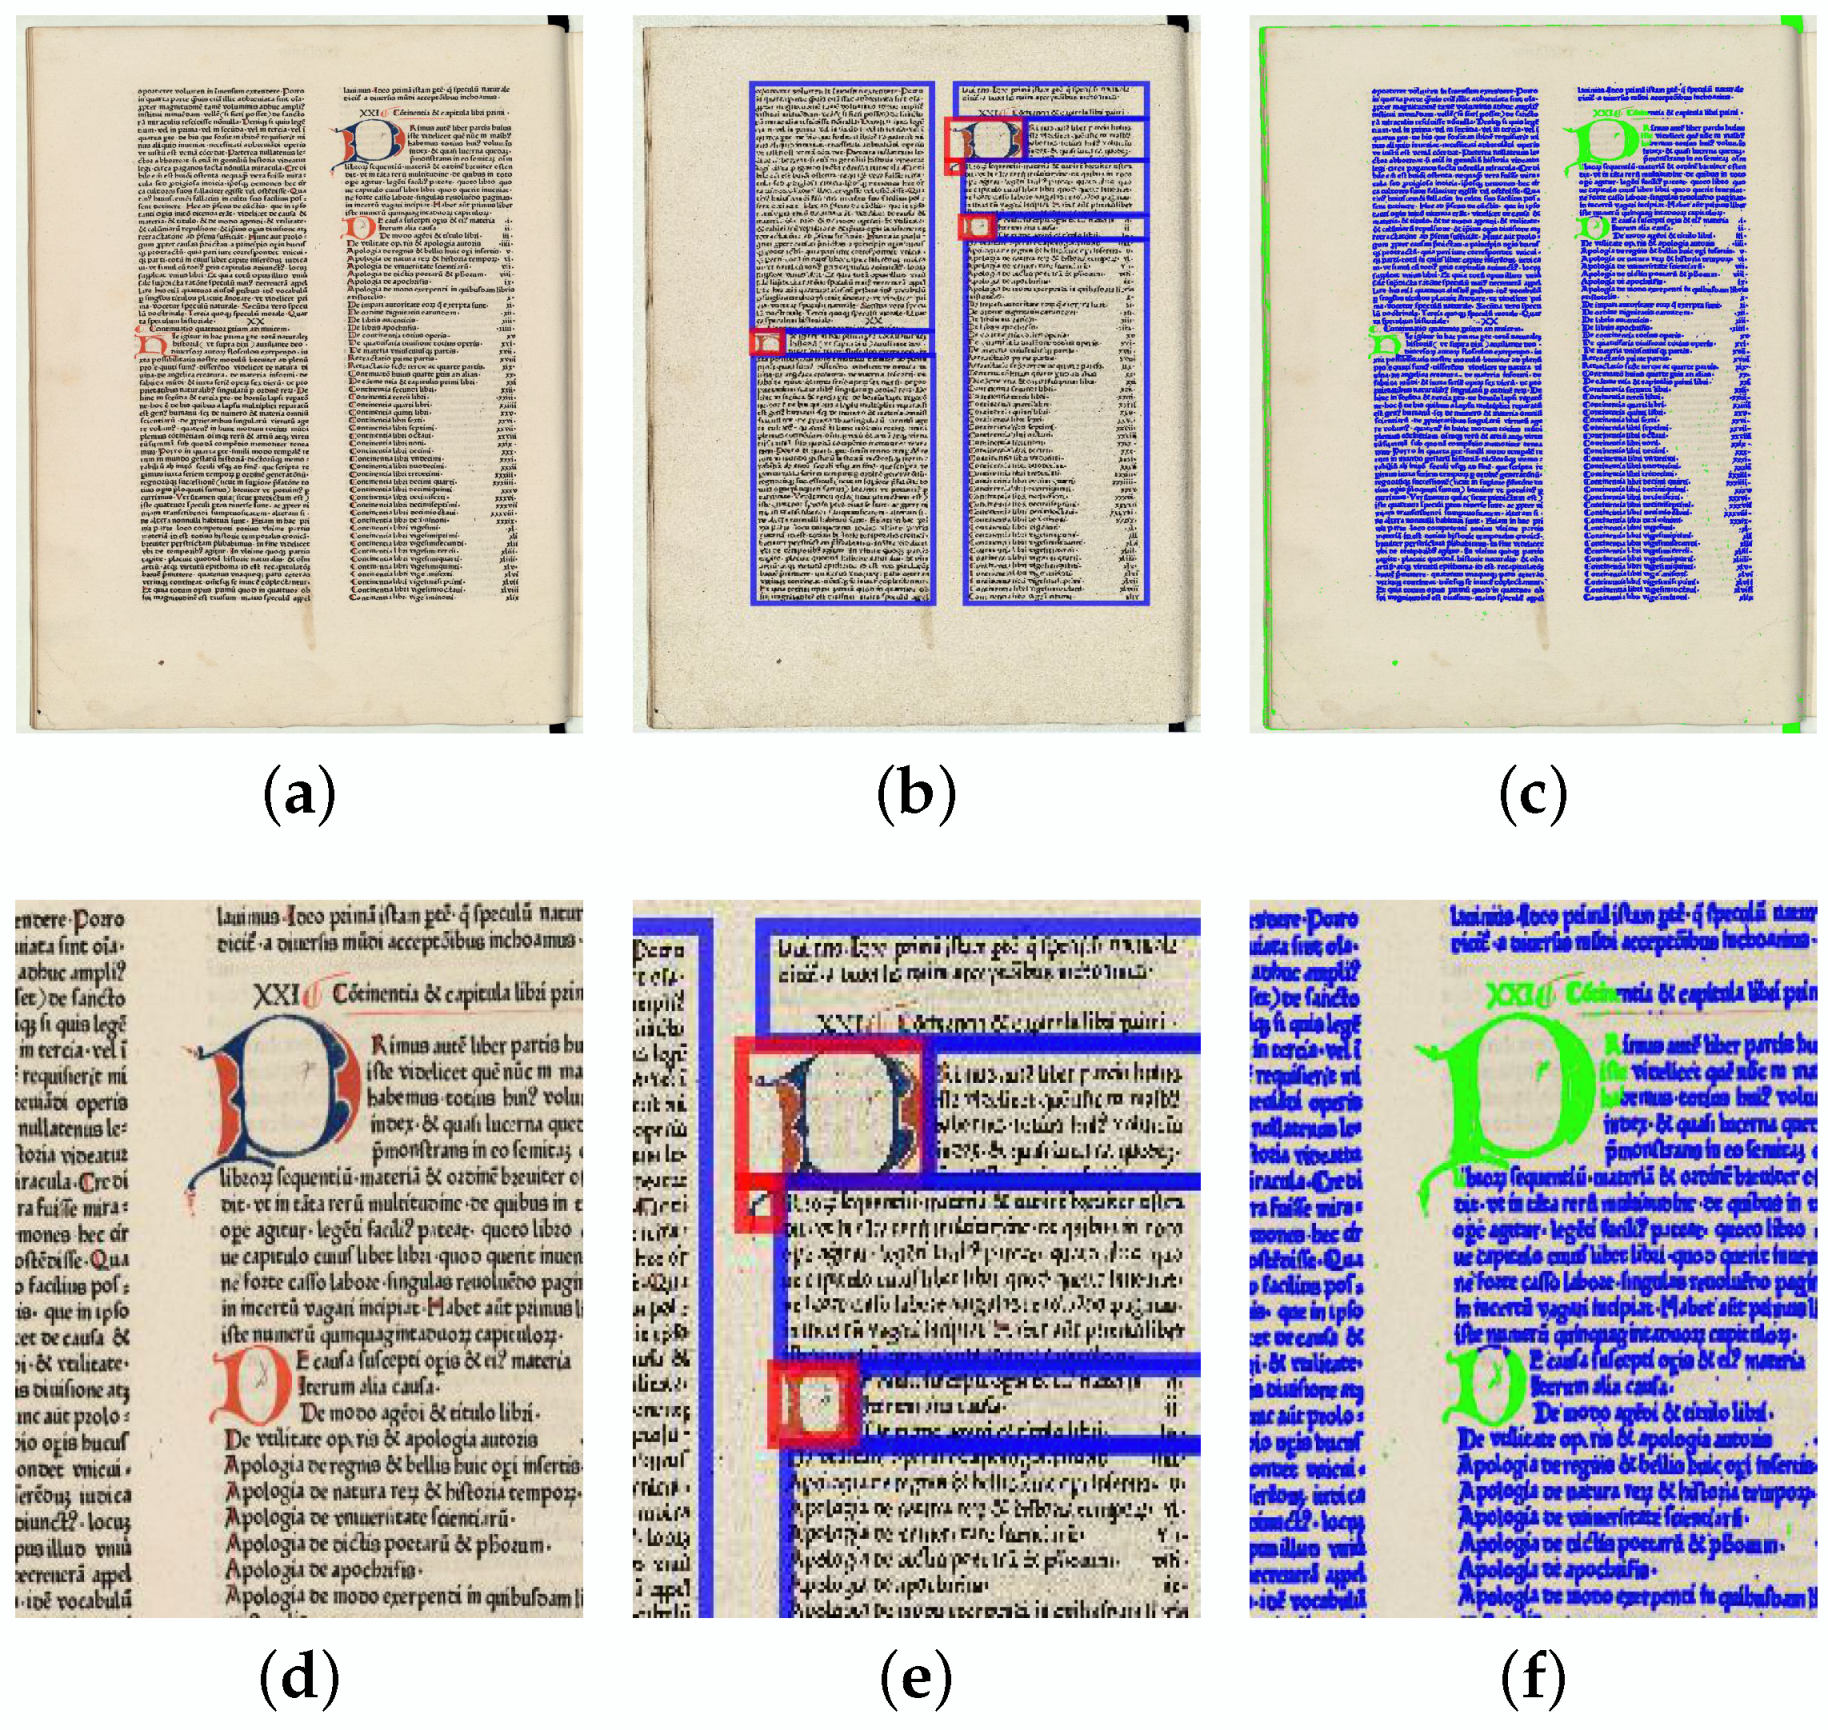
Our ground truth has been manually outlined by labeling spatial boundaries of regions annotating the textual and graphical contents. Figure 5 illustrates few examples of the defined ground truth. Different labels for regions with different fonts have been also annotated for evaluating the performance of texture feature to separate various text fonts. Then, to provide a pixel-accurate representation of the analyzed images of the HBR2013 dataset, each selected foreground pixel is annotated according to the label of the region to which it belongs.
Analyzing the nine sets of texture descriptors and two feature selection algorithms using the HBR2013 dataset gives a total of 1800 analyzed images (100 images × 9 different texture-based approaches × 2 different feature selection algorithms).

4.3. Qualitative Results

A visual comparison of the resulting images of historical document examples of the training and testing datasets of the HBR2013 dataset using the proposed pixel-labeling scheme is discussed in this section.
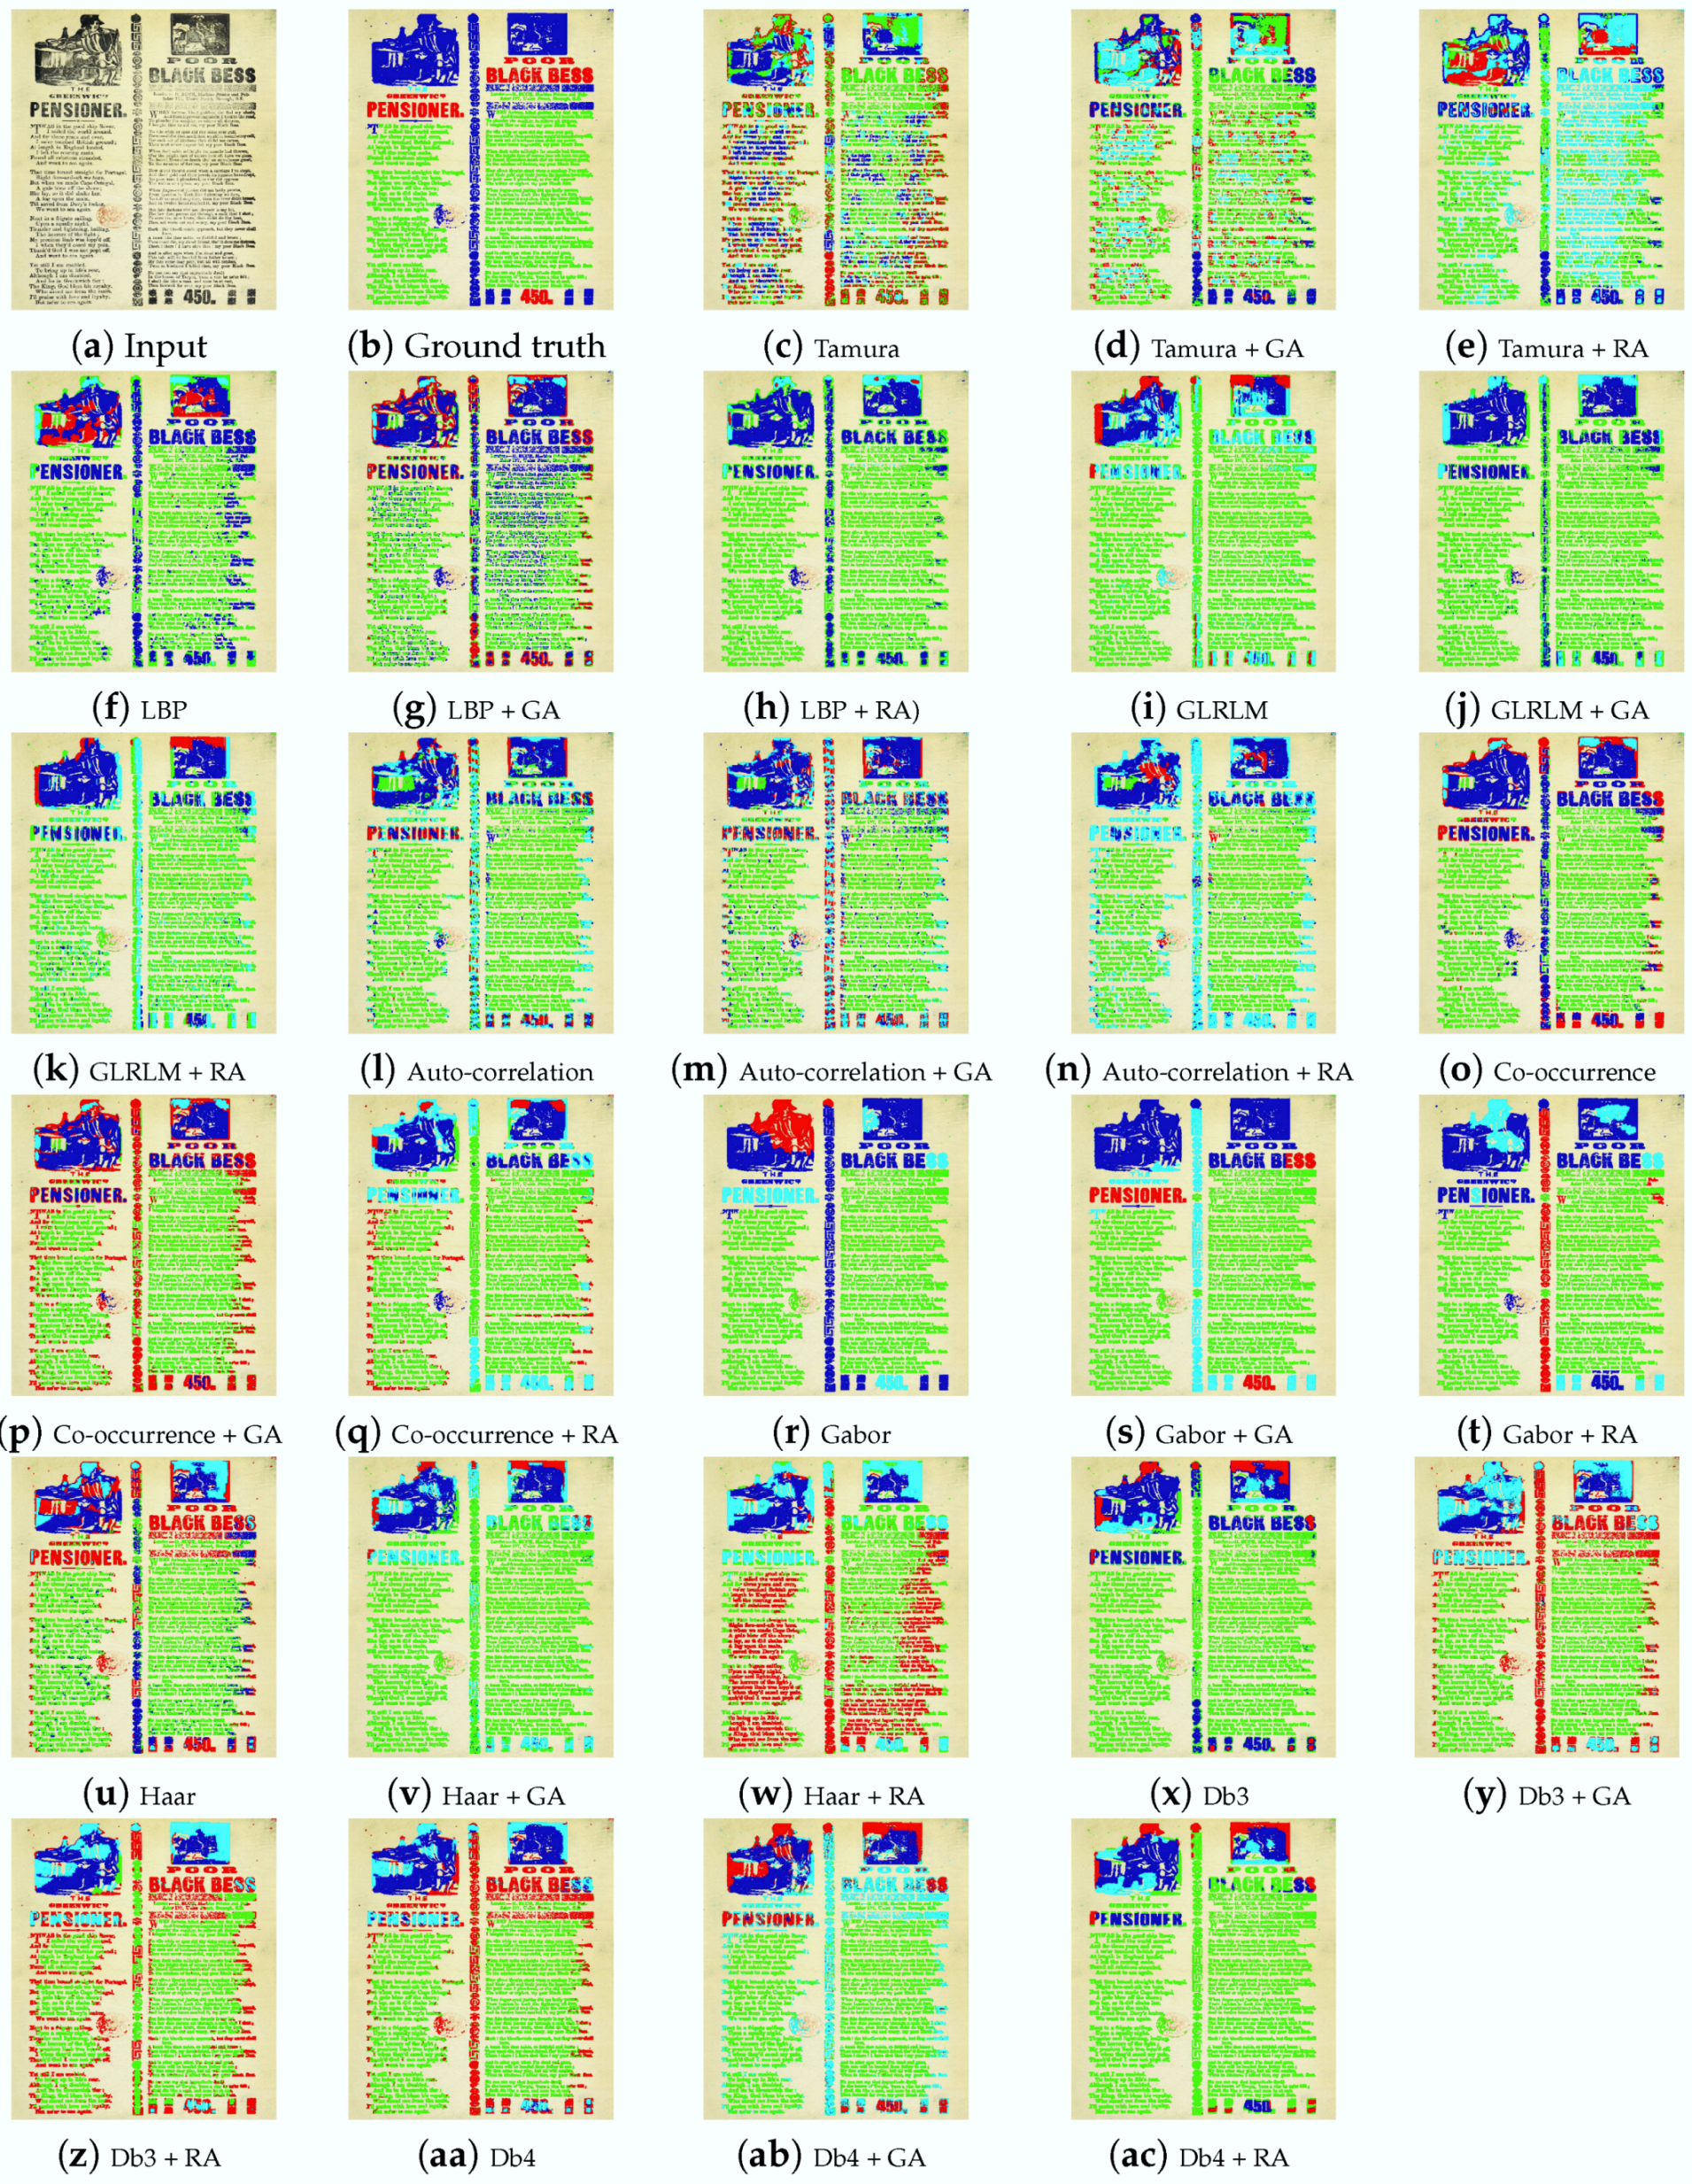
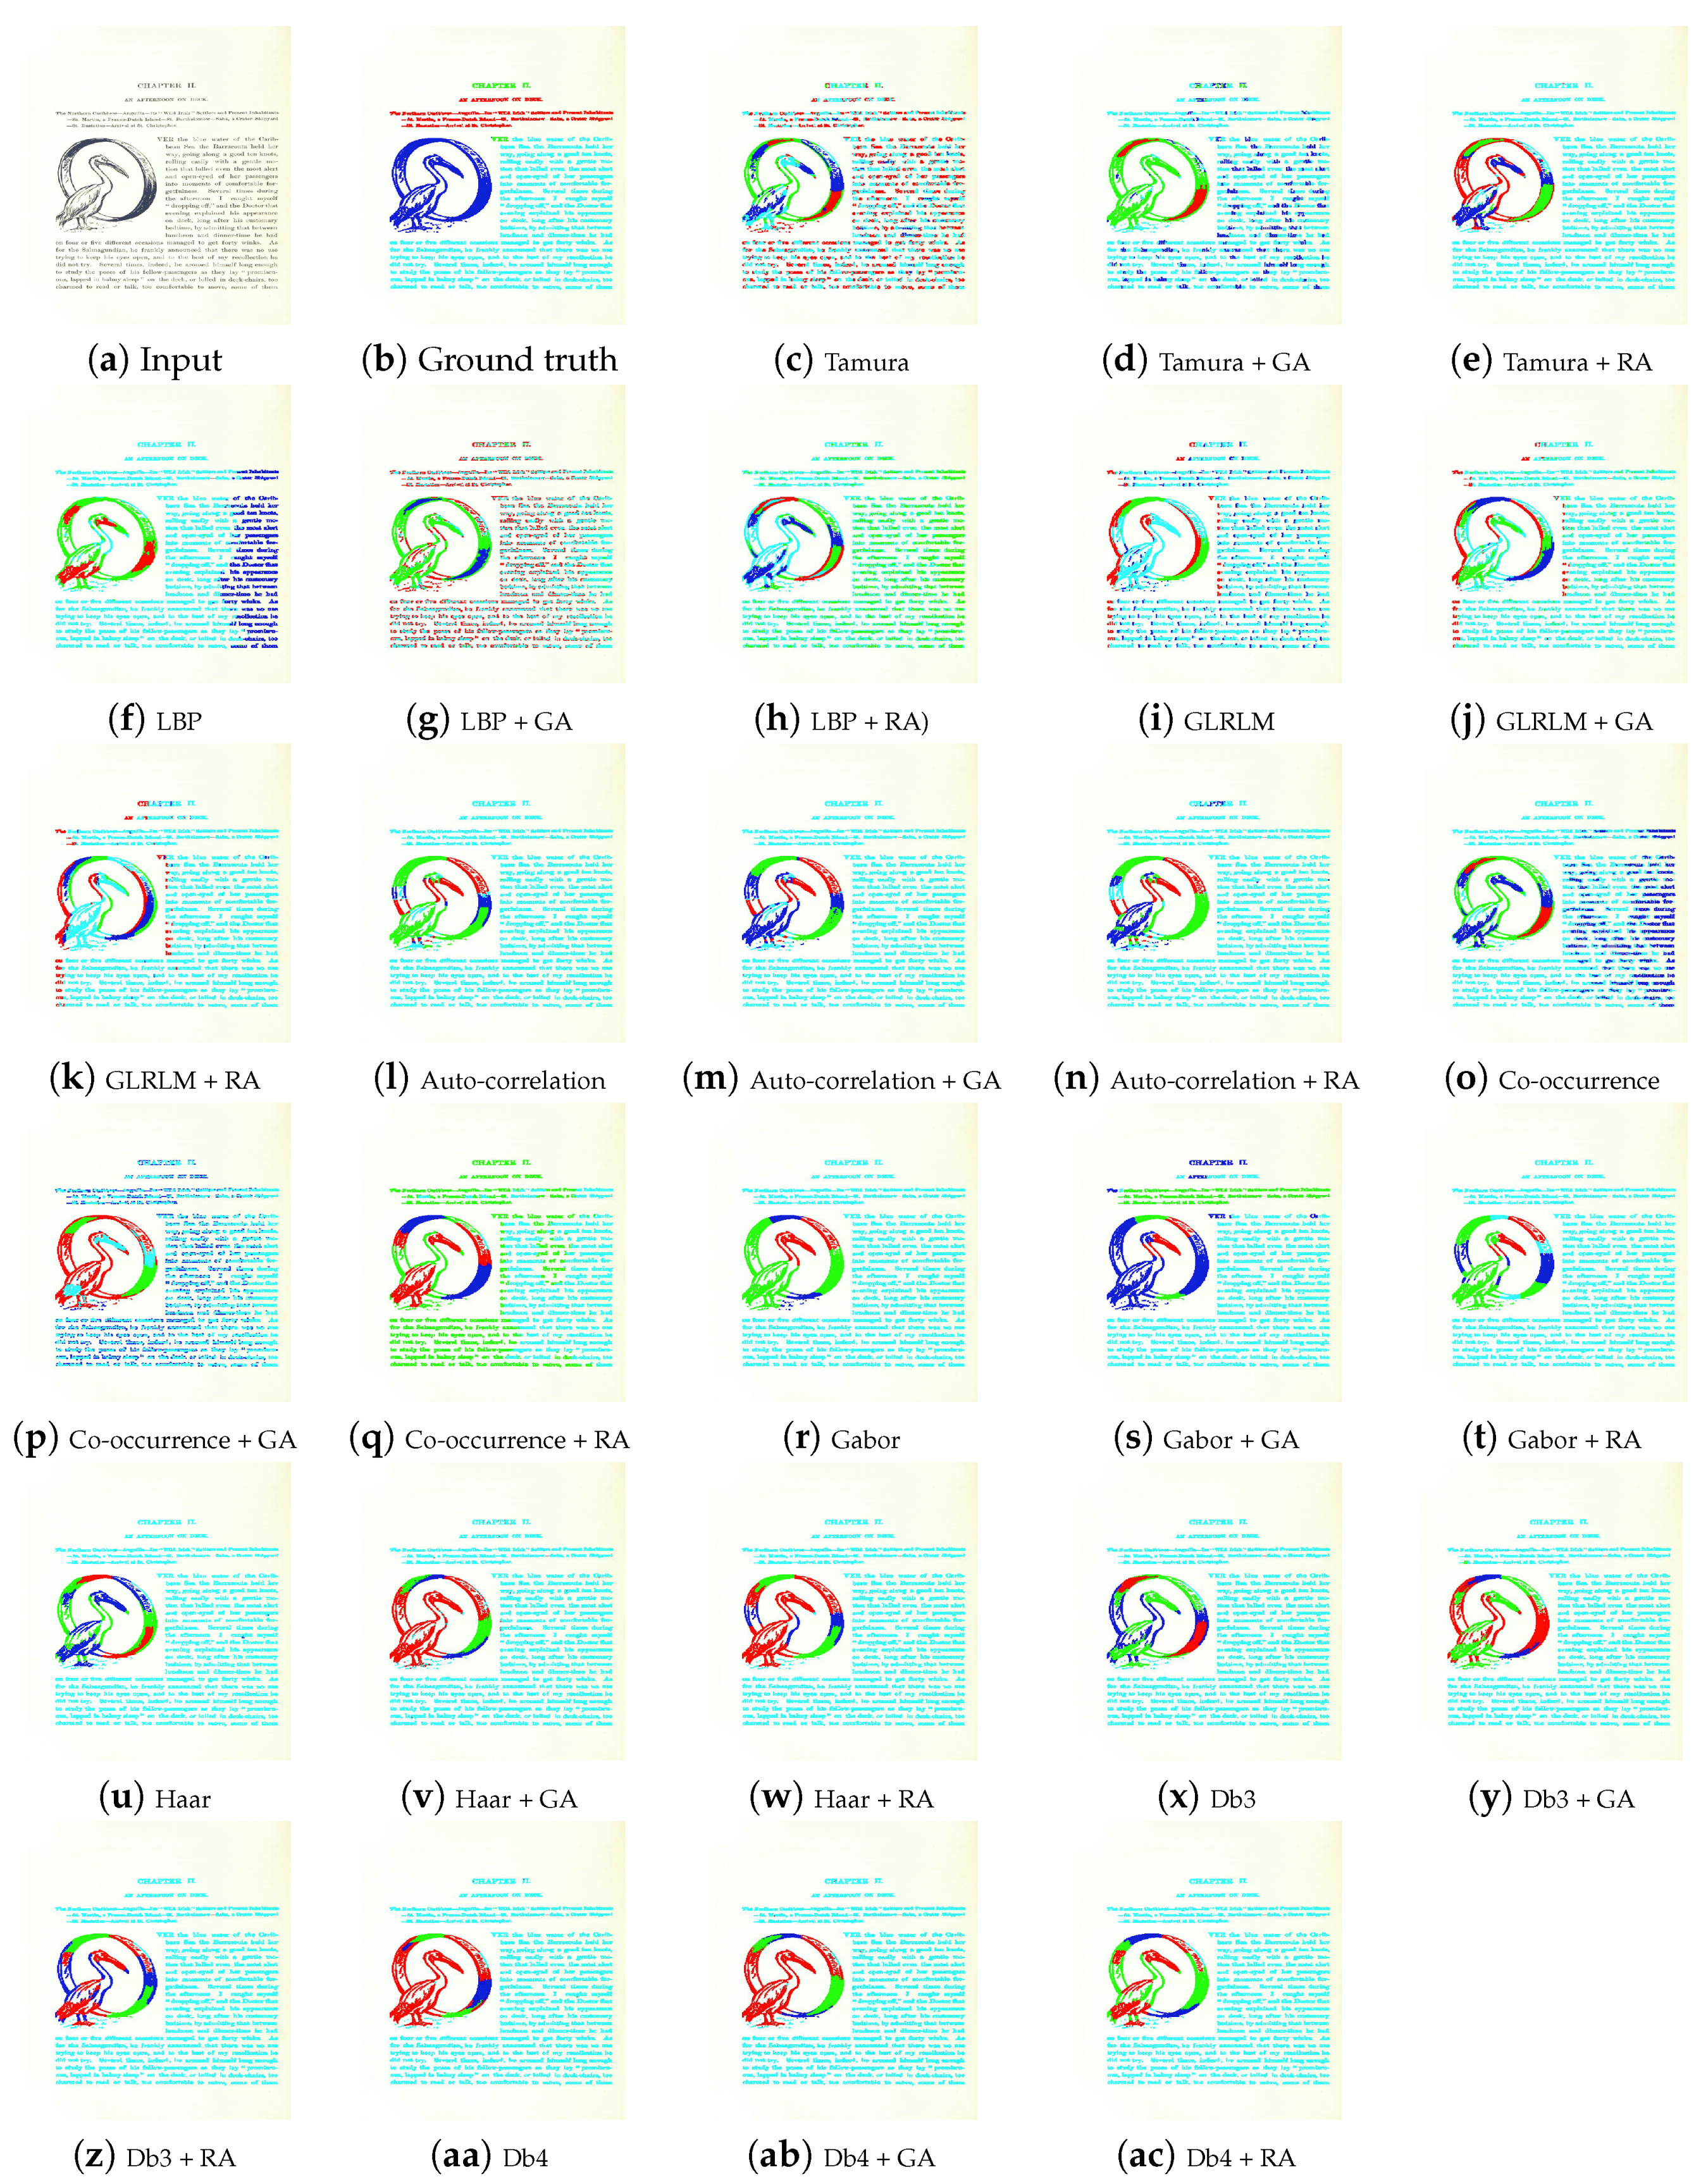
Figure 6 depicts the resulting images of a historical document example of the “Three fonts and graphics” category of the training dataset of the HBR2013 dataset, while Figure 7 illustrates the resulting images of a historical document example of the “Three fonts and graphics” category of the testing dataset of the HBR2013 dataset. The number of class labels in the resulting images is equal to 4. Since the pixel-labeling task is unsupervised, the colors attributed to text or graphics may differ from one document to another.
From the series of the resulting images given in the two Figure 6 and Figure 7, we see that the obtained results are slightly astounding. For instance, the best pixel-labeling results are given by analyzing the selected Gabor features by means of the GA when the analyzed document belongs to the training dataset (i.e., graphical regions in blue color are more homogeneous), which is not the case when the analyzed document belongs to the testing dataset (cf. Figure 6s). This can be justified by the particularities of the HBR2013 dataset (strong heterogeneity, with differences in layout, typography, illustration style, complex layouts and historical spelling variants, etc.) since it consists of printed documents of various types (e.g., books, newspapers, journals, legal documents). It represents a wide variety of layouts that reflect several particularities of historical document images. This points out that applying a global selection on the HBR2013 dataset is not quite relevant that it is necessary to train on documents having similar characteristics in terms of the layout structure and/or typographic/graphical properties of the historical document image content. The quality of the pixel-labeling task will be more convincing if we use a feature selection algorithm on documents having some similarities of document content type (some similarities of document content type can be deduced from many book pages since a document content type can be repeated on many pages of the same book).
By comparing the visual results of a document belonging to the testing dataset, we note a drop in performance in terms of homogeneity when the analyzed features are given by selecting the LBP and Gabor features by means of the GA (cf. Figure 7g,s) and by means of the RA (cf. Figure 7h,t). In Figure 7s, we show that some foreground pixels characterizing a textual content (cyan) has been labeled as graphical one (green and blue), while in Figure 7t we see that some foreground pixels characterizing a graphical content (red, green, and blue) has been labeled as textual one (cyan).
We also show that the results have significantly improved when using in the proposed pixel-labeling scheme the Tamura features selected using the RA on documents of the training and testing datasets (cf. Figure 6e and Figure 7e). We observe that when using the selected GLRLM features by means of the GA and RA algorithms on a document of the testing dataset, the pixel-labeling quality has improved considerably (cf. Figure 7j,k), unlike when using the selected auto-correlation features (cf. Figure 7m,n). The pixel-labeling results given by analyzing the full auto-correlation feature set (cf. Figure 7l) on the proposed pixel-labeling scheme on a document of the testing dataset are relatively similar to those based on selecting auto-correlation features by means of a feature selection algorithm (cf. Figure 7m,n).
We see that the Gabor and Db4 features give the best results in terms of the homogeneity of the textual region content when using in the proposed pixel-labeling scheme the full texture feature set (cf. Figure 7r,aa) and the texture features selected using the RA (cf. Figure 7t,ac) on a historical document example of the testing dataset. We also note that in the case of using the full Gabor and Db4 feature sets, the Gabor and Db4 features selected using the RA, the textual regions with different sizes and fonts have not been separated properly and particularly when the documents also contain graphics (more than one cluster is assigned for graphical regions by discriminating many orientations that are present to different extents in graphical regions). This confirms that the Gabor and Db4 features characterize specifically the main orientation of a texture. A suitable alternative is to use a recursive clustering method in order to ensure the distinction between distinct text fonts and various graphic types when the documents under consideration are complex and contain graphics and various kinds of fonts.

4.4. Benchmarking and Performance Evaluation

The dimensionality and performance evaluation of each texture-based feature set in the following three cases: with full texture feature set, with texture features selected using the GA, and with texture features selected using the RA, using the proposed pixel-labeling scheme on the HBR2013 dataset are presented in Table 2.
The Gabor and GLRLM signatures have the largest dimensions equal to 192 and 176, respectively, while the Tamura and auto-correlation signatures have the smallest dimensions equal to 16 and 20, respectively. By applying the GA and RA on a document of the training dataset, the number of features has been reduced by half. We note that the number of features has been significantly reduced. The reduction ratio ( R D ) is computed using the following equation:
R D = 1 N f N f
where N f and N f note the total number of features and the final number of features after reduction, respectively.
The R D of Tamura, LBP, GLRLM, auto-correlation, GLCM, Gabor filters, Haar, Db3 and Db4 are: 50 % , 57 % , 46 % , 50 % , 58 % , 53 % , 42 % , 47 % and 43 % , respectively when using the GA, and 56 % , 50 % , 49 % , 50 % , 50 % , 48 % , 50 % , 45 % and 52 % , respectively when using the RA on a document of the testing dataset. As a consequence, we conclude that using a feature selection algorithm helps to reduce the dimensionality of the data, which entails lower computational cost in terms of lighter memory consumption, processing time and numerical complexity.
It is inherently a subjective evaluation to use a visual inspection of the pixel-labeling results of a texture-based method to draw some conclusions about which set of texture features deduced by using a feature selection algorithm is well suited for historical DIA. Thus, in this study several per-pixel and per-block accuracy metrics, namely, the silhouette width ( S W ) [27], purity per-block ( P P B ) [28], and F-measure (F) [29], have been computed based on the defined pixel-accurate ground truth of the analyzed images of the HBR2013 dataset.
The silhouette width ( S W ) assesses the pixel-labeling quality by computing the level of data compactness and separation based on the intrinsic information concerning the distribution of the observations into different clusters. The purity per-block ( P P B ) measures the homogeneity rate of regions by evaluating the matching regions between the defined pixel-based ground truth and the obtained pixel-labeling results. The F-measure (F) assesses both the homogeneity and the completeness criteria of the pixel-labeling results by computing a score resulting from the combination of the precision and recall accuracies. S W , P P B , and F are computed. The higher the values of the computed metrics, the better the results. In Table 2, we have used three different colors (red, green, and blue), to quote the highest S W , P P B , and F values deduced by comparing the performances of each accuracy measure for each texture-based feature set in the following three cases: with full texture feature set, with texture features selected using the GA, and with texture features selected using the RA.
Good performance has been noted for documents of the training dataset when analyzing the selected texture features by means of the GA and particularly the Gabor features. However, there is no significant improvement in performance for documents of the testing dataset due to the complexity and the wide variety of layouts of the HBR2013 dataset. This confirms our observation about the need to train on documents having similar characteristics in terms of the layout structure and/or typographic/graphical properties of the historical document image content.
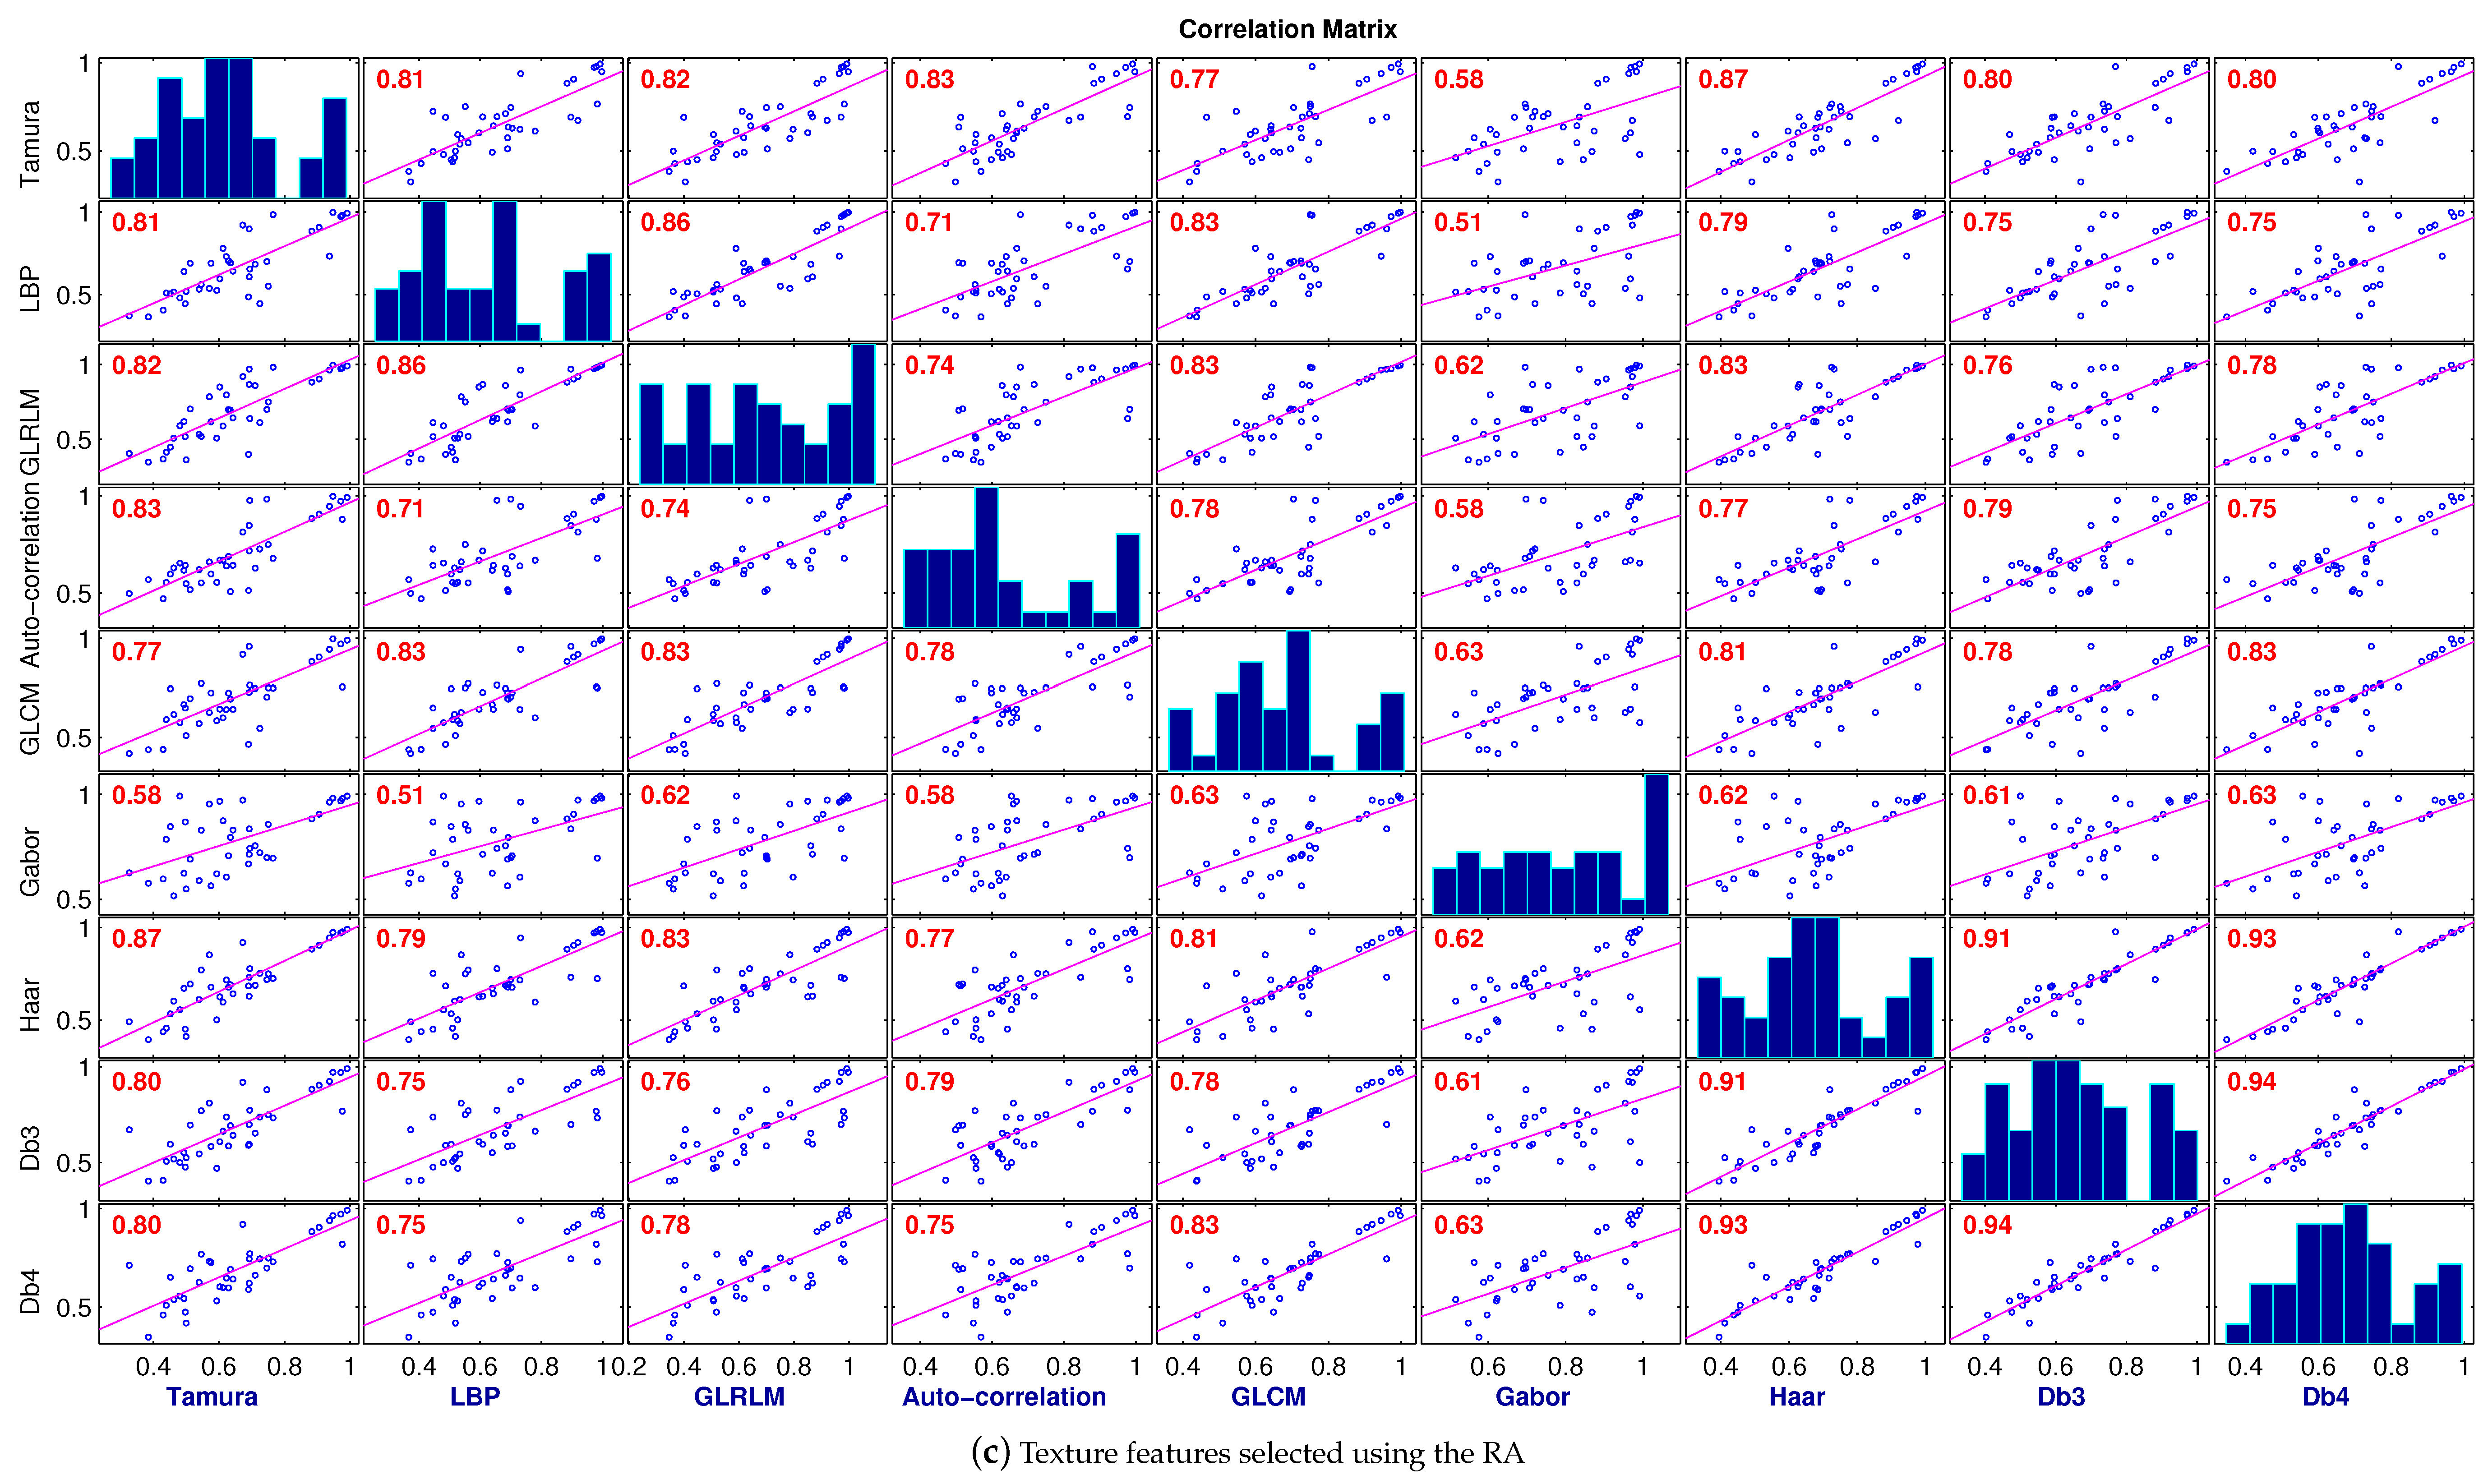
To highlight the similarities of the behavior of the different evaluated texture features according to the use of a full texture feature set, the use of a subset of texture features selected by means of the GA, and the use of a subset of texture features selected by means of the RA, the correlation analyses of the F-measure performance of each texture-based feature set are illustrated in Figure 8a,b,c, respectively. Each figure represents a matrix of plots showing the different Pearson’s linear correlations among pairs of the nine texture-based feature sets (Tamura, LBP, GLRLM, auto-correlation, GLCM, Gabor, Haar, Db3 and Db4). Histograms of the nine evaluated texture-based feature sets appear along the matrix diagonal, while scatter plots of the texture-based feature set pairs appear in the off-diagonal. Each dot in each correlation plot represents one historical document image of the testing dataset of the HBR2013 dataset. The displayed Pearson’s linear correlation coefficients in the scatter plots highlighted indicate which pairs of texture-based feature sets have correlations significantly different from zero (equal to the slopes of the least-squares reference lines in red).
Table 3 summarizes the minimum, average, and maximum Pearson’s linear correlation coefficient values of the F-measure performance of pairs of texture-based feature sets according to the use of a full texture feature set, the use of a subset of texture features selected by means of the GA, and the use of a subset of texture features selected by means of the RA.
By comparing the different correlation plots and obtained Pearson’s linear correlation coefficients when using the full texture feature set, the subset of texture features selected by means of the GA, and the subset of texture features selected by means of the RA, we observe that the Gabor and the three wavelet-based approaches are still highly correlated even if a feature selection algorithm is introduced. This confirms that by using a feature selection algorithm in the Gabor and wavelet approaches only a small subset of relevant features from the original large set of features characterizing the localization of the spatial frequency of a texture have been selected. Nevertheless, we observe higher correlation coefficient values between the Tamura and other investigated features on the one hand and between the LBP and other investigated features on the other hand when selecting features by means of the GA and the RA. This confirms that by using a feature selection algorithm a significant number of texture features which are redundant or irrelevant have been removed. An interesting conclusion that can be deduced from the correlation plots in Figure 8, is that combining the different selected texture feature sets can significantly improve the pixel-labeling quality. Indeed, each feature set has its own particularities. For instance, since Gabor filters is known to be sensitive to the stroke width, they have the advantage to present the best performance in discriminating text in a variety of situations of different fonts and scales. On the other side, the auto-correlation feature set has the advantage of presenting the best performance for segmenting the graphical contents from textual ones since it highlights interesting information concerning the principal orientations and periodicities of texture [11]. Therefore, combining the different selected texture features from the auto-correlation and Gabor descriptors can be more adequate for segmenting the graphical contents from textual ones on the one hand, and discriminating text in a variety of situations of different fonts and scales on the other hand.

5. Conclusions and Further Work

This paper has presented a comparative study of using two conventional feature selection algorithms for selecting a number of commonly and widely used texture features. This comparative study has been conducted on the HBR2013 dataset, using a classical pixel-labeling scheme based on analyzing and selecting features. The proposed pixel-labeling scheme integrates a feature selection step, which has been applied on a training set of the HBR2013 dataset in order to select the most relevant texture features of each analyzed texture-based feature set.
We conclude that the performance of a particular feature selection algorithm is highly dependent upon the used texture features. It is admittedly that the proposed pixel-labeling scheme selects fewer texture features with comparable performance. This study has shown that when the numerical complexity and pixel-labeling quality are taken into account, good performance has been noted for documents of the training dataset when analyzing the selected texture features by means of the genetic algorithm and particularly the Gabor features. These results could be explained by the fact that using the genetic operators (such as the crossover and mutation operators) in the GA, guarantee a high diversity of the succeeding populations, and thus more immune to be trapped in a local optima and faster in reaching the global optima. Moreover, the Gabor features perform better than the other features, since they characterize specifically the orientation and spatial frequency of a texture without taking into account the spatial relationships between pixels as concluded in [11].
However, it is not the case for documents of the testing dataset; there is no significant improvement in performance due to the complexity and the wide variety of contents and layouts of the HBR2013 dataset. Indeed, it is worth noting that there is awareness that we need a larger database containing documents having similar characteristics in terms of the layout structure and/or typographic/graphical properties of the historical document image content in order to train the different feature selection algorithms. Thus, conducting this study on a larger public annotated dataset of historical books such as the HBA dataset [30] is among the first aspect of our future work. Finally, we intend to extend our investigation to recent feature selection algorithms.

Author Contributions

M.M., R.C., K.K. and P.H. contributed to the algorithm design and paper drafting. M.M. and R.C. designed the experiments and implemented the algorithms. R.M. and N.E.B.A. assembled and proofread the final version of the manuscript.

Acknowledgments

This study was supported by the LATIS Laboratory—Sousse University and LITIS Laboratory—Normandie University, which are gratefully acknowledged. The authors would like also to thank Christos Papadopoulos from the PRImA Group [9] for providing access to the HBR2013 dataset which is a subset of the IMPACT dataset [10].

Conflicts of Interest

The authors declare no conflict of interest.

Abbreviations

Db3three-level wavelet transform using 3-tap Daubechies filter
Db4three-level wavelet transform using 4-tap Daubechies filter
DIADocument image analysis
FF-measure
GAGenetic algorithm
GLCMGray-level co-occurrence matrix
GLRLMGray-level run-length matrix
Haarthree-level Haar wavelet transform
HACHierarchical ascendant classification
HBRHistorical book recognition
LBPLocal binary patterns
RAReliefF algorithm
SWSilhouette width
PPBPurity per-block

References

  1. Antonacopoulos, A.; Clausner, C.; Papadopoulos, C.; Pletschacher, S. Historical document layout analysis competition. In Proceedings of the International Conference on Document Analysis and Recognition, Beijing, China, 18–21 September 2011; pp. 1516–1520. [Google Scholar]
  2. Antonacopoulos, A.; Clausner, C.; Papadopoulos, C.; Pletschacher, S. ICDAR 2013 Competition on Historical Book Recognition (HBR 2013). In Proceedings of the International Conference on Document Analysis and Recognition, Washington, DC, USA, 25–28 August 2013; pp. 1459–1463. [Google Scholar]
  3. Wei, H.; Seuret, M.; Liwicki, M.; Ingold, R.; Fu, P. Selecting fine-tuned features for layout analysis of historical documents. In Proceedings of the International Conference on Document Analysis and Recognition, Kyoto, Japan, 9–15 November 2017; pp. 281–286. [Google Scholar]
  4. Chen, K.; Seuret, M.; Hennebert, J.; Ingold, R. Convolutional neural networks for page segmentation of historical document images. In Proceedings of the International Conference on Document Analysis and Recognition, Kyoto, Japan, 9–15 November 2017; pp. 965–970. [Google Scholar]
  5. Calvo-Zaragoza, J.; Castellanos, F.J.; Vigliensoni, G.; Fujinaga, I. Deep neural networks for document processing of music score images. Appl. Sci. 2018, 8, 654. [Google Scholar] [CrossRef]
  6. Okun, O.; Pietikäinen, M. A survey of texture-based methods for document layout analysis. In Texture Analysis in Machine Vision—Series in Machine Perception and Artificial Intelligence; World Scientific: Singapore, 2000; pp. 165–177. [Google Scholar]
  7. Kise, K. Page segmentation techniques in document analysis. In Handbook of Document Image Processing and Recognition; Springer: London, UK, 2014; pp. 135–175. [Google Scholar]
  8. Wahl, F.M.; Wong, K.Y.; Casey, R.G. Block segmentation and text extraction in mixed text/image documents. Comput. Graph. Image Proc. 1982, 20, 375–390. [Google Scholar] [CrossRef]
  9. PRImA. Available online: http://www.primaresearch.org/news/HBR2013 (accessed on 30 July 2018).
  10. PRImA. Available online: http://www.primaresearch.org/datasets (accessed on 30 July 2018).
  11. Mehri, M.; Héroux, P.; Gomez-Krämer, P.; Mullot, R. Texture feature benchmarking and evaluation for historical document image analysis. Int. J. Doc. Anal. Recognit. 2017, 20, 1–35. [Google Scholar] [CrossRef] [Green Version]
  12. Beyerer, J.; León, F.P.; Frese, C.C. Texture analysis. In Machine Vision; Springer: Berlin/Heidelberg, Germany, 2016; pp. 649–683. [Google Scholar]
  13. Dubuf, J.; Kardan, M.; Spann, M. Texture feature performance for image segmentation. Pattern Recognit. 1990, 23, 291–309. [Google Scholar] [CrossRef]
  14. Journet, N.; Ramel, J.; Mullot, R.; Eglin, V. Document image characterization using a multiresolution analysis of the texture: Application to old documents. Int. J. Doc. Anal. Recognit. 2008, 11, 9–18. [Google Scholar] [CrossRef]
  15. Wei, H.; Seuret, M.; Chen, K.; Fischer, A.; Liwicki, M.; Ingold, R. Selecting autoencoder features for layout analysis of historical documents. In Proceedings of the International Workshop on Historical Document Imaging and Processing, Nancy, France, 22 August 2015; pp. 55–62. [Google Scholar]
  16. Xue, B.; Zhang, M.; Browne, W.N.; Yao, X. A survey on evolutionary computation approaches to feature selection. IEEE Trans. Evol. Comput. 2015, 20, 606–626. [Google Scholar] [CrossRef]
  17. Zongker, D.; Jain, A. Algorithms for feature selection: An evaluation. In Proceedings of the International Conference on Pattern Recognition, Vienna, Austria, 25–29 August 1996; pp. 18–22. [Google Scholar]
  18. Guyon, I.; Elisseeff, A. An introduction to variable and feature selection. J. Mach. Learn. Res. 2003, 3, 1157–1182. [Google Scholar]
  19. Tao, D.; Jin, L.; Zhang, S.; Yang, Z.; Wang, Y. Sparse discriminative information preservation for Chinese character font categorization. Neurocomputing 2014, 129, 159–167. [Google Scholar] [CrossRef]
  20. Wei, H.; Chen, K.; Nicolaou, A.; Liwicki, M.; Ingold, R. Investigation of feature selection for historical document layout analysis. In Proceedings of the International Conference on Image Processing Theory, Tools and Applications, Paris, France, 14–17 October 2014; pp. 1–6. [Google Scholar]
  21. Duda, R.; Hart, P.; Stork, D. Pattern Classification, 2nd ed.; Wiley-Interscience: New York, NY, USA, 2000. [Google Scholar]
  22. Peng, H.; Long, F.; Ding, C. Feature selection based on mutual information: criteria of max-dependency, maxrelevance, and min-redundancy. IEEE Trans. Pattern Anal. Mach. Intell. 2005, 27, 1226–1238. [Google Scholar] [CrossRef] [PubMed]
  23. Sun, Y.; Lou, X.; Bao, B. A novel Relief feature selection algorithm based on mean-variance model. J. Inf. Comput. Sci. 2011, 8, 3921–3929. [Google Scholar]
  24. Šikonja, M.; Kononenko, I. Theoretical and empirical analysis of ReliefF and RReliefF. Mach. Learn. 2003, 53, 23–69. [Google Scholar] [CrossRef]
  25. Ward, J.H. Hierarchical grouping to optimize an objective function. J. Am. Stat. Assoc. 1963, 58, 236–244. [Google Scholar] [CrossRef]
  26. Groundtruthing Environment for Document Images (GEDI). Available online: https://sourceforge.net/projects/gedigroundtruth/ (accessed on 30 July 2018).
  27. Rousseeuw, P.J. Silhouettes: A graphical aid to the interpretation and validation of cluster analysis. J. Comput. Appl. Math. 1987, 20, 53–65. [Google Scholar] [CrossRef]
  28. Mehri, M.; Gomez-Krämer, P.; Héroux, P.; Boucher, A.; Mullot, R. A texture-based pixel labeling approach for historical books. Pattern Anal. Appl. 2017, 20, 325–364. [Google Scholar] [CrossRef]
  29. Powers, D.W. Evaluation: From precision, recall and F-factor to ROC, informedness, markedness & correlation. J. Mach. Learn. Technol. 2011, 2, 37–63. [Google Scholar]
  30. HBA Dataset. Available online: http://icdar2017hba.litislab.eu/index.php/dataset/description/ (accessed on 30 July 2018).
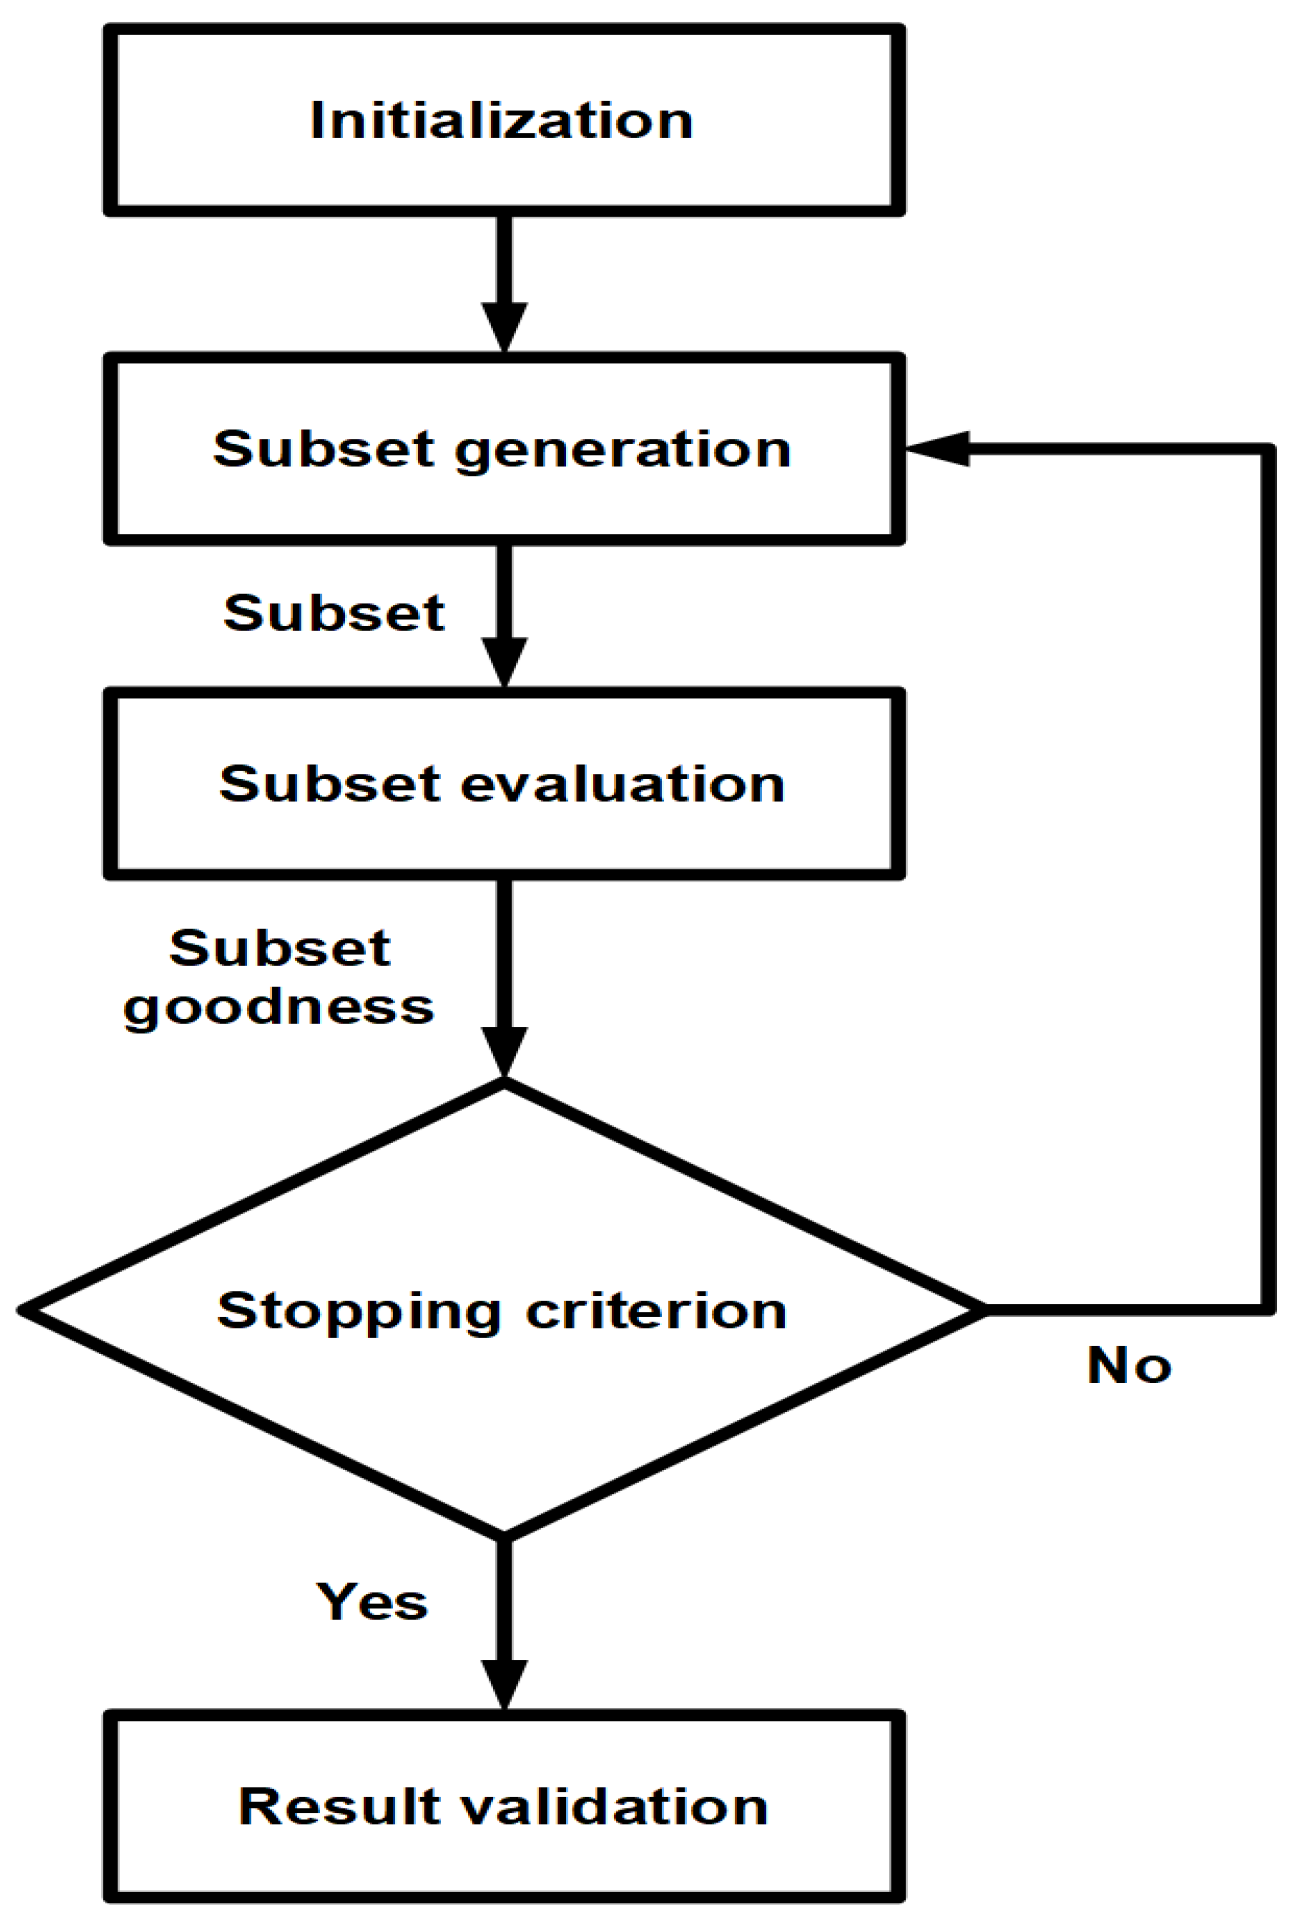
Figure 1. Common key steps of a feature selection process.
Jimaging 04 00097 g001
Figure 2. Flowchart of the GA.
Jimaging 04 00097 g002
Figure 3. Pixel-labeling scheme based on analyzing and selecting texture features.
Jimaging 04 00097 g003
Figure 4. Historical document image examples of the HBR2013 dataset. (ai) illustrate examples of historical document images of the HBR2013 dataset containing only two fonts, two fonts and graphics, only three fonts, three fonts and graphics, only four fonts, four fonts and graphics, only five fonts and five fonts and graphics, respectively.
Jimaging 04 00097 g004
Figure 5. Example of the defined ground truth and obtained pixel-labeling result. (a,b) illustrate an original historical document image and its associated ground truth, respectively. (c) shows the final result of the pixel-labeling task by analyzing the Gabor features. (df) illustrate zoomed regions of (ac), respectively.
Jimaging 04 00097 g005
Figure 6. Qualitative results without and with using a feature selection algorithm on a historical document image of the “Three fonts and graphics” category from the training dataset of the HBR2013 dataset. The number of class labels is equal to 4. Since the pixel-labeling task is unsupervised, the colors attributed to text or graphic clusters have been manually set to display the most correct matching. (a,b) illustrate the input image and its associated ground truth, respectively. The remaining figures depict the resulting pixel-labeling images. (ce), (fh), (ik), (ln), (oq), (rt), (uw), (xz) and (aaac) illustrate the resulting pixel-labeling images given by analyzing the full texture feature set (Tamura, LBP, GLRLM, auto-correlation, GLCM, Gabor, Haar, Db3 and Db4, respectively), the selected texture features by means of the GA and RA algorithms.
Jimaging 04 00097 g006
Figure 7. Qualitative results without and with using a feature selection algorithm on a historical document image of the “Three fonts and graphics” category from the testing dataset of the HBR2013 dataset. The number of class labels is equal to 4. Since the pixel-labeling task is unsupervised, the colors attributed to text or graphic clusters have been manually set to display the most correct matching. (a,b) illustrate the input image and its associated ground truth, respectively. The remaining figures depict the resulting pixel-labeling images. (ce), (fh), (ik), (ln), (oq), (rt), (uw), (xz) and (aaac) illustrate the resulting pixel-labeling images given by analyzing the full texture feature set (Tamura, LBP, GLRLM, auto-correlation, GLCM, Gabor, Haar, Db3 and Db4, respectively), the selected texture features by means of the GA and RA algorithms.
Jimaging 04 00097 g007
Figure 8. Correlation analysis of the F-measure performance of each texture-based feature set according to the use of a full texture feature set (a), Full texture feature set; the use of a subset of texture features selected by means of the GA (b), Texture features selected using the GA; and the use of a subset of texture features selected by means of the RA (c), Texture features selected using the RA.
Jimaging 04 00097 g008aJimaging 04 00097 g008bJimaging 04 00097 g008c
Table 1. Composition of the HBR2013 dataset.
ContentNumber of PagesNumber of FontsGraphics
Only one font (cf. Figure 4a)31No
Only two fonts (cf. Figure 4b)172No
Graphics and text with two different fonts (cf. Figure 4c)92Yes
Only three fonts (cf. Figure 4d)203No
Graphics and text with three different fonts (cf. Figure 4e)63Yes
Only four fonts (cf. Figure 4f)114No
Graphics and text with four different fonts (cf. Figure 4g)154Yes
Only five fonts (cf. Figure 4h)55No
Graphics and text with five different fonts (cf. Figure 4i)145Yes
Table 2. Dimensionality and performance evaluation of each texture-based feature set for documents of the training and testing datasets in the following three cases: with full texture feature set, with texture features selected using the genetic algorithm (GA), and with texture features selected using the ReliefF algorithm (RA), using the proposed pixel-labeling scheme on the HBR2013 dataset. Internal and external accuracy measures are computed, silhouette width (SW), purity per-block (PPB) and F-measure (F). N f and N f note the total number of features and the final number of features after reduction, respectively. The higher the values of the internal and external accuracy measures, the better the pixel-labeling performances. For each table (i.e., the training and testing datasets), the values which are quoted in red, green, and blue colors, are considered as the highest SW, PPB, and F values, respectively by comparing the performances of each accuracy measure for each texture-based feature set in the following three cases: with full texture feature set, with texture features selected using the GA, and with texture features selected using the RA.
Training Dataset
TamuraLBPGLRLMAuto-CorrelationGLCMGaborHaarDb3Db4
Full texture feature set SW 0.350.210.130.070.210.260.260.310.28
PPB 0.710.780.790.730.840.900.800.790.81
F 0.380.380.350.430.420.520.450.460.46
N f 16401762072192808080
Texture features selected using the GA SW 0.400.040.140.120.200.290.290.280.31
PPB 0.730.720.820.800.870.920.830.830.84
F 0.390.360.350.420.420.540.450.450.46
N f 82088103696404040
Texture features selected using the RA SW 0.300.070.140.110.260.260.240.290.28
PPB 0.730.740.770.770.850.880.810.830.83
F 0.400.380.340.420.420.490.430.430.44
N f 82088103696404040
Testing Dataset
TamuraLBPGLRLMAuto-CorrelationGLCMGaborHaarDb3Db4
Full texture feature set SW 0.380.330.350.170.300.280.300.340.30
PPB 0.770.830.820.810.860.910.830.830.84
F 0.400.390.370.430.430.520.440.450.46
N f 16401762072192808080
Texture features selected using the GA SW 0.420.010.420.240.350.330.290.330.36
PPB 0.760.720.850.850.850.910.860.850.85
F 0.400.370.370.430.410.510.430.420.43
N f 81795103090464245
Texture features selected using the RA SW 0.350.150.390.220.360.280.310.340.37
PPB 0.790.760.810.800.870.890.850.850.86
F 0.410.380.360.420.430.490.420.420.42
N f 72089103698404438
Table 3. Minimum, average, and maximum Pearson’s linear correlation coefficient values of the F-measure performance of pairs of texture-based feature sets according to the use of a full texture feature set, the use of a subset of texture features selected by means of the GA, and the use of a subset of texture features selected by means of the RA.
Full Texture Feature SetTexture Features Selected Using the GATexture Features Selected Using the RA
FeaturesMinimumAverageMaximumMinimumAverageMaximumMinimumAverageMaximum
Tamura0.50
(Gabor)
0.580.63
(GLCM)
0.47
(Gabor)
0.750.87
(LBP)
0.58
(Gabor)
0.780.87
(Haar)
LBP0.61
(GLCM)
0.670.72
(GLRLM)
0.41
(Gabor)
0.740.88
(GLCM)
0.51
(Gabor)
0.750.86
(GLRLM)
GLRLM0.61
(Tamura)
0.730.86
(Haar)
0.47
(Gabor)
0.740.83
(Tamura)
0.62
(Gabor)
0.780.86
(LBP)
Auto-correlation0.60
(GLCM)
0.680.76
(Haar)
0.49
(Gabor)
0.690.75
(Db3)
0.58
(Gabor)
0.740.83
(Tamura)
GLCM0.60
(Auto)
0.70.82
(Haar)
0.53
(Gabor)
0.720.88
(LBP)
0.63
(Gabor)
0.780.83
(LBP)
Gabor0.50
(Tamura)
0.670.77
(Db3)
0.41
(LBP)
0.490.56
(Db3)
0.51
(LBP)
0.590.63
(GLCM)
Haar0.58
(Tamura)
0.780.93
(Db4)
0.50
(Gabor)
0.750.88
(Db4)
0.62
(Gabor)
0.810.93
(Db4)
Db30.59
(Tamura)
0.780.92
(Db4)
0.56
(Gabor)
0.770.93
(Db4)
0.61
(Gabor)
0.790.94
(Db4)
Db40.53
(Tamura)
0.760.93
(Haar)
0.53
(Gabor)
0.760.93
(Db3)
0.63
(Gabor)
0.80.94
(Db3)