Article

Laser Scanners for High-Quality 3D and IR Imaging in Cultural Heritage Monitoring and Documentation

by
Sofia Ceccarelli
1,
Massimiliano Guarneri
2,*,
Mario Ferri de Collibus
2,
Massimo Francucci
2,
Massimiliano Ciaffi
2 and
Alessandro Danielis
3
1
Industrial Engineering, University of Tor Vergata, 00133 Rome, Italy
2
FSN-TECFIS-DIM, ENEA, 00044 Frascati (RM), Italy
3
ENEA Guest, 00044 Frascati, Italy
*
Author to whom correspondence should be addressed.
J. Imaging 2018, 4(11), 130; https://doi.org/10.3390/jimaging4110130
Submission received: 24 August 2018 / Revised: 30 October 2018 / Accepted: 1 November 2018 / Published: 5 November 2018
(This article belongs to the Special Issue Image Enhancement, Modeling and Visualization)

Abstract

:
Digital tools as 3D (three-dimensional) modelling and imaging techniques are having an increasing role in many applicative fields, thanks to some significative features, such as their powerful communicative capacity, versatility of the results and non-invasiveness. These properties are very important in cultural heritage, and modern methodologies provide an efficient means for analyzing deeply and virtually rendering artworks without contact or damage. In this paper, we present two laser scanner prototypes based on the Imaging Topological Radar (ITR) technology developed at the ENEA Research Center of Frascati (RM, Italy) to obtain 3D models and IR images of medium/large targets with the use of laser sources without the need for scaffolding and independently from illumination conditions. The RGB-ITR (Red Green Blue-ITR) scanner employs three wavelengths in the visible range for three-dimensional color digitalization up to 30 m, while the IR-ITR (Infrared-ITR) system allows for layering inspection using one IR source for analyses. The functionalities and operability of the two systems are presented by showing the results of several case studies and laboratory tests.

1. Introduction

Artistic and cultural heritage (CH) is essential for present and future generations as a proof of human genius over the past eras, and its preservation has a key role in transmitting cultural and historical roots of nations around the world [1,2,3]. The safeguard and the communication of global CH are therefore more than an exclusively humanistic issue, being involved in many scientific activities of national and international institutions. The numerous variables involved in CH Conservation Science, such as the conservation status, material composition and the surrounding conditions, require the development of specific and multidisciplinary applicative solutions, both in terms of instrumentation and methodology [4]. In the actual digital era, imaging techniques and 3D (three-dimensional) modelling are widely employed in CH for recording and remote investigations, becoming common practice used in archaeological sites for contactless surveys [2,5,6,7]. The digital information achieved with these methodologies has an important usefulness, not only for historical reconstructions and dissemination purposes, but also for monitoring and diagnostic studies, allowing for investigations and comparisons of conservation status over time. Many methods are nowadays available for gaining these purposes and differ for factors, such as acquisition timing, resolution, accuracy and typology of achievable results [5,6,8,9,10,11,12]. Despite the variety of systems, functionalities and properties, it is well-known that one single method is insufficient for the complete 3D color digitalization of a medium/large-sized object or site. Indeed, the complementary use of Image-Based Modelling (IBM) methods, such as photogrammetry, is a common practice with the Range-Base Modelling (RBM) ones, i.e., laser scanning, for the achievement, even at great distances, of accurate and detailed 3D textured models [9,10,13]. The general workflow of a 3D modelling process consists of the application of active methods for the object geometry acquisition (point cloud) and passive ones for color mapping (texture), in order to obtain photo-realistic 3D models, using an integrated approach between laser scanning and photogrammetry [14]. The resulting products are 3D textured reproductions of the object/site, where the color transposition is strongly dependent on the surrounding illumination conditions and the elaboration is often a time-consuming process [8,15,16,17,18]. 3D models are often combined to multispectral imaging for a deeper knowledge of the artefact in a visually appealing modality, aimed at the comprehension of artistic techniques, preparatory drawing, pentimenti or details regarding the supports through non-invasive layering inspections [19,20,21,22,23]. The systems used for imaging analysis can be divided into two main categories: cameras with external filters for obtaining multiple images [24,25,26] or laser-based instruments using one or more wavelengths for single layer inspections one at a time [27]. The choice of the approach depends on several factors, such as project requirements, parameters to analyze (underdrawings, superficial varnish, support), environmental working conditions and economic and human resources. The integrated approach between several technologies can be desultory, requiring often a greater amount of time than using a single technique, both in acquisition and in post-processing procedures. Furthermore, the dependence on external parameters, such as lighting conditions, can influence the reliability of acquired data. In this paper, we address these topics by illustrating the Imaging Topological Radar (ITR) technology, developed at the ENEA Research Center of Frascati (RM), as an acquisition method of highly detailed images for 2–3D color digitalization and layering analysis of medium–large targets, independently from the surrounding illumination conditions. The technology is exploited by two laser scanner systems, which use n-laser sources for contactless examination of several materials, from marble to wood and pigments, even at great distances without scaffoldings [28,29]. The technique and the post-processing data elaboration allow acquiring distance, color and underdrawings’ information from the backscattered optical signals from the scanned object. The ITR tools have been employed in different contexts with many conservative issues and/or necessities, such as nuclear inspections, post blasting simulations and CH analyses. Examples of applications on peculiar artworks will be shown with the aim to show the utility of ITR data in Conservation Science.

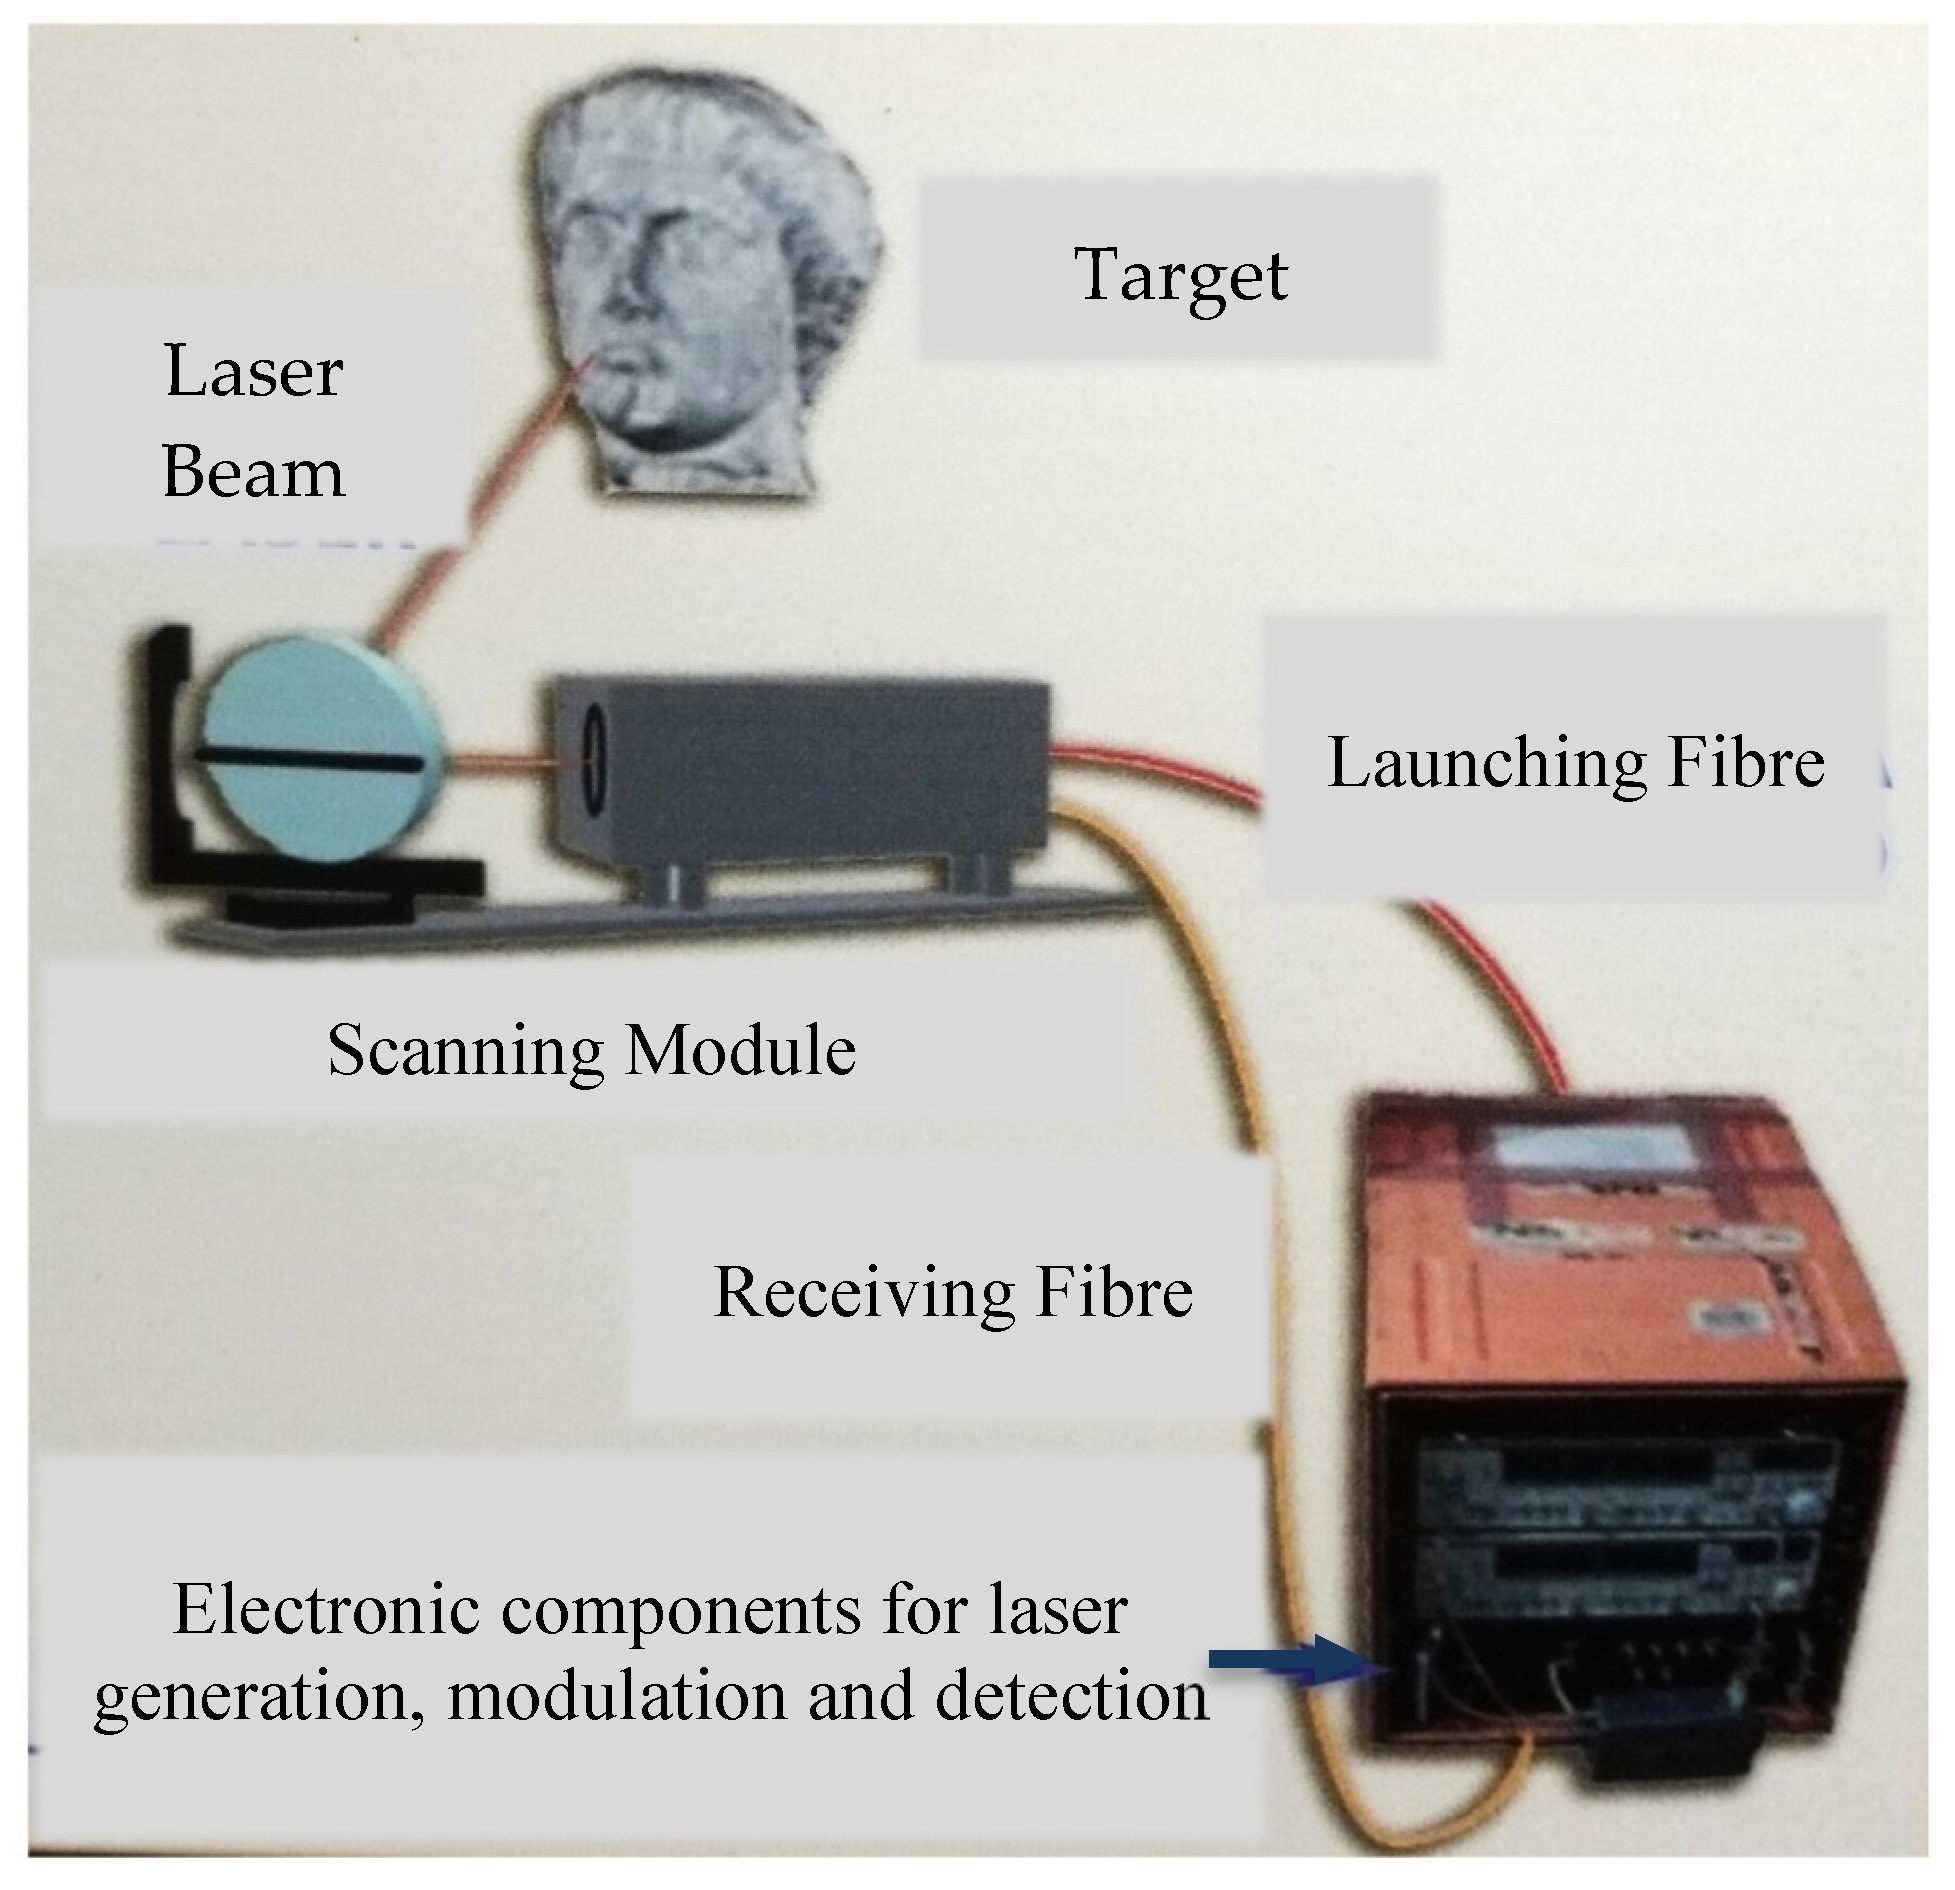
2. ITR Technology and Systems

The DIM laboratory (Diagnostics and Metrology) of the ENEA Research Center has been working on laser applications for over two decades, developing several prototypes for many fields, from forensic science to CH studies [29,30]. In this paper, we present two laser scanners based on the use of n-laser stimuli as light sources for contactless acquisition of backscattered information: the RGB-ITR (Red Green Blue-Imaging Topological Radar) and the IR-ITR (Infrared-Imaging Topological Radar). The ITR systems are based on the double amplitude modulation (AM) range-finding technique, where the laser beam is exploited as the carrier wave of a radiofrequency signal, which modulates the beam intensity [31,32]. The double modulation of the laser sources combined with the lock-in technique allows estimating the amplitude and phase-shift information of the back-reflected signals from the target simultaneously. The estimation of the amplitudes’ information, proportional to the matter/laser interaction at a specific optical wavelength, contributes to the color (RGB-ITR version) or grey-level intensity (IR-ITR version) reconstruction of the target, while the phase-shift information to estimate the distance occurred between the scanner and the investigated surface. The amplitude and phase-shift information is actually stored point-by-point, collecting electronic signals in a range between 1 × 10⁻⁴ and 0.1 Volts. Structural digitalization of the surfaces is elaborated from the distance measurements, determined indirectly from the phase delay Δφ of the collected back-reflected signal with respect to the reference modulating wave, as expressed by the formula [33]:
d = ν   Δ φ 4 π   f m ,
where f m is the modulation frequency and ν is the velocity of light in the transmitting medium. For laser optical powers where the shot noise dominates over all other noise sources in the detection process (typically, a few nW at the output of the detection fiber), the accuracy of distance measurements can be shown to increase with the modulation frequency f m [33] according to the following expression:
σ R 1 m   f m S N R i .
where σ R is the “intrinsic” error (i.e., the minimum attainable error in optimal experimental conditions), m is the modulation depth and S N R i is the current signal-to-noise ratio:
S N R i = P η τ h f Γ ,
which depends on the laser optical frequency f , the integration time τ , the detector’s quantum efficiency η , the overall optics merit factor Γ and the collected power P. Here, h stands for the Planck constant. Efficient noise rejection is obtained by using narrow field-of-view, interferential filtering and low-noise detection electronics. Because of phase periodicity, the AM technique is affected by the so-called “folding” ambiguity: the system returns the same distance value for target points, of which relative separation along the line of sight is a multiple of half the modulation wavelength. In order to overcome this problem, the laser probe is modulated at two different frequencies with values taken far apart from each other. The lower modulation frequency is calculated by the corresponding measurement range encompassing the whole scene of interest. Low-frequency measurements are then used to remove the ambiguity that affects the corresponding high-frequency, employed for more accurate measures. By using this technique of double AM, it is possible to achieve sub-millimetric accuracy on targets at distances or heights from a few tenths up to 30–35 m, without the need of scaffolding [28,31]. The ITR hardware is composed of two physically separate modules but optically connected by means of optical fibers: the optical head and the electronic components. In particular, the scanning module, i.e., the optical head, of the two instruments basically includes the launching and receiving optics, and it consists of a lens system for the collimation and focalization of the lasers to the center of a double-motorized mirror. The latter sweeps the beam onto the target according to a TV raster-like positioning, differently from the rotative movement of commercial scanners, and collects the back-reflected beam. The returning signals are detected by low-noise photodiode detectors and analyzed by means of lock-in amplifier units, which are also used to modulate the laser sources. The data are processed with custom software through MATLAB® interface (see Section 2.3), and the resulting models and images can be exported into the most common file formats, thanks to the feature of the software. Figure 1 shows a schematic explanation of the ITR system operability.
The parameters of the ITR scanners for defining their accuracy and resolution are: the laser spot size, which determines the minimum area of the collected pixel; the signal/noise ratio for estimating the distance measurement; the minimum angular step of the motorized mirror, responsible for the movement of the laser beam; the single pixel distance between the device and the target, which determines the spatial resolution between one point and the neighbors [34]. Due to construction limits of the optical heads of the systems, the actual rotation movement of the scanning mirrors is 1.4 × 5.4 rad (80° × 310°), with a maximum point-to-point precision of 0.035 mrad. The pixel distance accuracy is 350 μm at 10 m of distance between system and target, while the spatial resolution is 700 μm. The average spot diameters measured at the same distance range are less than 1 mm for the RGB-ITR and 4–5 mm for the IR-ITR. The two ITR systems differ in number and wavelength of the laser sources, achieving two types of results: the RGB-ITR scanner (see Section 2.1) employs three wavelengths in the visible spectrum to obtain high-quality 3D color models of the object, while the IR-ITR instrument (see Section 2.2) uses a single infrared source for layering analyses of the surface.

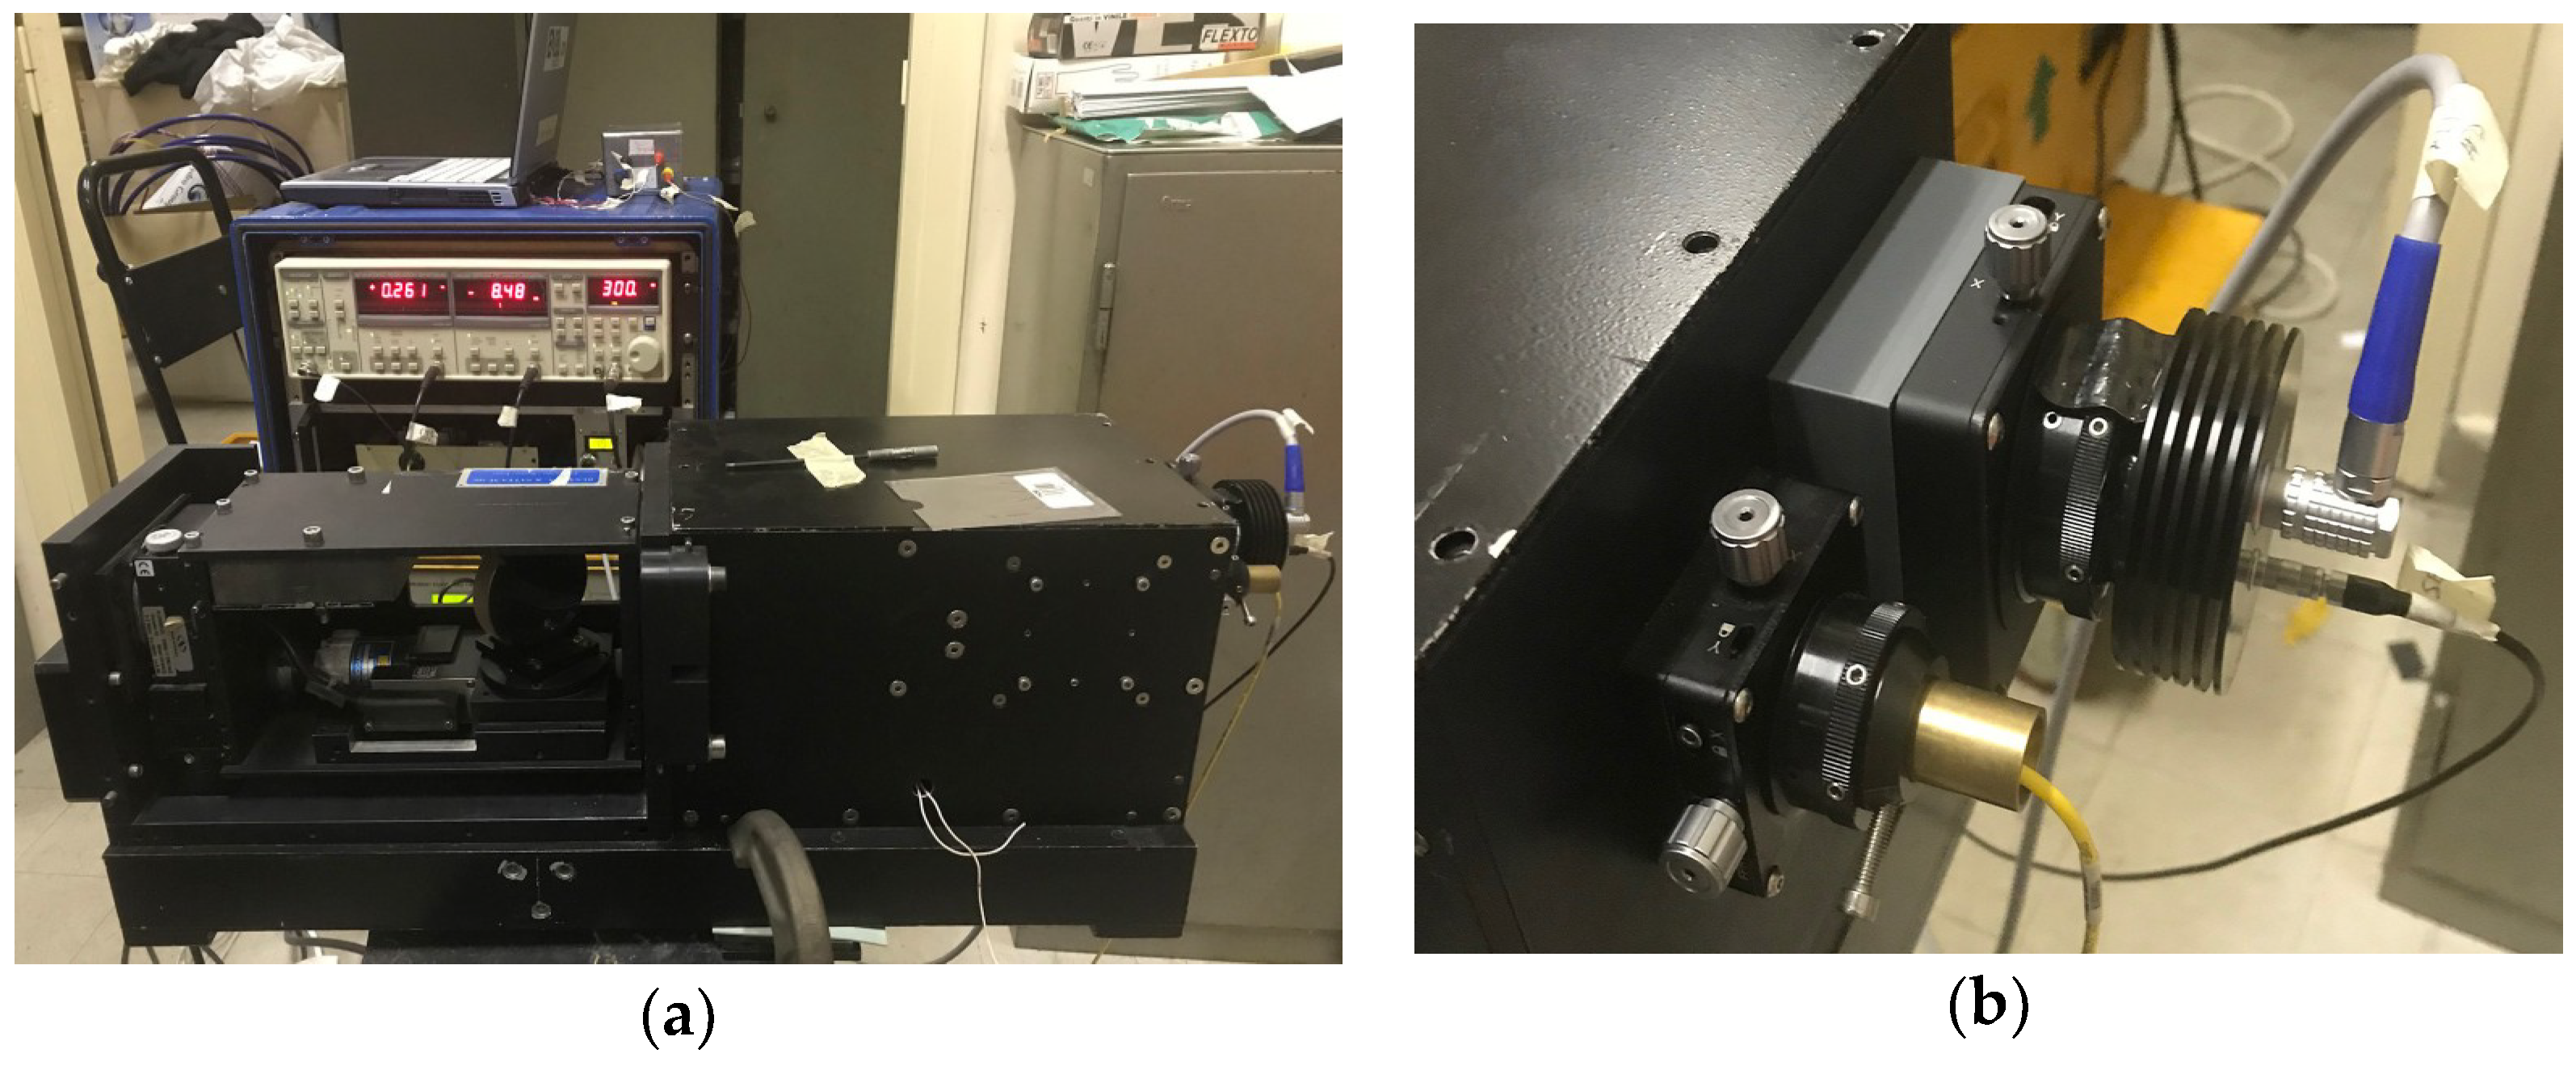
2.1. RGB-ITR Scanner

The RGB-ITR scanner (Figure 2) enables the simultaneous recording of range and color information by the phase-shift between the back-reflected signal and the reference modulating wave, and the elaboration of back-reflected RGB triplets from the scanned object, respectively. At the moment, the system uses three laser sources with wavelengths in the visible range corresponding to red, green and blue (660 nm, 517 nm and 440 nm), respectively [31].
Firstly, the three laser beams are overlapped by dichroic filters in a single white incident ray with a laser spot diameter of 1–2 mm at distances greater than 10 m and an overall power are calculated by the following formula:
P o w e r   d e n s i t y ( mW mm 2 ) = L a s e r   p o w e r S p o t   a r e a = 3   mW 0.785   mm 2 = 3.821   mW mm 2 ,
where 3 mW correspond to the laser power of the three wavelengths in the visible range and the spot area is referred to a 1 mm-dimeter laser spot. A 40 mm-focus achromatic lens focuses the launching beam onto the target by means of a rotating mirror, while a 150 mm-focus lens is used for collecting and focusing the backscattered beams, split again into the three original red, green and blue components by means of an optical demultiplexer. The signals, in the ranges for each channel of about 0.1–100 mV, are detected by three low-noise avalanche photodiode detectors and analyzed by means of three lock-in amplifier units, which are also used to modulate the laser sources. Although all the beams are modulated, only the red and blue backscattered signals are exploited for high-frequency and low-frequency range determination, respectively. Typical modulation frequencies are 190–200 MHz for red, 1–10 MHz for blue and 3 MHz for green. The color information reconstruction is actually obtained by the use of just three narrow wavelengths, mainly due to the optical setup limit of the actual RGB-ITR scanner. For an accurate color estimation, an ad-hoc calibration procedure and several algorithms were implemented: as seen above, the amplitude information is stored in Volts, while the color spaces are usually described by non-dimensional normalized triplet of coordinates, like in the case of RGB, L*a*b* and HSV spaces. Moreover, all the optical signals collected by the scanner depend not only on the nature of the surface matter, but also by the quadratic dependency of the distance: to compensate these effects and normalize the data stored by the scanner, a calibration procedure is introduced. This calibration procedure consists of illuminating a certified white target by the three optical wavelengths, conveniently placed on a tripod and moved long all the linear range covered by the scanner for digitalizing the surface: every single calibration step is composed by moving the tripod every 0.5 m and collecting the back-reflected signals of the three wavelengths from the reference target. At the end of the procedure, the three distinct calibration curves (amplitude vs. distance) are used for normalizing the data collected on the investigated surface: the normalization coefficients are calculated by using, as a lookup-table, the three calibration curves interpolated by three distinct spline curves. The normalized amplitude values are calculated by dividing the single amplitude value for its equivalent normalization coefficient, also expressed in Volts, following Equation (5):
R ( λ i ) = s c e n e _ a m p l i t u d e _ i n _ V o l t s n o r m a l i z a t i o n _ c o e f f i c i e n t s _ i n _ V o l t s
The color information is also affected by the angular effect between the incident laser beams and every single illuminated portion of the surface: to balance this effect, the normalized color information is weighted by the equivalent cosine of the angles between the incident laser beam and surface normal versors (Lambert’s Law), following Equation (6) [35,36]:
R ( λ i ) = R ( λ i ) cos ϑ i
Finally, the single point RGB triplet is obtained by using Equation (7):
Y = K · λ S ( λ i ) · R ( λ i ) · y c m f ( λ i ) Δ λ
where S ( λ i ) is a CIE illuminant, at the moment, set as energy equivalent and weighted by experimental values, R ( λ i ) is the normalized reflectance factor, y c m f ( λ i ) is one of the three CIE standard observer color-matching functions ( x c m f ( λ i ) , y c m f ( λ i ) , z ( λ i ) ), Σ λ represents summation across wavelength λ, Δ λ is the measurement wavelength interval, and K is a conventional normalizing constant defined as [35,37]:
K = 100 λ S ( λ i ) · y c m f ( λ i ) · Δ λ .
Finally, the calibrated RGB data is merged with range information converted into Cartesian coordinates expressed in physical units and the geometrical information is rearranged. The post-processing elaboration is carried out through the ITR software in order to produce high-quality 3D digital models of the scanned surface [34].

2.2. IR-ITR Prototype

The ITR monochromatic laser scanner (Figure 3a) is employed for inspections under a superficial layer with a thickness of up to some hundreds of microns by the processing of backscattered data. This system uses an IR source with a wavelength of 1550 nm and a power of some tenths of mW/mm2. The optical setup of this system consists of an aspherical lens for focusing the launching laser beam and a receiving doublet lens (50 mm in diameter, and 150 mm in focal length) for the detection of receiving signals from up to 10 m of distance, with a laser spot size of 4–5 mm and a power density of less than 1 mW/mm2, as can be calculated by Equation (9):
P o w e r   d e n s i t y ( mW mm 2 ) = L a s e r   p o w e r S p o t   a r e a = 10   mW 12.56   mm 2 = 0.796   mW mm 2
The modulation frequency in this case is 3 MHz and the principle of operation is the same as that of the RGB-ITR scanner. In this case, an IR detector (Licel APD Inasga, Figure 3b) is directly connected with the optical receiving channel and the lock-in amplifier. The Licel APD (Avalanche PhotoDiode) module combines a Si APD, TE cooler, temperature controller, low-noise amplifier and XYZ positioner in a single compact module. The laser control is carried out through a laptop equipped with suitable software, while the scanning procedure is remotely commanded with ITR custom software.

2.3. Custom Software

The scanning procedure and the post-processing elaborations are controlled by the use of custom software developed in MATLAB® framework: ScanSystem and itrAnalyzer. The features of these tools allow setting scanning parameters based on working needs and, on the other hand, to obtain high-quality images from data elaboration.

2.3.1. ScanSystem

The ITR data acquisition process is driven by the custom ScanSystem tool, which allows setting scanning parameters, acquire calibration data and checking the functionality of the electronic component. With a motion controller, the software enables the movement of the laser spot onto the surface in order to fix vertical and horizontal limits and arranges the area to be scanned. Among the parameters controlled by the software, there are acquisition velocities (vertical and horizontal), angular resolution (calculated at each scan), number of points in terms of pixels per row. Furthermore, a single scan can be divided into multiple scripts, in order to reduce the angular span for construction limits of a scanning module or logistic reasons. The same software is used to achieve calibration data, recording reflectance signals from a white target reference at each fixed step along the distance range. The file extension of a scan project is .prj (Simulink Project), elaborated with itrAnalyzer in MATLAB® environment, while the calibration dataset is saved as Excel file (.xls).

2.3.2. itrAnalyzer

Data elaborations are carried out with itrAnalyzer software, which enables several operations on ITR data, imported in MATLAB® as matrices. The main features of this specially developed tool are 2–3D buildings of models, color and profile analyses, registration of meshes and calibrations, while among the second-level functionalities, it allows for image enhancement for the study of hidden details, color correction and smoothing. This software can be considered as the link between RGB-ITR raw data and commercial software for 3D modelling and photo manipulation.

3. Case Studies

The Imaging Topological Radar technology has been widely employed in CH investigations during the last twenty years with several different purposes. We report significative applications carried out in the last three years both in situ and in laboratory case studies, showing the versatility of the techniques on different materials and situations.

3.1. In Situ Acquisitions

Since 3D color digitalizations were considered among the requests and necessities, the RGB-ITR scanner has been employed. We show case studies where the scanner prototype has proved to be efficient in terms of acquisition timing, quality results and good response to specific/critical conditions. In particular, the color laser scanner has been engaged in the following sites:
  • Saint Brizio Chapel, Orvieto Cathedral (Viterbo, Italy);
  • Greek Chapel, Priscilla Catacombs (Rome, Italy);
  • Tower room, Saint Sebastian Gate, Aurelian Walls (Rome, Italy);
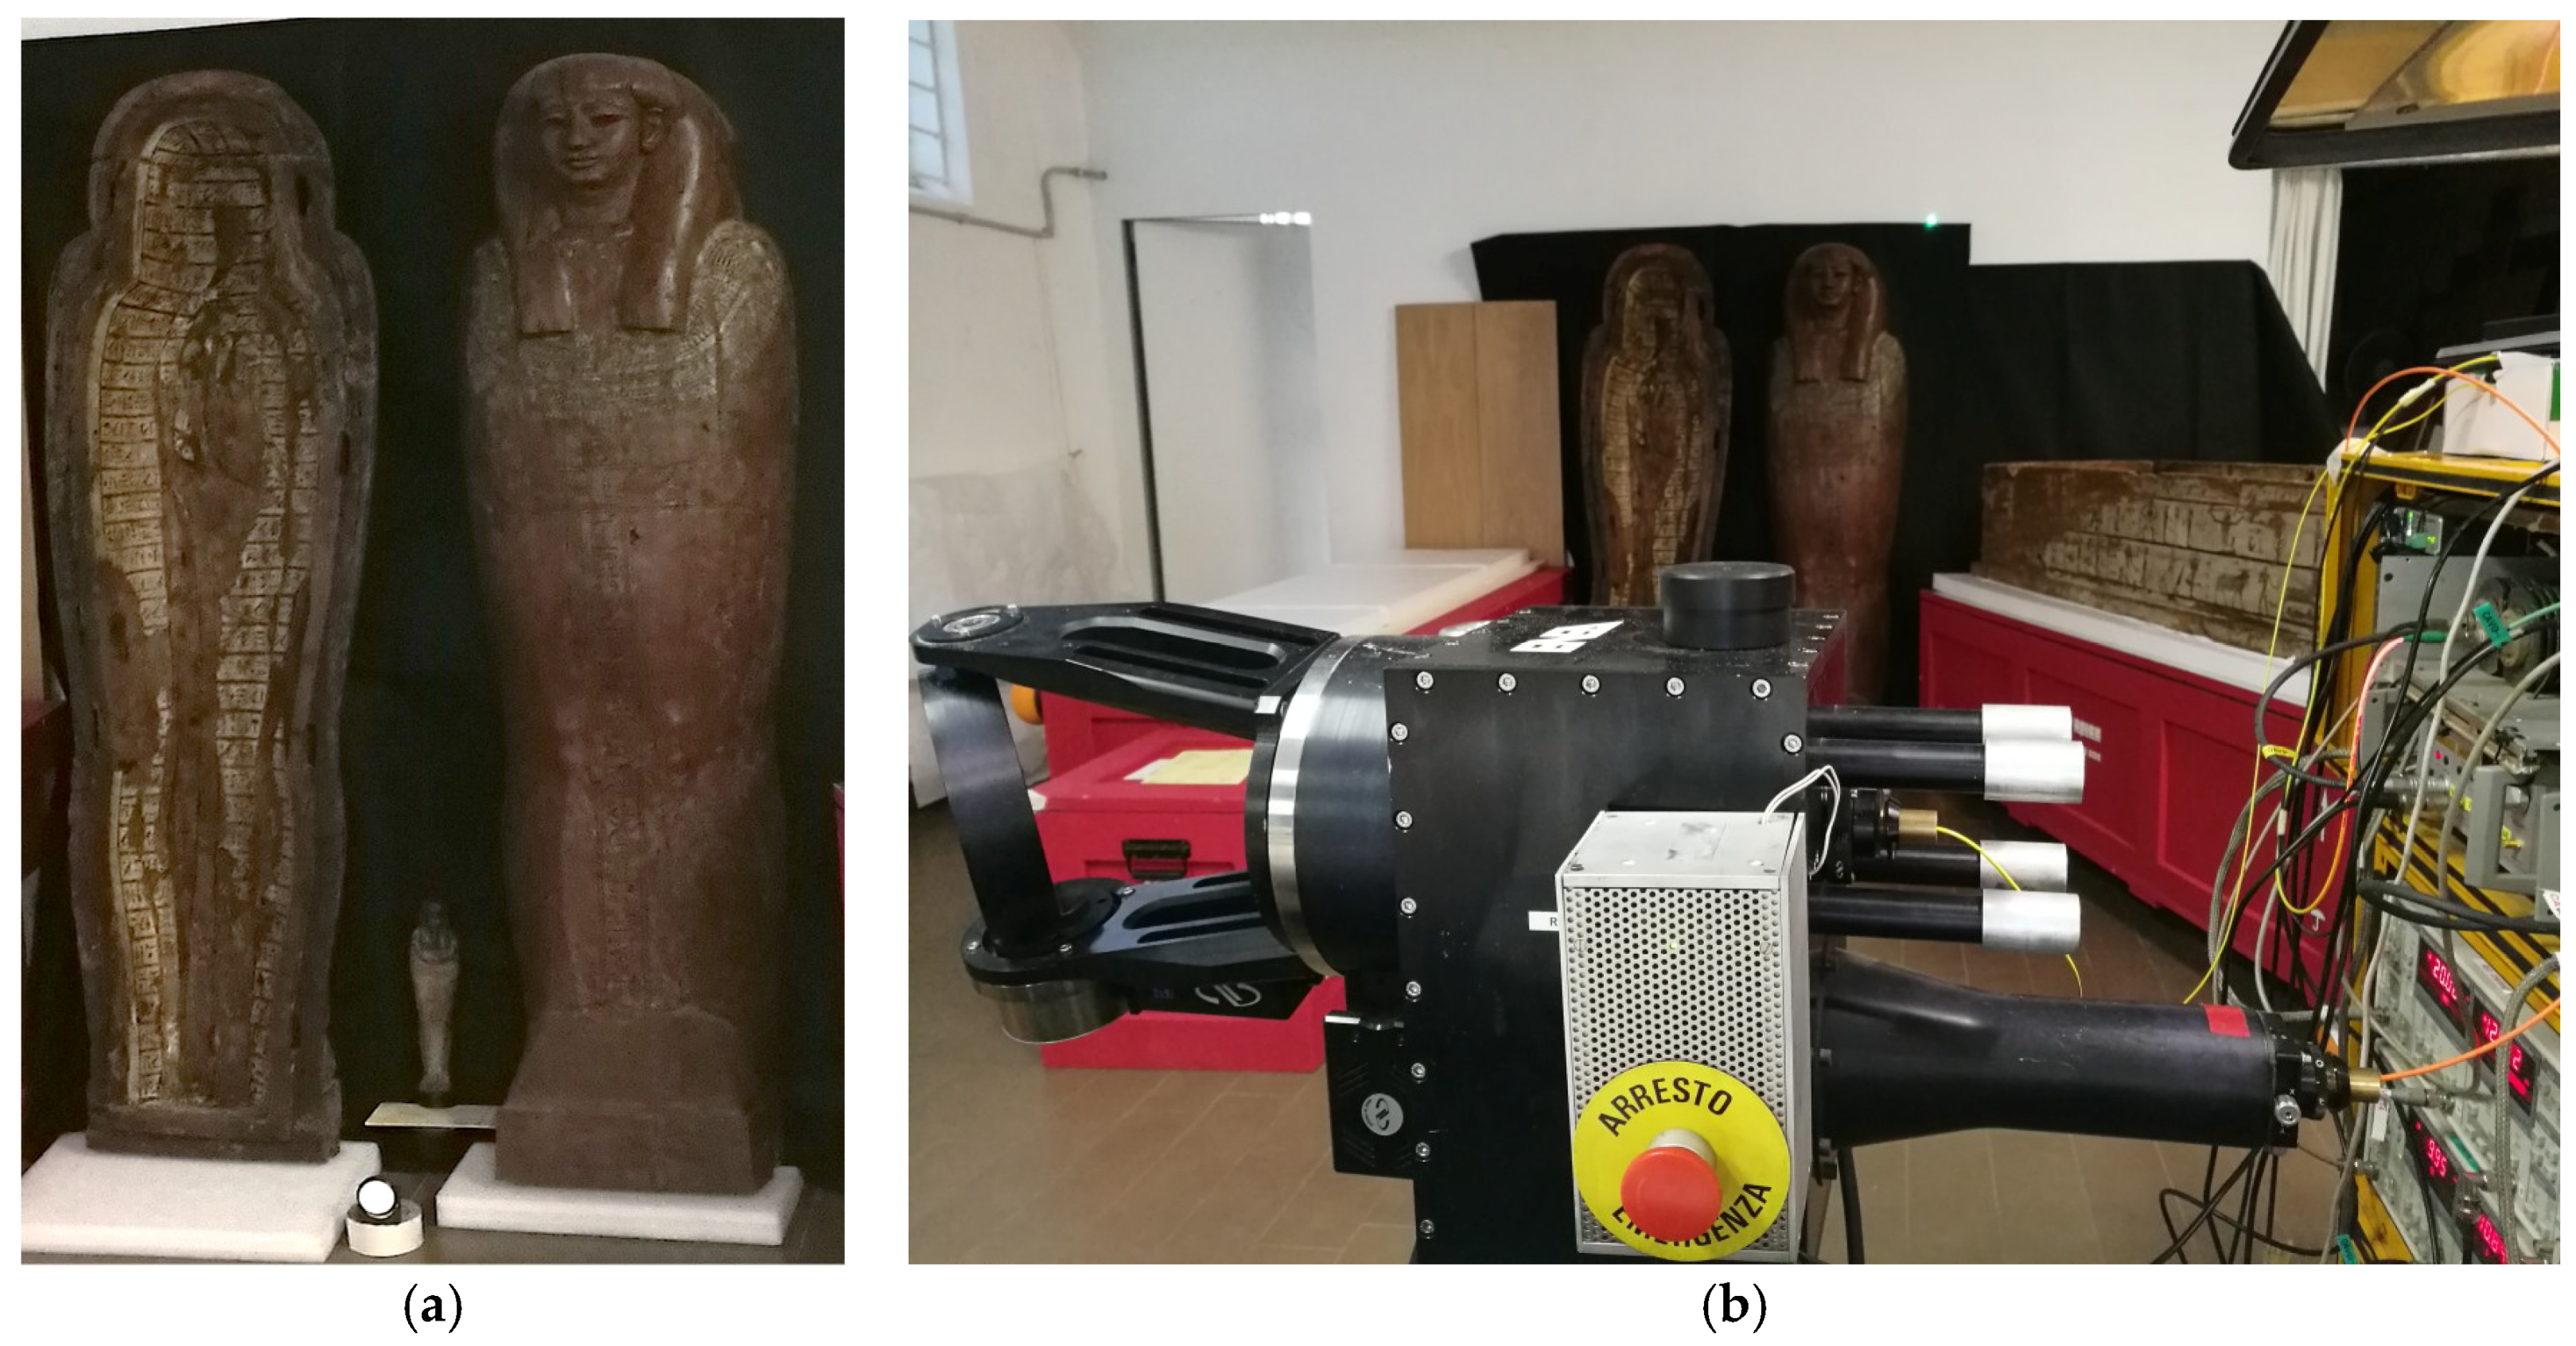
  • Egyptian wood sarcophagus (Milan, Italy).

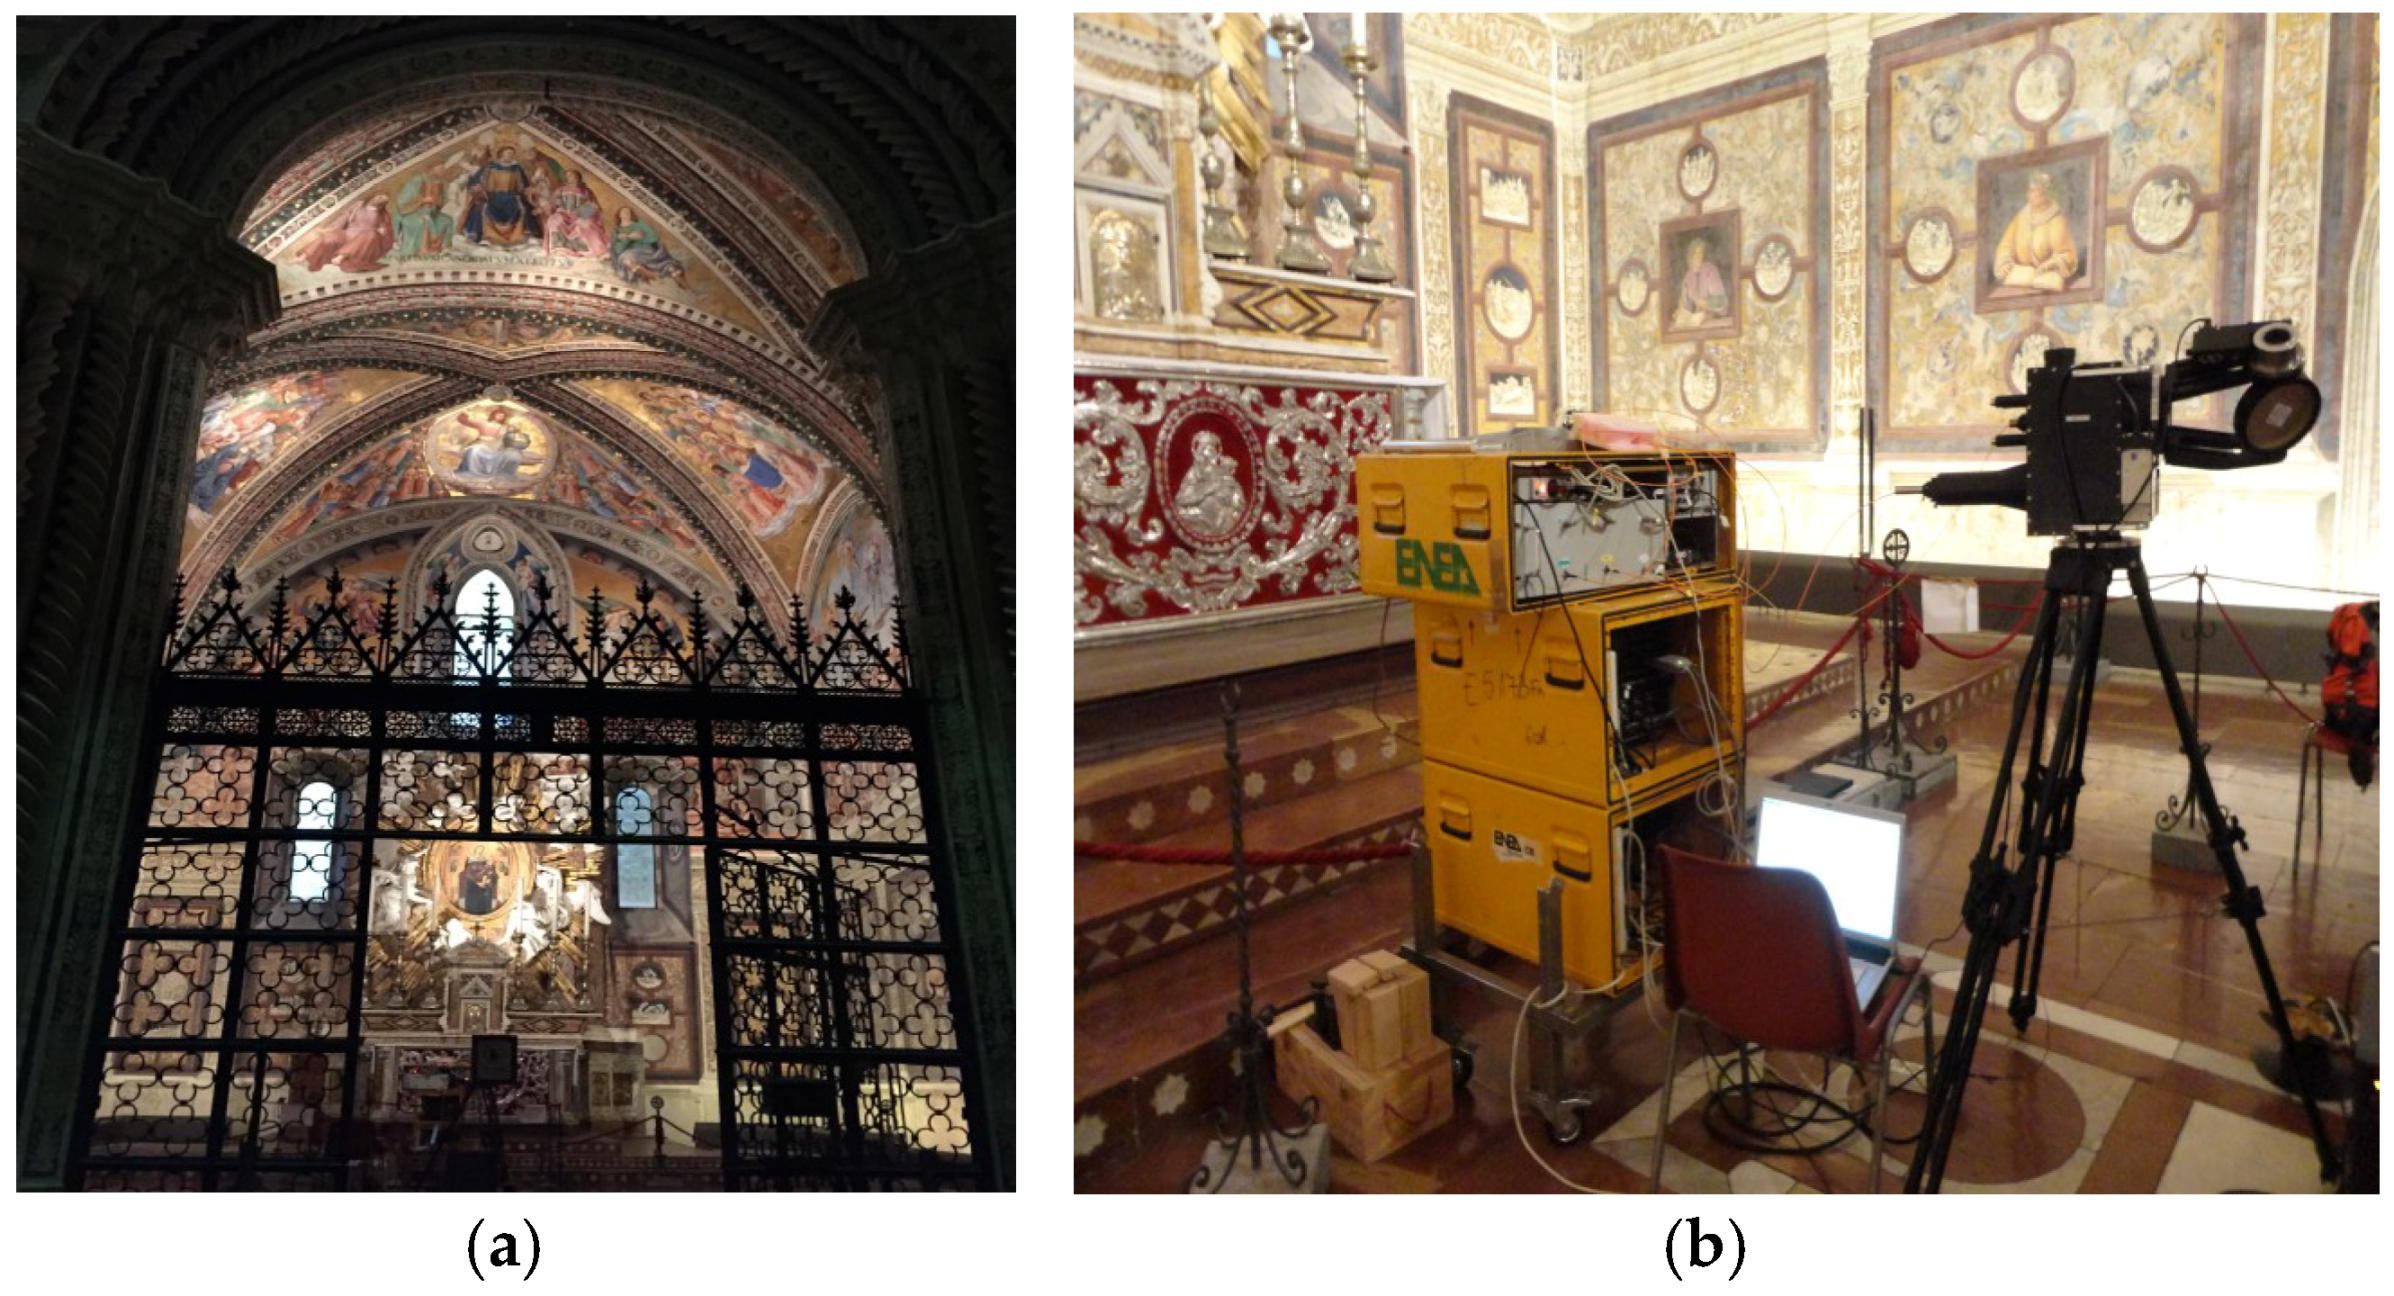
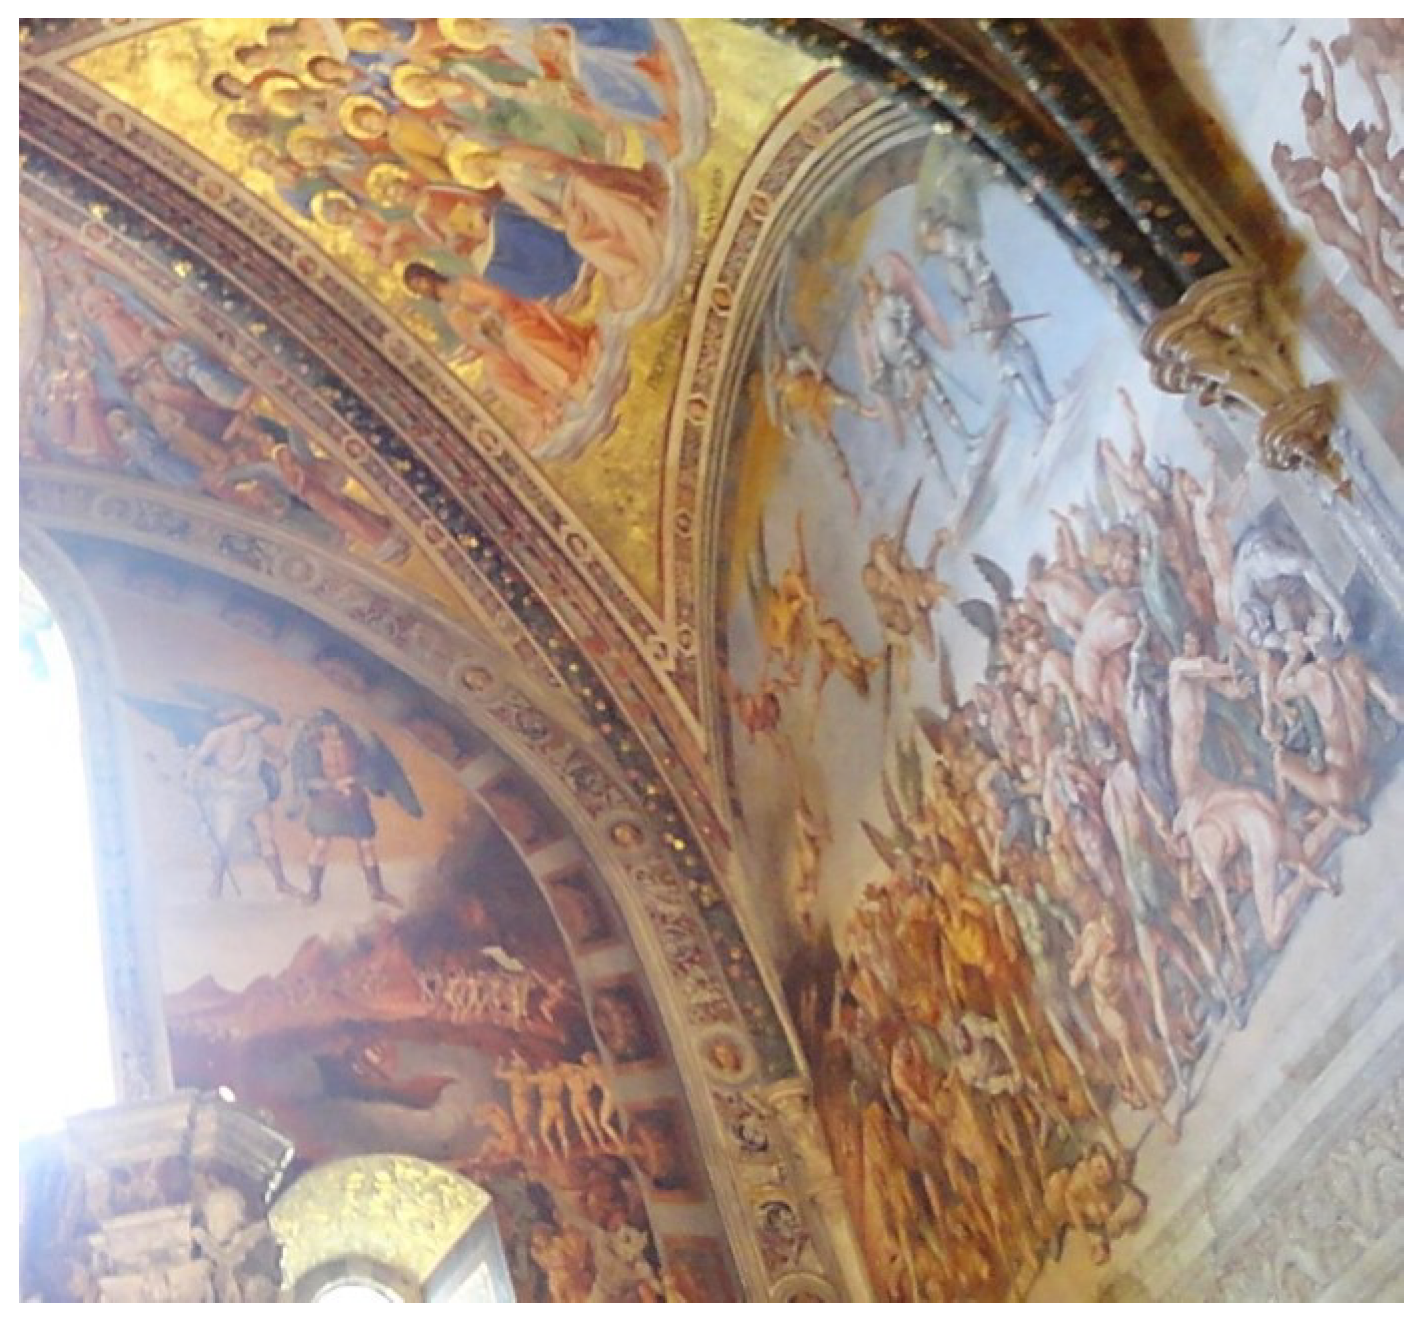
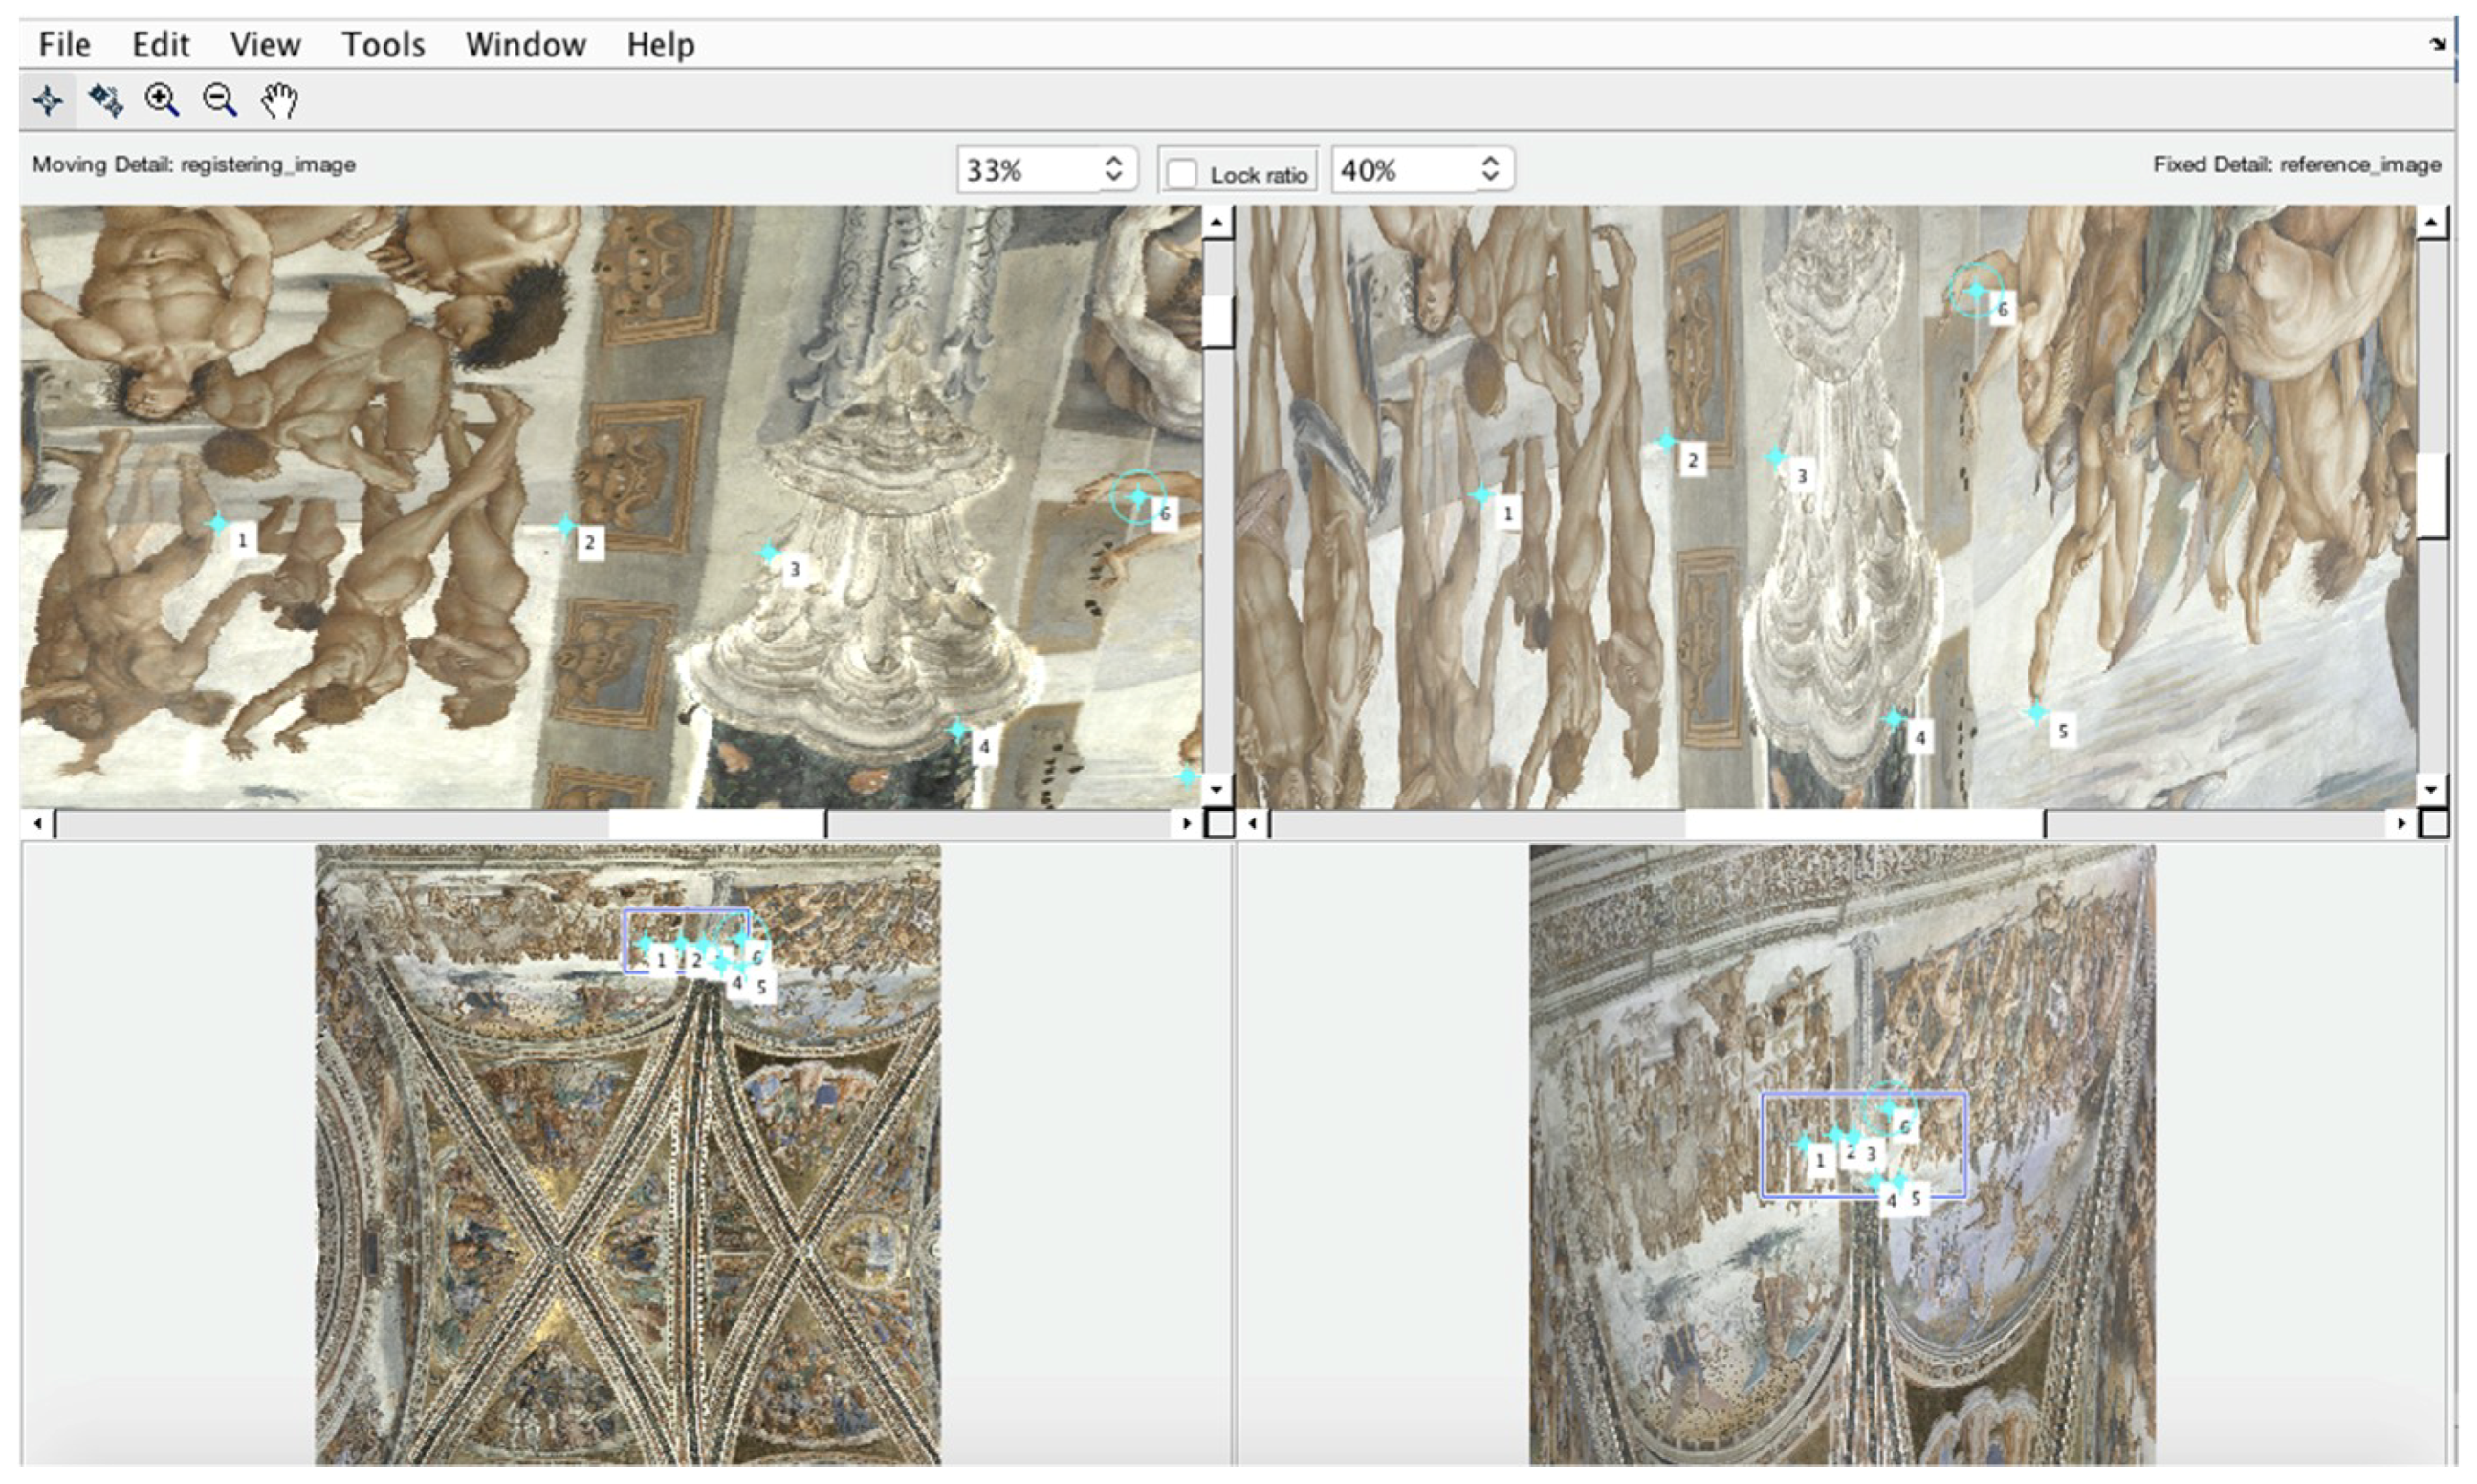
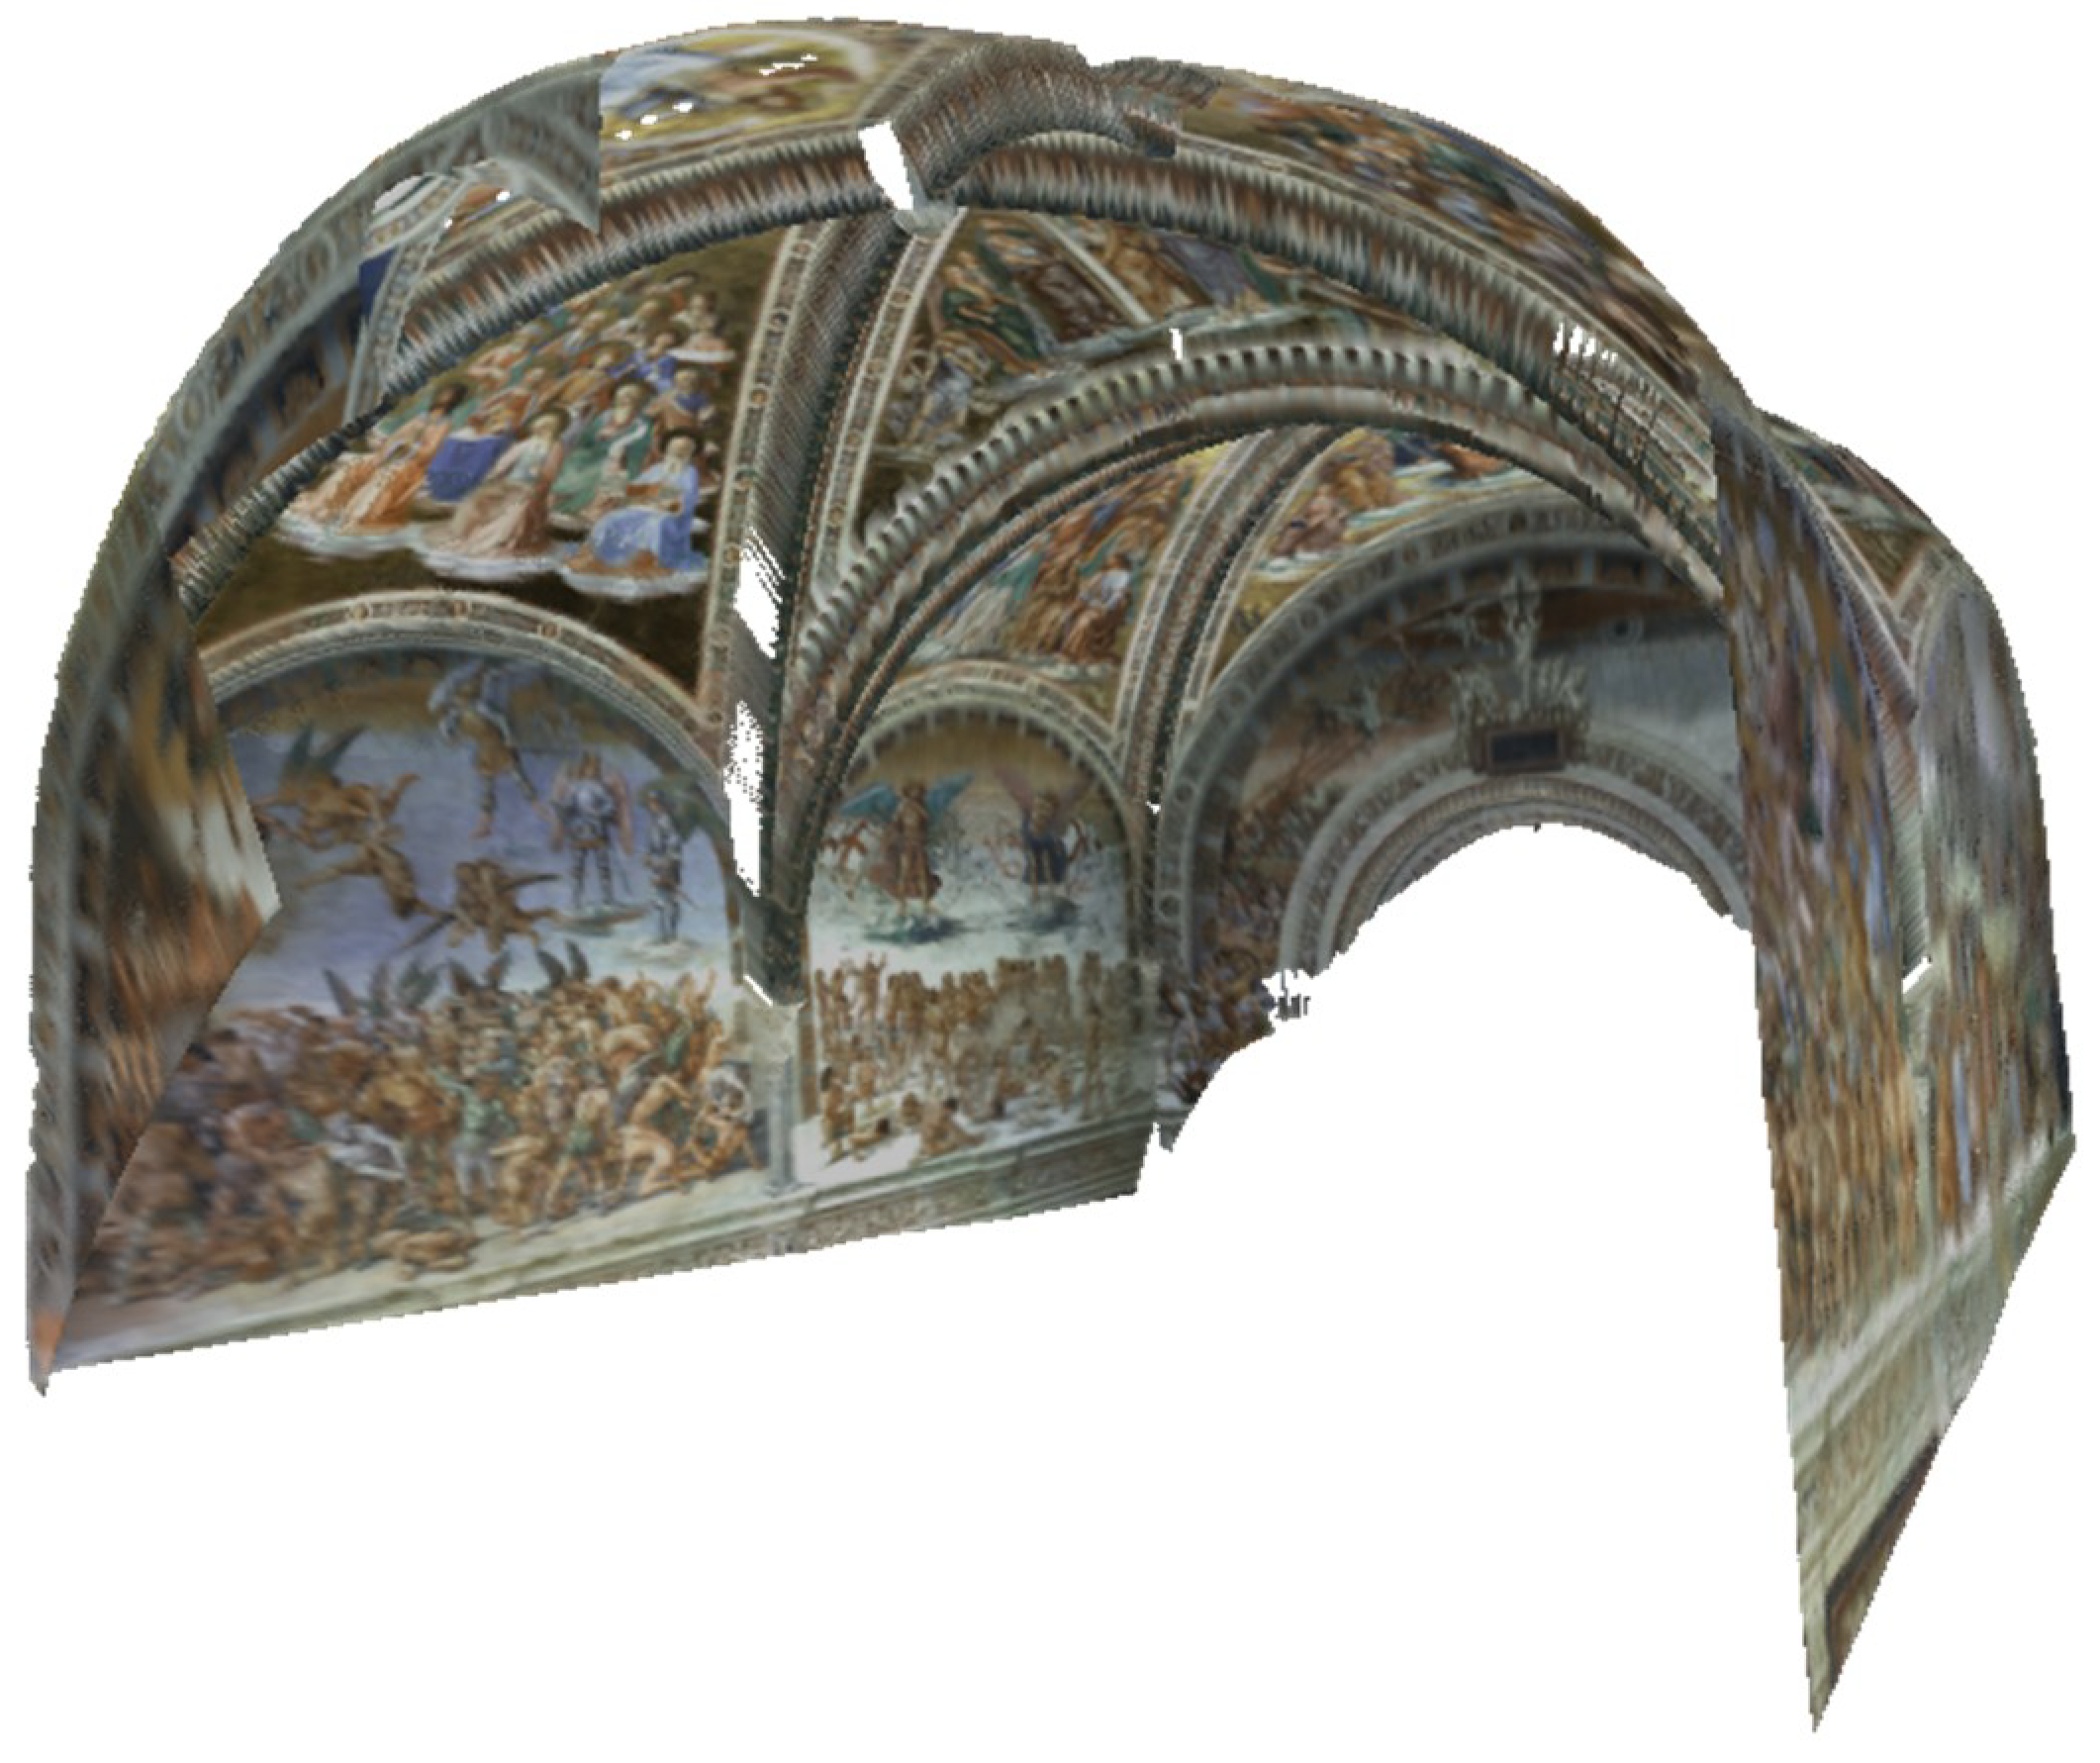
3.1.1. Saint Brizio Chapel in Orvieto Cathedral

In the right aisle of the Orvieto Cathedral, there is what is considered to be one of the jewels of the Early Renaissance: the Saint Brizio Chapel (Figure 4a). This masterpiece dates back to the 15th century and shows the excellent skills of Italian painters, in terms of both painting techniques and realization of the topic [38]. The chapel was totally painted with the frescoes by Luca Signorelli [39], considered the master and precursor of Michelangelo. The peculiarities of the site are the high illumination due to the presence of three large windows and the gold glazing of some part of the paintings, factors that produce distortions in color transposition in most of the image-based acquisition methods [40]. The work inside the chapel was aimed at the 3D color digitalization of the frescoes, which was never done before with scanner techniques and important for structure and fresco monitoring over time. For the acquisition process, the RGB-ITR system (Figure 4b) was set up in the center of the room, moving only the optical head in different stations in such a way as to allow the laser beam to scan the entire surface. The required time for data acquisition was about 26 h, comprehending night and day periods, without interdiction to visitors.

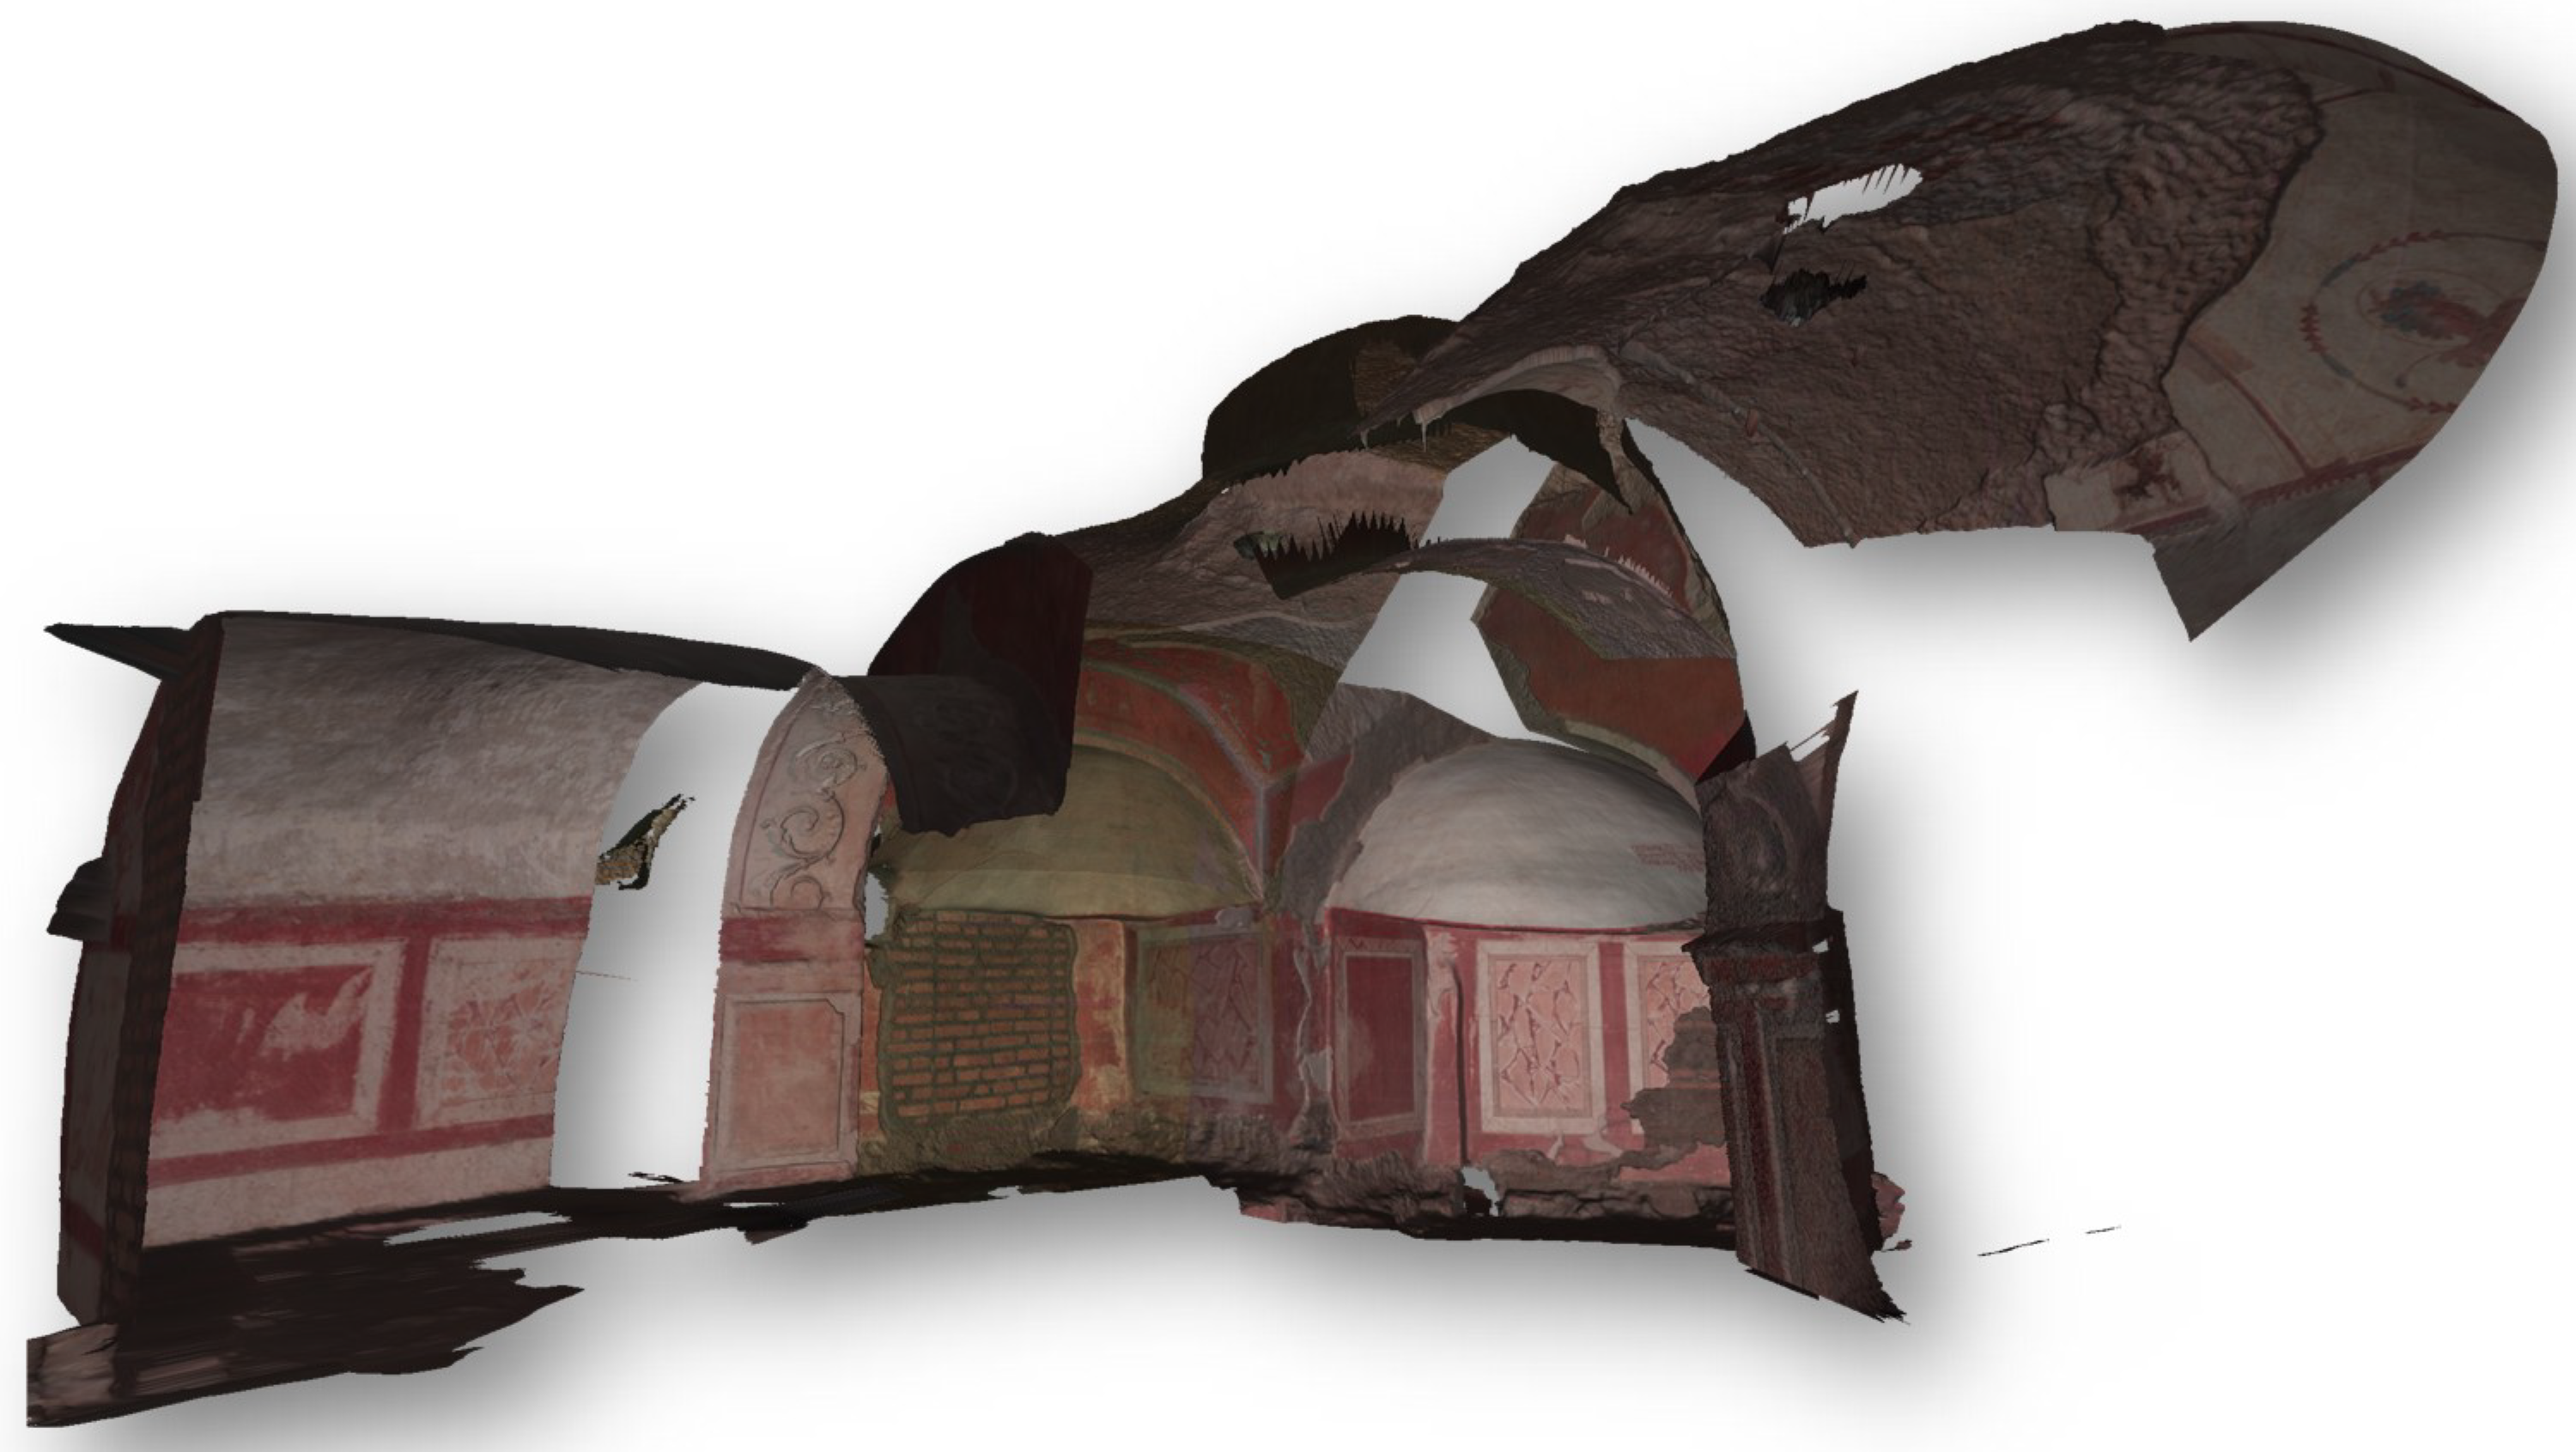
3.1.2. Greek Chapel in Priscilla Catacombs

The funerary complex of Priscilla Catacombs, dating back to between the 2nd and the 5th centuries, extends for more than 8 km under Rome at several levels of depth excavated in tuff stones. Around the cemeterial galleries, there are several important iconographic testimonies of the paleo Christian age, from inscriptions and paintings to cubicula and small rooms. Among the latter, the Greek Chapel (Figure 5) is one of the most significative representations of the Testament inside the complex. The little chapel, which takes its name from two Greek inscriptions inside it, stands out for the colored decorations and religious scenes, unique and particular for the historical period and artistic skills [41]. The hypogeum structures are critical ambient for the pictorial elements, which can be affected by biological attack, saline efflorescence, material swelling or cracking [42,43]. Due to the particular thermo-hygrometric conditions of the Priscilla catacomb environment, such as low temperature (~14 °C) and high humidity (~98%), procedures of the monitoring and documenting of the state of health were as important as urgent in order to keep alterations, detachments and the general conservation status under control. However, uncontrolled microclimatic parameters can be damaging also to electronic components, built for operation in ideal thermo-hygrometric conditions (T~15 ÷ 35 °C, RH-relative humidity~35 ÷ 75%) [44]. In this case, the solution to the hygrometric problems, i.e., condensation, was solved, covering the electronic components with a PVC (polyvinyl chloride)-protective sheet.
Due to the several architectonic elements, the complete 3D digitalization of the room required several stations, placing the electronic components in two positions and moving the scanning module along the chapel. For these reasons, the area was divided into multiple scans for a total of approx. 190 h.

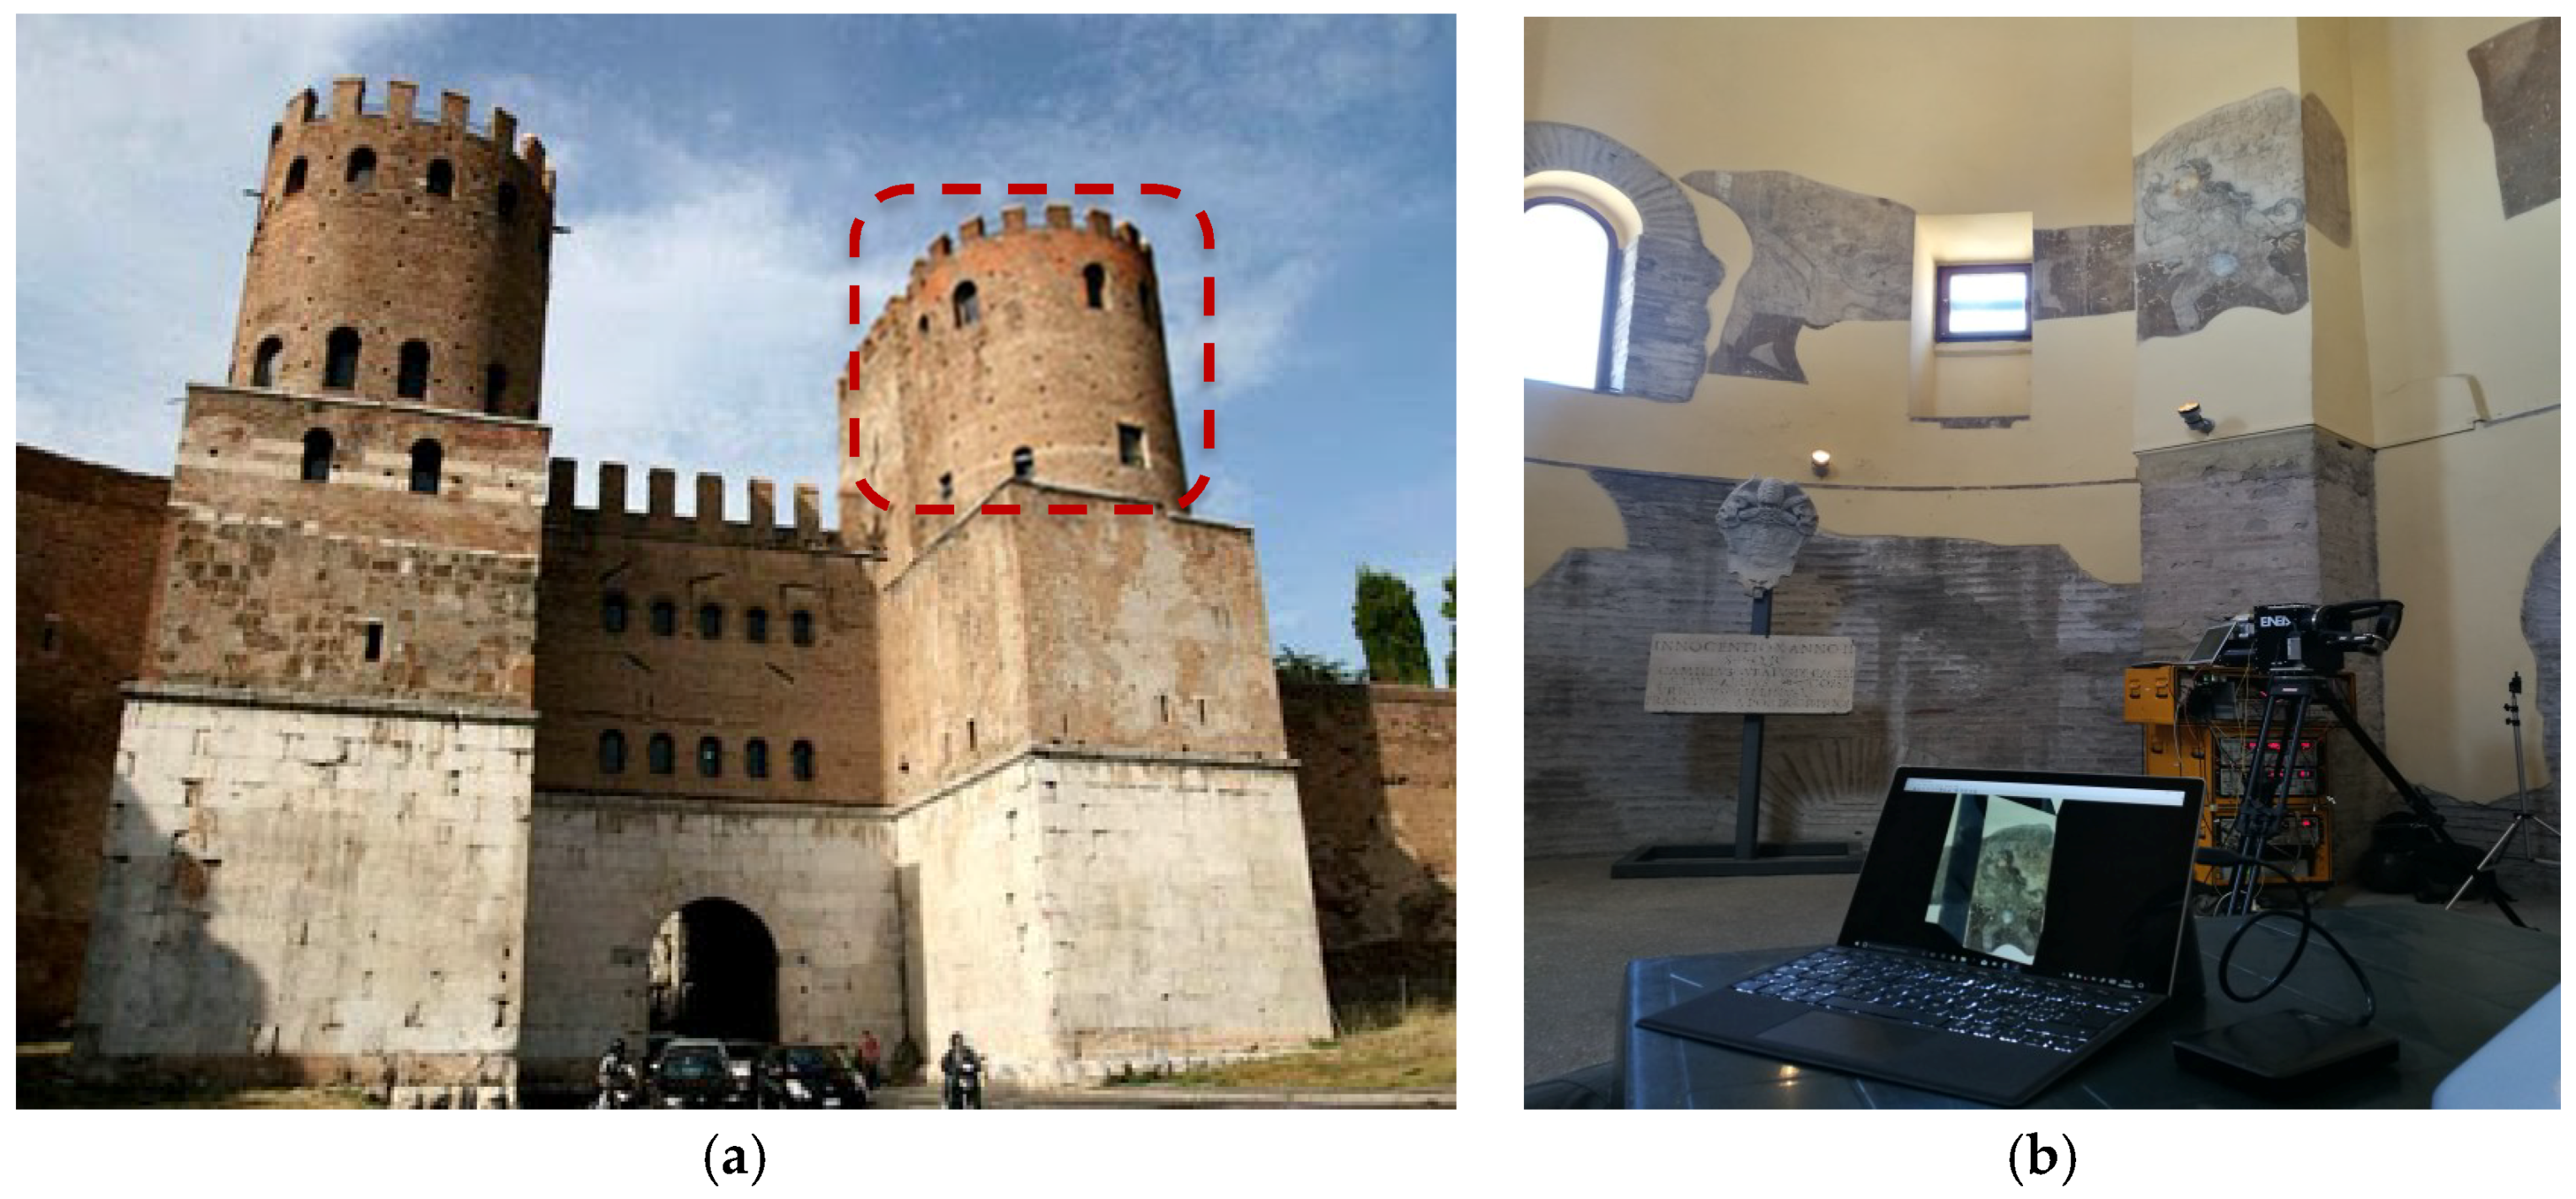
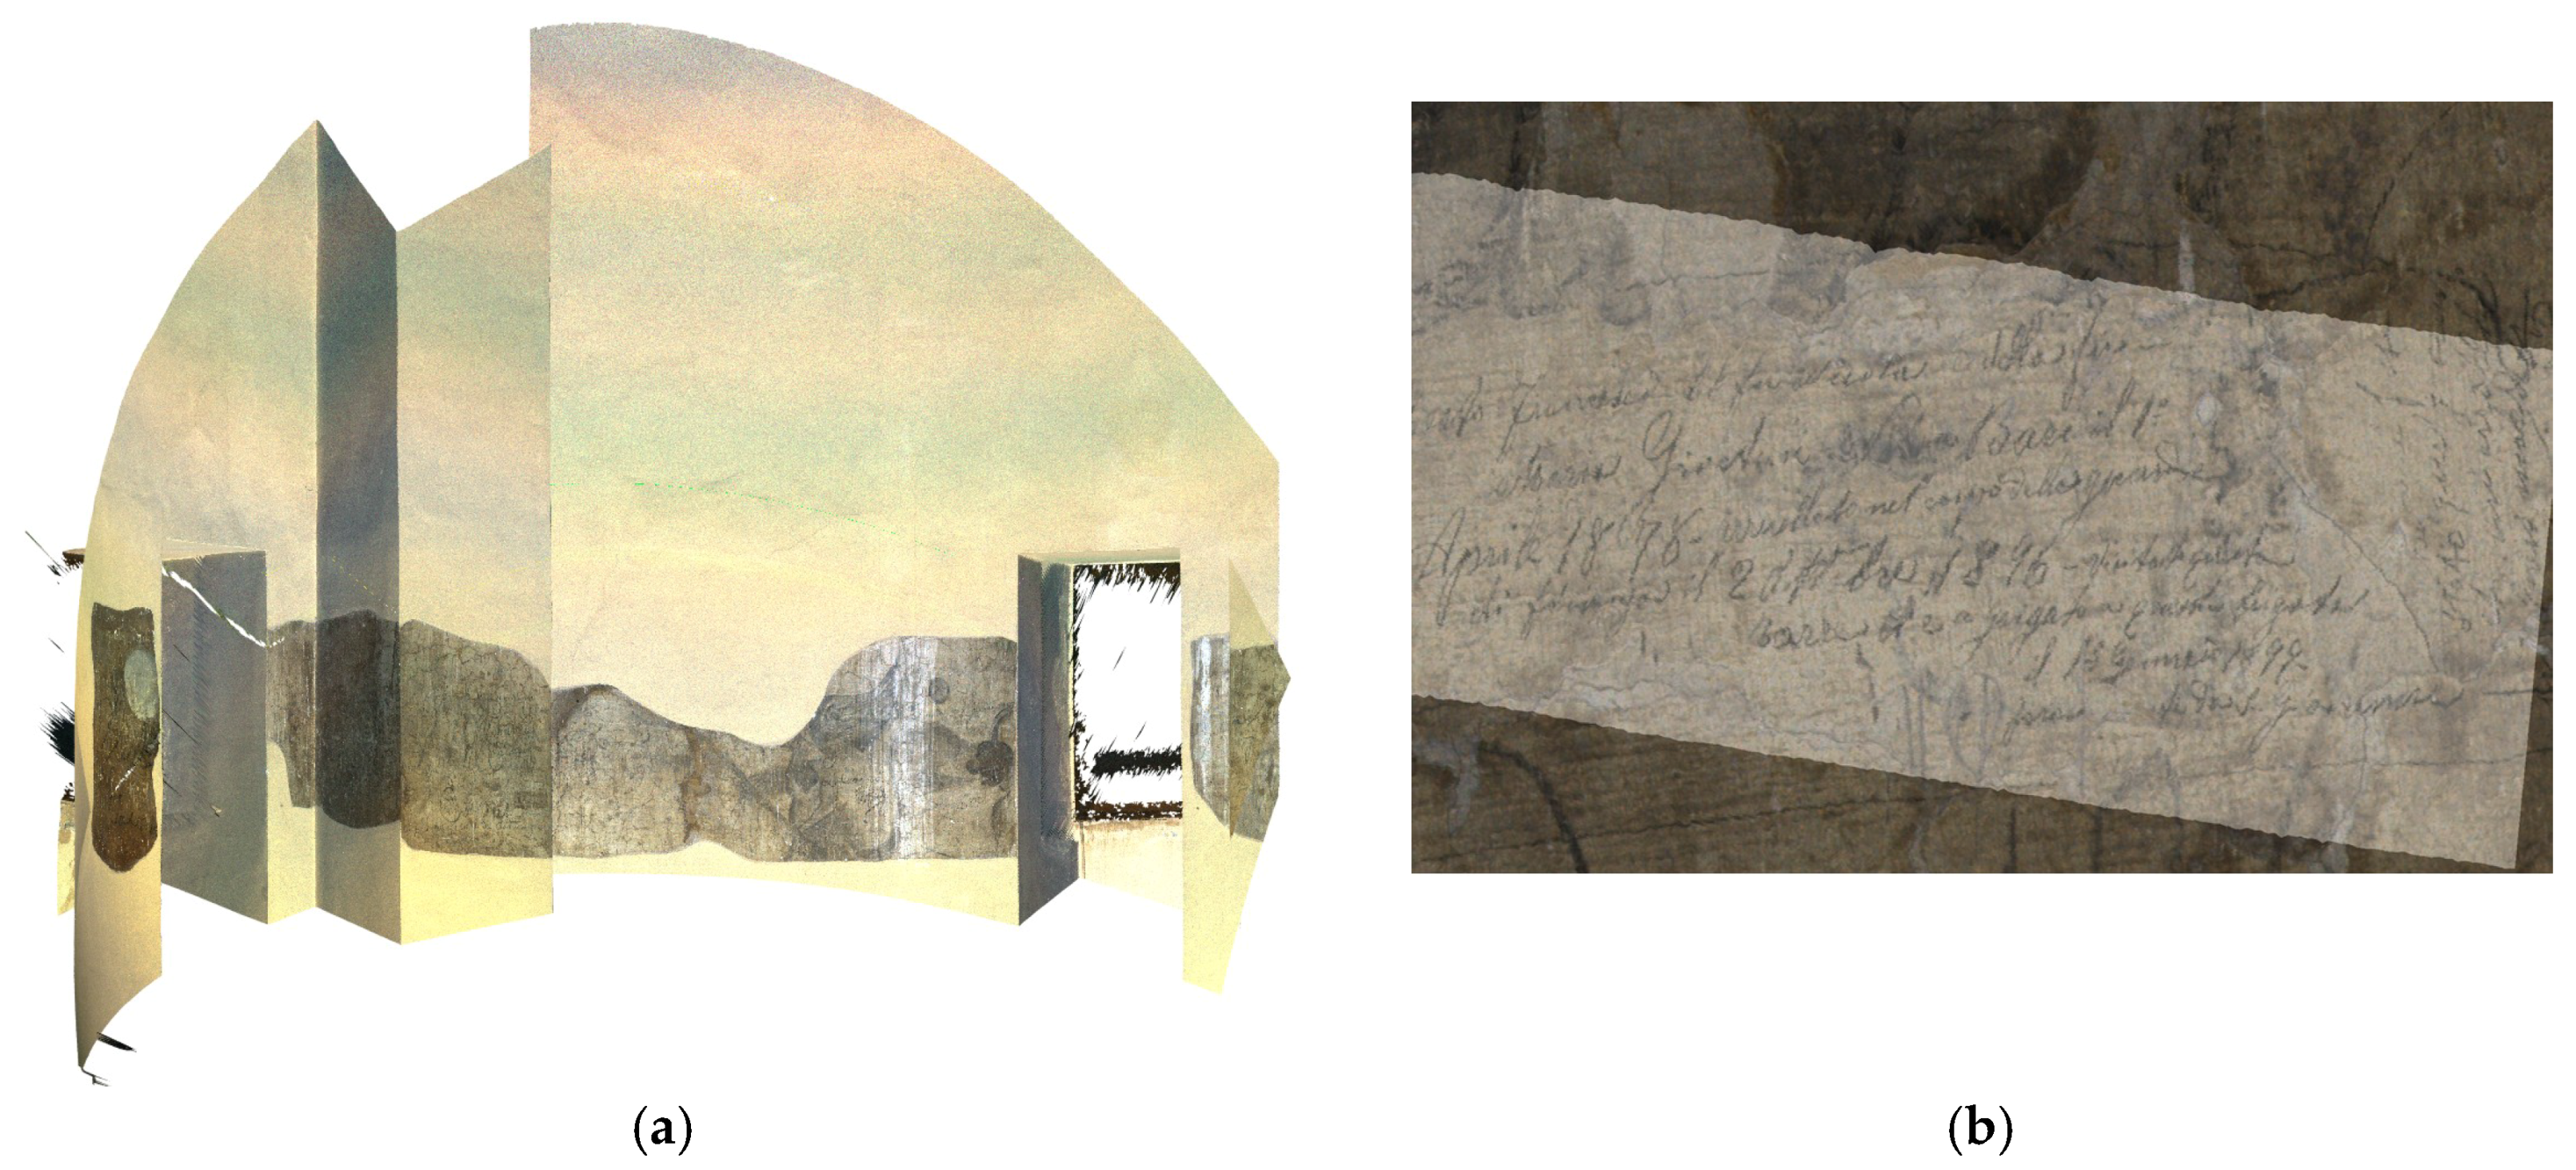
3.1.3. Tower Room in Saint Sebastian Gate of the Aurelian Walls

The city of Rome has many remains of ancient protection walls, dating back to the Roman imperial age. This important proof of the military strength of the Roman army surrounds several areas of the city and comprehends monumental gates, such as the Saint Sebastian one (Figure 6a). The architecture is typical of this type of structure, even if it has undergone several remakes over the centuries: one central arch between two lateral towers was developed into three floors [45,46]. The room of the right tower is particularly interesting from a historical and artistic point of view, because of the presence of charcoal drawings and inscriptions as testimonies of soldiers’ lives in a military establishment in the late 19th century (Figure 6b). These inscriptions, illegible from the ground, have been the main object of the ENEA work, through 3D modelling and image enhancement of RGB-ITR data for the content extrapolation and reconstruction. The data acquisition process was carried out in 10 days, moving the system in seven different stations for the complete digitalization of each architectural structure (columns, vault).

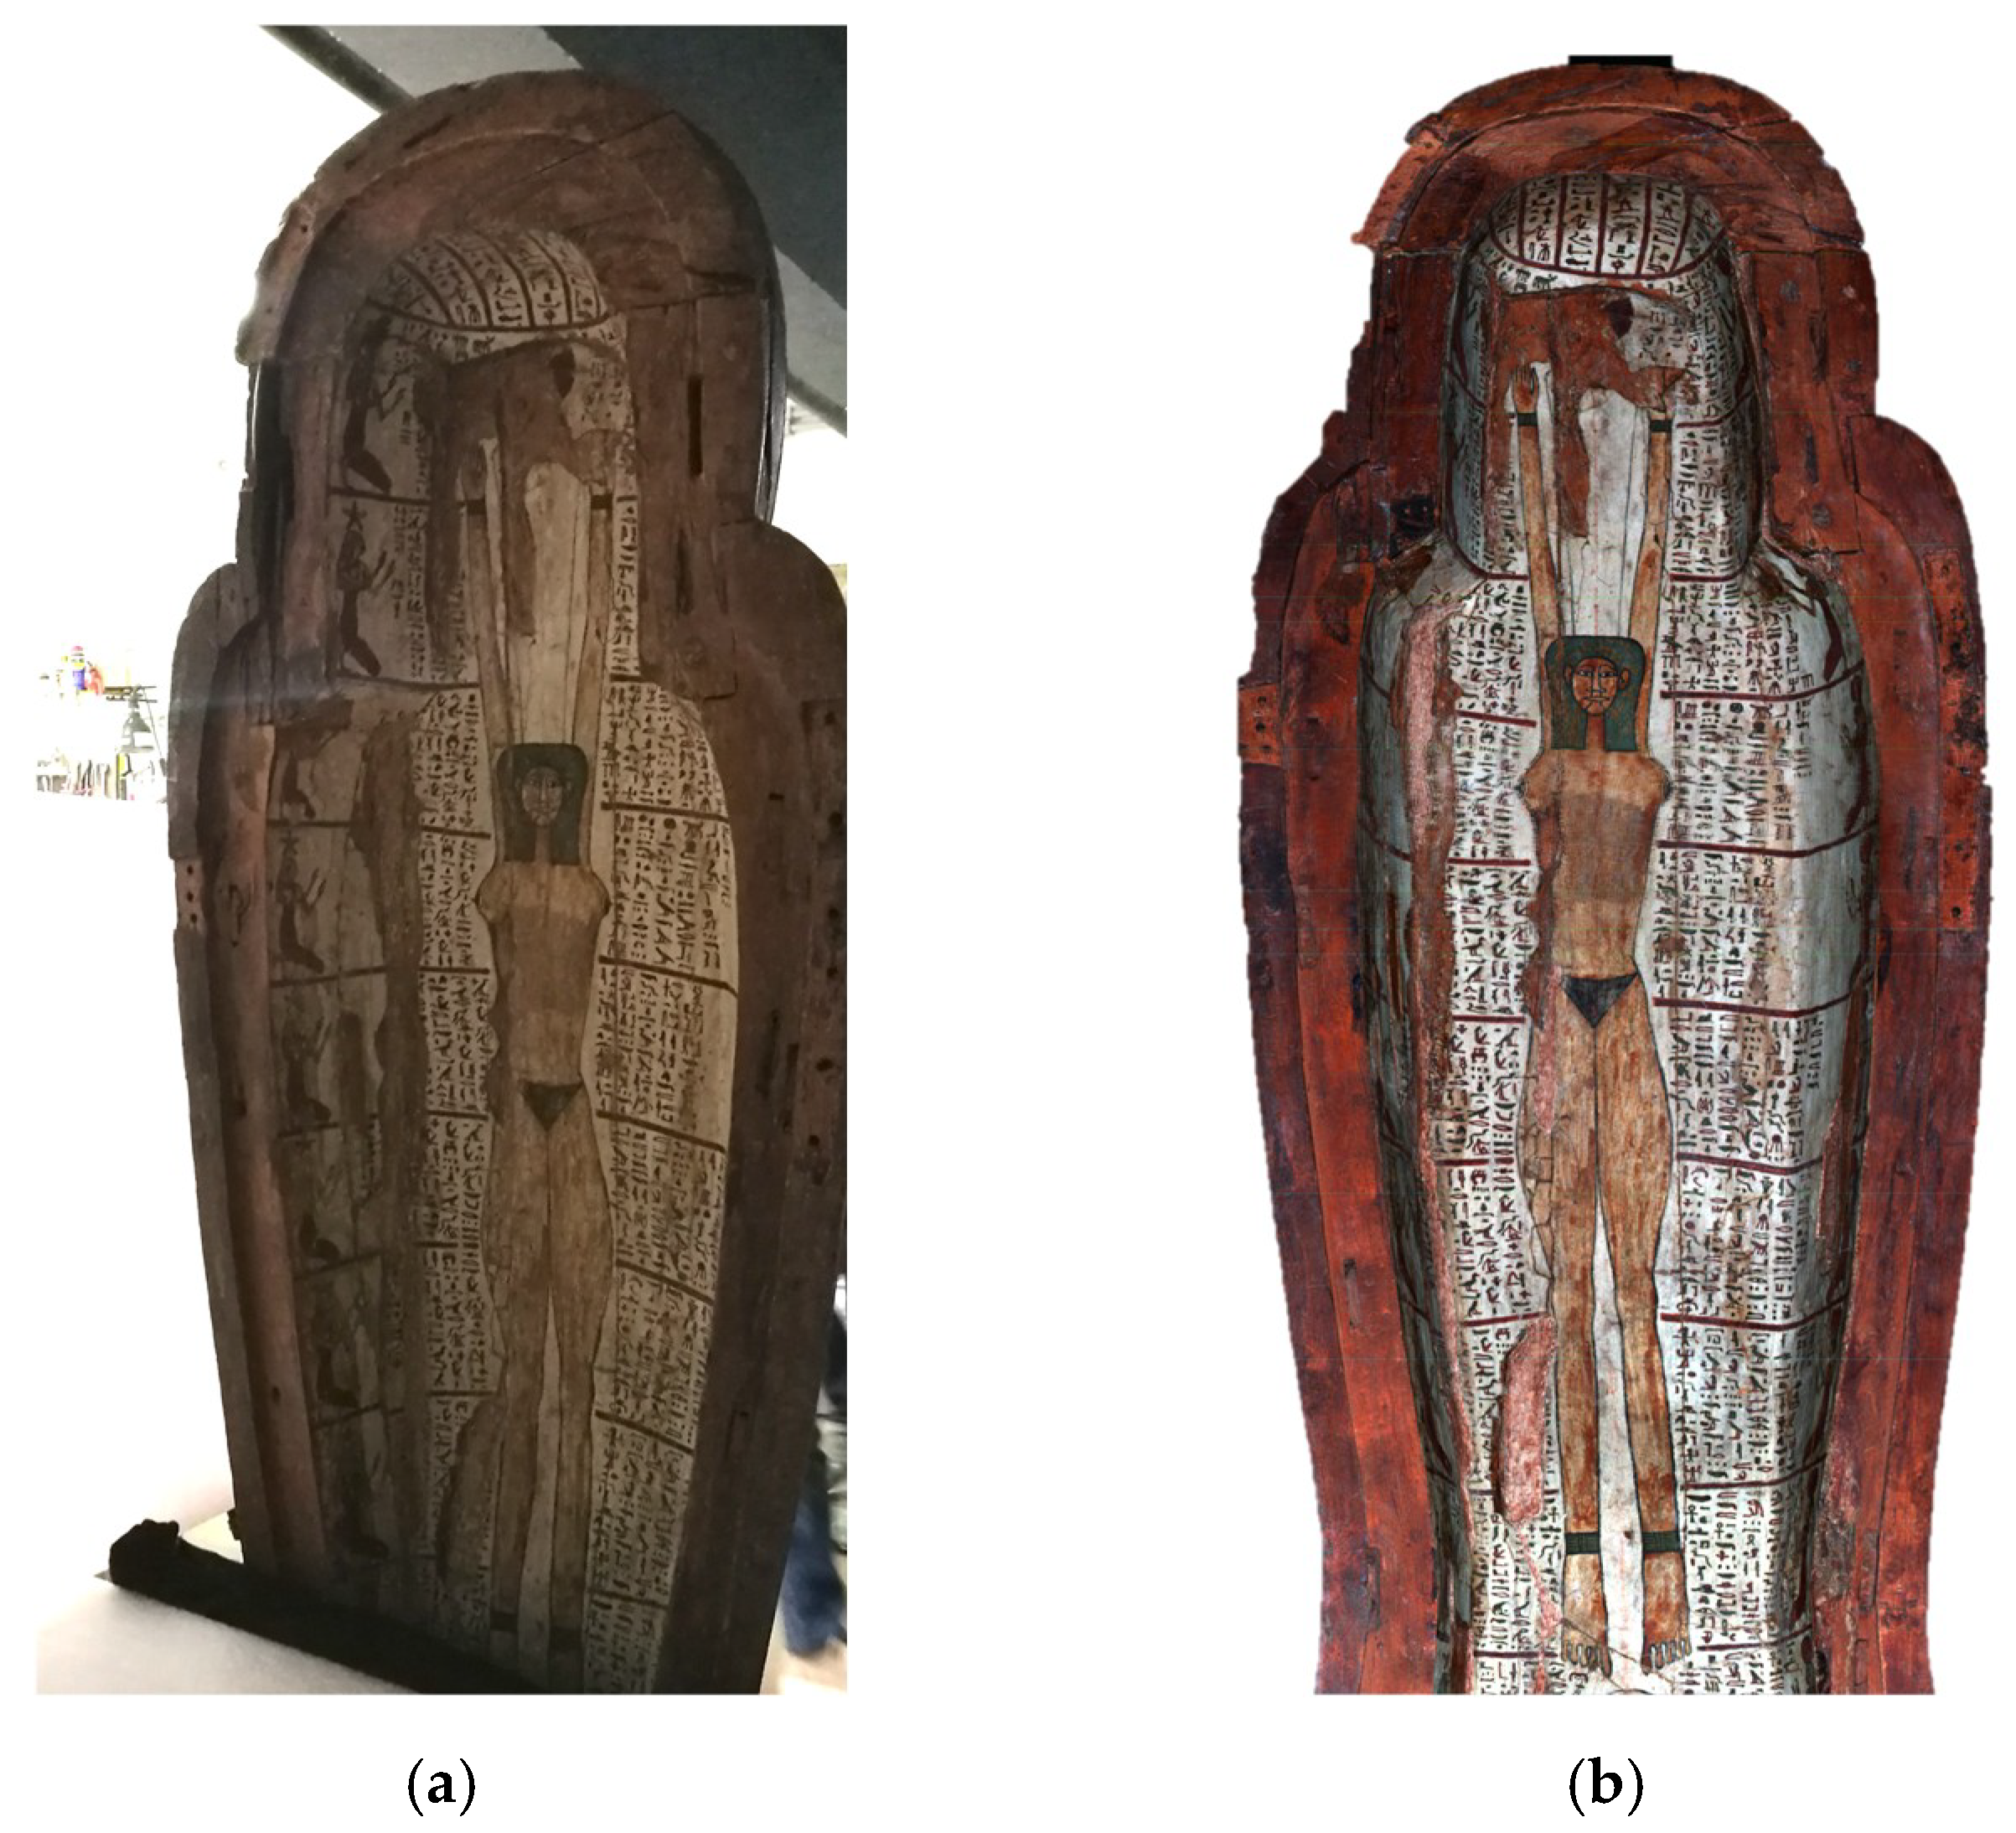
3.1.4. Egyptian Wooden Sarcophagus

The Egyptian anthropoid sarcophagus of Peftjauyauyaset (Figure 7a) belongs to the XXVI dynasty (7th–6th century BC) and is precious evidence of crafting skills of the Late Period of ancient Egypt.
This fragile artefact, coming from the Archaeological Museum of Milan, is made of Lebanon cedar wood, covered with painted plaster and intaglio carvings. The sarcophagus is completely decorated, both internally and externally, with polychromatic drawings and hieroglyphics. The general conservation status is particularly exceptional for what concerns the wooden structure and the decorations. The 3D models of the two part of the sarcophagus were requested from the restorers as documentation material before restoration. The digitalization process had to deal with a set of problems, such as reduced distances between object and system (<3 m), complex structures made of concavities and convexities, multiple materials and several incisions. The RGB-ITR system was placed at a fixed station (Figure 7b), while the two parts of the sarcophagus were moved to three different positions in order to scan entirely the artwork.

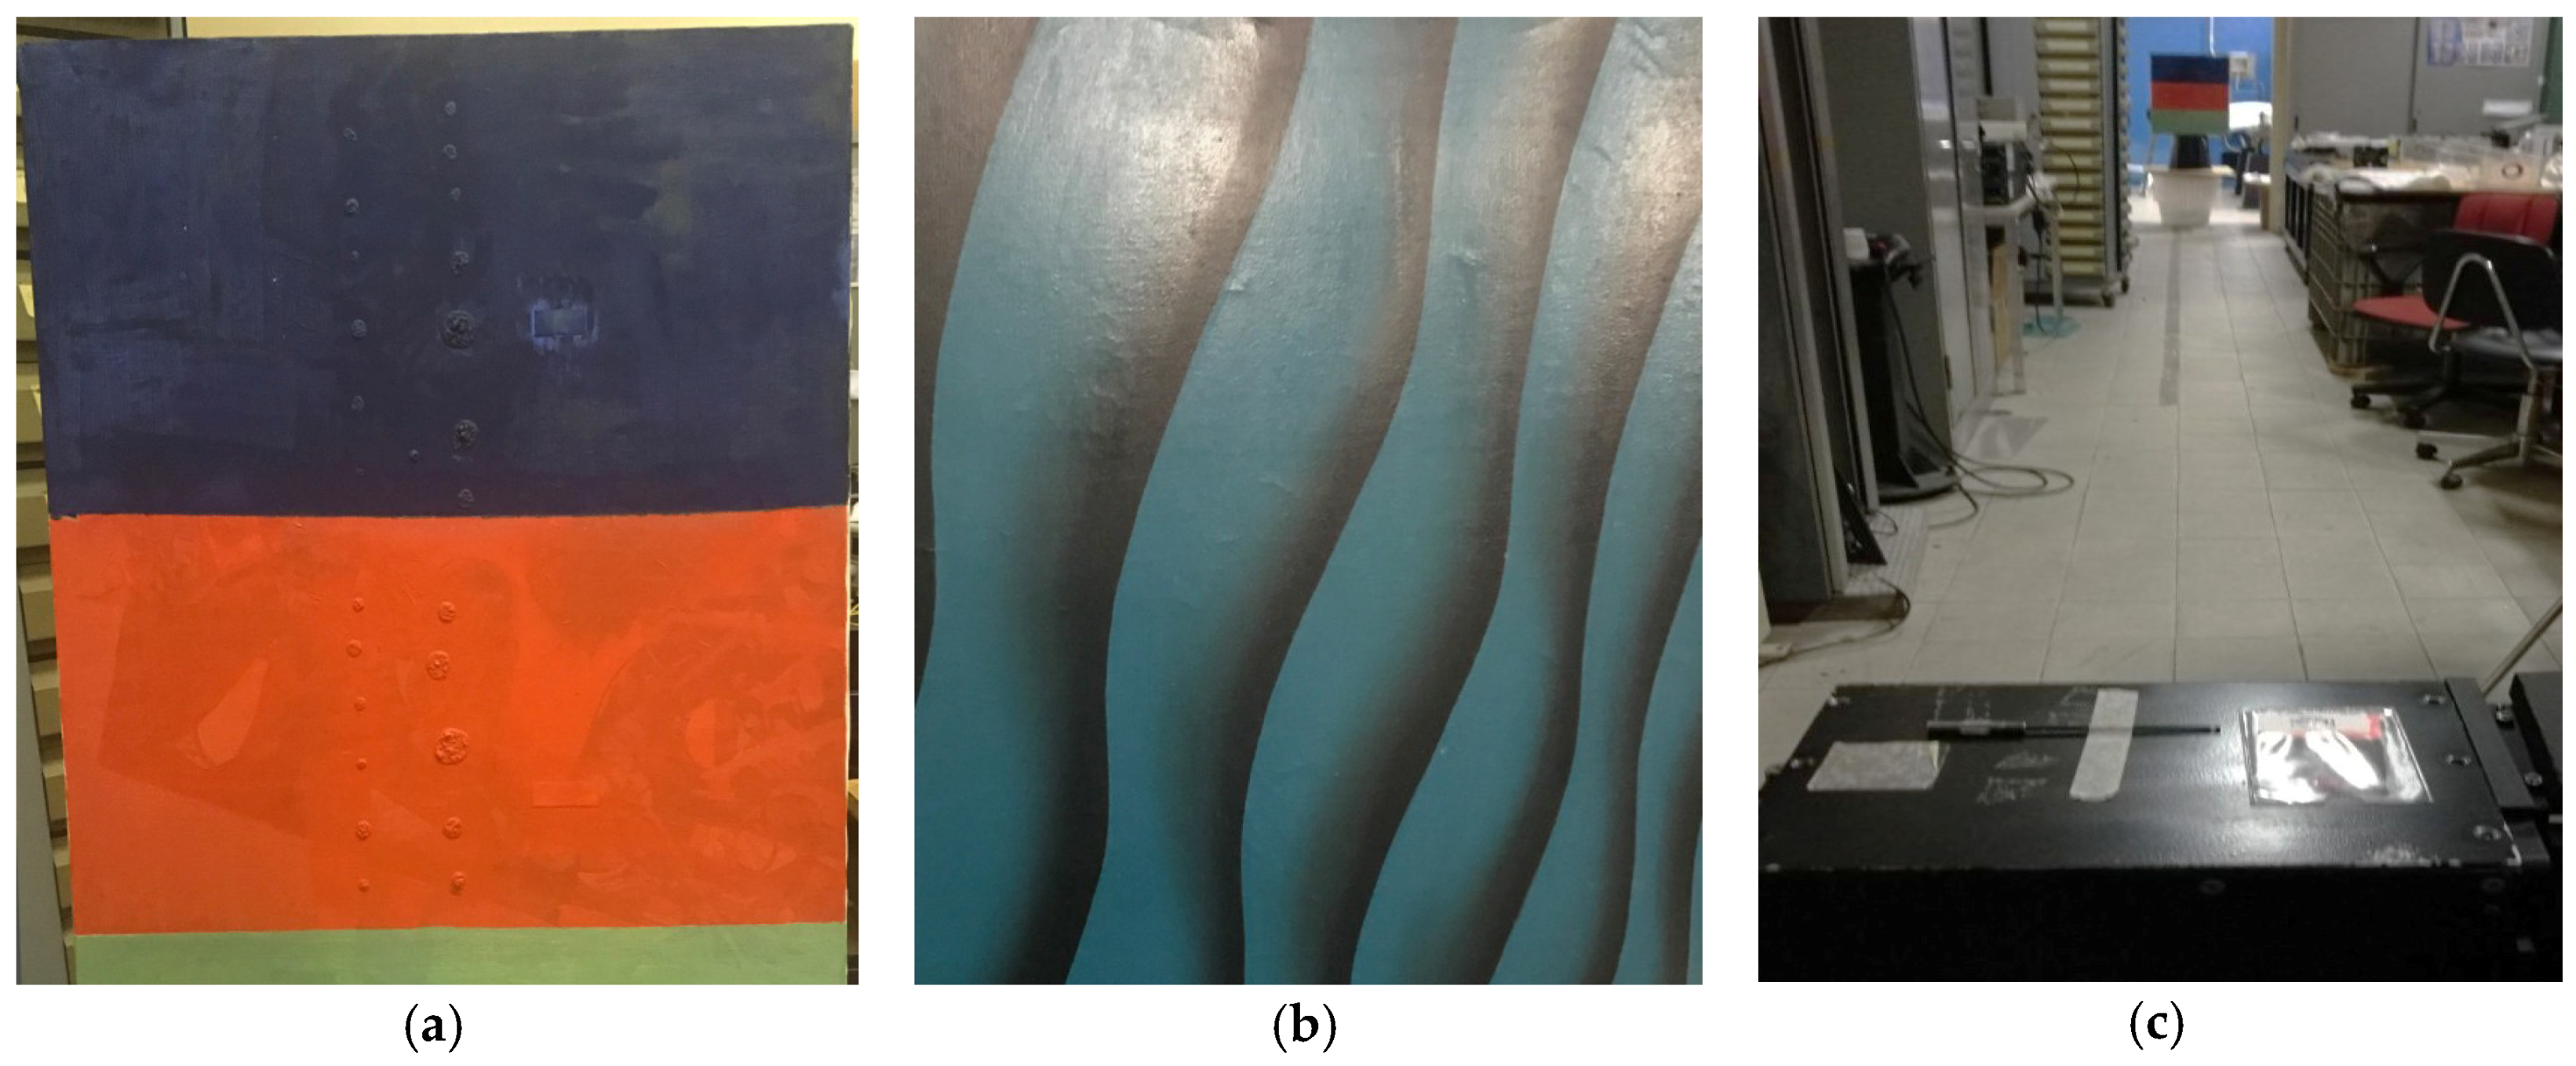
3.2. Laboratory Tests

Due to its very prototypal status, the IR scanner was tested in a laboratory environment on two painted samples. The first canvas (Figure 8a) presents three bands (blue, orange and light green) made with watercolor. From a naked-eye observation, an underlying drawing can be noticed although the different elements are not clearly visible. The second canvas (Figure 8b) has a wave motif, with a color gradient from black to greenish. The materials are acrylics, but from the direct observation of the work, the painting technique is not evident. The laboratory experiment (Figure 8c) was carried out, illuminating with IR-ITR scanner one canvas at a time at two different distances (at 10 m (Figure 8a) and at 5 m (Figure 8b)), in order to compare the quality of the results at a different distance range. By using a Thorlabs detector card [47], the IR laser beam was visualized on the canvas and the scanning area was defined through the ScanSystem software.

4. Results

The reported results were achieved using the instruments for a minimum of one hour to a maximum of one week, with post-processing phases duration from less than hours for preliminary 3D modelling up to several days for the complete merging of multiple scans or image enhancement. In Table 1, the main scanning parameters and difficulties of each case study reported in this paper are summarized.

4.1. 3D Modelling and Image Enhancement

The digitalization of the San Brizio Chapel was carried out during day and night hours, independently from the high illumination that characterizes the room and strongly defeats photographs, as can be noticed in Figure 9.
The final 3D model was built from the merging of multiple scans acquired with a very partial overlapping along the edges, in order to give reference points during the registration process, carried out by picking the same points in the two textures to register, as shown in Figure 10.
Figure 11 shows the complete model of the chapel, providing a truthful transposition of colors in a 3D reconstruction without saturations or shadows.
The 3D modelling of the Greek Chapel required tens of scans, dividing the room into multiple sub-areas. The single scans were calibrated and then all registered with each other using itrAnalyzer software for the building of the final 3D model, partially shown in Figure 12.
In the case study of the Saint Sebastian tower, in addition to the 3D modelling (Figure 13a), the post-processing phases on RGB-ITR data included the application of ‘affine’ algorithm for letter detection and background removal (Figure 13b). The research has provided a partial reconstruction of the inscriptions contents through the extrapolation of single letters [48]. Further elaborations are needed for automatic word reconstructions based on letter recognition.
The sarcophagus digitalization has represented an interesting instrumental challenge, both in terms of material and shape. The several concavities and convexities of the artefact requested different object positioning and multiple scans, translated into the registrations of several textures. Since the study is still ongoing, the results are not complete but promising, having achieved accurate digitalization of colors, materials and irregularities (Figure 14b), not well appreciable with laboratory artificial illumination (Figure 14a).

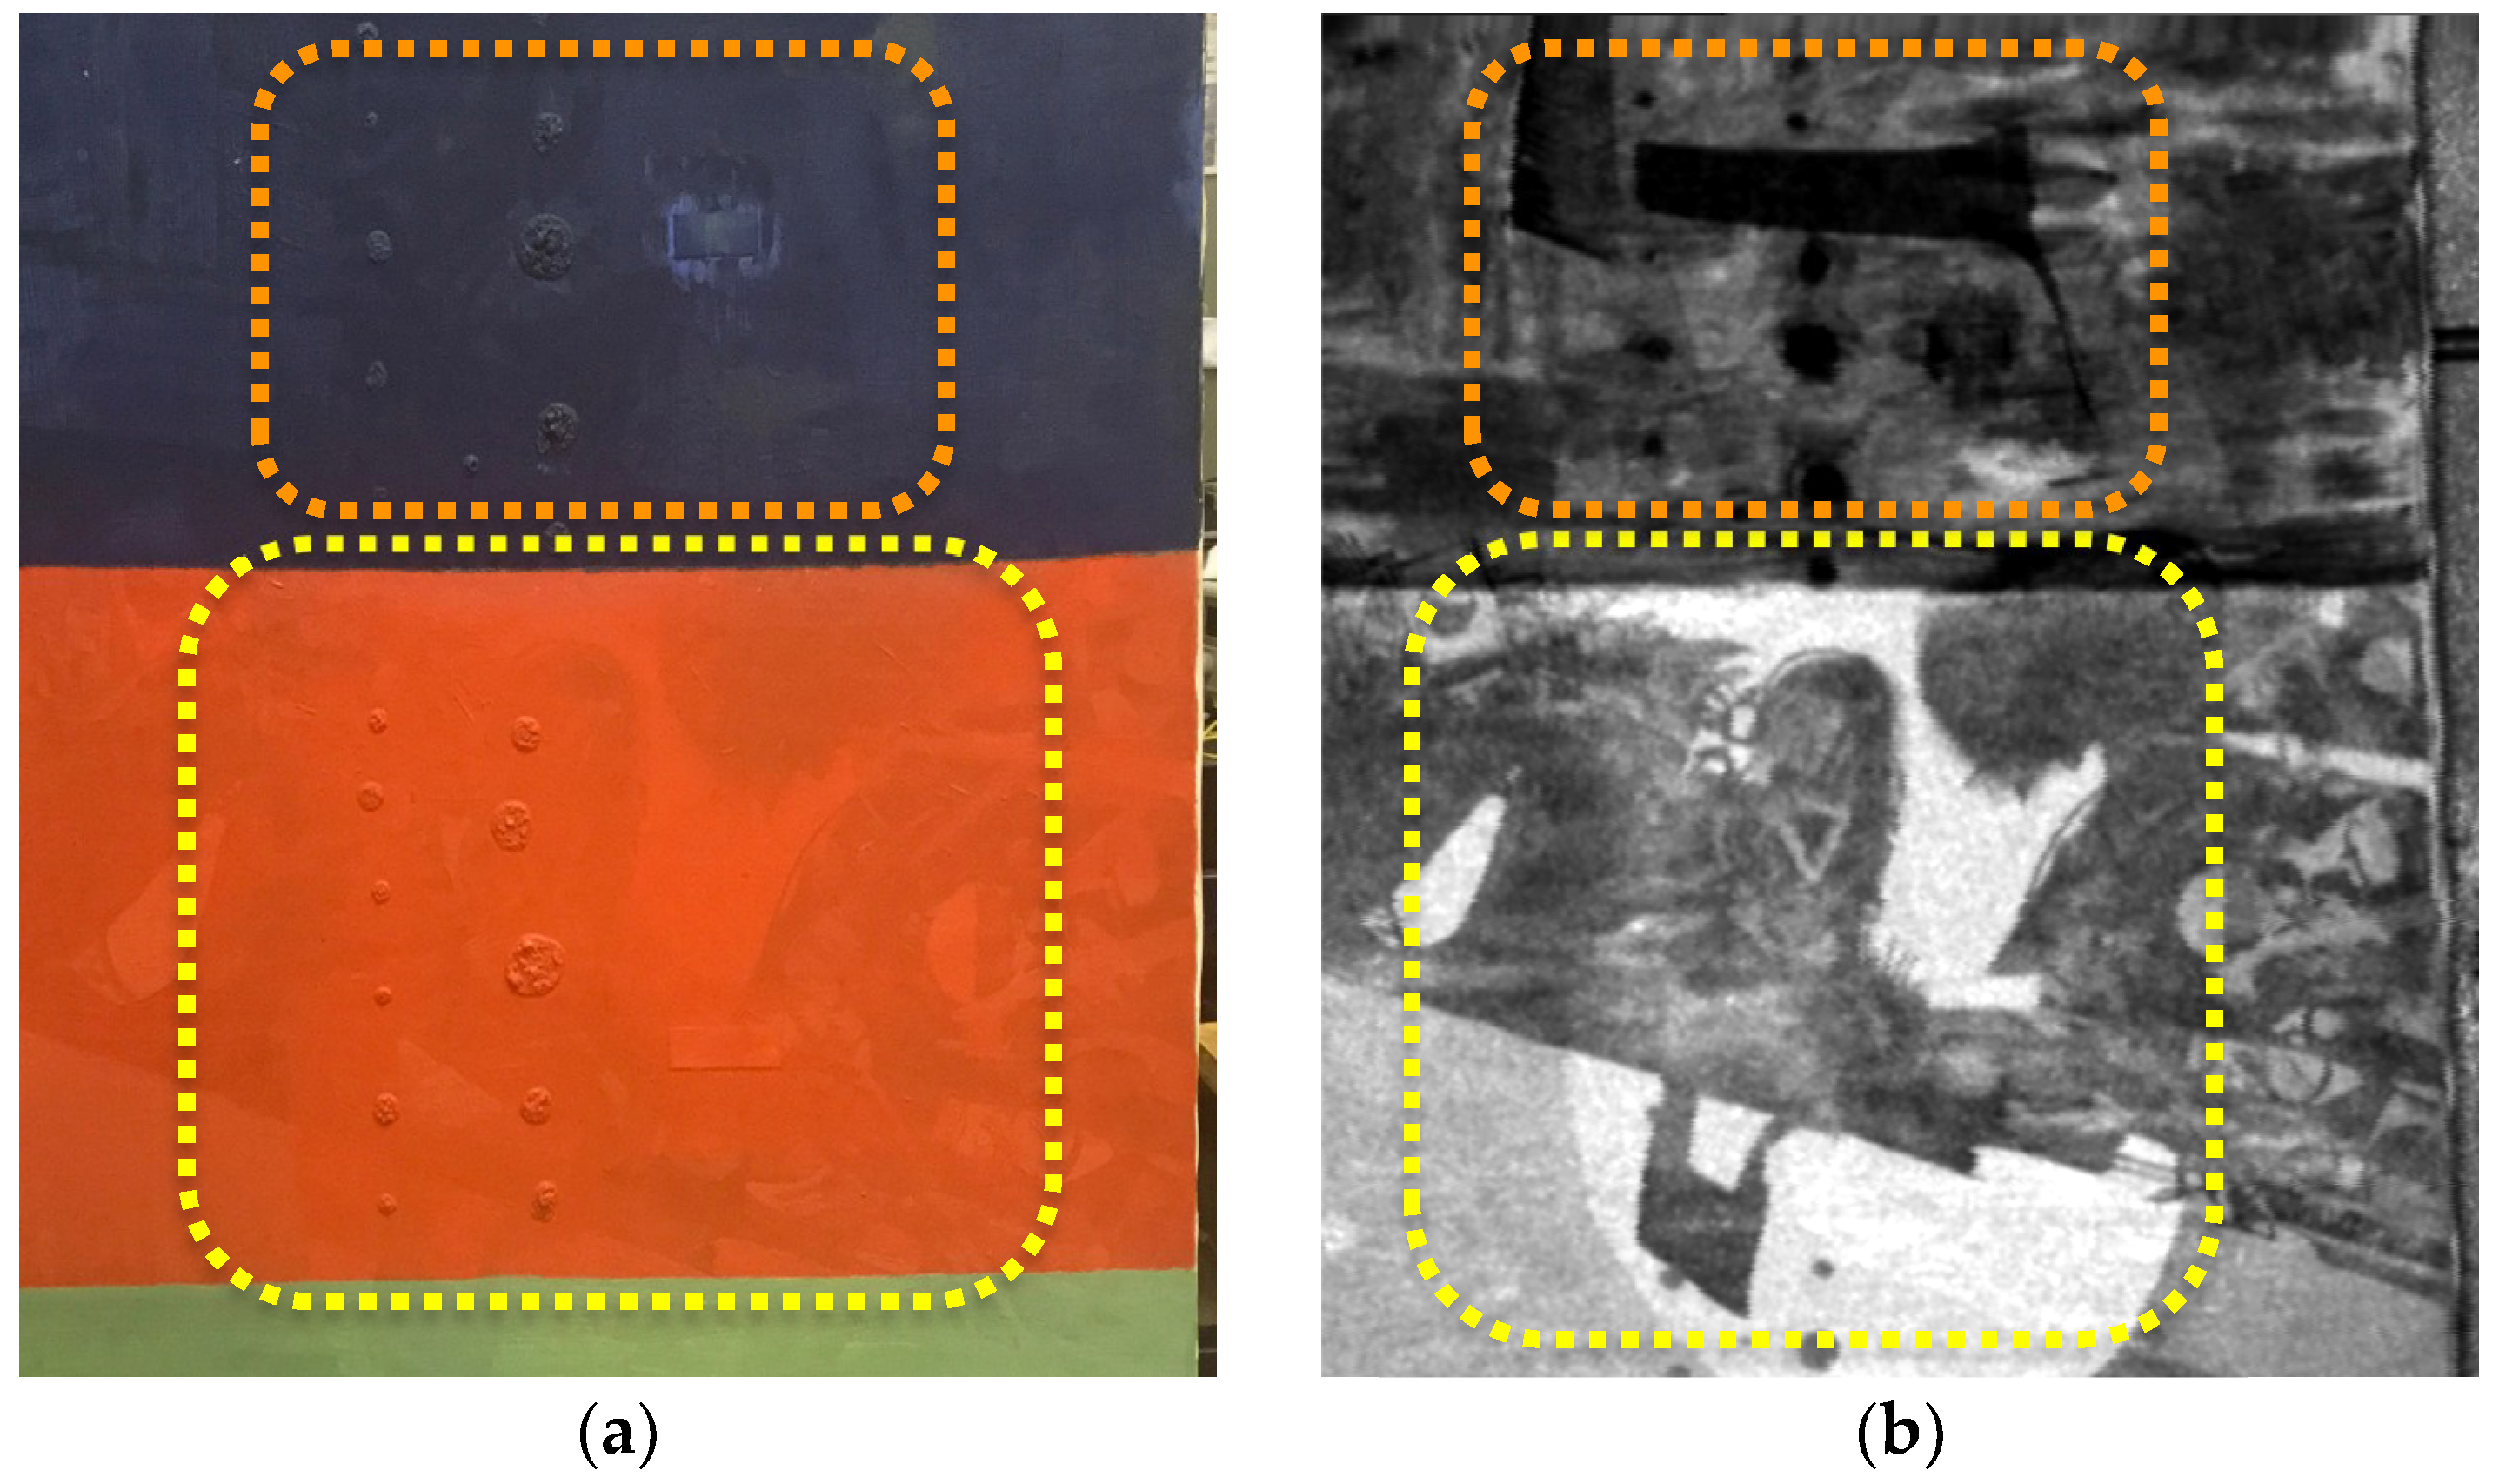
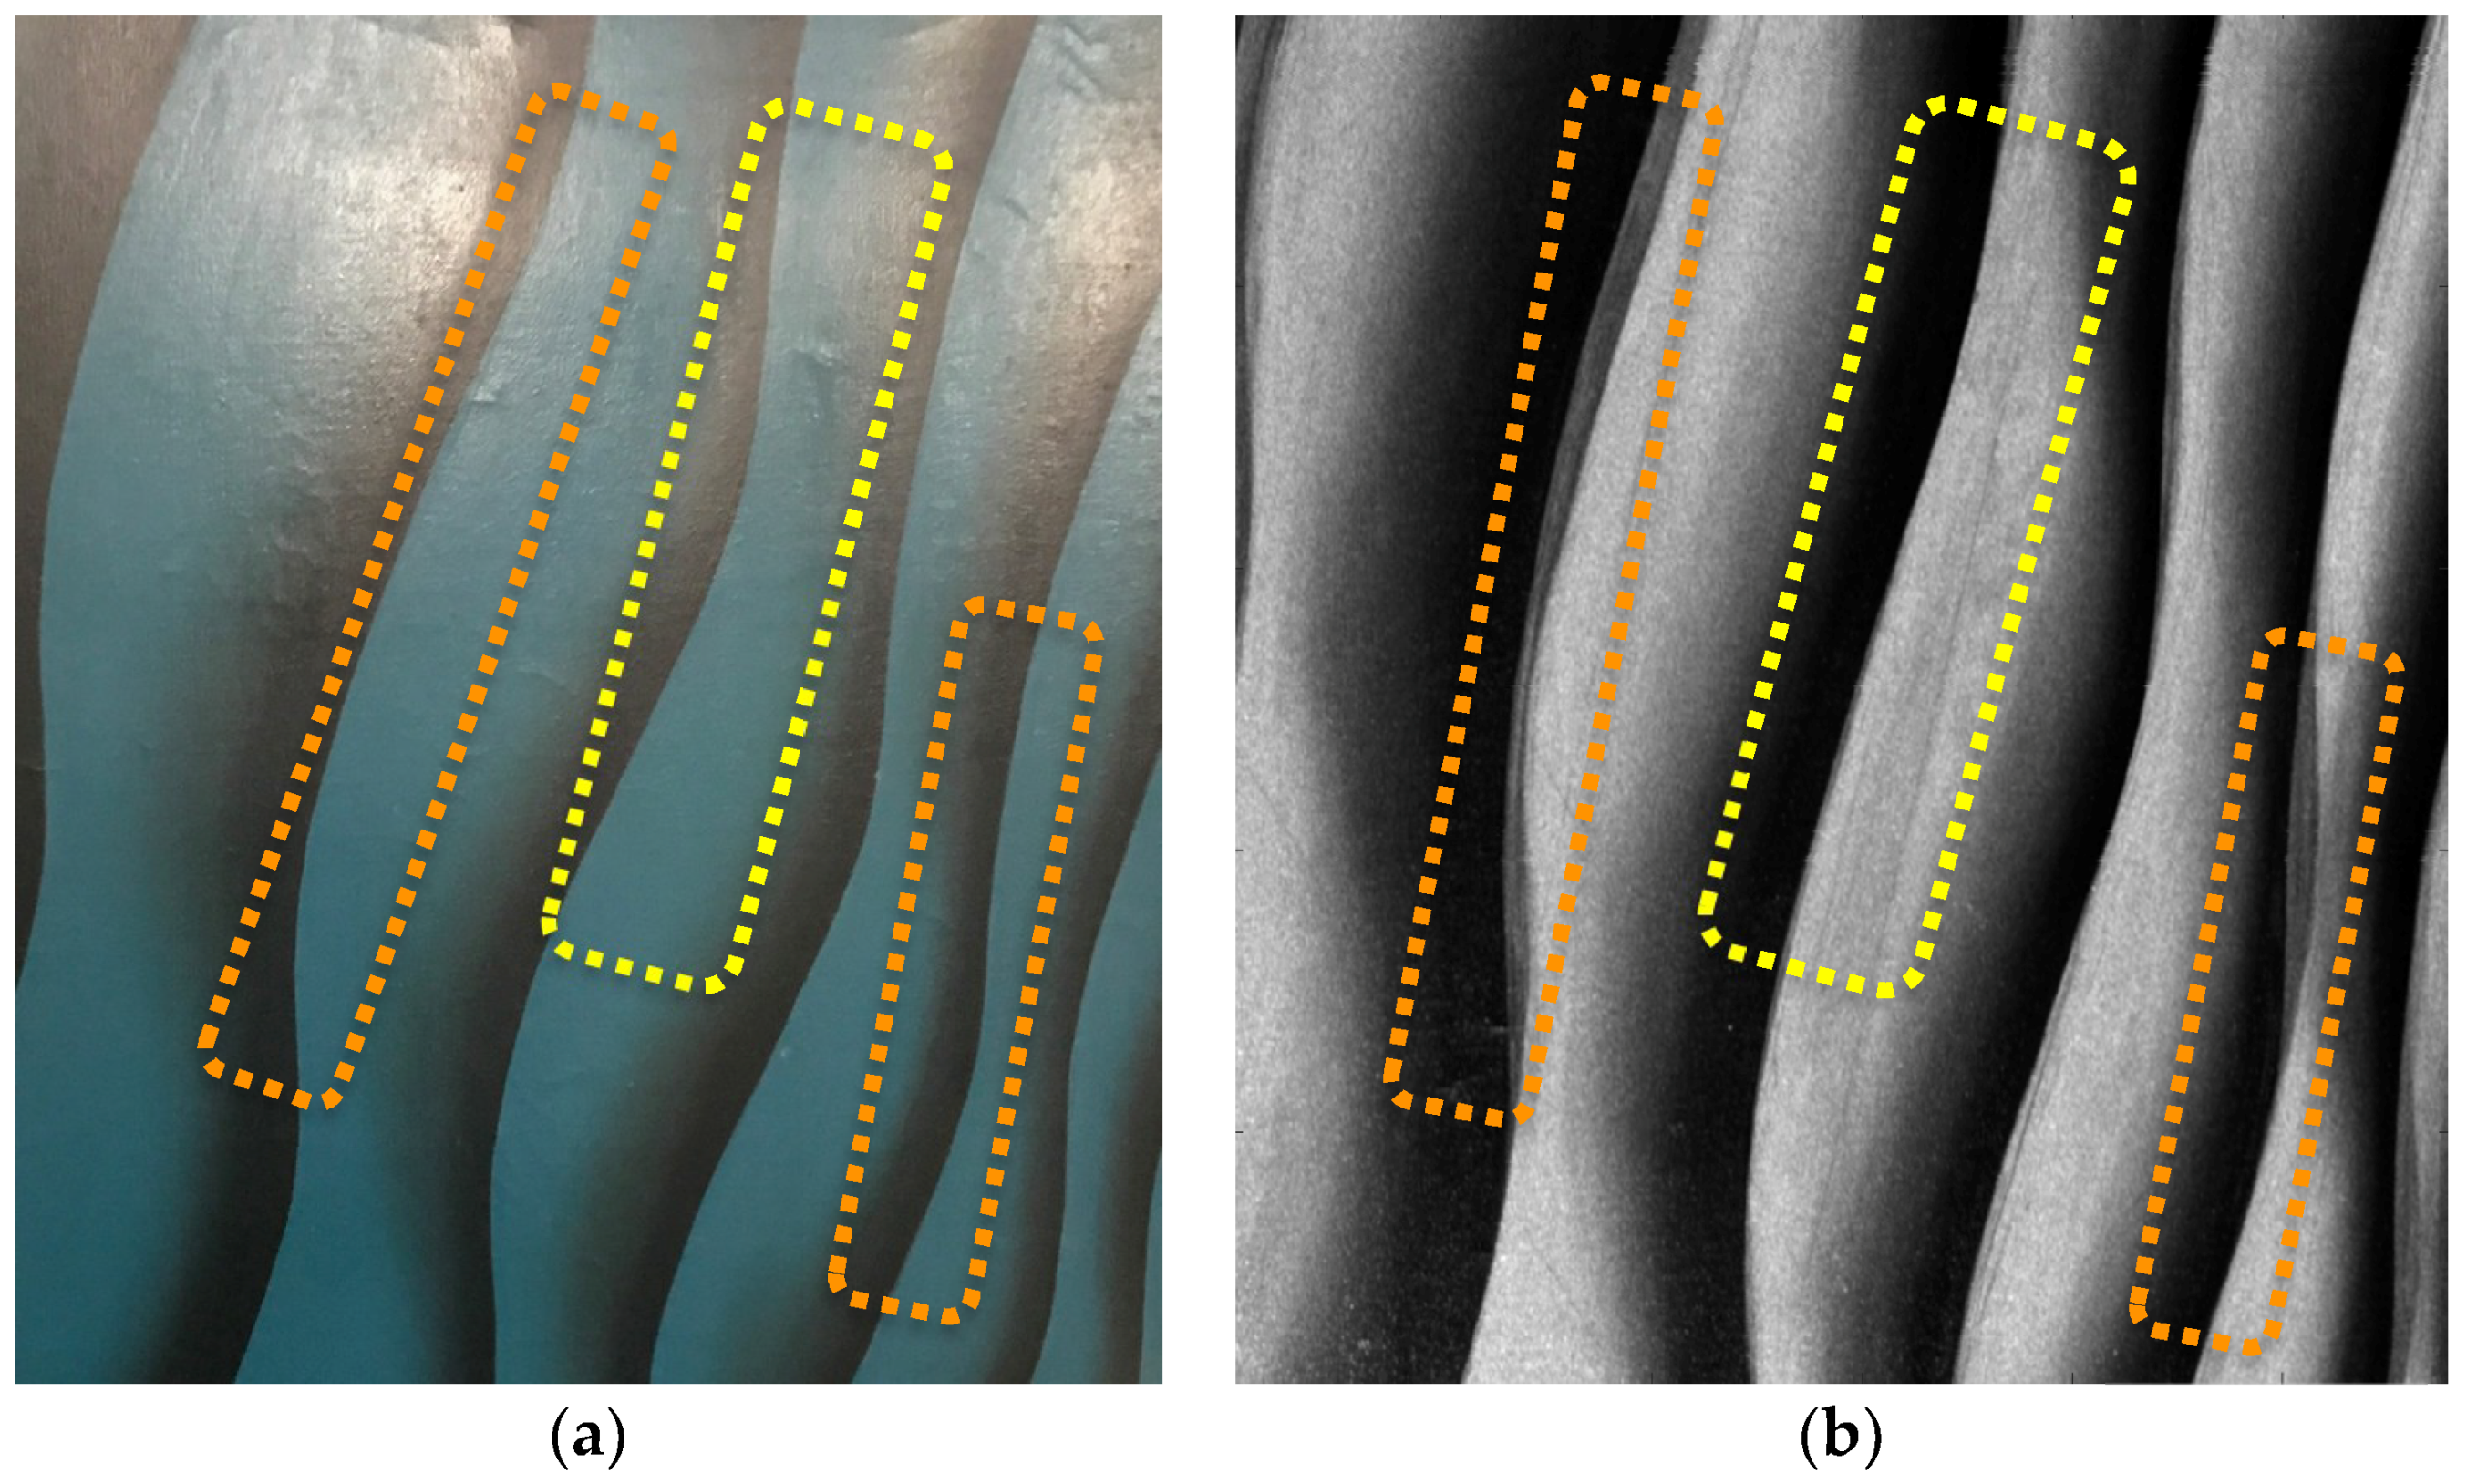
4.2. Infrared Imaging

The laboratory test on a three-color canvas has shown interesting details of the drawings underlying the superficial painting, barely visible to the naked eye (Figure 15a). Indeed, the IR image has clearly revealed different elements under the three watercolor bands (Figure 15b), providing an efficient means of investigation for preparatory drawings.
The scan on the acrylic canvas (Figure 16a) has provided details on the painting technique, revealing how the nuances of the black waves have been realized before the definitive and visible drawing (Figure 16b).

5. Conclusions

Image techniques and 3D modelling are nowadays widely employed in the CH Conservation Science, which disclose a modern, non-invasive and engaging analysis tool. Several commercial systems are available on the market for 3D modelling, but they often require the complementarity with other techniques with limitation in terms of illumination conditions and spatial resolution. Likewise, close-range imaging, such as filter-wheel cameras, has distance and object size constraints. In this paper, two prototypal laser scanners using n-laser stimuli have been presented in order to demonstrate the quality, efficacy and the versatility of this methodology in this application field as a unique means for 3D digitalization and IR layering inspections. The color laser scanner, called RGB-ITR, has been used for 3D modelling and in-depth analyses from high-quality image enhancement, proving to handle critical surrounding conditions greatly, such as high humidity and great lighting, and irregular material, such as wooden anthropoid sarcophagi. The IR system, called IT-ITR, has been tested on laboratory samples, attesting validity for inspection under layers of different painting materials (acrylic and watercolor) at up to 10 m of distance from the system, contrary to close-range instruments. The results have shown the potentialities of the two laser scanners and their versatility in terms of environmental circumstances and materials, two important but unstable factors in the CH field. The ITR images can be used for conservation purposes for their high detailing and re-usability over time. Future plans include the implementation of laser sources, even using the same scanner, in order to achieve a multispectral scanner as a multipurpose system for applications in a wider range of materials and not exclusively limited to CH. The research group is working on a new version of this scanner, which will host 7 wavelengths—one in the near ultraviolet spectrum (380 nm), four in the visible spectrum (441, 530, 580, 660 nm) and two in the infrared (800, 1500 nm) spectrum—with the aim to develop a multispectral (up to several ten meters) high-density point cloud remote sensor

Author Contributions

Conceptualization, Methodology and Validation, M.G., M.F.d.C., M.F., A.D. and S.C.; Software, M.G.; Formal Analysis, M.G., A.D. and S.C.; Investigation, M.G., S.C., M.C., M.F.d.C., M.F. and A.D.; Data Curation, M.G., S.C. and A.D.; Writing—Original Draft Preparation, S.C.; Writing—Review & Editing, M.G. and M.F.d.C.

Funding

Part of the research presented in this paper was performed within CO.B.RA. project and funded by regional grant (lr13/2008 project n. 1031).

Acknowledgments

The authors sincerely thank to everyone who have contributed to the works reported in this paper, from the responsible managers to technicians, restorers, curators, archaeologist and collaborators. A particular appreciation goes to: Roberta Fantoni and Antonio Palucci as chiefs of the ENEA Division and Laboratory, Ersilia Maria Loreti as Director of the Walls Museum, l’Opera del Duomo di Orvieto as the association for the conservation of Orvieto Cathedral, Barbara Mazzei as archaeologist responsible for the Priscilla Catacombs; Emiliano Abrusca, Emiliano Antonelli and Barbara Bassignano (CROMA s.r.l.) as restorers working on the Egyptian sarcophagi.

Conflicts of Interest

The authors declare no conflict of interest.

References

  1. Anno Europeo del Patrimonio Culturale 2018. Available online: https://europa.eu/cultural-heritage/about_it (accessed on June 2018).
  2. Stylianidis, E.; Remondino, F. 3D Recording, Documentation and Management of Cultural Heritage; Whittles Publishing: Dunbeath, UK, 2016; pp. 1–13. [Google Scholar]
  3. Fioravanti, M.; Mecca, S. The Safeguard of Cultural Heritage. A Challenge from the Past for the Europe of Tomorrow; Firenze University Press: Florence, Italy, 2012; Volume 1. [Google Scholar]
  4. Whitmore, P.M.; Bernstein, J.; Khandekar, N.; Carlson, J.; Koestler, R.; Wheeler, G.S.; National Science Foundation (U.S.). Division of Human Resource Development; Andrew W. Mellon Foundation. Conservation Science Research: Activities, Needs, and Funding Opportunities; National Science Foundation: Arlington, VA, USA, 2005.
  5. Georgopoulos, A.; Stathopoulou, E.K. Data Acquisition for 3D Geometric Recording: State of the Art and Recent Innovations; Springer: Berlin, Germany, 2017. [Google Scholar]
  6. Hess, M.; Robson, S. 3D colour imaging for cultural heritage artefacts. Int. Arch. Photogramm. Remote Sens. Spat. Inf. Sci. 2010, 38, 288–292. [Google Scholar]
  7. Remondino, F.; Rizzi, A.; Jimenez, B.; Agugiaro, G.; Baratti, G.; De Amicis, R. The Etruscans in 3D: From Space to Underground Underwater Camera Calibration View Project iTour-Intelligent Transport System for Optimized URban Trips View Project the Etruscans in 3D: From Space to Underground; Czech Technical University in Prague: Praha, Czechia, 2011. [Google Scholar]
  8. Remondino, F. Image-based 3D modelling: A review. Photogramm. Rec. 2006, 21, 269–291. [Google Scholar] [CrossRef]
  9. Boehler, W.; Marbs, A. 3D Scanning and Photogrammetry for Heritage Recording: A Comparison. In Proceedings of the 12th International Conference on Geoinformatics, Gävle, Sweden, 7–9 June 2004; pp. 7–9. [Google Scholar]
  10. Rizzi, A.; Voltolini, F.; Remondino, F.; Girardi, S. Optical Measurement Techniques for the Digital Preservation, Documentation and Analysis of Cultural Heritage. Int. Arch. Photogramm. Remote Sens. Spat. Inf. Sci. 2007, 36, 1–6. [Google Scholar]
  11. Blais, F. Review of 20 years of range sensor development. J. Electron. Imaging 2004, 13, 231. [Google Scholar] [CrossRef] [Green Version]
  12. Santos, P.; Ritz, M.; Fuhrmann, C.; Fellner, D. 3D mass digitization: A milestone for archeological documentation. Virtual Archaeol. Rev. 2017, 8, 1. [Google Scholar] [CrossRef]
  13. Bosché, F.; Forster, A.; Valero, E. 3D Surveying Technologies and Applications: Point Clouds and Beyond Historic Digital Survey II-Project Extension: Digital Data Acquisition and Processing for Historic Building Fabric Condition Survey; Interpretation, Machine Learning and Scan to BIM View; Heriot-Watt University: Edinburgh, UK, 2015. [Google Scholar]
  14. Rizzi, A.; Voltolini, F.; Girardi, S.; Gonzo, L.; Remondino, F.; Kessler-irst, F.B. Digital Preservation, Documentation and Analysis of Paintings, Monuments and Large Cultural Heritage with Infrared Technology, Digital Cameras and Range Sensors. In Proceedings of the XXI International CIPA Symposium, Athens, Greece, 1–6 October 2007. [Google Scholar]
  15. Guarnieri, A.; Pirotti, F.; Pontin, M.; Vettore, A. Combined 3D Surveying Techniques for Structural Analysis Applications; ISPRS Archives: Mestre-Venice, Italy, 2005; Volume 36. [Google Scholar]
  16. Pieraccini, M.; Guidi, G.; Atzeni, C. 3D digitizing of cultural heritage. J. Cult. Herit. 2001, 2, 63–70. [Google Scholar] [CrossRef]
  17. Micoli, L.; Guidi, G.; Angheleddu, D.; Russo, M. A multidisciplinary approach to 3D survey and reconstruction of historical buildings. In Proceedings of 2013 Digital Heritage International Congress (Federating 19th Int’l VSMM, 10th Eurographics GCH, & 2nd UNESCO Memory of the World Conferences; Plus Special Sessions from CAA, Arqueológica 2.0, Space2Place, ICOMOS ICIP & CIPA, EU Projects, et al.). UNESCO/IEEE/EG; IEEE: Marseille, France, 2013. [Google Scholar]
  18. Remondino, F. Heritage recording and 3D modeling with photogrammetry and 3D scanning. Remote Sens. 2011, 3, 1104–1138. [Google Scholar] [CrossRef] [Green Version]
  19. Hain, M.; Bartl, J.; Jacko, V. Multispectral analysis of cultural heritage artefacts. Meas. Sci. Rev. 2003, 3, 9–12. [Google Scholar]
  20. Del Pozo, S.; Rodríguez-Gonzálvez, P.; Sánchez-Aparicio, L.J.; Muñoz-Nieto, A. Multispectral Imaging in Cultural Heritage Conservation. ISPRS Int. Arch. Photogramm. Remote Sens. Spat. Inf. Sci. 2017, XLII-2/W5, 155–162. [Google Scholar] [CrossRef]
  21. Fontana, R.; Fovo, A.D.; Striova, J.; Pezzati, L.; Pampaloni, E.; Raffaelli, M.; Barucci, M. Application of non-invasive optical monitoring methodologies to follow and record painting cleaning processes. Appl. Phys. A Mater. Sci. Process. 2015, 121, 957–966. [Google Scholar] [CrossRef]
  22. Liang, H.; Saunders, D.; Cupitt, J. A new multispectral imaging system for examining paintings. J. Imaging Sci. Technol. 2005, 49, 551–562. [Google Scholar]
  23. Payne, E.M. Imaging Techniques in Conservation. J. Conserv. Mus. Stud. 2013, 10, 17–29. [Google Scholar] [CrossRef]
  24. Siltanen, S.; Robson, S.; MacDonald, L.; Garside, D.; Evans, R. Spectral and 3D cultural heritage documentation using a modified camera. ISPRS Int. Arch. Photogramm. Remote Sens. Spat. Inf. Sci. 2018, XLII-2, 1183–1190. [Google Scholar]
  25. Cosentino, A. Infrared Technical Photography for Art. E-Preserv. Sci. 2016, 13, 1–6. [Google Scholar]
  26. Cosentino, A. Multispectral imaging system using 12 interference filters for mapping pigments. Conserv. Patrim. 2015, 21, 25–38. [Google Scholar] [CrossRef] [Green Version]
  27. Vitorino, T.; Casini, A.; Cucci, C.; Marcello, P.; Stefani, L. When It Is Not Only About Color: The Importance of Hyperspectral Imaging Applied to the Investigation of Paintings. In Proceedings of the 6th International Workshop, CCIW 2017, Milan, Italy, 29–31 March 2017. [Google Scholar]
  28. De Collibus, M.F.; Fornetti, G.; Guarneri, M.; Paglia, E.; Poggi, C.; Ricci, R. ITR: An AM laser range finding system for 3D imaging and multi-sensor data integration. In Proceedings of the 1st International Conference on Sensing Technology, Palmerston North, New Zealand, 21–23 November 2005; pp. 641–646. [Google Scholar]
  29. Fantoni, R.; Almaviva, S.; Caneve, L.; Caponero, M.; Colao, F.; de Collibus, M.F.; Fiorani, L.; Fornetti, G.; Francucci, M.; Guarneri, M.; et al. Laser scanners for remote diagnostic and virtual fruition of cultural heritage. Opt. Quantum Electron. 2017, 49, 120. [Google Scholar] [CrossRef]
  30. Caneve, L.; Guarneri, M.; Lai, A.; Spizzichino, V.; Ceccarelli, S.; Mazzei, B. Non-Destructive Laser Based Techniques for Biodegradation Analysis in Cultural Heritage; Aipnd: Turin, Italy, 2017. [Google Scholar]
  31. Ricci, R.; de Dominicis, L.; de Collibus, M.F.; Fornetti, G. RGB-ITR: An amplitude-modulated 3D colour laser scanner for cultural heritage applications. In Proceedings of the Laser Conservation Artworks VIII International Conference, Sibiu, Romania, 21–15 September 2009; pp. 191–197. [Google Scholar]
  32. Poujouly, S.P.; Journet, B. A twofold modulation frequency laser range finder. J. Opt. A Pure Appl. Opt. 2002, 4, S356–S363. [Google Scholar] [CrossRef]
  33. Nitzan, D.; Brain, A.E.; Duda, R.O. The Measurement and Use of Registered Reflectance and Range Data in Scene Analysis. Proc. IEEE 1977, 65, 206–220. [Google Scholar] [CrossRef]
  34. Guarneri, M.; De Dominicis, L.; De Collibus, M.F.; Fornetti, G.; Francucci, M.; Nuvoli, M.; Danielis, A.; Mencattini, A. Imaging topological radar technology as a general purpose instrument for remote colorimetric assessment, structural security, cataloguing, and dissemination. Stud. Conserv. 2015, 60, S134–S142. [Google Scholar] [CrossRef]
  35. Danielis, A.; Guarneri, M.; Francucci, M.; de Collibus, M.F.; Fornetti, G.; Mencattini, A. A Quadratic Model with Nonpolynomial Terms for Remote Colorimetric Calibration of 3D Laser Scanner Data Based on Piecewise Cubic Hermite Polynomials. Math. Probl. Eng. 2015, 2015, 606948. [Google Scholar] [CrossRef]
  36. Ceccarelli, M.; Cigola, M. Colorimetric Study on Optical Data from 3D Laser Scanner Prototype for Cultural Heritage Applications. In New Activities for Cultural Heritage; Springer: Berlin, Germany, 2017; pp. 190–199. [Google Scholar]
  37. Oleari, C. Misurare il Colore; Hoepli: Milano, Italy, 2008. [Google Scholar]
  38. Zanchi, M. Signorelli; Dossier d’; Giunti: Firenze, Italy, 2016. [Google Scholar]
  39. Vasari, G. Le Vite Dei Più Eccellenti Pittori, Scultori e Architetti; Newton Compton Ed.: Roma, Italy, 2016; pp. 550–567. [Google Scholar]
  40. Grussenmeyer, P.; Landes, T.; Boegtle, T.; Ringle, K. Comparison methods of terrestrial laser scanning, photogrammetry and tacheometry data for recording of cultural heritage buildings. ISPRS Congr. 2008, 37, 213–218. [Google Scholar]
  41. Catacombe di Priscilla. Available online: http://www.catacombepriscilla.com/ (accessed on July 2018).
  42. Scatigno, C.; Gaudenzi, S.; Sammartino, M.P.; Visco, G. A microclimate study on hypogea environments of ancient roman building. Sci. Total Environ. 2016, 566–567, 298–305. [Google Scholar] [CrossRef] [PubMed]
  43. Zammit, G.; Sánchez-Moral, S.; Albertano, P. Bacterially mediated mineralisation processes lead to biodeterioration of artworks in Maltese catacombs. Sci. Total Environ. 2011, 409, 2773–2782. [Google Scholar] [CrossRef] [PubMed]
  44. Systems Standford Research, “About Lock-In Amplifiers”; Application Note, No. 408; Stanford Research Systems, Inc.: Sunnyvale, CA, USA, 2001; pp. 1–9.
  45. Montesanti, A. Le Mura Aureliane. Storia Della Cinta Difensiva di Roma. Available online: http://www.instoria.it/home/mura_aureliane_I.htm (accessed on 5 November 2018).
  46. Cardilli, L.; Coarelli, F.; Pietrangeli, C.; Sartorio, G.P. Mura e Porte di Roma Antica Roma; Editore Colombo: Roma, Italy, 1995. (In Italian) [Google Scholar]
  47. Thorlabs. Laser Viewing Cards; Thorlabs: Newton, NJ, USA, 2014; p. 19180. [Google Scholar]
  48. Guarneri, M.; Ceccarelli, S.; Ciaffi, M. Multi-wavelengths 3D laser scanner for investigation and reconstruction of 19th century charcoal inscriptions. In Proceedings of the IMEKO International Conference on Metrology for Archaeology and Cultural Heritage, Lecce, Italy, 23–25 October 2017; pp. 161–165. [Google Scholar]
Figure 1. Scheme of the ITR technology: by the use of custom software, the scanning process is remotely controlled by a laptop connected to the electronic components. The laser beam (infrared (IR) or in the visible range-RGB) is generated by laser sources, modulated and amplified by lock-in techniques. Through optical fibers, the lasers are carried inside the optical head, where a system of lenses collimates and focalizes the ray on the center of a movable scanning mirror, which drives the incident laser beam on the surface’s object and collects the backscattered beam, elaborated with custom software.
Jimaging 04 00130 g001
Figure 2. RGB-ITR (Red Green Blue-Imaging Topological Radar) scanner prototype in a laboratory environment, set up with the optical head on a tripod and the electronic components in the tower configuration.
Jimaging 04 00130 g002
Figure 3. IR-ITR scanner prototype: (a) the optical head and the electronic elements in the background; (b) a detail of the launching fiber, directly connected to the IR laser source, and the IR detector.
Jimaging 04 00130 g003
Figure 4. The Saint Brizio Chapel in the Orvieto Cathedral (Viterbo, Italy). (a) Picture of the Chapel from the outside shot with a Canon camera, (b) the RGB-ITR system working inside the Chapel (Photo: S. Ceccarelli).
Jimaging 04 00130 g004
Figure 5. The Greek Chapel inside the Priscilla Catacombs in Rome (Italy): photographic images of the RGB-ITR system during the scan (Photo: S. Ceccarelli).
Jimaging 04 00130 g005
Figure 6. (a) Saint Sebastian monumental gate, which is part of the Aurelian Wall and the location of the Walls Museum in Rome (Italy). The red dashed square indicates the digitalized tower room; (b) detail of the interiors of the right tower with the RGB-ITR in working position. (Photo: S. Ceccarelli).
Jimaging 04 00130 g006
Figure 7. Digitalization of Egyptian wooden sarcophagus of Peftjauyauyaset: (a) the artefact in one of the three positions during the scan. The decorations are clearly evident both internally and externally, where also incisions characterize the artefact; (b) acquisition conditions with the RGB-ITR laser scanner. (Photo: S. Ceccarelli).
Jimaging 04 00130 g007
Figure 8. Laboratory test with the IR-ITR scanner on painted samples: (a) canvas painted with three watercolor bands. The presence of drawings under the pictorial film is evident, but not clearly discernible; (b) acrylic painting on canvas, where the shading technique is not immediately evident; (c) laboratory conditions for tests on the watercolor canvas placed at a 10 m distance from the IR-ITR scanner. (Photo: S. Ceccarelli).
Jimaging 04 00130 g008
Figure 9. The San Brizio Chapel: photograph acquired with a Canon digital camera. The picture is highly illuminated due to the presence of three wide windows inside the chapel. (Photo: S. Ceccarelli).
Jimaging 04 00130 g009
Figure 10. Procedure for the registration of textures by picking similar points for the elaboration of the 3D model of the San Brizio Chapel. (Elaboration carried out by ENEA team with the custom software itrAnalyzer).
Jimaging 04 00130 g010
Figure 11. 3D model of the San Brizio Chapel obtained with the RGB-ITR scanner. The colors are uniform without shadows, unlike photographs (Figure 9). (Elaboration carried out by ENEA team with the custom software itrAnalyzer).
Jimaging 04 00130 g011
Figure 12. 3D partial model of the Greek Chapel reporting truthful colors. (Elaboration carried out by ENEA team with the custom software itrAnalyzer).
Jimaging 04 00130 g012
Figure 13. Tower room of the Saint Sebastian Gate: (a) image of part of the 3D model of the room; (b) detail of background removal elaboration for the reconstruction of inscriptions’ contents [48]. (Elaboration carried out by ENEA team with the custom software itrAnalyzer).
Jimaging 04 00130 g013
Figure 14. Egyptian sarcophagus: (a) photographic image of the inferior part of the anthropomorphous sarcophagus (Photo: S. Ceccarelli); (b) part of the 3D model of the ancient wooden artefact achieved with the RGB-ITR system (Elaboration carried out by ENEA team with the custom software itrAnalyzer).
Jimaging 04 00130 g014
Figure 15. IR-ITR experiment: (a) photographic image of a watercolor canvas (Photo: S. Ceccarelli); (b) IR-ITR image where the underdrawings’ details are clearly visible (dashed shapes indicate the underdrawings elements in correspondence of the visible image), (Elaboration carried out by ENEA team with the custom software itrAnalyzer).
Jimaging 04 00130 g015
Figure 16. IR-ITR experiment: (a) photographic image of an acrylic-colored canvas (Photo: S. Ceccarelli); (b) IR-ITR image where the lines and shades are different from the visible image, revealing changes from the original drawing and the realization technique (dashed shapes indicate the different elements in relation to the visible image), (Elaboration carried out by ENEA team with the custom software itrAnalyzer).
Jimaging 04 00130 g016
Table 1. Scanning parameters and critical issues of the case studies considered in this work.
TargetAcquisition TimeMinimum Angular StepDistance Target/SystemCritical Issues
The San Brizio Chapel~26 h (day and night)0.14 mrad4 ÷ 9 mExcessive brightness
The Greek Chapel~190 h (day and night)0.07 ÷ 0.035 mrad3 ÷ 6 mHigh humidity and reduced working space
The Saint Sebastian Gate~130 h (day and night)0.14 ÷ 0.07 mrad5 ÷ 11 mExcessive brightness and small inscriptions
Egyptian sarcophagus~70 h (day and night)0.07 mradLess than 3 mIrregular surface and reduced distance
Watercolor canvas1 h and 45 min0.035 mrad10 mUnknown layering and watercolor
Acrylics canvas40 min0.035 mrad5 mUnknown layering and acrylic colors

