Article

Automated Curved and Multiplanar Reformation for Screening of the Proximal Coronary Arteries in MR Angiography

1
Pattern Recognition Lab, Friedrich-Alexander-Universität Erlangen-Nürnberg, 91058 Erlangen, Germany
2
Siemens Healthcare GmbH, Magnetic Resonance, 91052 Erlangen, Germany
*
Author to whom correspondence should be addressed.
Bernhard Stimpel is also with Department of Neuroradiology, University Clinics Erlangen, 91054 Erlangen, Germany.
Mathias Unberath is now with Computer Aided Medical Procedures, John Hopkins University, Baltimore, MD 21218, USA.
J. Imaging 2018, 4(11), 124; https://doi.org/10.3390/jimaging4110124
Submission received: 5 September 2018 / Revised: 15 October 2018 / Accepted: 18 October 2018 / Published: 23 October 2018

Abstract

:
Congenital anomalies of the coronary ostia can lead to sudden death. A screening solution would be useful to prevent adverse outcomes for the affected individuals. To be considered for integration into clinical routine, such a procedure must meet strict constraints in terms of invasiveness, time and user interaction. Imaging must be fast and seamlessly integrable into the clinical process. Non-contrast enhanced coronary magnetic resonance angiography (MRA) is well suited for this. Furthermore, planar reformations proved effective to reduce the acquired volumetric datasets to 2D images. These usually require time consuming user interaction, though. To fulfill the aforementioned challenges, we present a fully automated solution for imaging and reformatting of the proximal coronary arteries which enables rapid screening of these. The proposed pipeline consists of: (I) highly accelerated single breath-hold MRA data acquisition, (II) coronary ostia detection and vessel centerline extraction, and (III) curved planar reformation of the proximal coronary arteries, as well as multiplanar reformation of the coronary ostia. The procedure proved robust and effective in ten volunteer data sets. Imaging of the proximal coronary arteries took 24 ± 5 s and was successful within one breath-hold for all patients. The extracted centerlines achieve an overlap of 0.76 ± 0.18 compared to the reference standard and the average distance of the centerline points from the spherical surface for reformation was 1.1 ± 0.51 mm. The promising results encourage further experiments on patient data, particularly in coronary ostia anomaly screening.

1. Introduction

Congenital coronary ostia anomalies are associated with multiple indications up to sudden death [1,2,3,4]. Usually, the coronary arteries exit the ascending aorta at a position just above the aortic valve. Branching of one of these arteries at a higher position on the aorta, however, can cause serious problems [2,3] and is known as high take-off anomaly. These problems can also arise if the take-off angle of the coronary artery w.r.t. the aortic wall is less than 45 . This is referred to as acute angle take-off [4]. Naturally, anatomical anomalies are not limited to these cases, but come in many different manifestations. Due to the potentially lethal outcome, screening would be highly valuable for the affected subjects.
Three major steps are needed for a fast and efficient screening workflow of the coronary arteries and ostia: fast imaging, automated ostia detection, and providing a compact representation to allow for fast assessment. The current gold standard for imaging of the coronary arteries is invasive angiography, a 2D imaging technique. Yet, less invasive 3D imaging techniques such as computed tomography angiography (CTA) exist [5]. Unfortunately, the typical downsides of X-ray applications, such as ionizing radiation and the need for contrast agent, discourage its usage for screening in the absence of a clinical indication. The excellent soft-tissue contrast without the aforementioned drawbacks makes coronary magnetic resonance angiography (CMRA) a promising alternative for screening purposes [6]. Free-breathing 3D whole-heart acquisitions cause minimal discomfort to the patient and exhibit very good image quality. However, such protocols require long acquisition times. Considering the low prevalence of coronary artery anomalies [7], reducing the time spent for data acquisition is a key factor. In addition to the imaging process, visual assessment of the acquired data by a radiologist is essential. While the resulting volumetric representations contain large amounts of information, thorough reading and interpretation can be time consuming. To minimize the time spent for this task, it is important to present the image data in a suitable way. To compress the information, curved planar (CPR) and multiplanar (MPR) reformations are commonly used to display all structures of interest in 2D images [8,9,10]. Usually, these reformations are performed manually on a clinical workstation, which is a time consuming procedure when done for a large number of examinations.
To meet the strict time constraints for a screening application, we present a highly accelerated, non-contrast enhanced CMRA imaging protocol in order to acquire the proximal part of the coronary arteries within the time frame of a single breath-hold. Furthermore, an automated approach for detecting the coronary ostia and extraction of the proximal coronary arteries is proposed. In a last step, CPR and MPR of the coronary ostia and arteries are computed based on these prior results. In combination, this allows for a rapid and automated provision of data in an easy-to-assess format, such that this can be appended to any routine examination with negligible additional time expenditure.

2. Related Work

2.1. Acquisition Protocol

In cardiac imaging, two distinct types of motion need to be compensated for: respiratory and cardiac motion [11]. In free-breathing MRI, the problem of respiratory motion is addressed by using navigators to partition the acquired data into different respiratory phases or gating for one consistent respiratory phase. However, this comes at the expense of scanning times of several minutes. In contrast, breath-hold acquisitions are an efficient way for fast CMRA data acquisition by excluding the requirement for respiratory motion compensation [12]. To capture a sufficient amount of data within the time frame of one breath-hold, fast data acquisition is mandatory. Parallel Imaging [13,14] and Compressed Sensing [15] proved to allow for great acceleration of the data acquisition. In the context of Compressed Sensing, numerous k-space subsampling strategies were proposed, e.g., the non-cartesian Radial Phase Encoding [16] or incoherent cartesian sampling of the phase encoding plane [17]. While Compressed Sensing enables higher acceleration than conventional Parallel Imaging, acquiring sufficient data with the required level of image quality in one breath-hold is a challenging task. In [18] a single breath-hold acquisition protocol for imaging of the coronary arteries was presented. The average acquisition time in their approach was 37.7 ± 5.2 s which reveals potential for improvement. Additionally, in [19] targeted 2D oblique acquisition of the coronary arteries was performed in a breath-hold approach. While this renders CPR obsolete, MPR cannot be performed based on this data. Furthermore, this comes with additional planning effort for correct slice selection.

2.2. Curved and Multiplanar Reformation

The high-take-off anomaly is determined by the offset in superior-inferior direction between both coronary ostia, whereas an acute angle take-off can be assessed by inspecting the angle of the coronary arteries w.r.t. the aortic wall. Therefore, different reformations are needed for the assessment. The height difference can be visualized by two cross-sections parallel to the aorta’s centerline that each contain one ostium. In contrast, regarding an acute angle take-off, the coronary arteries cannot be observed in a plane. Consequently, curved planar reformations are computed to effectively represent the 3D vascular paths [9,10]. To enable CPR, coronary artery centerlines are needed. Extraction of these and fitting of a deformable model was proposed by Etienne et al. [20]. However, their method requires manual user input to perform the reformation. In contrast, a fully automated approach would be desirable. For the automated extraction of the coronary centerlines, seed points are required. Since the coronary arteries originate from the aorta, the coronary ostia are well suited for this.

2.3. Ostia Detection

Multiple methods for automated detection of the coronary ostia were previously proposed. Highly constrained [21] or model based [22] methods are not optimal for the detection of anomalies. On the other hand, Tek et al. [23] proposed an automated ostia detection method that considers each aorta surface point as potential ostium and performs vessel centerline extraction for every candidate point. Due to the high soft-tissue contrast in MRA, the amount of image points around the aorta that are eligible for the extraction is extraordinary large. This renders their proposed approach computationally expensive in this modality. Additionally, ostia detection can be performed based on an analysis of the shape of the segmented aorta in CTA and free-breathing MRA [24,25]. Although none of the aforementioned sub-problems is unknown in literature, most of the already existing methods are tailored to the specific properties of computed tomography (CT) imaging.

3. Methods

The proposed pipeline is presented in Figure 1. It can be sub-divided into two main parts. First, data is acquired in a single breath-hold approach and, subsequently, reconstructed (A). Second, the resulting images are automatically processed to yield a compact representation for the assessment, starting with data pre-processing (B). The procedure relies on the segmentation of the aorta (C) and vessel-enhancing filtering (D) is needed to obtain estimates of the position of the arteries. Based on the enhanced images, the coronary ostia are detected (E) and used as starting points for the extraction of the coronary arteries (F). Afterwards, a curved planar reformation of the curved surface spanned by the coronary arteries is computed (H). Additionally, a multiplanar reformation that comprises the coronary ostia is generated (G).

3.1. Data Acquisition

To minimize discomfort to the patient as well as the time spent screening, we limit data acquisition to the time frame of a single breath-hold. Thereby, accelerating the acquisition is subject to a trade-off between speed and image quality. Compressed Sensing (CS) is used to keep the number of samples low while maintaining high image quality [15]. Requirements for CS are: (1) incoherent sampling; (2) a sparsifying transform; and (3) non-linear, iterative reconstruction. To satisfy (1), a cartesian spiral phyllotaxis pattern with variable density is used for data acquisition [26]. The field of view (FOV) is chosen in axial slice orientation such that it is approximately covering the proximal part of the coronary arteries. Data acquisition is done using a volume-selective, T2-prepared, ECG-triggered, fat-saturated, balanced steady-state free-precession (bSSFP) prototype imaging sequence [26] with the following parameters: TR 4.0 ms, TE 2.0 ms, FOV 310 mm × 225 mm × (79–105) mm, acquired voxel size 1.2 mm × 1.5 mm × 1.4 mm interpolated to 1.2 mm × 1.2 mm × 1.1 mm.
Upon completion of the data acquisition, image formation is performed using a compressed sensing reconstruction as described in [27]. Regarding (2), a spatio-temporal wavelet method was adopted for regularization. The CS reconstruction (3) combines the regularization term with a SENSE [14] model in an iterative, non-linear fashion. The reconstruction uses a FISTA optimization scheme [28] with 20 iterations as well as a spatial regularization factor of 0.0008. The resulting acceleration factor is 10.6. By this, the proposed data acquisition and reconstruction approach is able to drastically speed up the imaging process.

3.2. Preprocessing

Prior to the actual computations, the acquired data sets are preprocessed to assure similar image properties among all input data sets, particularly regarding their intensity ranges. This is required to promote robustness of the fully automated approach. To ensure that a good differentiation between the objects of interest is given, contrast enhancement is performed. This is done via histogram equalization as described in [29]. In addition to an adequate intensity distribution for the whole image, edge-preserving noise filtering is applied to the data sets using a bilateral filter [30]. Finally, intensity-based thresholding is applied according to prior knowledge about the intensity range of the structures of interest. This further reduces noise that is present around the structures of the heart. The whole preprocessing pipeline including exemplary images is visualized in Figure 2.

3.3. Aorta Segmentation

The first step towards coronary artery centerline extraction besides preprocessing considers the segmentation of the aorta. Since both coronary ostia are, essentially, part of the aorta’s surface, the outline of the aorta serves as an orientation structure for the whole process. To this end, an active contour driven by a level set method is applied to segment the aorta [31]. At the region the coronary ostia are lying in, the ascending aorta is well distinguishable from the surrounding structures. In contrast, especially at the origin of the aorta, i.e., the aortic valve, the intensity values of both the aortic and left ventricular blood pool are similar. The same problem is observed at the upper end of the right atrium. Therefore, to facilitate the aorta segmentation, the process is started at the center of the ascending aorta. The seed point is determined based on the localizer scan, and prior knowledge about the pathway of the aorta such that its position in superior-inferior direction approximately coincides with the coronary ostia. After segmenting the aorta boundary in the initial slice, the active contour is propagated slice-wise in caudal and in cranial directions simultaneously to be used as new initialization. If the change in aorta perimeter between two consecutive slices exceeds a certain threshold, e.g., when the contour grows into surrounding structures, the segmentation propagation in the respective direction is discontinued at this slice.

3.4. Vessel Enhancing Filtering

The differentiation between the coronary arteries and the surrounding structures is non-trivial in most cases. To get a better discrimination of vessel and non-vessel objects, the scans have to be preprocessed with vessel-enhancing filters. Here, a combination of two measures that target the vesselness of a structure is used to maximize the sensitivity and specificity of the resulting measure. In addition to the gradient-based medialness measure [32,33], the well-known tubeness measure proposed by Sato et al. [34] is taken into account, which relies on properties of the Hessian matrix.

3.4.1. Entropy-Supported Medialness Measure

The medialness enhances vessel structures by detecting circular shapes in cross-sectional views. To the end of detecting vessels independently of their orientation, the data set is re-sliced in multiple directions at every image point. The medialness is then computed as described in [32]. In order to increase specificity as much as possible, the computation is extended by an entropy weighting [33]. By computing the entropy of the distribution of circularly sampled edge responses, an assumption about the currently observed edge can be made. For uniform distributions, the probability that the image point is located in a circular structure is high and vice versa. Incorporating this as a weighting term attenuates response from structures that exhibit no circular or tube-like shape. The benefit of entropy support in high-resolution imaging is questionable due to potential stenoses. Since these are not reliably captured by the underlying acquisition protocol, we favor improved artifact suppression and incorporate the entropy.

3.4.2. Tubeness Measure

To further increase the quality of the vessel-enhanced images, we propose a combination of the medialness with the tubeness measure [34].
The tubeness measure relies on a 3D line enhancement filter that is computed at a certain scale σ with the goal of detecting tubes with an approximate diameter corresponding to this scale. The input image at this scale is I σ = I G σ , where G σ is a Gaussian kernel with standard deviation σ and ∗ denotes convolution. For details on the computation of the tubeness measure please refer to [34].
Traditionally, the tubeness response is selected as the maximum over multiple scales. However, in the underlying imaging protocol, only a small variation of the observed vessel size is expected, due to the large pixel size. To exploit this, at first the response T σ at a scale σ corresponding to the vessel size is computed. Subsequently, the filter response T 3 σ computed at a scale three times this size, in which the coronary arteries no longer yield a response, is subtracted from the prior result. This substantially attenuates the problem that high responses T σ are generated by the larger structures surrounding the aorta, such as the walls of the ventricles.
Because the medialness filter yields good peak responses in the center of vessel structures but is unspecific outside these regions, we use a combination of both measures for the following steps. To increase specificity, the tubeness images are thresholded with the computed medialness responses. If an image point exhibits high responses from both measures its value is kept, otherwise it is discarded.

3.5. Ostia Detection

Finding a good starting point for the coronary centerline extraction is a challenging task. The coronary ostia are obviously well suited but their detection is not necessarily straightforward. When trying to detect the coronary ostia, the previously segmented aorta boundary is a good initial estimate. Although the ostia are not visible in all scans, the arteries always end at least close to the aorta boundary. This reduces the search space for the ostia to the surface of the aorta and a certain margin around it.
The detection is performed based on the vessel-enhanced images presented in Section 3.4 and the slice-wise segmented aorta boundary. A ray tracing is performed on each individual slice of the aorta. For each boundary point of the segmented aorta a ray is cast pointing outwards in normal direction of the boundary contour. As soon as this ray intersects with an image point exhibiting sufficiently high vesselness response, the tracing procedure is started. The aim of the tracing is to follow the course of the highest responses, i.e., the course of the supposed vessel, and to sum up the responses along the traced path. For this purpose, all 27-connected neighbors of the starting point are considered and the one with the highest vesselness response is selected as successor. The responses of the two points are summed up and the procedure is repeated by the successor, with the restriction that points already visited cannot be visited again.
After completion, a plot of the accumulated vessel response over the aorta boundary is generated. It is anticipated that the ostia and the coronary arteries carry high response values. This property should also be observable in the plotted response. The individual plots for each slice can, therefore, be searched for peaks in terms of vessel response. Since we seek to detect two ostia, the two highest peaks are assumed to represent the target structure and are selected by the algorithm. Because one coronary artery is detected from multiple neighboring rays if the sampling is dense, the peaks are required to be at least 5 apart. An example of these plots can be seen in Figure 3.

3.6. Coronary Centerline Extraction

The extraction is based on a shortest-path computation. To this end, the whole data set is treated as a graph in which each node is determined by one image point x ( x , y , z ) and multiple edges e to its neighbors. As we seek to extract vessel paths, the costs are computed such that structures with a high probability of being a vessel are assigned low cost values and vice versa.

3.6.1. Cost Map Computation

Unfortunately, the vessel-enhancing filter responses are not sufficiently specific. Especially at the boundaries of objects surrounding the aorta and the coronary centerlines, many false positives can be observed. To counteract this and avoid interference of the extracted centerlines with other structures, two additional steps are performed.
A trinarization is computed as shown in Equation (1). Because the filter response values exhibit smooth behavior, the path extraction is prone to drift-offs, when closely passing surrounding structures. In contrast, the trinarized volume applies step-like behavior of the response gradient.
The trinarized image G ( x ) is computed by
G ( x ) = 1 if V ( x ) 0.4 , 0.5 if 0.4 > V ( x ) > 0.3 , 0 else ,
where V ( x ) is the vessel-enhanced image as described in Section 3.4. The thresholds are selected such that only image points that clearly belong to a vessel structure exhibit higher vesselness response than the upper bound, points that are likely to correspond to a vessel fall in between, and unlikely points are discarded.
Additionally, a mask image is created. In Section 3.4, the tubeness measure and the effects of filtering at different scales were introduced. The previously generated images T 3 σ are reused in this step. At first, a morphological dilation is performed with a circular structuring element with a radius of unity [35]. This ensures that all non-vessel structures and especially their borders are completely covered. Subsequently, each image point covered by this mask V m ( x ) is penalized by assigning appropriate cost.
An edge e x i , x j is determined by an image point x i and it’s neighbor x j , x j N i , where N i is the 26-connected neighborhood of x i , i.e., including diagonal connections. The related cost ϵ ( e x i , x j ) for traversing between these two points is computed by
ϵ ( e x i , x j ) = 1 w v V ( x i ) + w g G ( x i ) + w m V m ( x i ) ,
with the predefined weights w v + w g + w n = 1 .

3.6.2. Centerline Extraction

We extract centerlines as minimal cost paths from potential end nodes to the start nodes, in this case the coronary ostia that are extracted according to Section 3.5 [36]. As the end nodes for the cheapest path computation are not known beforehand, we first perform a front propagation step [32] in the Dijkstra sense [37] that has similarities to fast marching algorithms as described in [38].
The minimum accumulative cost at an image point is computed according to [32].
On the one side, this strategy establishes minimal paths to all nodes in the graph and, on the other side, it extracts end node candidates as nodes that only exhibit a single edge below the cost threshold. Finally, backtracking is used to extract the cheapest paths connecting the end node candidates and the source node, which we retrieved from the ostia detection.

3.7. Multiplanar Reformation

While volumetric information certainly is beneficial for many diagnostic tasks, the amount of information can be overwhelming. To ease assessment, planar reformations were proposed that allow to display the structures of interest in a single 2D image [8]. Because the high-take-off and acute angle anomalies address different properties, two reformations are needed.
The height difference of the coronary ostia is visualized by a multiplanar reformation. Therefore, two planes are sampled that are aligned in axial direction. Both planes show one cross-section of a coronary ostia and are fused subsequently. As an orientation point, the principal axis of the aorta is computed via principal component analysis on the aorta boundary points [39]. Subsequently, the previously detected coronary ostia positions p l o and p r o for the left and right ostium, respectively, are projected on the aorta axis [40]. The basis for the two sampling planes are then determined by the vector pointing from the projections to the respective ostia points and the principal axis of the aorta. With the known basis, two slices are sampled and combined in one 2D image.
To improve the re-sampling in case that the coronary ostia are not lying exactly in the determined planes, a maximum intensity projection (MIP) is used. For each sampling point, the highest intensity value on a short ray orthogonal to the plane is selected.

3.8. Curved Planar Reformation

The coronary arteries can not be sampled by a plane due to their complex anatomy. To compute an image that comprises the 3D vascular paths, a curved surface that includes all the image points belonging to the coronary arteries as well as the ostia has to be found.

3.8.1. Surface Fitting

Similar to [20], we use a spherical basis shape that is parametric and can be deformed to better account for the non-spherical shape of the myocardial surface. Deformation is integrated in the spherical parametric model by making the radius of the sphere position-dependent. The mapping can be described as S r ( ϕ , θ ) , ϕ , θ , m , S : R × R × R × R 3 R 3 , with the radius r ( ϕ , θ ) , dependent on the angles ϕ [ 0 , π ) and θ [ 0 , 2 π ) , and the sphere’s center m = ( m x , m y , m z ) .
The fitting of the sphere is performed by a least-squares optimization. Computing the sum of squared distances of all centerline points to their closest point on the surface of the sphere yields an estimate of the current quality of the fit. To ease computation, all points p i = ( p x , p y , p z ) , p i C , with C being a coronary centerline, are transformed to the coordinate system of the sphere by subtracting the center m of the sphere. Hence, the corresponding points in the coordinate system of the sphere are denoted as p i = ( p x m x , p y m y , p z m z ) . Subsequently, the closest surface point is computed by first transforming to spherical coordinates and determining the angles ϕ and θ [40]. With the known angles, the radius r ( ϕ p , θ p ) can be interpolated and the respective surface point of the sphere s = ( s x , s y , s z ) is evaluated using the spherical coordinate transform [40].
The fitting process is divided into two steps. At first, a rigid optimization is performed, in which only the center of the sphere m and a uniform radius r are computed. This ensures an approximate but robust fit to the coronary centerlines that yields a good initialization for the following step. In the second step, the position of the sphere is kept fixed, but a variable radius r ( ϕ , θ ) is introduced and optimized for as described in Equation (3). To ensure smoothness of the fitted sphere, large changes between adjacent radii are penalized by a regularization term r r e g in the optimization process.
Given a target centerline C consisting of points p i , we seek to find the solution to a regularized least-squares optimization problem between the centerline points p i and the points on the spherical surface s i . This optimization can be computed by
argmin r ( ϕ p , θ p ) , m i s i p i 2 2 + λ · r r e g ,
with s i = S r ( ϕ p i , θ p i ) , ϕ p i , θ p i , m , p i C , and λ denotes the Lagrange multiplier that serves as a weighting for the penalty term.

3.8.2. Reformation

After the sphere fitting, the re-sampling of the original volume can be performed. To do so, all surface points of the sphere are evaluated for ϕ [ 0 , π ) and θ [ 0 , 2 π ) . For each surface point, the intensity value of the corresponding image point in the original data set is read out and mapped to the curved planar reformation image I c p r ( ϕ , θ ) .
As previously proposed in Section 3.7, a maximum intensity projection is performed to increase the probability of mapping an actual coronary artery point to the reformatted image. Assuming that the coronary arteries are the brightest objects in their local neighborhood, we sample the line m , s i ¯ in an interval close to the surface of the sphere and retrieve the highest intensity to increase the probability of reprojecting an artery point in case the surface fit was imperfect. Subsequently, this value is projected onto the surface point. The lookup is performed by incorporating a radius modifier and evaluating the surface points at multiple positions along the ray connecting the sphere’s center and the currently considered point for all angles ϕ and θ .

4. Experiments

The imaging protocol proposed in Section 3.1 is composed of the data acquisition suggested in [26] and reconstruction as described in [27] with the goal to capture the proximal coronary arteries in a single breath-hold scan. For detailed experiments and corresponding evaluation of the acceleration strategies please refer to the original manuscripts. The effects of the acceleration on the image quality in the underlying approach will be discussed in the sections of the respective processing steps.
Evaluation of the proposed approach is done on 10 healthy volunteer data sets (six female, four male, 42 ± 13 years). Data sets were acquired and reconstructed on a 1.5 T clinical MR scanner (MAGNETOM Aera, Siemens Healthcare, Erlangen, Germany). The proximal part of the coronary arteries could be acquired within the period of one breath-hold for all patients. The average scan time was 24 ± 5 s.
To the end of evaluating the performance of the proposed approach, at first ground truth was generated by manual segmentation of the aorta and the coronary arteries. Because only the centerlines are extracted in the automated procedure, the ground truth segmentations of the coronary arteries were skeletonized for the evaluation using morphological thinning [41].

4.1. Ostia Detection

The coronary ostia denote the transition between the aorta and the coronary arteries. Determining this point is not always straightforward, particularly when the ostium is not visible due to partial-volume effects. Therefore, five medical imaging experts were asked to annotate the ostia positions in each data set, in order to retrieve reference standard for the evaluation. According to the medical indications described in Section 1, the position in longitudinal direction, as well as the relative angle between the ostia are the parameters of interest for the assessment [3,4]. The automated ostia detection is, therefore, evaluated regarding the longitudinal and angular displacement between the detected and annotated ostia.

4.2. Coronary Centerline Extraction

To evaluate the automatic coronary centerline extraction and provide a standardized comparison, the overlap measure proposed by Schaap et al. [42] is computed.
According to [42], the radius is determined by the annotation of the ground truth centerlines. However, in the underlying data sets a determination of the radius by manual segmentation is not meaningful due to the low resolution. Consequently, we evaluate the overlap measure at a fixed radius corresponding to two times the pixel size and, therefore, a maximum diameter of 4.8 mm which is in agreement with the average lumen diameter of the main coronary artery branch [43].
For the curved planar reformation, the coronary ostia and the main branches of the coronary arteries are of special interest. To verify the necessary accuracy of the extracted centerlines in these regions, a second evaluation is performed. This time, only the centerlines up to a distance of 20 mm to the detected coronary ostia were taken into account for computing the overlap score. In addition to the overlap, also the average Euclidean distance was computed for all points marked as true positives.

4.3. Curved Planar Reformation

The evaluation of the curved planar reformation is performed quantitatively as well as qualitatively. On the one hand, the fitness of the computed sphere can be evaluated by computing the average Euclidean distance of the centerline points to their corresponding closest sphere point, similar to the evaluation of the centerlines. Thereby, the sphere has been fitted to the automatically extracted centerlines. Subsequently, the distances to both the automatically extracted and the reference centerlines is computed. On the other hand, the results of the curved planar reformations are evaluated by visual examination, in accordance with their intended application in the clinical work flow.

5. Results

5.1. Ostia Detection

Evaluation of the ostia detection results was done with respect to the manual annotations of five experts.
The average angular deviation between the automatically detected and manually annotated ostia positions was 6.6 ± 5.7 for the left and 8.7 ± 5.2 for the right coronary ostia. The displacement in superior-inferior direction was 2.5 ± 1.6 mm and 0.6 ± 0.3 mm , respectively. The standard deviation among readers was 3.6 ± 1.1 in angular and 1.2 ± 0.58 mm in superior-inferior direction.

5.2. Coronary Centerline Extraction

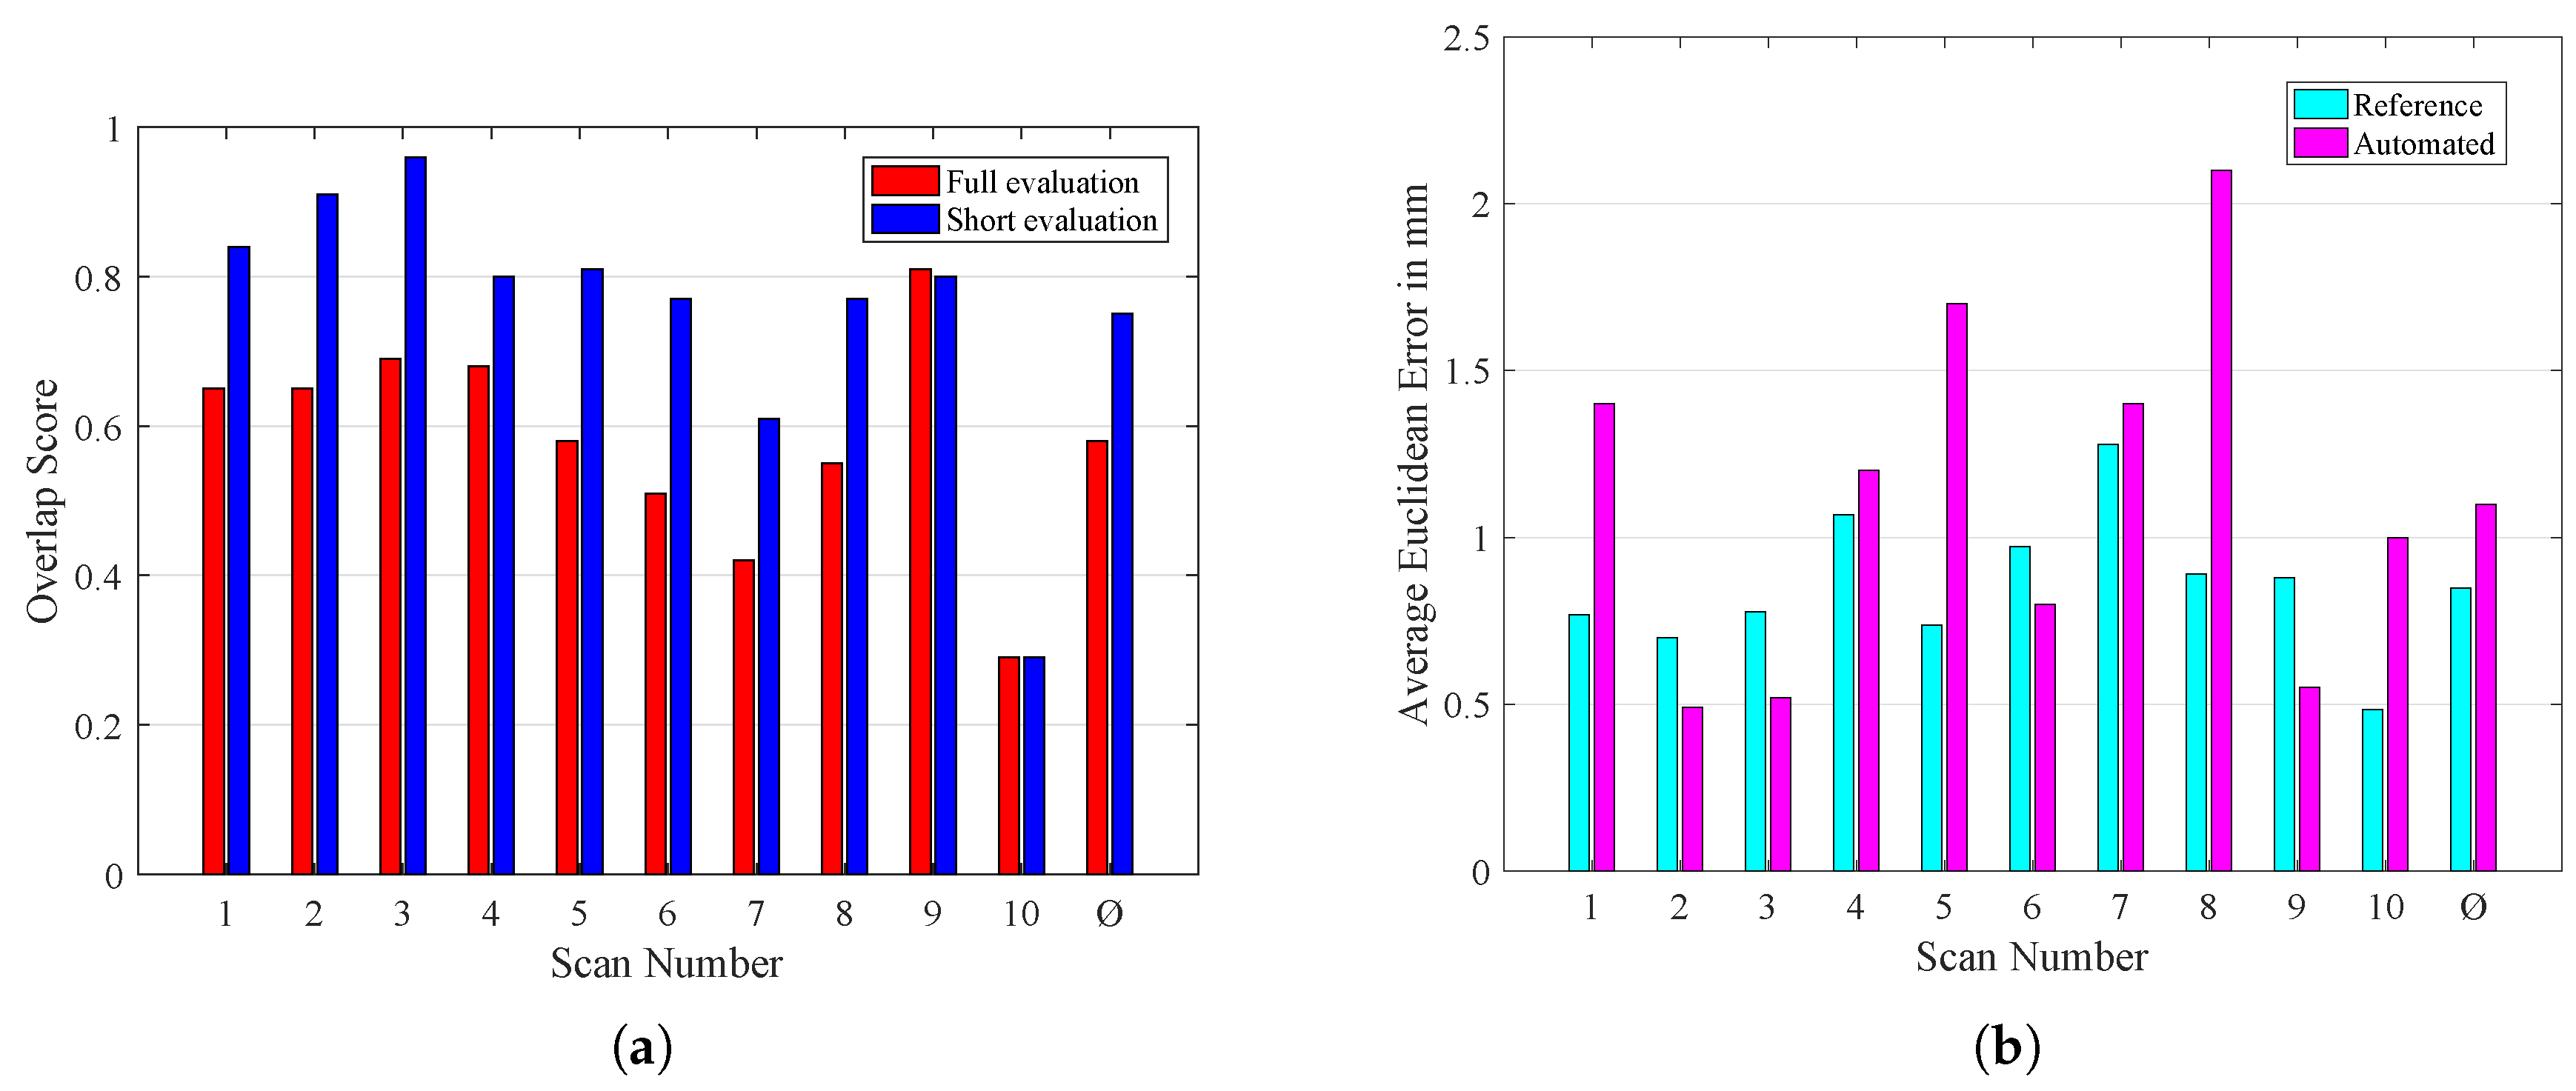
The average overlap between the reference and the automatically extracted coronary artery centerlines was 0.58 ± 0.14 , with a mean absolute error of 0.91 ± 0.26 mm . Itemized results of all scans are presented in Figure 4a, from which it becomes apparent that the proposed methods show inconsistent performance which will be discussed in Section 6. The evaluation results of the cropped centerlines can also be found in Figure 4a. Close to the ostia, the overlap is increased to 0.76 ± 0.18 , while the mean absolute error decreases to 0.86 ± 1.8 mm .

5.3. Multiplanar Reformation

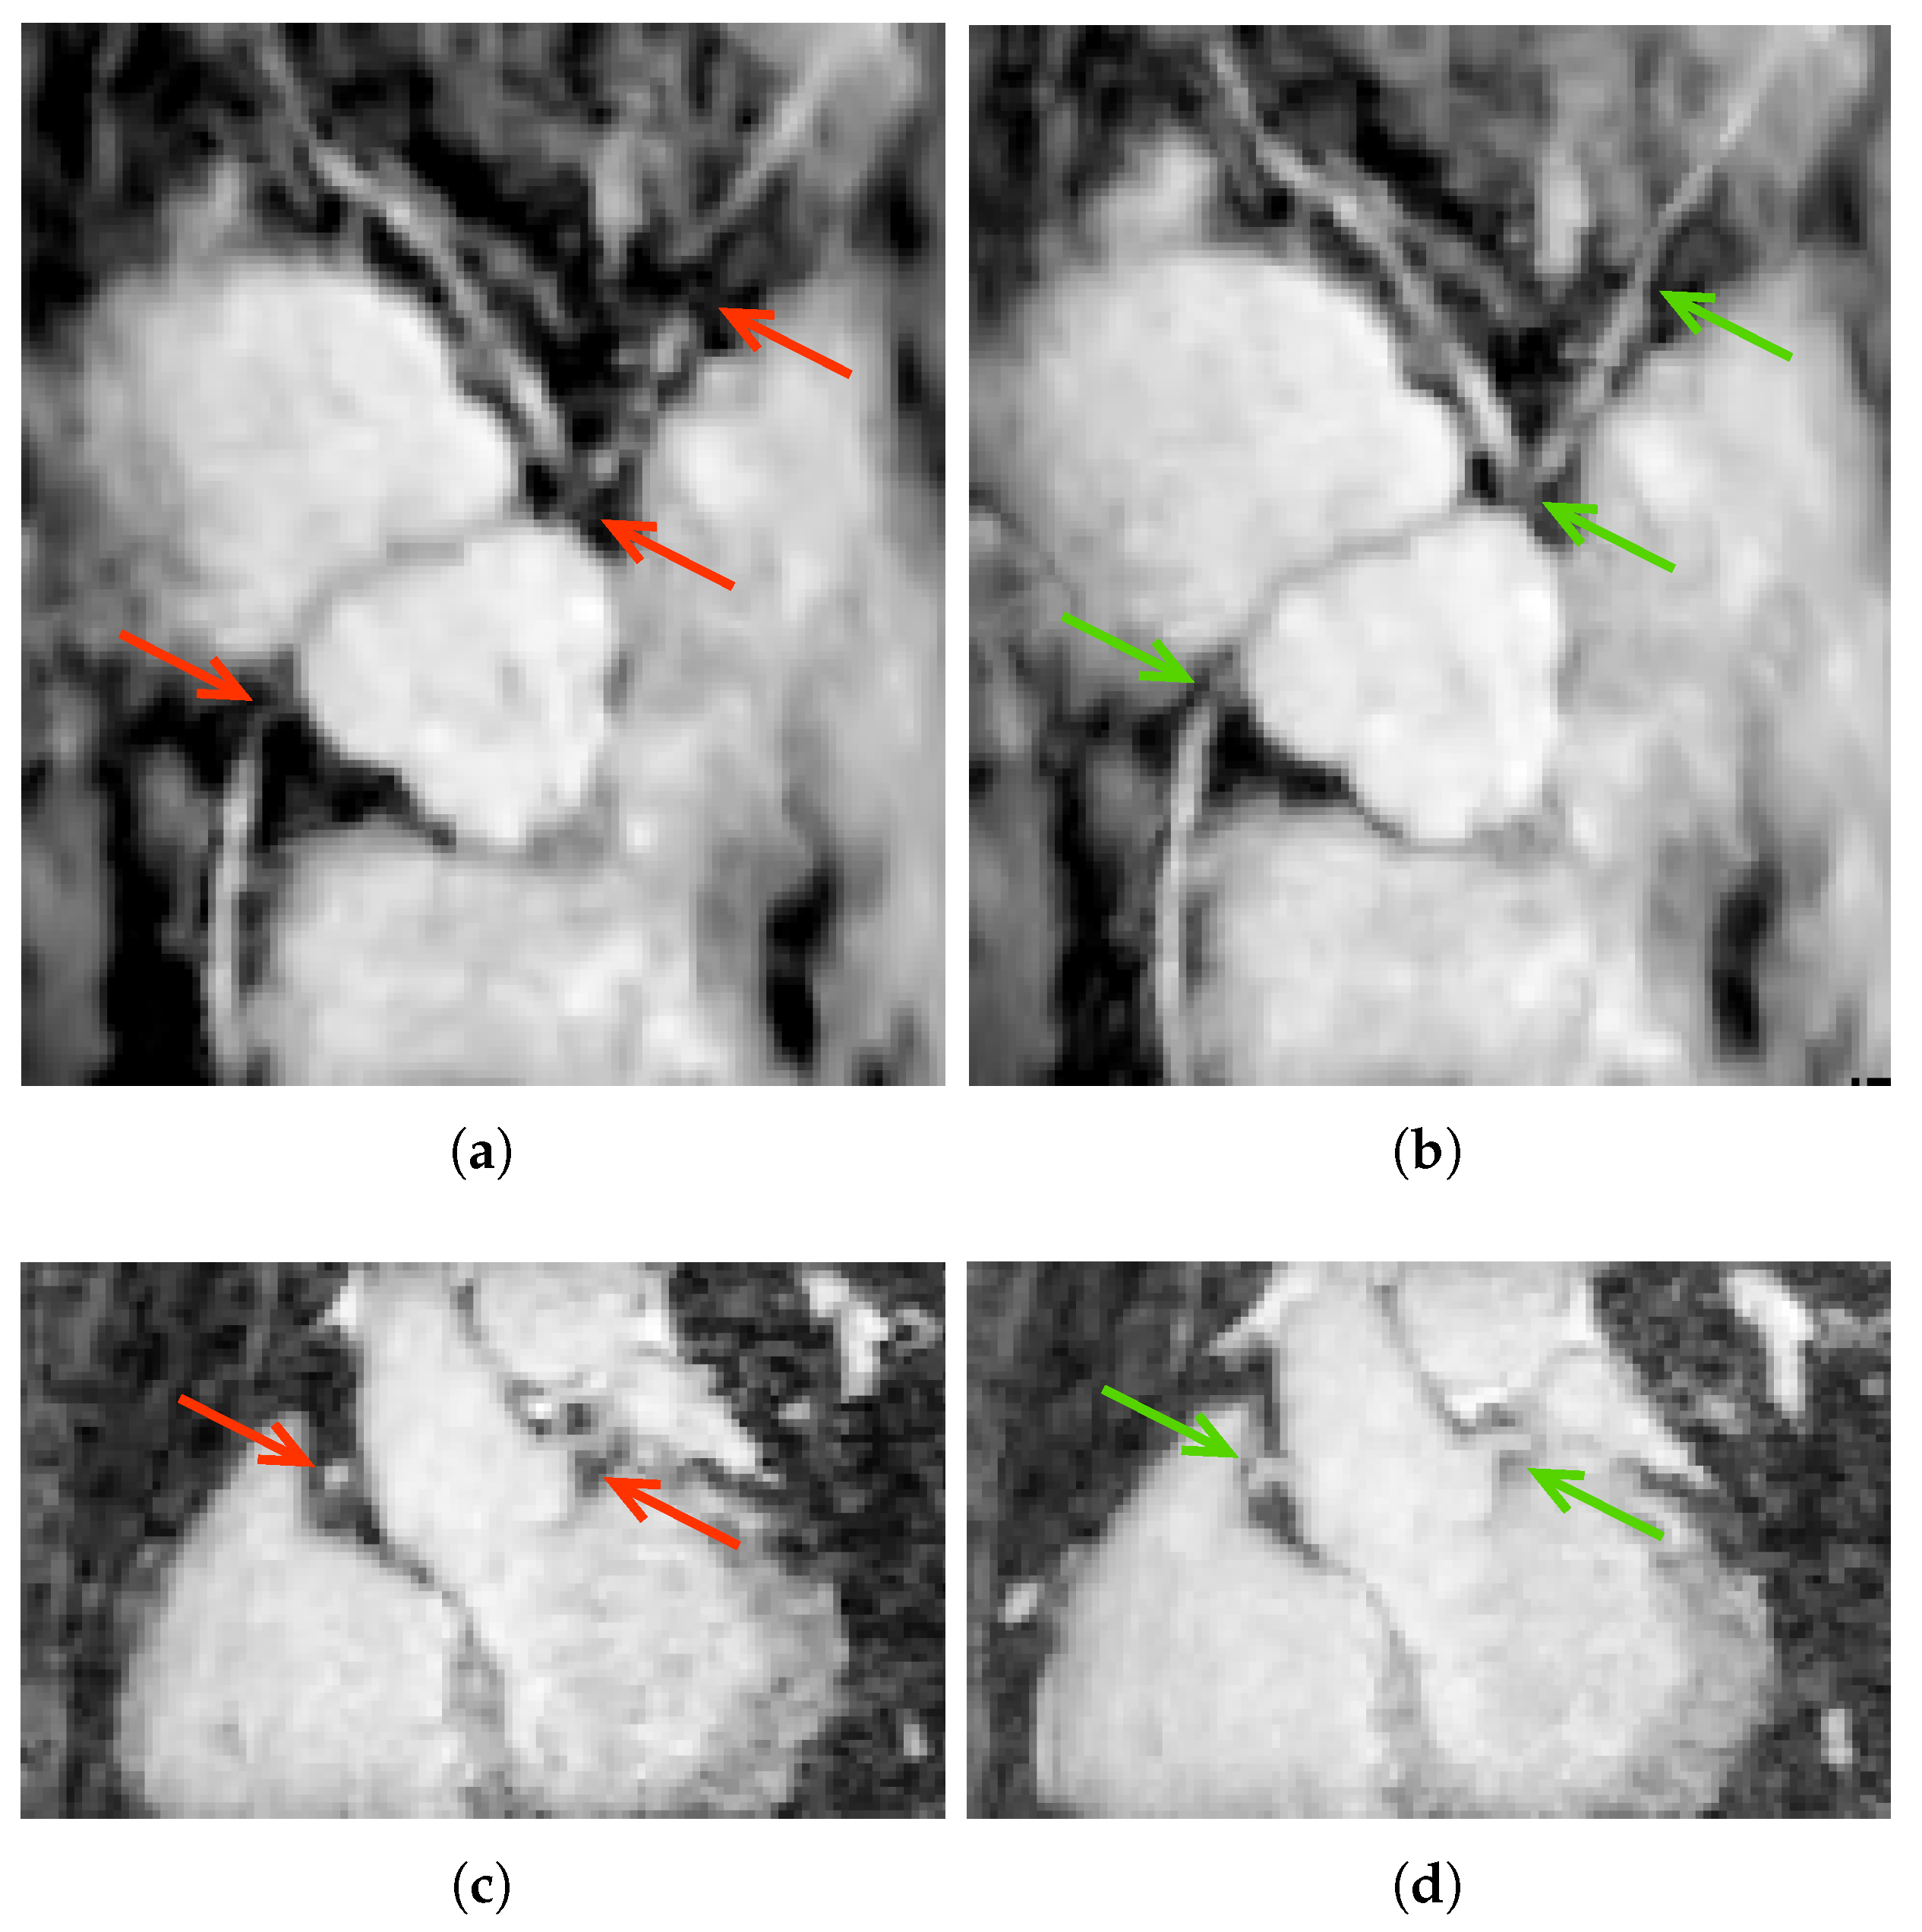
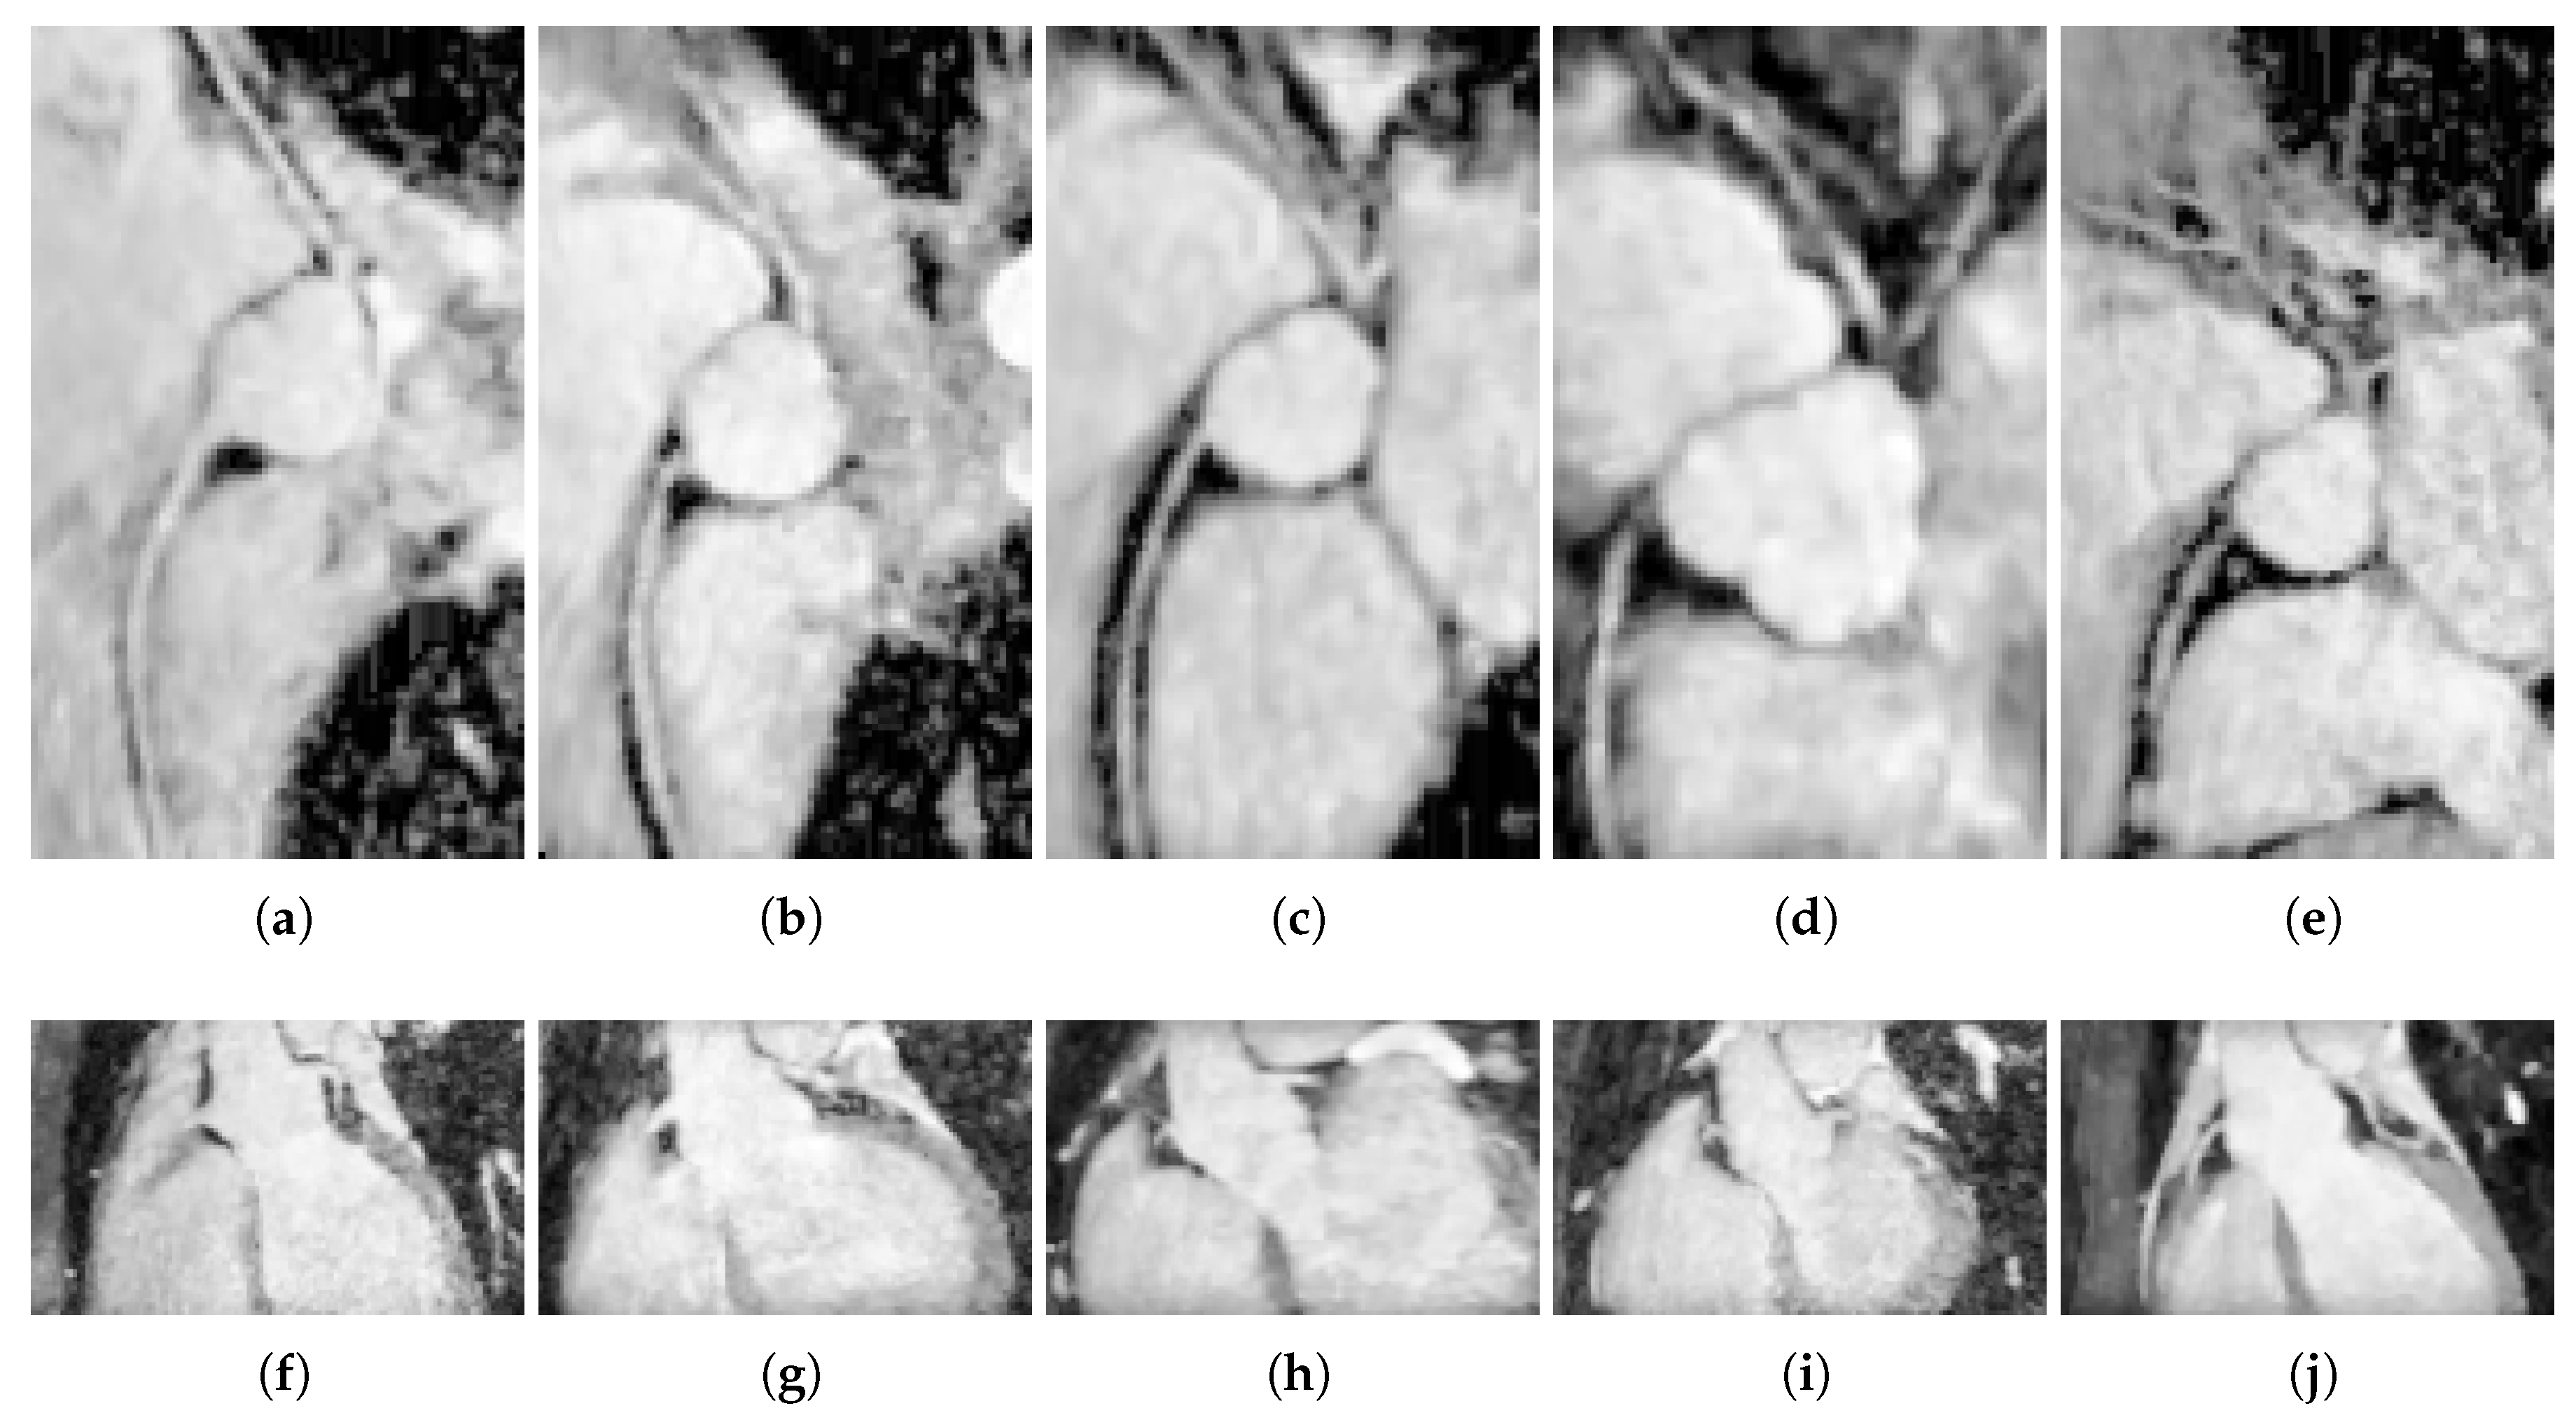
The multiplanar reformation was successful for all data sets. Representative examples are shown in Figure 6. By incorporating a maximum intensity projection in the MPR, the probability of mapping coronary ostia values could be increased significantly (see Figure 5).

5.4. Curved Planar Reformation

Curved planar reformations could be automatically generated for all underlying data sets. In Figure 4b, the average Euclidean distance between the coronary centerline points and the surface are presented for the automatically as well as the manually extracted centerlines. The average Euclidean distance was 1.1 ± 0.51 mm for the automatically extracted and 0.85 ± 0.20 mm for the reference centerlines. Additionally, reformatted images of representative data sets are shown in Figure 6.

6. Discussion

6.1. Data Acquisition

The presented acquisition protocol is capable of acquiring the proximal part of the coronary arteries in a single breath-hold. Due to the highly accelerated acquisition, it is possible to append the imaging protocol to standard operating procedures with only minimal additional time expenditure. The rapid acquisition entails impaired image quality and a lower resolution compared to its free-breathing MRA and CTA equivalents. These downsides manifest in terms of partial-volume effects, occlusions, and reduced contrast. While the effects are particularly noticeable in the course of the ostia detection and coronary centerline extraction, the respective procedures are robust enough to cope with these challenges.
A group of patients who have not yet been considered for this screening protocol are children. Imaging of children imposes special demands on spatial and temporal resolution as well as on scanning time. In future work we will investigate whether the proposed scanning protocol is appropriate for children or whether free breathing protocols must be considered.

6.2. Ostia Detection

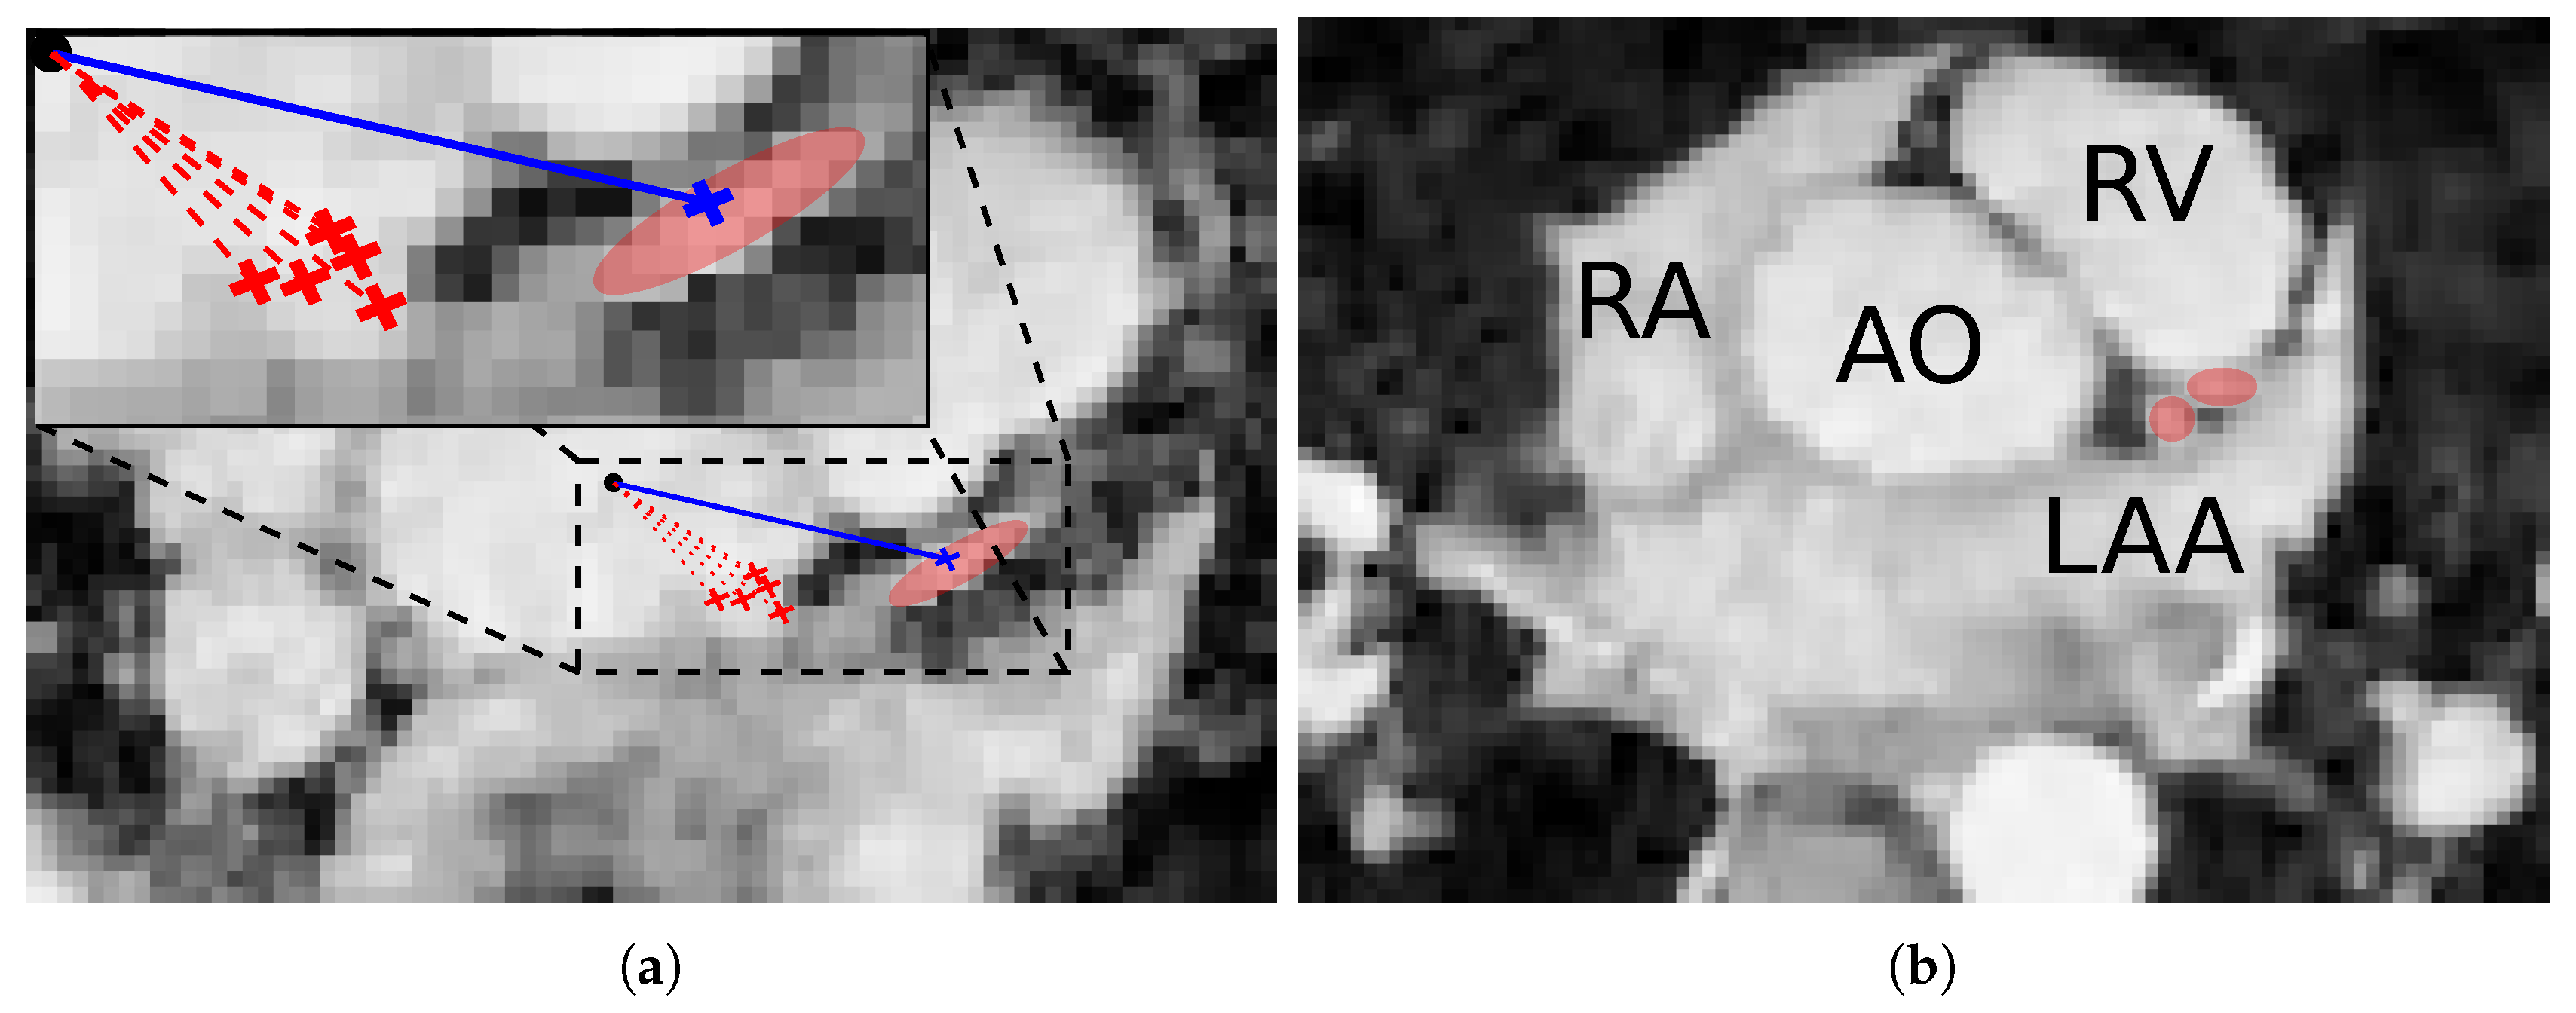
Ostia detection was successful in all datasets. Where inaccuracies occurred, these were in most cases induced by properties of the ray-tracing method and the evaluation methodology. Due to the varying visibility of the ostia in the available data sets, the search range for the detection of the coronary arteries was not limited to the aorta boundary, but some margin around it. Consequently, originating arteries are detected in multiple slices if good visibility is granted. In such cases, the highest accumulated response by the ray-tracing method is not necessarily lying directly at the aorta boundary, but further into the artery. In contrast, human observers are able to “interpolate” missing parts of the artery, and, therefore, provide accurate annotations even if the ostia are not or only hardly visible. An example of this observation is shown in Figure 7a. Because the focus of the ostia detection in this context was to provide starting points for the centerline extraction, the achieved accuracy proved to be sufficient for initializing the next step in the processing pipeline. The angles of the ostia that are computed in this step may only be used with caution. Clinical assessment of the angular and axial displacement between both ostia is always to be performed by a physician based on the final reformatted images.

6.3. Centerline Extraction

Multi-scale approaches are, in general, very useful as shown in many applications [44,45]. However, in order for these approaches to show their full potential, the structures of interest must occur at multiple scales. In our highly accelerated imaging protocol the originally acquired voxel size was 1.2 mm × 1.5 mm × 1.4 mm. In relation, the diameter of the coronary artery lumen measures 4.5 ± 0.5 mm for the left and between 3.9 ± 0.6 mm and 2.8 ± 0.5 mm for the right main artery [43]. Resulting from this, the proximal coronary artery lumen is represented by approximately four voxel in the images in the best case, with two to three voxel being the average. Applying multi-scale transformations to these images renders the coronary arteries invisible when using meaningful differences in scale. Due to the fact that in the available data sets only the main branches of the coronary arteries are visible, the proposed single-scale method does not remove any information from branches with smaller vessel sizes, as such information is not accessible using the discussed imaging protocol in the first place. Accordingly, determining the radius at a certain point with the required accuracy to provide a benefit for the assessment is a challenging task. Because the coronary centerlines are only intermediate results that are required for curved planar reformation, no radius is extracted. If a narrowing of the coronary arteries is present in the acquired volume, this can most likely be recognized by the physician in the final reformatted image that will be presented for assessment. However, the proposed acquisition protocol is neither designed nor optimized for diagnostic assessment of stenosis and a high resolution CMRA scan should be acquired if stenoses are suspected.
The results of the centerline extraction show a substantially higher overlap at the early parts of the coronary arteries (see Figure 4a). This is in accordance with the observation that drift-offs of the extracted centerlines occur mostly at the more distal stages. Especially the left coronary artery is affected by these problems. Its pathway is often close to the left atrial appendage (LAA) in the images (see Figure 7b). Due to its smaller size, when compared to the atria and ventricles, the LAA is often not entirely covered by the higher-scale filtering mask and, therefore, generates a vessel responses in the enhanced images. Besides this interference, more noise and artifacts are present around the left coronary ostium and the bifurcation point, at which the LCA divides into the left anterior descending artery and the left circumflex artery. Nevertheless, the segmentation close to the ostia and the proximal coronary artery centerlines yielded an average overlap of 0.76 ± 0.18 , suggesting that the accuracy necessary for curved planar reformation is achieved. This assumption is supported by the CPR images shown in Figure 6.
In future work, alternative centerline extraction methods may be investigated to further improve the presented method. Especially vessel modeling approaches as presented by [46] pose great potential by increasing the robustness of the path extraction against interference from surrounding structures.
The proposed centerline extraction could further be utilized as an extension of the coronary vessel reconstruction evaluation tool proposed in [47]. The manual segmentation can, therefore, be replaced by an automated approach to allow for automated evaluation of vessel length and sharpness in coronary imaging.

6.4. Curved Planar Reformation

The surface fitting is performed in a two-step approach. Repeating both steps in terms of an iterative procedure showed no or only negligible improvements.
The lower average distance from the surface to the reference centerlines might at first be conspicuous, considering that the sphere was fitted to the automatically extracted centerlines. While the manually segmented centerlines are smooth, the automatically extracted centerline candidates may still contain outliers and drift-offs, which are, as intended by the regularization of the sphere fitting, not taken into account. When evaluating the average Euclidean distances to the surface, this results in larger errors when compared to the reference centerlines. In contrast, by examining the generated curved planar reformation images, it can be observed that a larger average distance does not necessarily result in worse image quality. Comparing CPR images of the data sets exhibiting the worst and the best Euclidean distance shown in Figure 6a,c, respectively, it is clearly visible that although the computed average distances are lower for the data set shown in Figure 6c, the length of the visible longitudinal cross section of the coronary arteries are larger for the scan presented in Figure 6a.
Another reason for this effect are different lengths and pathways of the centerlines. The drift-offs of the centerline extraction occur especially at the distal parts of the coronary arteries. While shorter branches may lead to better quantitative results, the fit of the sphere to more distant parts of the coronary arteries that have not been extracted previously can be worse. This is also in agreement with the evaluation results of the cropped centerlines presented in Figure 4a.
The lower and upper border for the MIP margin have to be selected carefully. In case of a too small range, the radii are not varying enough to find other image points assigned with high intensities. If exceeding the neighborhood, the MIP may select different image points and, therefore, decrease the quality of the outcome. As seen in Figure 5, the resulting effect is especially prominent in the distant sections of the coronary arteries. Additionally, also small gaps in the pathways closer to the ostia can be filled this way. Nevertheless, this effect is of course not limited to the coronary arteries. Because the focus of this approach lies on the visualization of the coronary arteries, improved results regarding these are favored over slightly worse visibility of the aorta.
In general, the results of the vessel-enhancing filtering can be determined as the principal bottle neck of the proposed approach. Vessel segmentation affects both ostia detection and centerline extraction and, consequently, may negatively affect curved planar reformation performance. Clusters of high vessel responses from non-vessel structures, that are generated due to inaccuracies in the filtering process, may lead to wrong ostia detections if these are located close to the aorta. In case of the centerline extraction, incorrect responses are especially critical if they cross the pathway of the coronary arteries. Counteracting the drift-offs of the extracted centerlines as described in Section 3.6 greatly improves the robustness of the procedure. Nevertheless, not all excess responses can be mitigated. Additionally, cautious selection of the cost threshold yields early terminations of the centerline extraction in some of the data sets. Therefore, increased quality of the vessel-enhancing filtered images would be beneficial not only for the accuracy of the extracted centerlines, but especially for the general robustness of the proposed approach. Regarding these challenges it is important to be aware that the proposed data acquisition method is a prototype imaging protocol and that only a limited number of such datasets are available up to now. With increasing amount of data also machine learning approaches to single steps of the proposed pipeline become possible. The proposed methods for ostia detection and centerline extraction will help to weakly label large amounts of data automatically once the studied imaging protocol translates to clinical practice.
In case of missing localizer points for the aorta segmentation, a 2-click solution can be implemented. The physician then has to select one point in the aorta and another at the apex of the heart. For image data of varying quality and, therefore, unreliable ostia detection results, also an extension to a 4-click approach with manual selection of the ostia is possible.
Despite all aforementioned challenges that impair centerline quality, automated curved and multiplanar reformation was successful in all tested cases. Both, height difference as well as take-off angle of both ostia, can be visualized for assessment with just two 2D images.

7. Conclusions

We have presented a fully automated imaging and processing pipeline that allows for fast screening of the proximal coronary arteries. The approach consists of highly accelerated 3D CMRA and consecutive curved and multiplanar reformation which provides an easy-to-assess representation of the information. The procedure proved successful in ten volunteer scans without any additional user interaction and is, therefore, well suited to be appended to routine examinations. Currently, the method is limited by the performance of vessel-enhancing filters that are used for ostia detection and centerline extraction. Future research could, therefore, investigate possibilities to increase the specificity of these methods. Moreover, the current image protocol allows for the assessment of drastic changes in anatomy, such as high take-off and acute angle take-off anomalies. With improvements in image resolution, the use case of the method could be extended even further to allow analysis of the vessel lumen in screening-type imaging, which may be of clinical interest.

Author Contributions

Conceptualization, B.S. and M.U.; Data curation, M.S.; Funding acquisition, A.M.; Methodology, B.S. and M.U.; Resources, A.M.; Supervision, J.W., C.F. and M.U.; Validation, B.S.; Writing—original draft, B.S.; Writing—review and editing, J.W., C.F., M.S., A.M. and M.U.

Funding

The authors gratefully acknowledge funding of the Erlangen Graduate School in Advanced Optical Technologies (SAOT) in the framework of the German excellence initiative. Furthermore, this work has been supported by the project P3-Stroke, an EIT Health innovation project. EIT Health is supported by EIT, a body of the European Union.

Conflicts of Interest

The authors declare no conflict of interest.

References

  1. Heo, W.; Min, H.K.; Kang, D.K.; Jun, H.J.; Hwang, Y.H.; Jeon, J.H.; Lee, J.Y. The “High Take-Off” Left Main Coronary Artery in a Patient With Acute Type A Aortic Dissection. Circulation 2014, 130, e102–e103. [Google Scholar] [CrossRef] [PubMed]
  2. Eren, B.; Türkmen, N.; Gündogmus, U.N. Sudden death due to high take-off right coronary artery. Soud Lek 2013, 58, 45–46. [Google Scholar] [PubMed]
  3. Bille, K.; Figueiras, D.; Schamasch, P.; Kappenberger, L.; Brenner, J.I.; Meijboom, F.J.; Meijboom, E.J. Sudden cardiac death in athletes: The Lausanne Recommendations. Eur. J. Cardiovasc. Prev. Rehabil. 2006, 13, 859–875. [Google Scholar] [CrossRef] [PubMed]
  4. Virmani, R.; Chun, P.K.C.; Goldstein, R.E. Acute takeoffs of the coronary arteries along the aortic wall and congenital coronary ostial valve-like ridges: Association with sudden death. J. Am. Coll. Cardiol. 1984, 3, 766–771. [Google Scholar] [CrossRef]
  5. Vanhoenacker, P.K.; Heijenbrok-Kal, M.H.; Van Heste, R.; Decramer, I.; Van Hoe, L.R.; Wijns, W.; Hunink, M.G.M. Diagnostic Performance of Multidetector CT Angiography for Assessment of Coronary Artery Disease: Meta-analysis. Radiology 2007, 244, 419–428. [Google Scholar] [CrossRef] [PubMed]
  6. Sakuma, H. Coronary CT versus MR angiography: The role of MR angiography. Radiology 2011, 258, 340–349. [Google Scholar] [CrossRef] [PubMed]
  7. Pejkovic, B.; Krajnc, I.; Anderhuber, F. Anatomical Variations of Coronary Ostia, Aortocoronary Angles and Angles of Division of the Left Coronary Artery of the Human Heart. J. Int. Med. Res. 2008, 36, 914–922. [Google Scholar] [CrossRef] [PubMed] [Green Version]
  8. Oppelt, A. Imaging Systems for Medical Diagnostics: Fundamentals, Technical Solutions and Applications for Systems Applying Ionization Radiation, Nuclear Magnetic Resonance and Ultrasound; Publicis Corporate Publishing: Paris, France, 2011; p. 996. [Google Scholar]
  9. Kanitsar, A.; Fleischmann, D.; Wegenkittl, R.; Felkel, P.; Gröller, M.E. CPR-curved planar reformation. In Proceedings of the IEEE Visualization, VIS 2002, Boston, MA, USA, 27 October–1 November 2002; pp. 37–44. [Google Scholar] [CrossRef]
  10. Van Ooijen, P.M.A.; Irwan, R.; Slager, C.J.; Wentzel, J.J.; Schuurbiers, J.C.H.; Oomen, J.A.F.; Gijsen, F.J.H.; Krams, R.; van der Giessen, W.J.; Serruys, P.W.; et al. Multi-Dimensional Computed Coronary Visualization. In Coronary Radiology; Springer: Berlin/Heidelberg, Germany, 2004; pp. 227–282. [Google Scholar]
  11. Unberath, M.; Aichert, A.; Achenbach, S.; Maier, A. Consistency-based respiratory motion estimation in rotational angiography. Med. Phys. 2017, 44, e113–e124. [Google Scholar] [CrossRef] [PubMed] [Green Version]
  12. Manning, W.J.; Li, W.; Boyle, N.G.; Edelman, R.R. Fat-suppressed breath-hold magnetic resonance coronary angiography. Circulation 1993, 87, 94–104. [Google Scholar] [CrossRef] [PubMed]
  13. Griswold, M.A.; Jakob, P.M.; Heidemann, R.M.; Nittka, M.; Jellus, V.; Wang, J.; Kiefer, B.; Haase, A. Generalized Autocalibrating Partially Parallel Acquisitions (GRAPPA). Magn. Reson. Med. 2002, 47, 1202–1210. [Google Scholar] [CrossRef] [PubMed]
  14. Pruessmann, K.P.; Weiger, M.; Scheidegger, M.B.; Boesiger, P. SENSE: Sensitivity encoding for fast MRI. Magn. Reson. Med. 1999, 42, 952–962. [Google Scholar] [CrossRef] [Green Version]
  15. Lustig, M.; Donoho, D.; Pauly, J.M. Sparse MRI: The application of compressed sensing for rapid MR imaging. Magn. Reson. Med. 2007, 58, 1182–1195. [Google Scholar] [CrossRef] [PubMed] [Green Version]
  16. Boubertakh, R.; Prieto, C.; Batchelor, P.; Uribe, S.; Atkinson, D.; Eggers, H.; Sørensen, T.; Hansen, M.; Razavi, R.; Schaeffter, T. Whole-heart imaging using undersampled radial phase encoding (RPE) and iterative sensitivity encoding (SENSE) reconstruction. Magn. Reson. Med. 2009, 62, 1331–1337. [Google Scholar] [CrossRef] [PubMed] [Green Version]
  17. Akçakaya, M.; Basha, T.A.; Chan, R.H.; Rayatzadeh, H.; Kissinger, K.V.; Goddu, B.; Goepfert, L.A.; Manning, W.J.; Nezafat, R. Accelerated contrast-enhanced whole-heart coronary MRI using low-dimensional-structure self-learning and thresholding. Magn. Reson. Med. 2012, 67, 1434–1443. [Google Scholar] [CrossRef] [PubMed]
  18. Iyama, Y.; Nakaura, T.; Kidoh, M.; Kawahara, T.; Sakaino, N.; Harada, K.; Okuaki, T.; Yamashita, Y. Single-breath-hold whole-heart coronary MRA in healthy volunteers at 3.0-T MRI. Springerplus 2014, 3. [Google Scholar] [CrossRef] [PubMed]
  19. Edelman, R.R.; Giri, S.; Pursnani, A.; Botelho, M.P.F.; Li, W.; Koktzoglou, I. Breath-hold imaging of the coronary arteries using Quiescent-Interval Slice-Selective (QISS) magnetic resonance angiography: Pilot study at 1.5 Tesla and 3 Tesla. J. Cardiovasc. Magn. Reson. 2015, 17. [Google Scholar] [CrossRef] [PubMed]
  20. Etienne, A.; Botnar, R.M.; Van Muiswinkel, A.M.C.; Boesiger, P.; Manning, W.J.; Stuber, M. ”Soap-Bubble” visualization and quantitative analysis of 3D coronary magnetic resonance angiograms. Magn. Reson. Med. 2002, 48, 658–666. [Google Scholar] [CrossRef] [PubMed]
  21. Zheng, Y.; Tek, H.; Funka-Lea, G.; Zhou, S.K.; Vega-Higuera, F.; Comaniciu, D. Efficient detection of native and bypass coronary ostia in cardiac CT volumes: Anatomical vs. pathological structures. In Proceedings of the 14th International Conference on Medical Image Computing and Computer-Assisted Intervention, Toronto, ON, Canada, 18–22 September 2011; pp. 403–410. [Google Scholar] [CrossRef]
  22. Liu, L.; Shi, W.; Rueckert, D.; Hu, M.; Ourselin, S.; Zhuang, X. Coronary centerline extraction based on ostium detection and model-guided directional minimal path. In Proceedings of the 2014 IEEE 11th International Symposium on Biomedical Imaging (ISBI), Beijing, China, 29 April–2 May 2014; pp. 133–136. [Google Scholar] [CrossRef]
  23. Tek, H.; Gülsün, M.A.; Laguitton, S.; Grady, L.; Lesage, D.; Funka-Lea, G. Automatic Coronary Tree Modeling. MIDAS J. 2008, 7, 600. [Google Scholar]
  24. Gong, Z.; Shen, Z.; Zhang, D.; Wang, C.; Zhou, S. One-click detection of coronary artery ostia from three-dimensional CTA data. In Proceedings of the 2015 IEEE International Conference on Information and Automation, Lijiang, China, 8–10 August 2015; pp. 877–880. [Google Scholar] [CrossRef]
  25. Seada, N.A.; Mostafa, M.G.M. Automatic detection of coronaries ostia in computed tomography angiography volume data. Int. J. Res. Med. Sci. 2016, 4, 1–6. [Google Scholar] [CrossRef]
  26. Forman, C.; Piccini, D.; Grimm, R.; Hutter, J.; Hornegger, J.; Zenge, M.O. High-resolution 3D whole-heart coronary MRA: A study on the combination of data acquisition in multiple breath-holds and 1D residual respiratory motion compensation. Magn. Reson. Mater. Phys. Biol. Med. 2014, 27, 435–443. [Google Scholar] [CrossRef] [PubMed]
  27. Wetzl, J.; Schmidt, M.; Pontana, F.; Longère, B.; Lugauer, F.; Maier, A.; Hornegger, J.; Forman, C. Single-breath-hold 3-D CINE imaging of the left ventricle using Cartesian sampling. Magn. Reson. Mater. Physics. Biol. Med. 2017, 31, 19–31. [Google Scholar] [CrossRef] [PubMed]
  28. Liu, J.; Rapin, J.; Chang, T.C.; Lefebvre, A.; Zenge, M.; Mueller, E.; Nadar, M.S. Dynamic cardiac MRI reconstruction with weighted redundant Haar wavelets. In Proceedings of the 20th Annual Meeting ISMRM, Melbourne, Australia, 5 May 2012; International Society of Magnetic Resonance in Medicine: Melbourne, Australia, 2012; Volume 20, p. 4249. [Google Scholar]
  29. Woods, R.E.; Gonzalez, R.C. Real-Time Digital Image Enhancement. Proc. IEEE 1981, 69, 643–654. [Google Scholar] [CrossRef]
  30. Tomasi, C.; Manduchi, R. Bilateral Filtering for Gray and Color Images. In Proceedings of the Sixth International Conference on Computer Vision (IEEE Cat. No.98CH36271), Bombay, India, 7 January 1998; pp. 839–846. [Google Scholar] [CrossRef]
  31. Yoo, T.S. Insight into Images: Principles and Practice for Segmentation, Registration, and Image Analysis; AK Peters Ltd.: Natick, MA, USA, 2004. [Google Scholar]
  32. Gülsün, M.A.; Tek, H. Robust vessel tree modeling. Lect. Notes Comput. Sci. 2008, 5241 LNCS, 602–611. [Google Scholar] [CrossRef]
  33. Unberath, M.; Goppert, E.; Taubmann, O.; Maier, A. Mitigating Medialness Responses from Non-tubular Structures Using Entropy. In Proceedings of the 30th International Congress and Exhibition, Heidelberg, Germany, 21–25 June 2016; Lemke, H.U., Ed.; Springer: Berlin/Heidelberg, Germany, 2016; pp. 211–212. [Google Scholar]
  34. Sato, Y.; Nakajima, S.; Shiraga, N.; Atsumi, H.; Yoshida, S.; Koller, T.; Gerig, G.; Kikinis, R. Three-dimensional multi-scale line filter for segmentation and visualization of curvilinear structures in medical images. Med. Image Anal. 1998, 2, 143–168. [Google Scholar] [CrossRef]
  35. Soille, P. Morphological Image Analysis; Springer: Berlin/Heidelberg, Germany, 2004. [Google Scholar]
  36. Unberath, M.; Taubmann, O.; Hell, M.; Achenbach, S.; Maier, A. Symmetry, outliers, and geodesics in coronary artery centerline reconstruction from rotational angiography. Med. Phys. 2017, 44, 5672–5685. [Google Scholar] [CrossRef] [PubMed]
  37. Dijkstra, E.W. A note on two problems in connexion with graphs. Numer. Math. 1959, 1, 269–271. [Google Scholar] [CrossRef] [Green Version]
  38. Jandt, U.; Schäfer, D.; Grass, M.; Rasche, V. Automatic generation of 3D coronary artery centerlines using rotational X-ray angiography. Med. Image Anal. 2009, 13, 846–858. [Google Scholar] [CrossRef] [PubMed]
  39. Smith, L.I. A tutorial on Principal Components Analysis Introduction. Statistics 2002, 51, 52. [Google Scholar] [CrossRef]
  40. Hazewinkel, M. Encyclopaedia of Mathematics; Springer: Berlin/Heidelberg, Germany, 2002. [Google Scholar]
  41. Sujatha, B.; Sri Rama Krishna, K. An Analysis of Thinning & Skeletonization for Shape Representation. Int. J. Comput. Commun. Inf. Syst. 2010, 2, 976–1349. [Google Scholar]
  42. Schaap, M.; Metz, C.T.; van Walsum, T.; van der Giessen, A.G.; Weustink, A.C.; Mollet, N.R.; Bauer, C.; Bogunović, H.; Castro, C.; Deng, X.; et al. Standardized evaluation methodology and reference database for evaluating coronary artery centerline extraction algorithms. Med. Image Anal. 2009, 13, 701–714. [Google Scholar] [CrossRef] [PubMed] [Green Version]
  43. Dodge, J.T.; Brown, B.G.; Bolson, E.L.; Dodge, H.T. Lumen diameter of normal human coronary arteries. Influence of age, sex, anatomic variation, and left ventricular hypertrophy or dilation. Circulation 1992, 86, 232–246. [Google Scholar] [CrossRef] [PubMed]
  44. Forkert, N.D.; Schmidt-Richberg, A.; Fiehler, J.; Illies, T.; Möller, D.; Säring, D.; Handels, H.; Ehrhardt, J. 3D Cerebrovascular Segmentation Combining Fuzzy Vessel Enhancement and Level-Sets with Anisotropic Energy Weights. Magn. Reson. Imaging 2013, 31, 262–271. [Google Scholar] [CrossRef] [PubMed]
  45. Woźniak, T.; Strzelecki, M.; Majos, A.; Stefańczyk, L. 3D Vascular Tree Segmentation Using a Multiscale Vesselness Function and a Level Set Approach. Biocybern. Biomed. Eng. 2017, 37, 66–77. [Google Scholar] [CrossRef]
  46. Kocinski, M.; Materka, A.; Deistung, A.; Reichenbach, J.R. Centerline-Based Surface Modeling of Blood-Vessel Trees in Cerebral 3D MRA. In Proceedings of the 2016 Signal Processing: Algorithms, Architectures, Arrangements, and Applications (SPA), Poznan, Poland, 21–23 September 2016; pp. 85–90. [Google Scholar] [CrossRef]
  47. Schwemmer, C.; Forman, C.; Wetzl, J.; Maier, A.; Hornegger, J. CoroEval: A multi-platform, multi-modality tool for the evaluation of 3D coronary vessel reconstructions. Phys. Med. Biol. 2014, 59, 5163–5174. [Google Scholar] [CrossRef] [PubMed]
Figure 1. A schematic visualization of the processing pipeline. The numbers of the processing steps correspond to the respective sections.
Jimaging 04 00124 g001
Figure 2. Visualization of the preprocessing pipeline. (a) Original image, (b) contrast-enhanced image, (c) bilateral-filtered image, (d) and thresholded image.
Jimaging 04 00124 g002
Figure 3. An example of the response plots created by the ostia detection method. The vessel response plots for the two slices on the left hand side are displayed at the right in the respective colors. X and Y denote the detected peaks.
Jimaging 04 00124 g003
Figure 4. Evaluation results of the centerline extraction and curved planar reformation. (a) Overlap of the automated coronary centerline extraction. (b) Mean absolute error of the curved planar reformation.
Jimaging 04 00124 g004
Figure 5. Generated curved (top row) and multiplanar (bottom row) reformatted images without (a), (c) and with (b), (d), maximum intensity projection applied. Red and green arrows denote points were the application of MIPs improved vessel visualization.
Jimaging 04 00124 g005
Figure 6. Representative examples of the generated curved (ae) and multiplanar (fj) reformatted images.
Jimaging 04 00124 g006
Figure 7. Problems that are occurring in the course of the centerline extraction. (a) Early detection of the coronary ostia. The slice shows the closest visible cross section of the LCA to the aorta. The detected ostium is marked in blue and the expert annotated ostia are marked by red crosses. (b) An example of the interference of the left coronary artery with the left atrial appendage. The LCA’s branches are marked in red.
Jimaging 04 00124 g007