Article

Peach Flower Monitoring Using Aerial Multispectral Imaging

1
Department of Physics and Engineering, Northwest Nazarene University, Nampa, ID 83686, USA
2
Parma Research and Extension Center, University of Idaho, Parma, ID 83660, USA
*
Author to whom correspondence should be addressed.
J. Imaging 2017, 3(1), 2; https://doi.org/10.3390/jimaging3010002
Submission received: 25 October 2016 / Revised: 27 December 2016 / Accepted: 29 December 2016 / Published: 6 January 2017
(This article belongs to the Special Issue Image Processing in Agriculture and Forestry)

Abstract

:
One of the tools for optimal crop production is regular monitoring and assessment of crops. During the growing season of fruit trees, the bloom period has increased photosynthetic rates that correlate with the fruiting process. This paper presents the development of an image processing algorithm to detect peach blossoms on trees. Aerial images of peach (Prunus persica) trees were acquired from both experimental and commercial peach orchards in the southwestern part of Idaho using an off-the-shelf unmanned aerial system (UAS), equipped with a multispectral camera (near-infrared, green, blue). The image processing algorithm included contrast stretching of the three bands to enhance the image and thresholding segmentation method to detect the peach blossoms. Initial results showed that the image processing algorithm could detect peach blossoms with an average detection rate of 84.3% and demonstrated good potential as a monitoring tool for orchard management.

1. Introduction

Idaho is popularly known for potatoes, but the state grows other specialty crops which include peaches. Numerous types of peaches are grown in the southwestern part of Idaho, which is warmer as compared to other regions. The state produces about 5300 tons of peaches [1]. In addition to peaches, Idaho agriculture produces apples, pears, cherries, apricots, nectarines, plums and grapes. The specialty crop industry in Idaho is thriving. However, the industry is currently facing the challenges of labor shortage, increasing labor cost, and the pressure of a growing market. Because of these challenges, fruit growers need to adopt new technologies that can aid in optimizing crop production.
One of these new technologies, known as precision agriculture, is an agricultural management concept based on measuring crop variability in the field and responding to field issues [2]. Crop variability has both temporal and spatial components that need to be considered. The spatial component is facilitated by the use of the global positioning system (GPS), which enables the farmer to locate the precise location in the field. In combination with advanced sensors that could measure field conditions such as moisture levels, nitrogen levels, and organic matter content, it allows the creation of maps that show the spatial variability of the field.
Although precision agriculture has been used mostly for row crops such as corn and wheat, studies have shown that the technology has been adopted for specialty crops which include fruit trees [3]. One of the precision agriculture technologies that has been reported is remote sensing. Remote sensing can be implemented using a satellite or aerial system [4]. The downsides of using satellites are the cost for real-time, high-resolution images and the frequency of data collection, which could affect the temporal aspect of crop production [5]. Another remote sensing method is using aerial systems, which can be classified as manned or unmanned. Similar to satellites, a manned aerial system is costly, and it may not be economically feasible for smaller fields. However, with the proliferation of cheap commercial unmanned aerial systems (UAS) such as the 3DR Iris and DJI Phantom series (Figure 1), remote sensing using unmanned aerial systems can be very promising for fruit growers with small acreages.
A number of researchers have used unmanned aerial systems for civilian applications which include power line detection, roadway traffic monitoring, wetland analysis, and agriculture. Li et al. [6] developed an image processing algorithm for power line detection using Hough transform. A pulse-coupled neural filter was used to remove background noise before applying the Hough transform. Coifman et al. [7] investigated the use of UASs to monitor roadway traffic to facilitate offline planning and real-time management applications. A feasibility study by Ro et al. [8], which conducted a field experiment at a local interstate using UASs, concluded that UAS applications will become popular in the transportation area in the near future. The use of UAS photogrammetry provided a valuable and accurate enhancement to wetland delineation, classification, and health assessment [9].
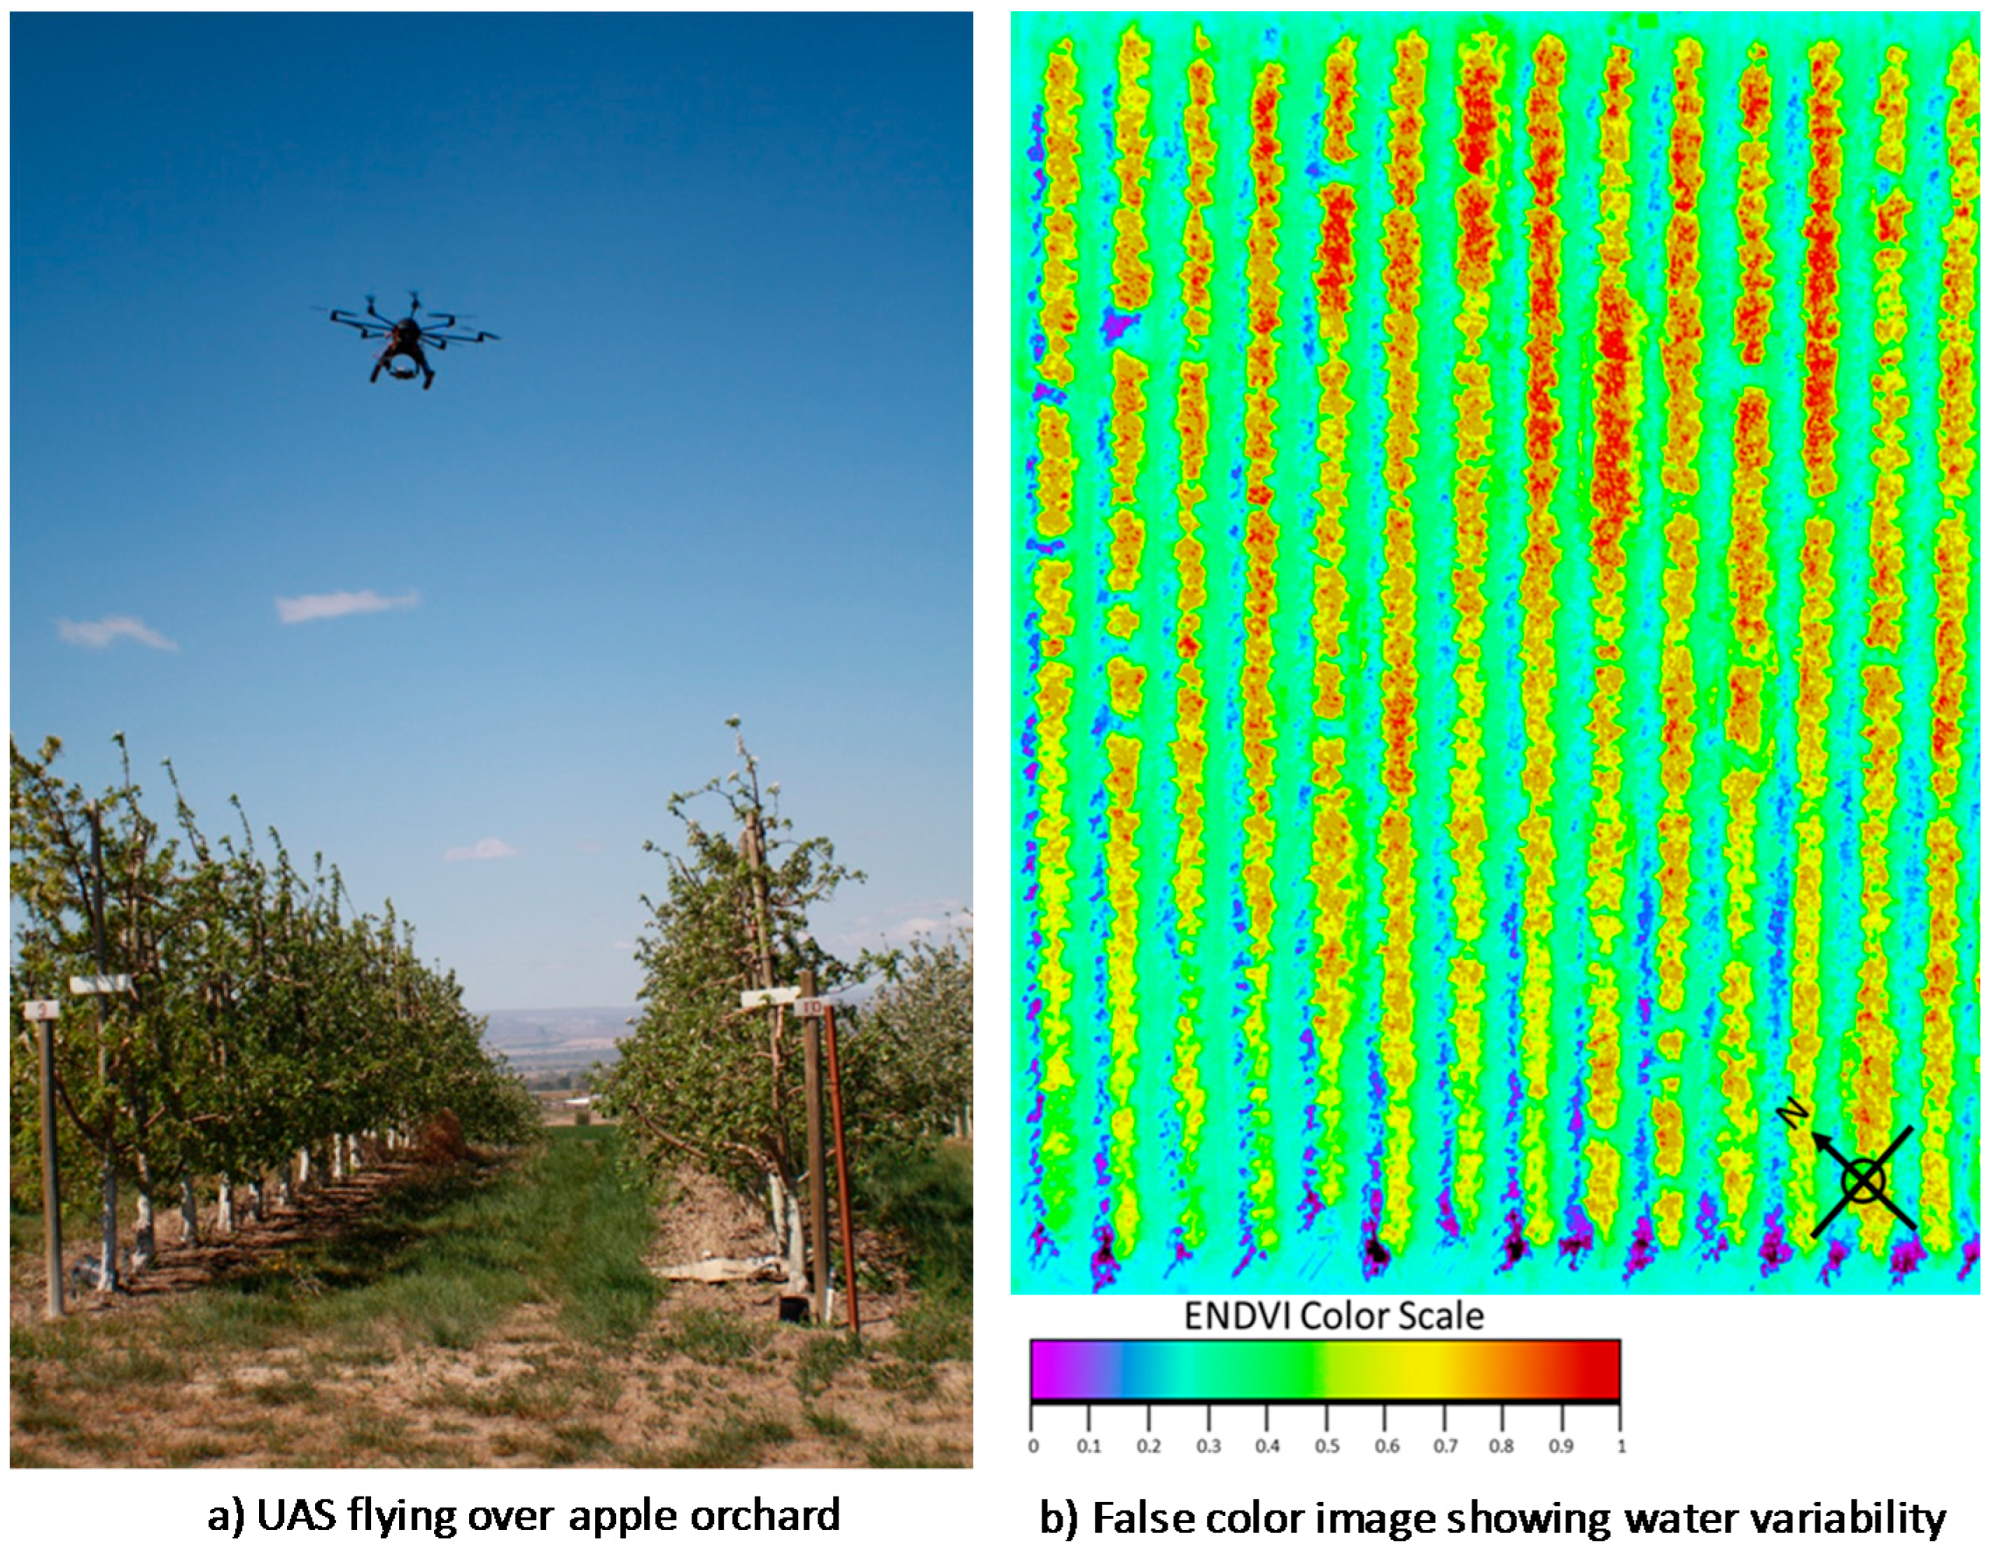
Another area that has received a lot of attention for UAS application is agriculture. One of the examples of the use of unmanned aerial systems (UASs) for fruit trees is the crop monitoring and assessment platform (C-MAP) developed at Northwest Nazarene University [10]. The C-MAP is composed of an off-the-shelf UAS equipped with a multispectral camera. Figure 2 shows one of the C-MAP UASs flying over an experimental apple orchard with different watering methods, a drip and a sprinkler. An image processing algorithm was developed in this study to calculate the enhanced normalized difference vegetation index (ENDVI), which is a combination of the near-infrared band, green band, and blue band, and generated a false color image. The red color region has high ENDVI while the blue color region has the lowest ENDVI values. The false color image clearly shows the variability of the field caused by the difference in water input [11].
In this paper, the application of CMAP is extended to the detection of blossoms of peaches using a customized image processing algorithm. It has been reported that there is an increase of photosynthetic activity during the bloom period, which correlates with the fruiting process [12]. Peaches follow a linear pattern of crop development each year that allows the farmers to manage the fruit production and make sure that the crop is progressing as it should. In addition, farmers scout the orchard during the blooming season and use the observed amount of blooms with other parameters including crop density and the number of leaves on trees to predict yield. Early prediction of yield helps growers in marketing their products and in the packing operations [13]. The objectives of this study are: (1) to expand the use of CMAP to detect peach blossoms; and (2) to develop an image processing algorithm to detect peach blossoms.

2. Materials and Methods

2.1. Target Field

The target fields in this study are an experimental peach orchard located north of Parma Idaho at the University of Idaho Research and Extension Center and a peach orchard located north of Marsing Idaho owned by Symms Fruit Ranch. Both orchards are located in the western part of the state of Idaho. The Parma orchard contains a variety of peach types, whereas the Symms orchard contains one type of peach (Prunus persica), which is the target crop in this study. The Parma orchard was approximately two acres and although the orchard at Symms was much larger, approximately only two acres were observed for the study.

2.2. Image Acquisition System

Two UASs were used in this study, both of which were DJI Phantom Quadcopters [14]. A DJI Phantom 3 Professional quadcopter was used to capture peach images in the RGB color spectrum. The camera for the DJI Phantom 3 Professional uses a 1 / 2.3 complementary metal-oxide semiconductor (CMOS) sensor with 12.4 megapixels (4000 × 3000). A DJI Phantom 3 Advanced was used to capture multispectral images of the peach orchard. The camera for the DJI Phantom 3 Advanced also uses a 1 / 2.3 CMOS sensor with 12.4 megapixels (4000 × 3000) but the camera was modified to capture near-infrared band centered at 750 nm, green band, and blue band. The two UASs were used to capture images in both orchards. Both DJI Phantom quadcopters utilized a navigation controller which could control the drone either manually or autonomously if interfaced with a tablet. A tablet with the DJI Go application software was used to connect and interface with the controller in order to calibrate the DJI drones and to allow for GPS and waypoint following during flights. The captured image files were written on two SD cards inside the drones and then a computer with MATLAB software was used to access and download the image files from the cards in order to perform image processing and analysis.

2.3. DroneDeploy

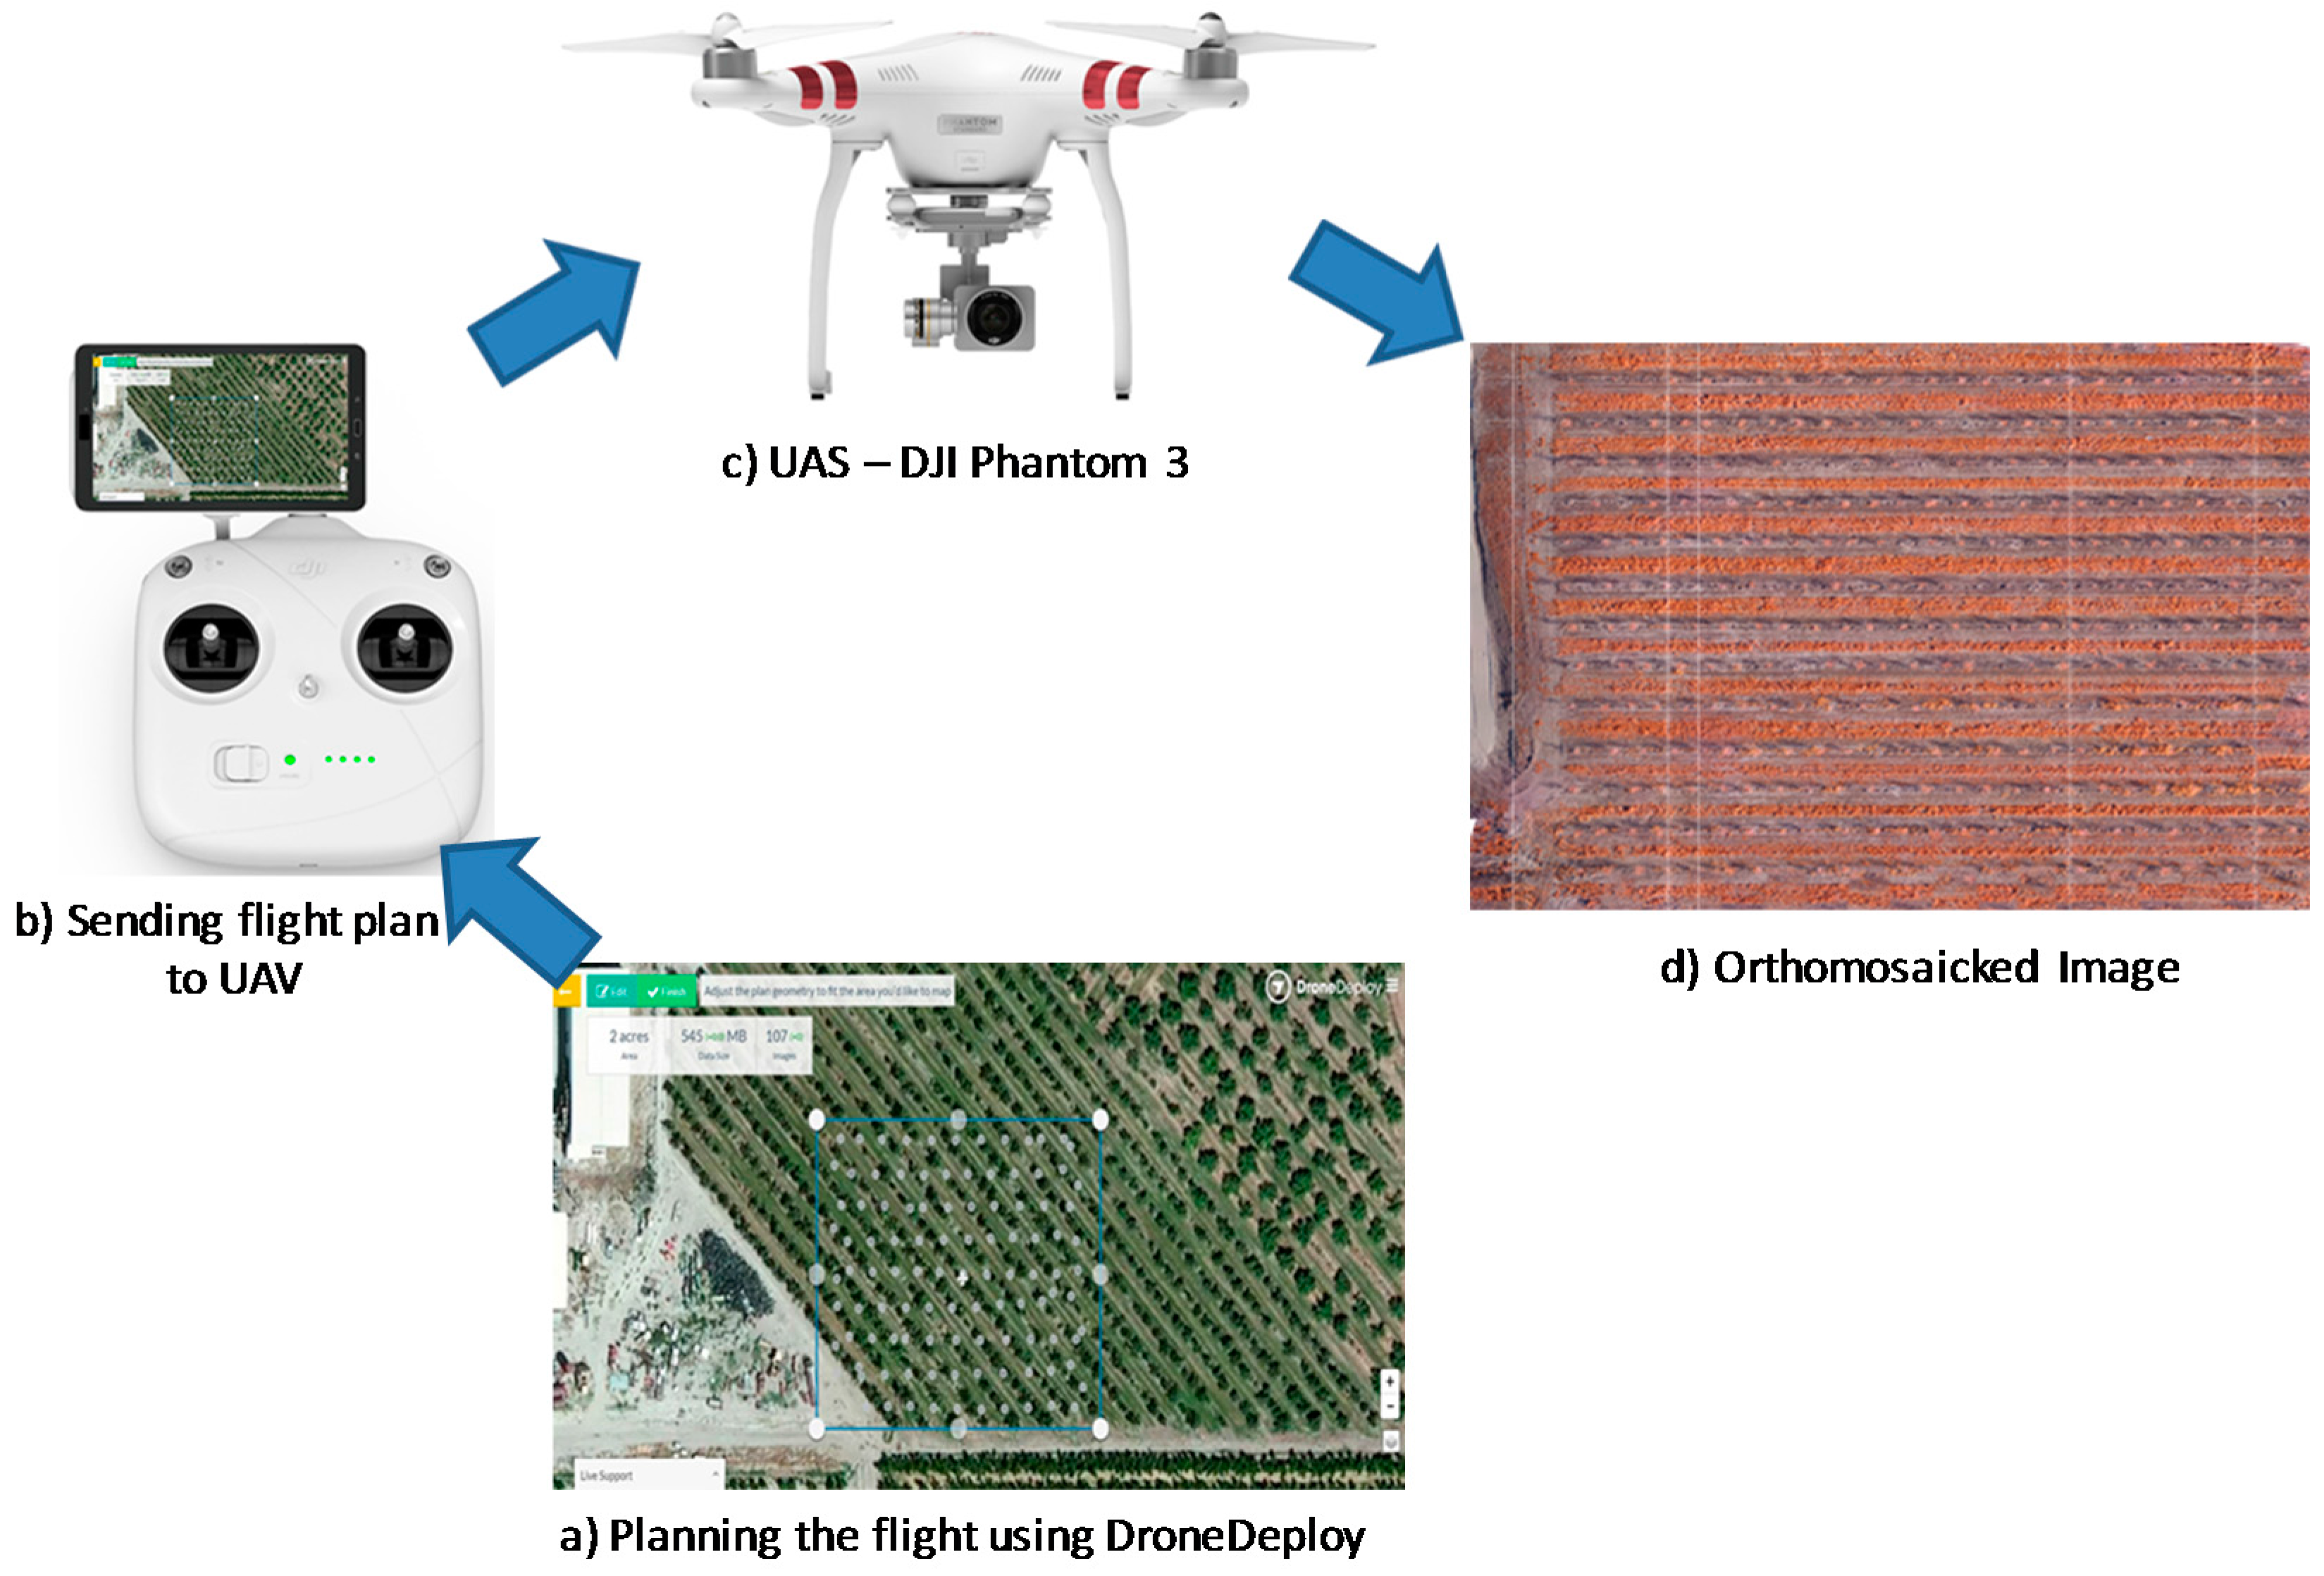
The software used on the tablet to collect the images was DroneDeploy [15]. DroneDeploy is a cloud-based software compatible with DJI Phantom 3 drones which uses Google Maps and GPS to construct a flight plan. Figure 3 shows the operation of the UAS using DroneDeploy. Once a drone is calibrated with the DJI Go app, a flight plan can be created in the DroneDeploy app at any given place as long as the device has Wi-Fi or a flight be loaded without Wi-Fi if the flights were pre-synced to the device beforehand. Using the touch display of the tablet, DroneDeploy allows for the user to tap and drag the boundaries of the flight zone overlaid over the desired region shown on Google maps. The figure shows how DroneDeploy works with the DJI Phantom.
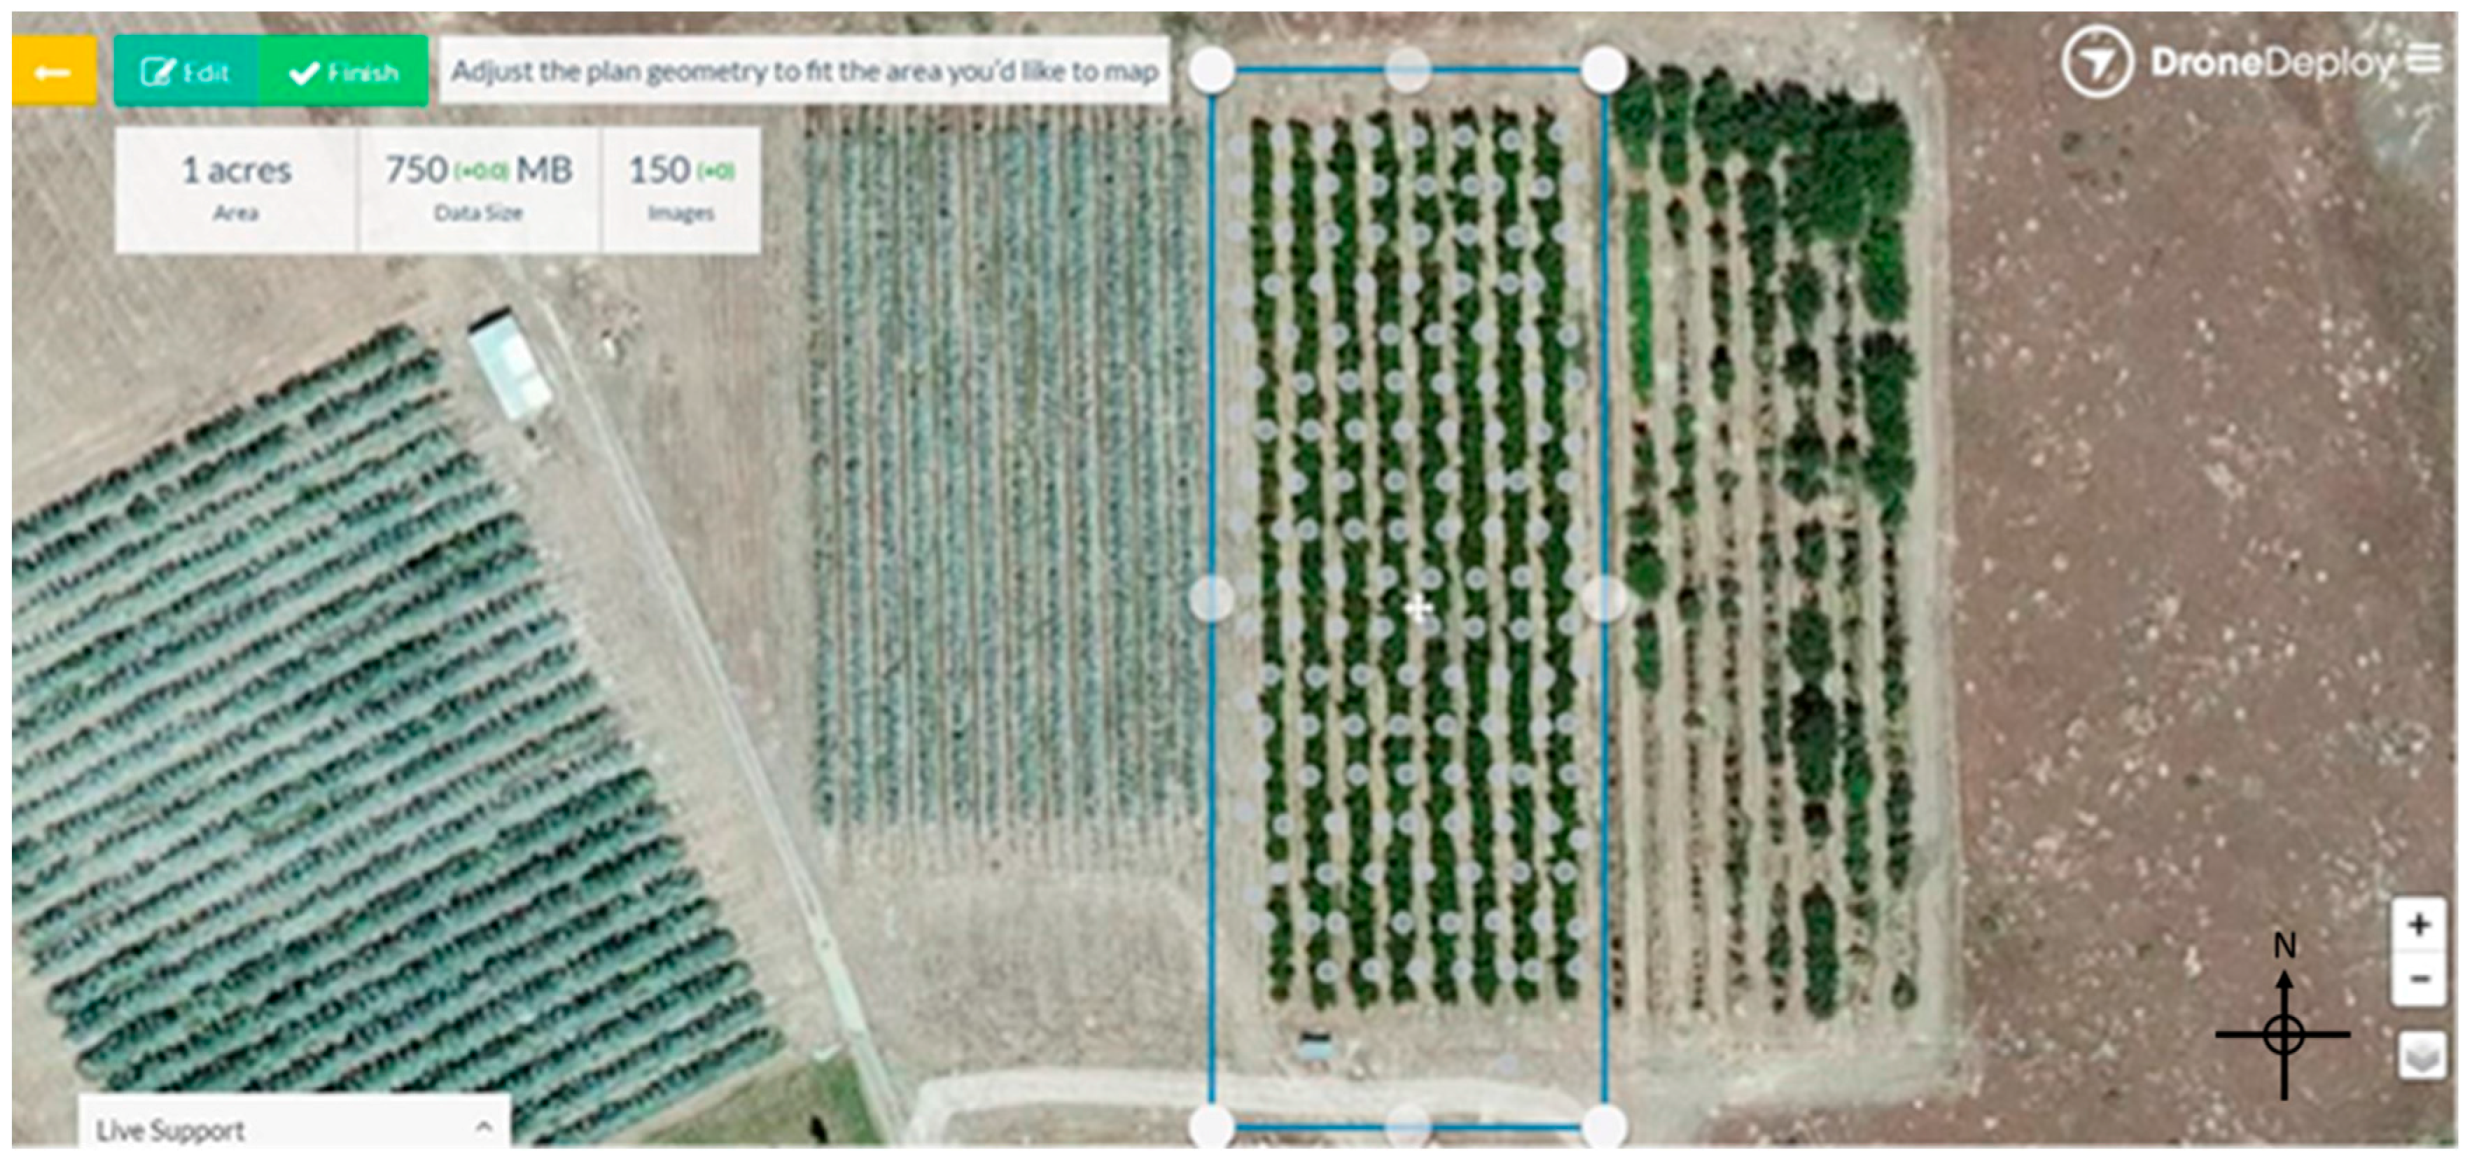
Figure 4 shows a screen shot of DroneDeploy, where the region enclosed by the blue rectangle is the desired field. DroneDeploy then plans the flight and calculates the position where to take the images in order to obtain pictures that cover the whole field, which is shown as grey dots on the figure. DroneDeploy also shows the coverage area, the number of images that will be taken, file size, and flight time when planning a flight. Once a flight plan is set, the DroneDeploy application allows for the user to adjust the altitude and the number of pictures the drone will take during the flight with Frontlap and Sidelap selections (Figure 5). Once the flight is initiated, DroneDeploy will automatically fly the drone along the given path and capture images at the given way points. Though the drone flies autonomously, the drone can be immediately switched back into manual flight by flipping the fight state switch on the controller. Once the images are taken, a computer accessing the DroneDeploy website can be used to upload the images and create an orthomosaic picture of the captured images.

2.4. Image Acquisition

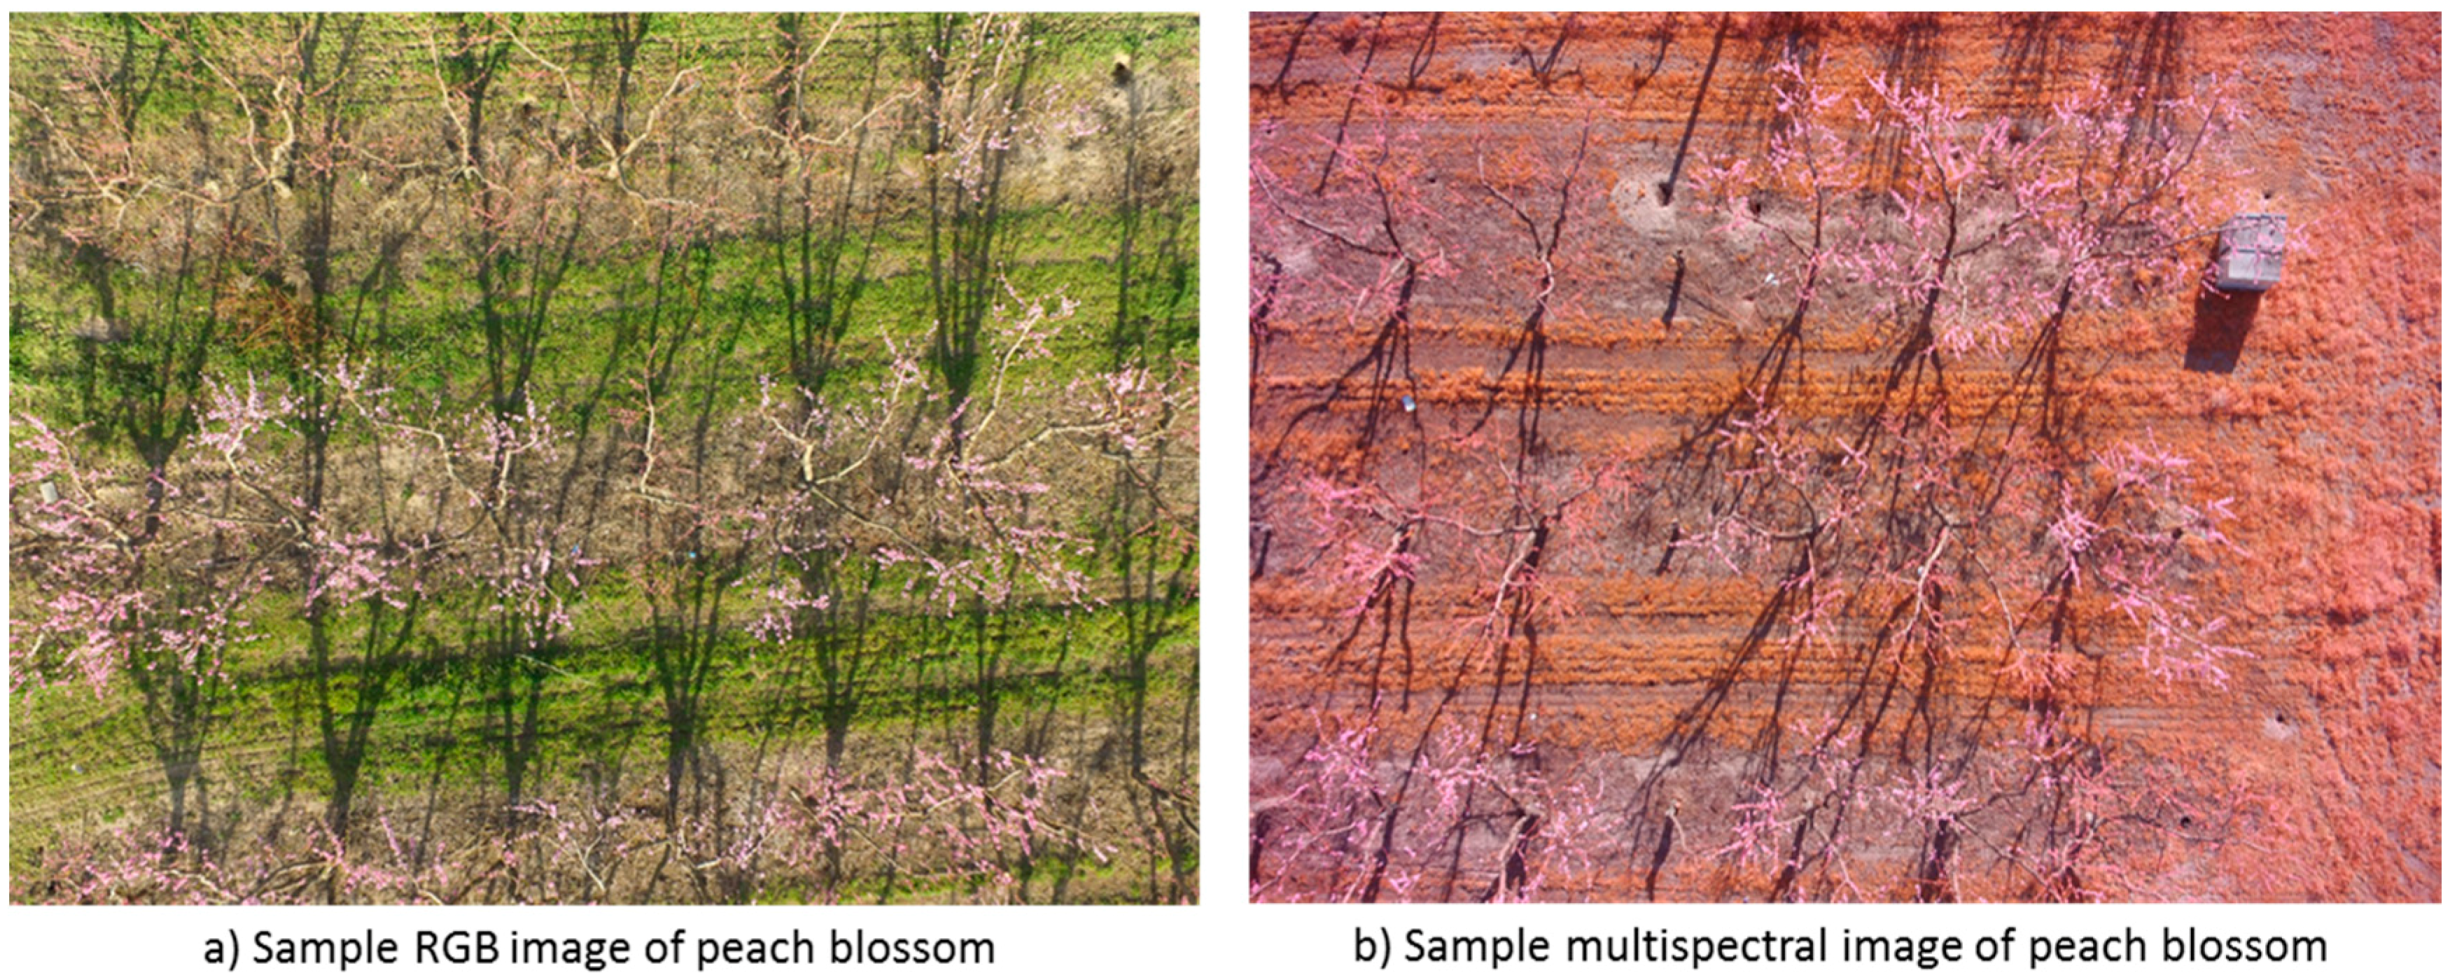
The images collected for this study were taken between the dates of 8 March 2016 and 20 April 2016. The pictures were taken every week except for the two weeks of bloom in which images were taken multiple days in a week. All data collection flights were dependent upon weather and solar conditions due to the impact they might have on the flight ability of the drones. All of the flights were completed between the times of 8 a.m. and 2 p.m. and were normally conducted with little to no wind. Although the conditions were clear skies, about half the images obtained were taken in cloudy weather. Sample images taken from the color camera and the modified camera are shown in Figure 6. Figure 6b shows a sample image acquired from the experimental field using the modified camera.

2.5. Image Processing and Analysis

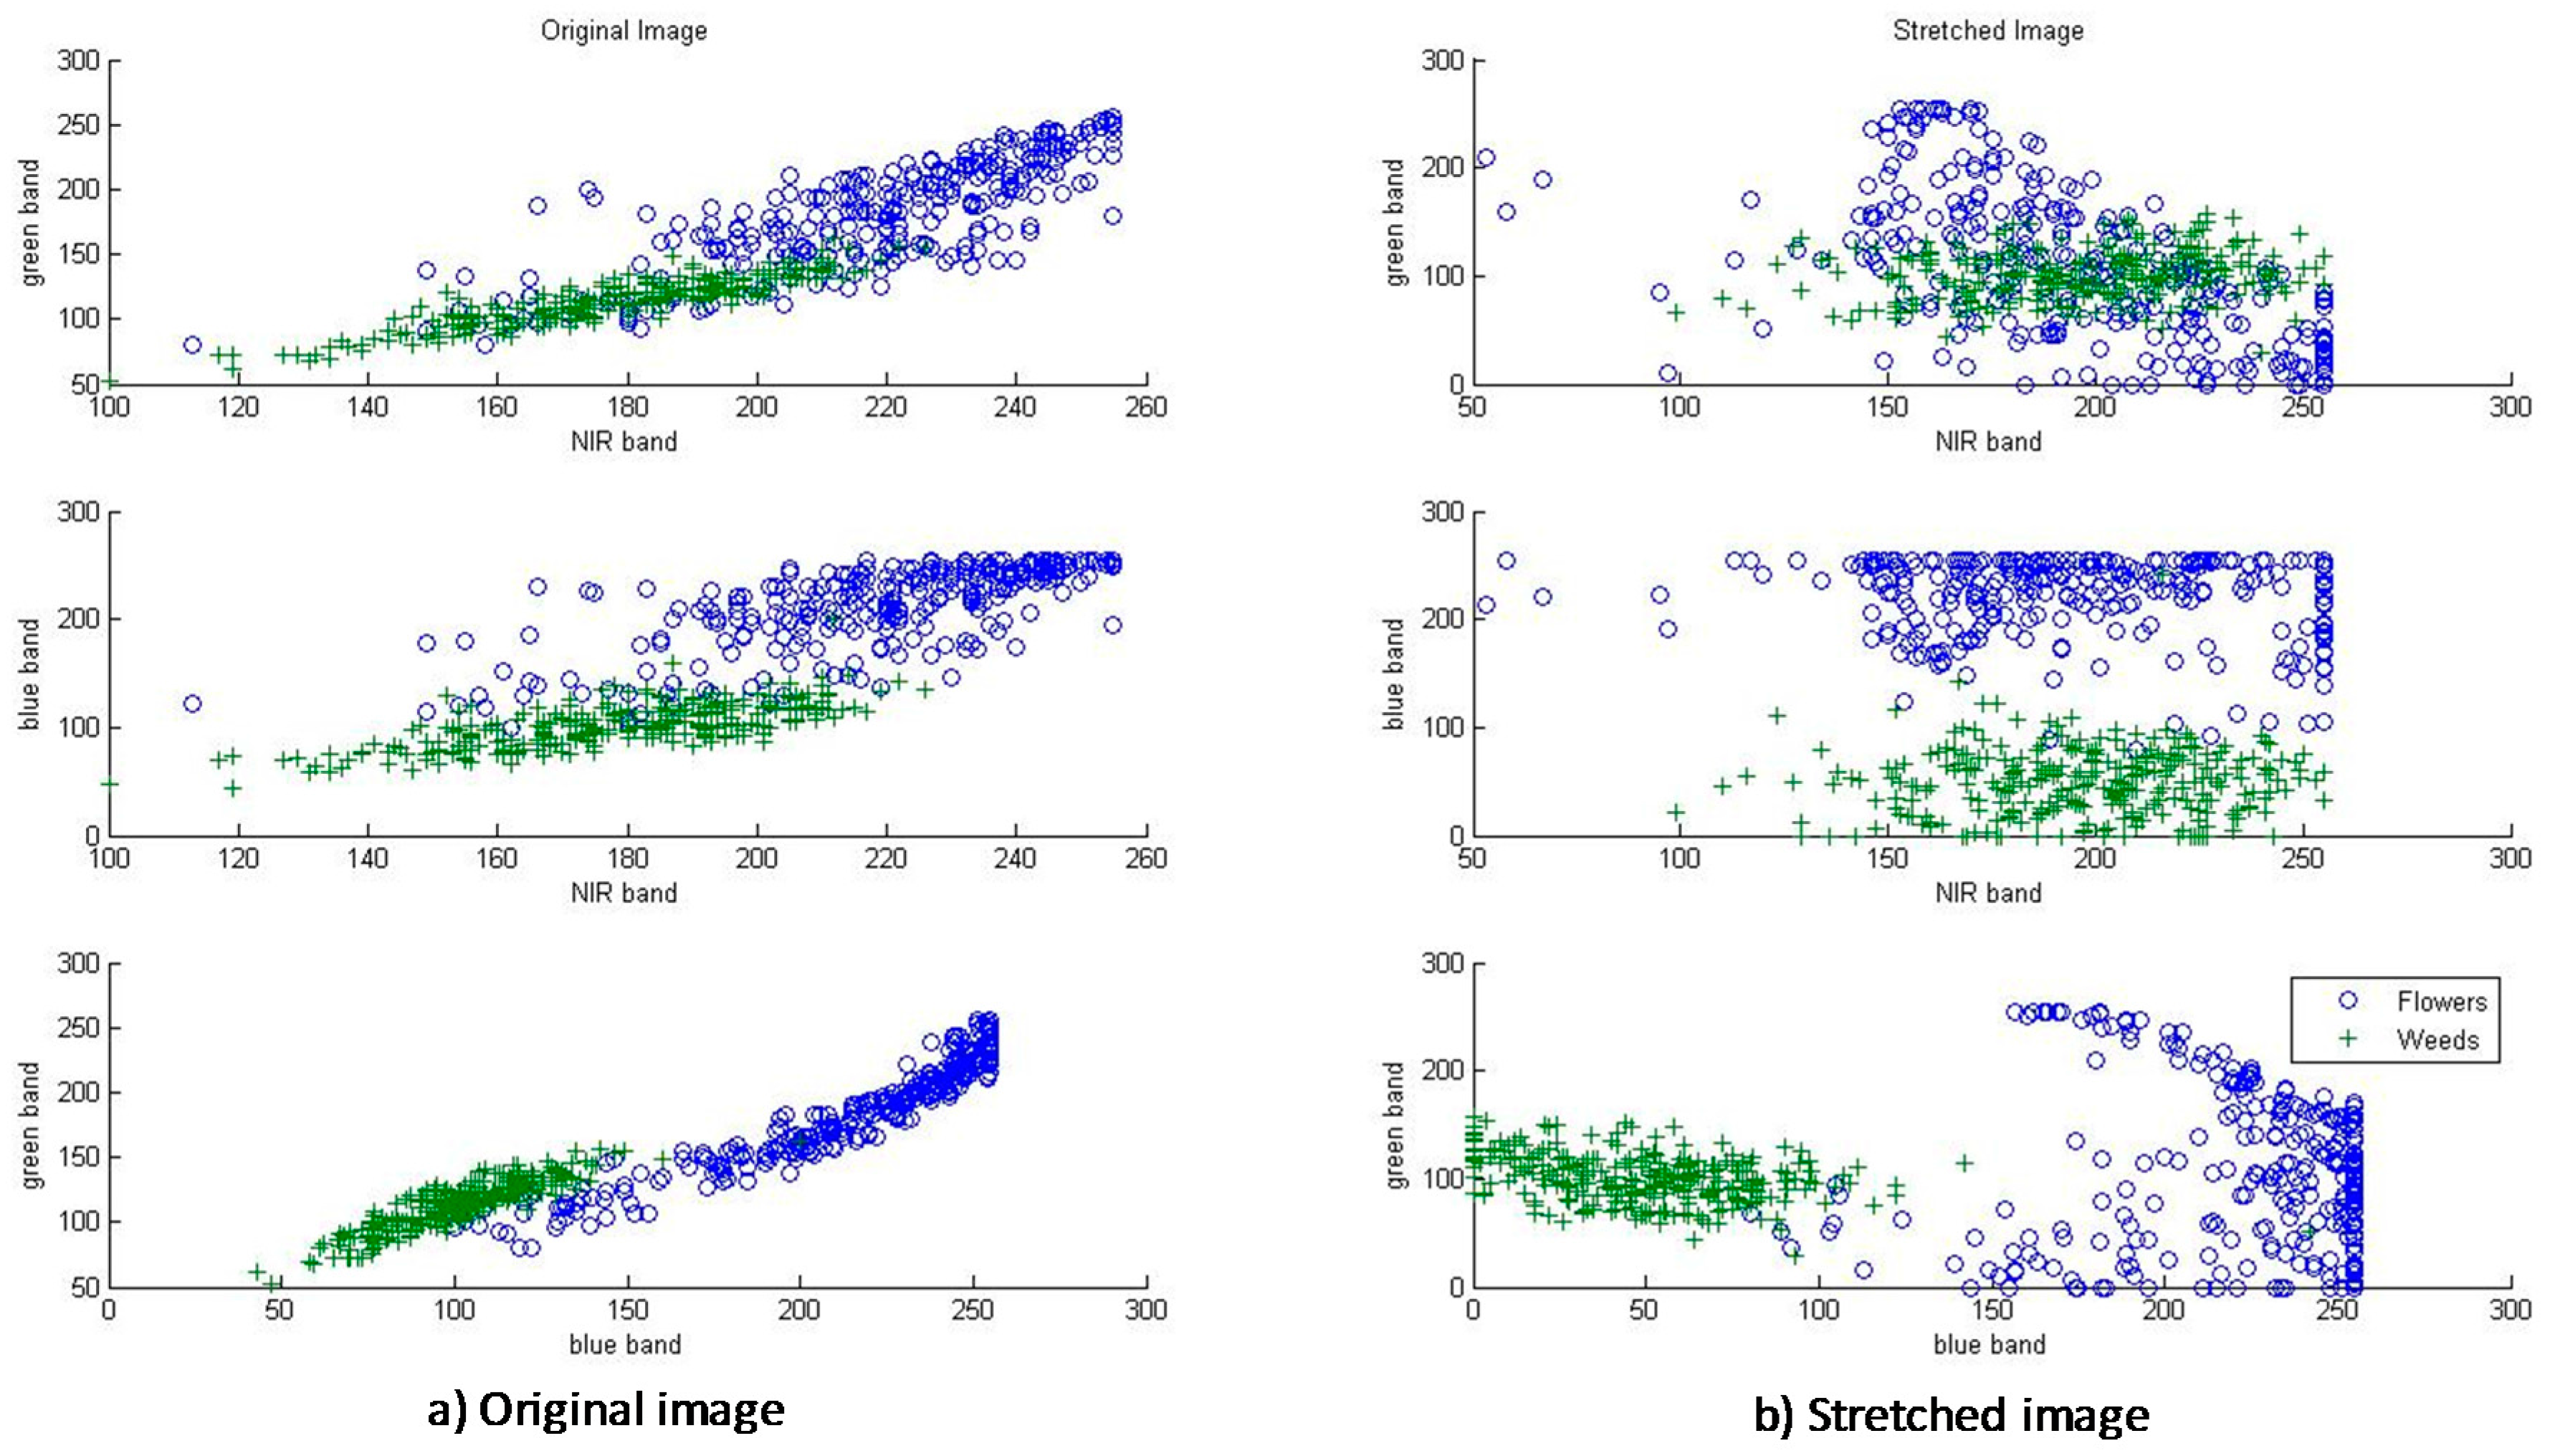
The acquired images were processed and analyzed using MATLAB and its Image Processing Toolbox. The focus of this paper is the processing of images from the multispectral images. The image processing involved the separation of the three bands and analyzing the color distribution. For the analysis of the color distribution, pixels of the peach blossoms and pixels of the ground (weeds) were manually selected and the pixel values of the three bands (NIR, green, and blue) were determined. The pixel values of the peach blossoms and the ground were plotted to show their distribution. Figure 7 shows the pixel value distribution of the blossom and the ground. Although we could easily draw a line and separate the peach blossom and ground, there is still some overlap between them. A contrast stretching operation was made on each band to improve the color difference between the blossom and the background [16]. Figure 7 shows the color distribution when the contrasts of each band were stretched. The near-infrared versus the blue band shows the separation between the two clusters. By using a very rudimentary thresholding process, the blossom could easily be segmented.

2.6. Peach Blossom Detection

Figure 8 shows the image processing algorithm to detect the peach blossom. The first step is to stretch the three bands individually and then combine them. A simple thresholding operation for the near-infrared and blue bands is used for the segmentation of the blossom from the background. The thresholded image g(x,y) is obtained as follows:
g ( x , y ) = { 1 i f   f b l u e ( x , y ) > 128   a n d   f N I R ( x , y ) > 128 0 i f   f b l u e ( x , y ) 128   a n d   f N I R ( x , y ) 128
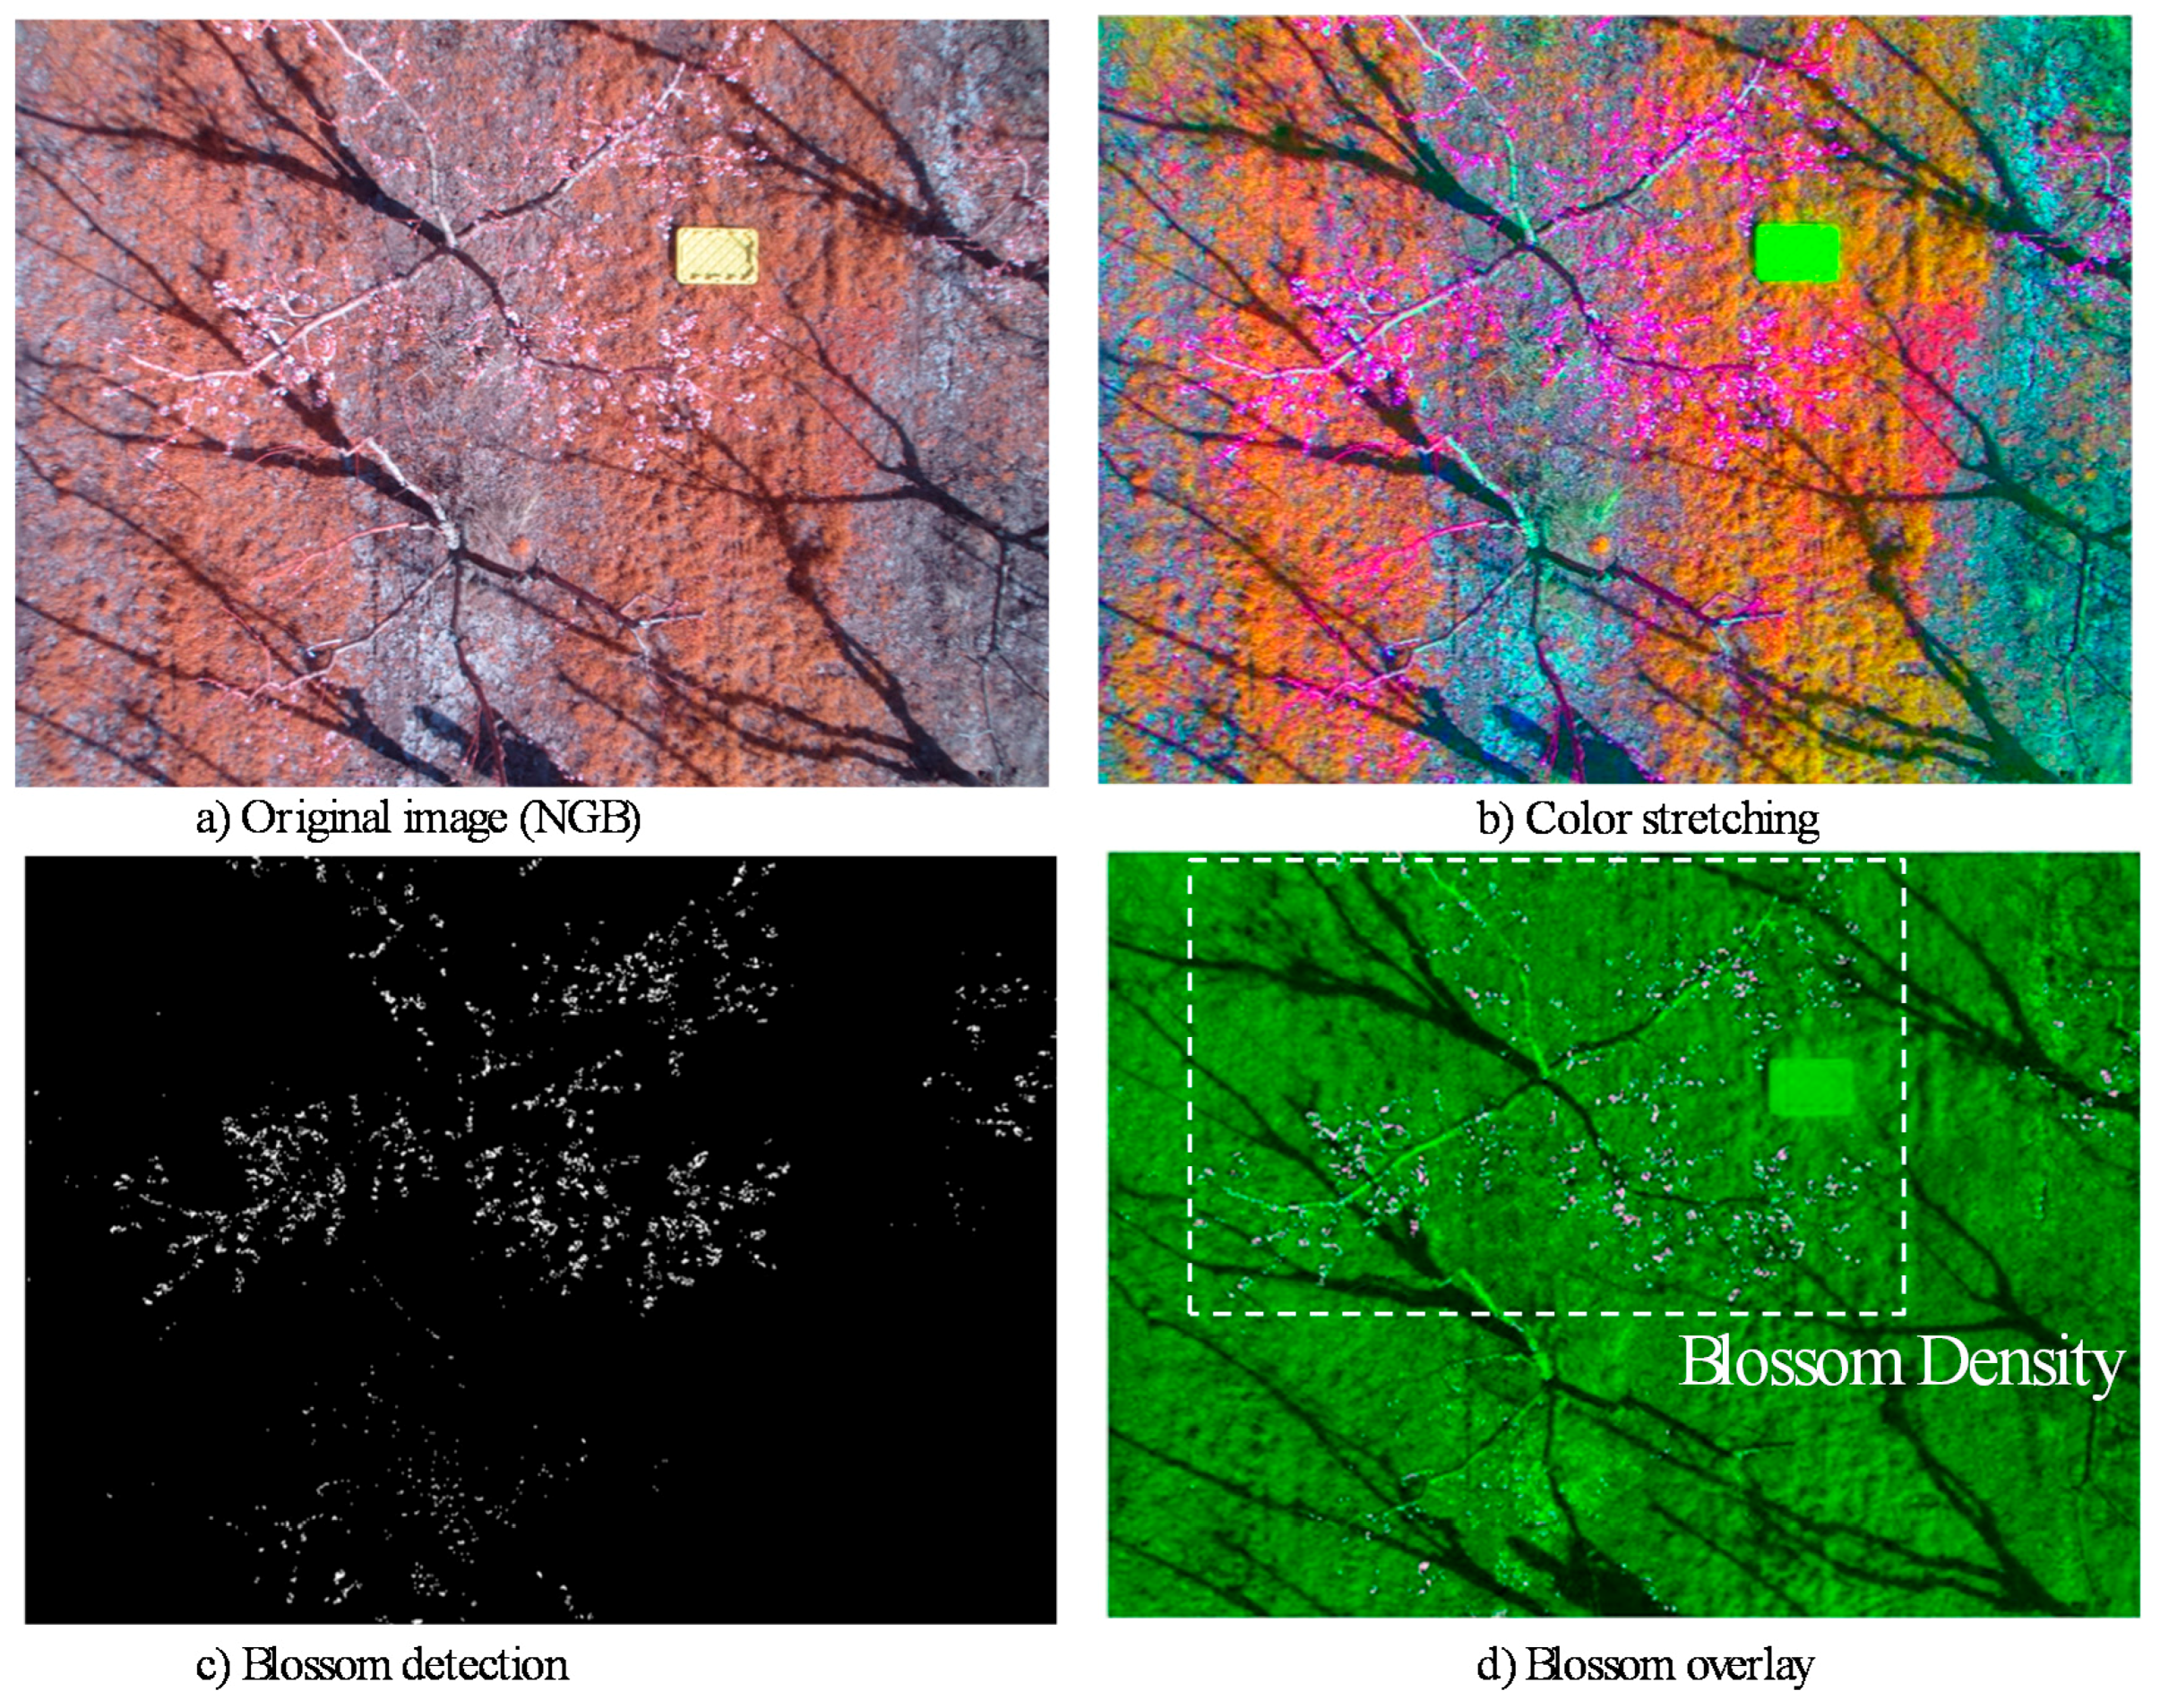
This segmentation process detects the blossom from the multispectral image. Figure 9 shows the image processing results. After the thresholding operation, a morphological size filtering process was used to remove “salt and pepper” noise. The overlaid image demonstrates the high success rate of detecting the blossom from the image.
The success rate of the blossom detection algorithm was evaluated using 20 randomly selected test images. The peach blossoms in the test images were manually identified and an evaluation mask was created for each test image. The success rate was calculated as follows:
s u c c e s s   r a t e = n u m b e r   o f   b l o s s o m   p i x e l s   f r o m   b l o s s o m   d e t e c t i o n   a l g o r i t h m n u m b e r   o f   b l o s s o m   p i x e l s   f r o m   t e s t   i m a g e   m a s k × 100 %

3. Results and Discussion

The results from the peach blossom detection algorithm showed that the blossoms were properly segmented from the raw multispectral image, with an average detection success rate of 84.3%. One of the reasons for the effective blossom detection is the use of the modified multispectral camera. With the modified filter of the camera, objects with high chlorophyll will have high reflectance in the near-infrared and green bands, but low reflectance in the blue band. In the image, the weeds have a red-brown hue because of the high chlorophyll content as compared with the other objects in the image. The colors of the peach blossoms are composed of a white and light pink hue. Some of the blossoms have a hue similar to that of the branch and some part of the ground. It can also be observed in Figure 7 that the light color of the blossom shows the high amount of near-infrared, green, blue values as compared to the weeds. Furthermore, the contrast stretching operation helped the thresholding process by increasing the separation of the pixel values between the blossoms and the ground specifically in the blue band. The contrast stretching did not affect the distribution in the near-infrared band. On the other hand, the morphological size filtering operation may have affected the detection success rate by removing small blossom pixels that were considered noise. However, the noise filtering operation was required to remove noise pixels.
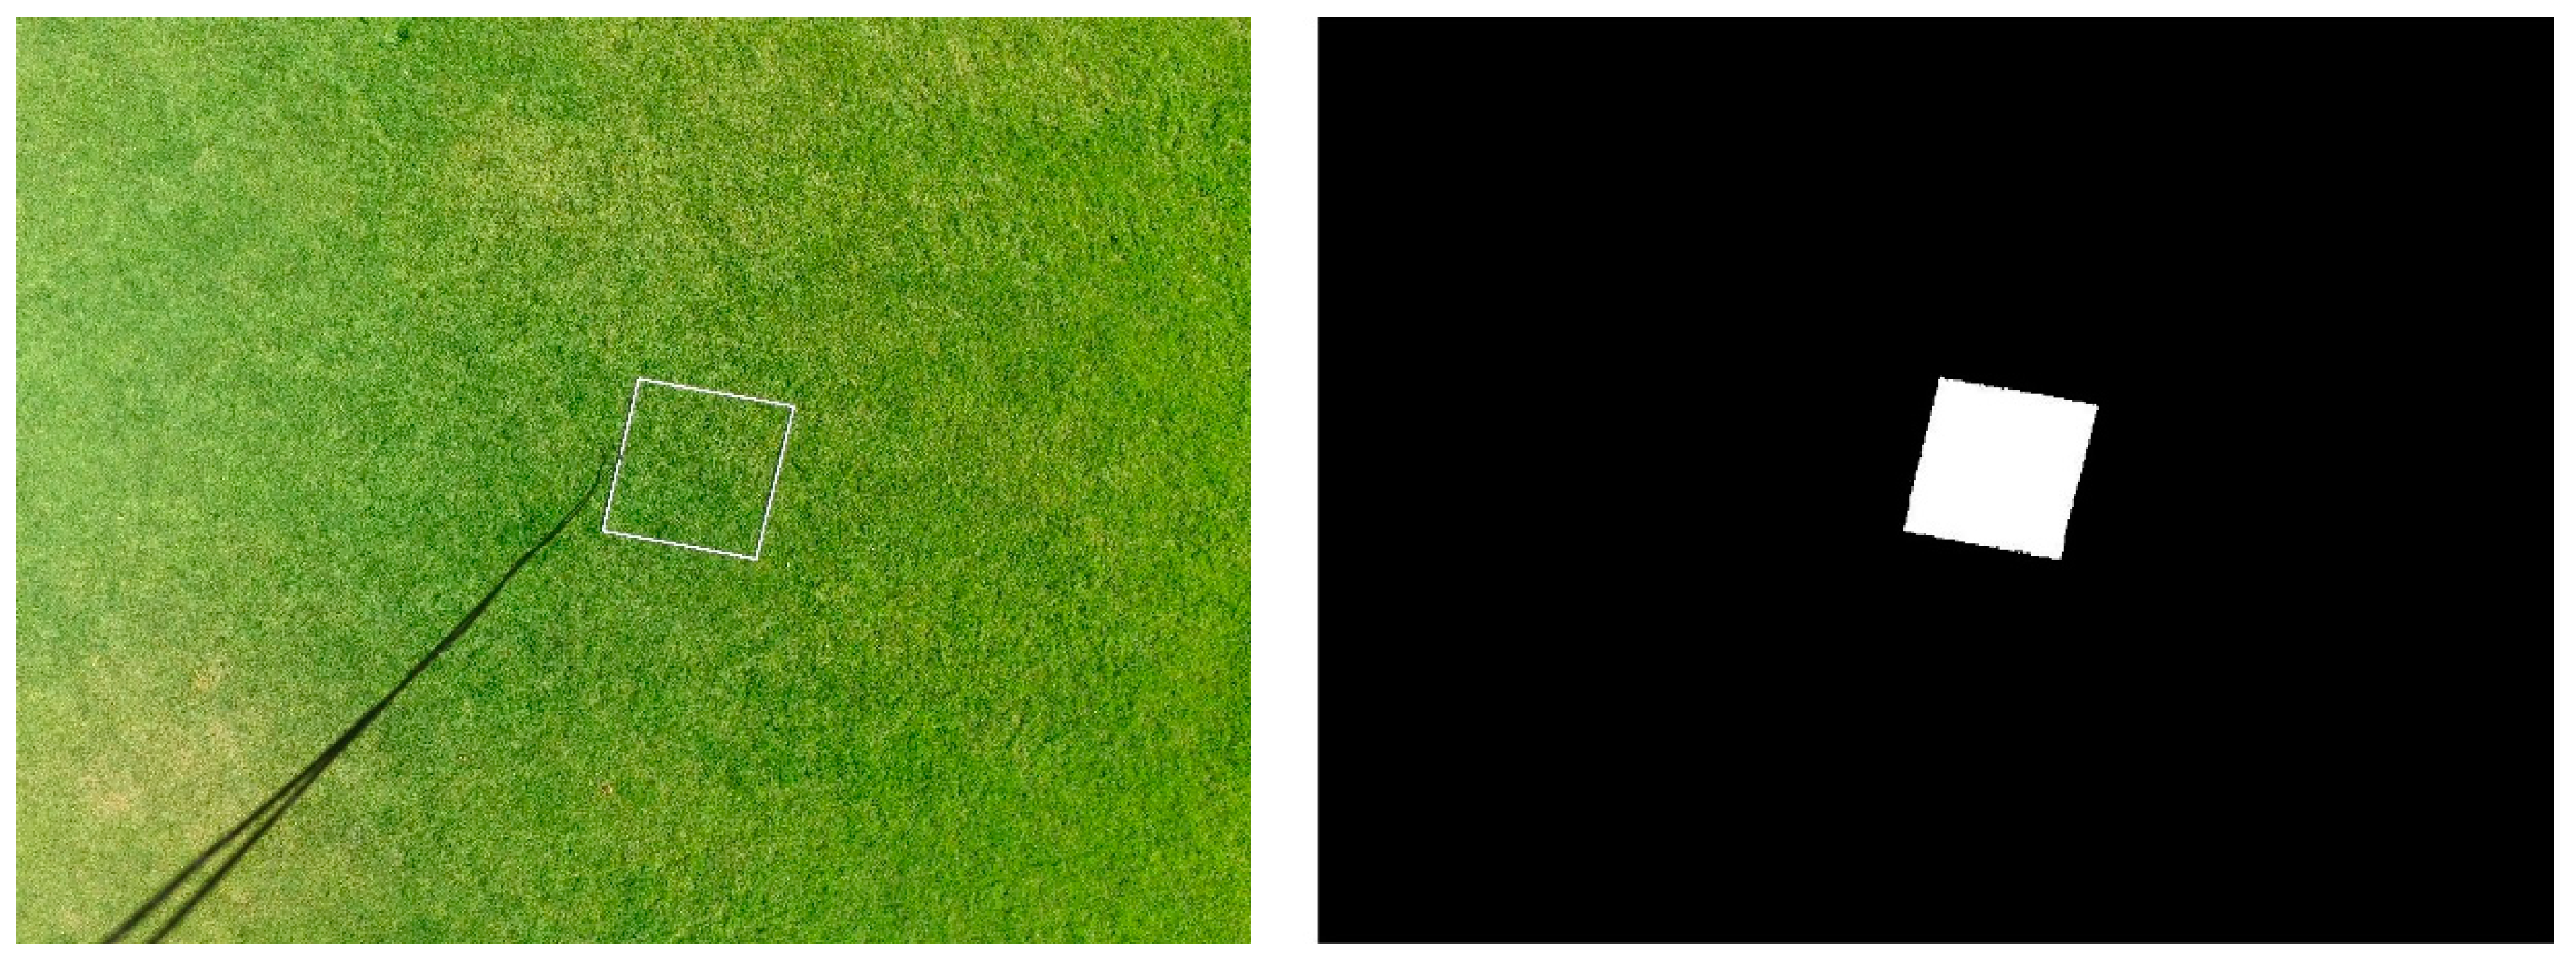
Using the binary image of the blossom detection algorithm, the blossom density could be generally approximated by doing a series of calculations. Knowing the approximate height above the blossoms at which the pictures were taken, and having the images from the drone being flown over a known 2 m × 2 m square PVC pipe at that height, the density of the blossoms could be obtained. Processing this image as shown in Figure 10, the number of square meters per pixel was found for that given height, which could then be applied to the binary peach blossom detection images, yielding an approximate density of the blossoms in square units. Using the flying height of 10 m, the size of the PVC square, and the image spatial resolution of 4000 × 3000 pixels, the approximate coverage area was 600 square meters. When the density of the peach blossoms was correlated to the square units, the result would not be perfect, but as long as the height of the images was consistent across all images, a correlation to fruit yield could be attempted.
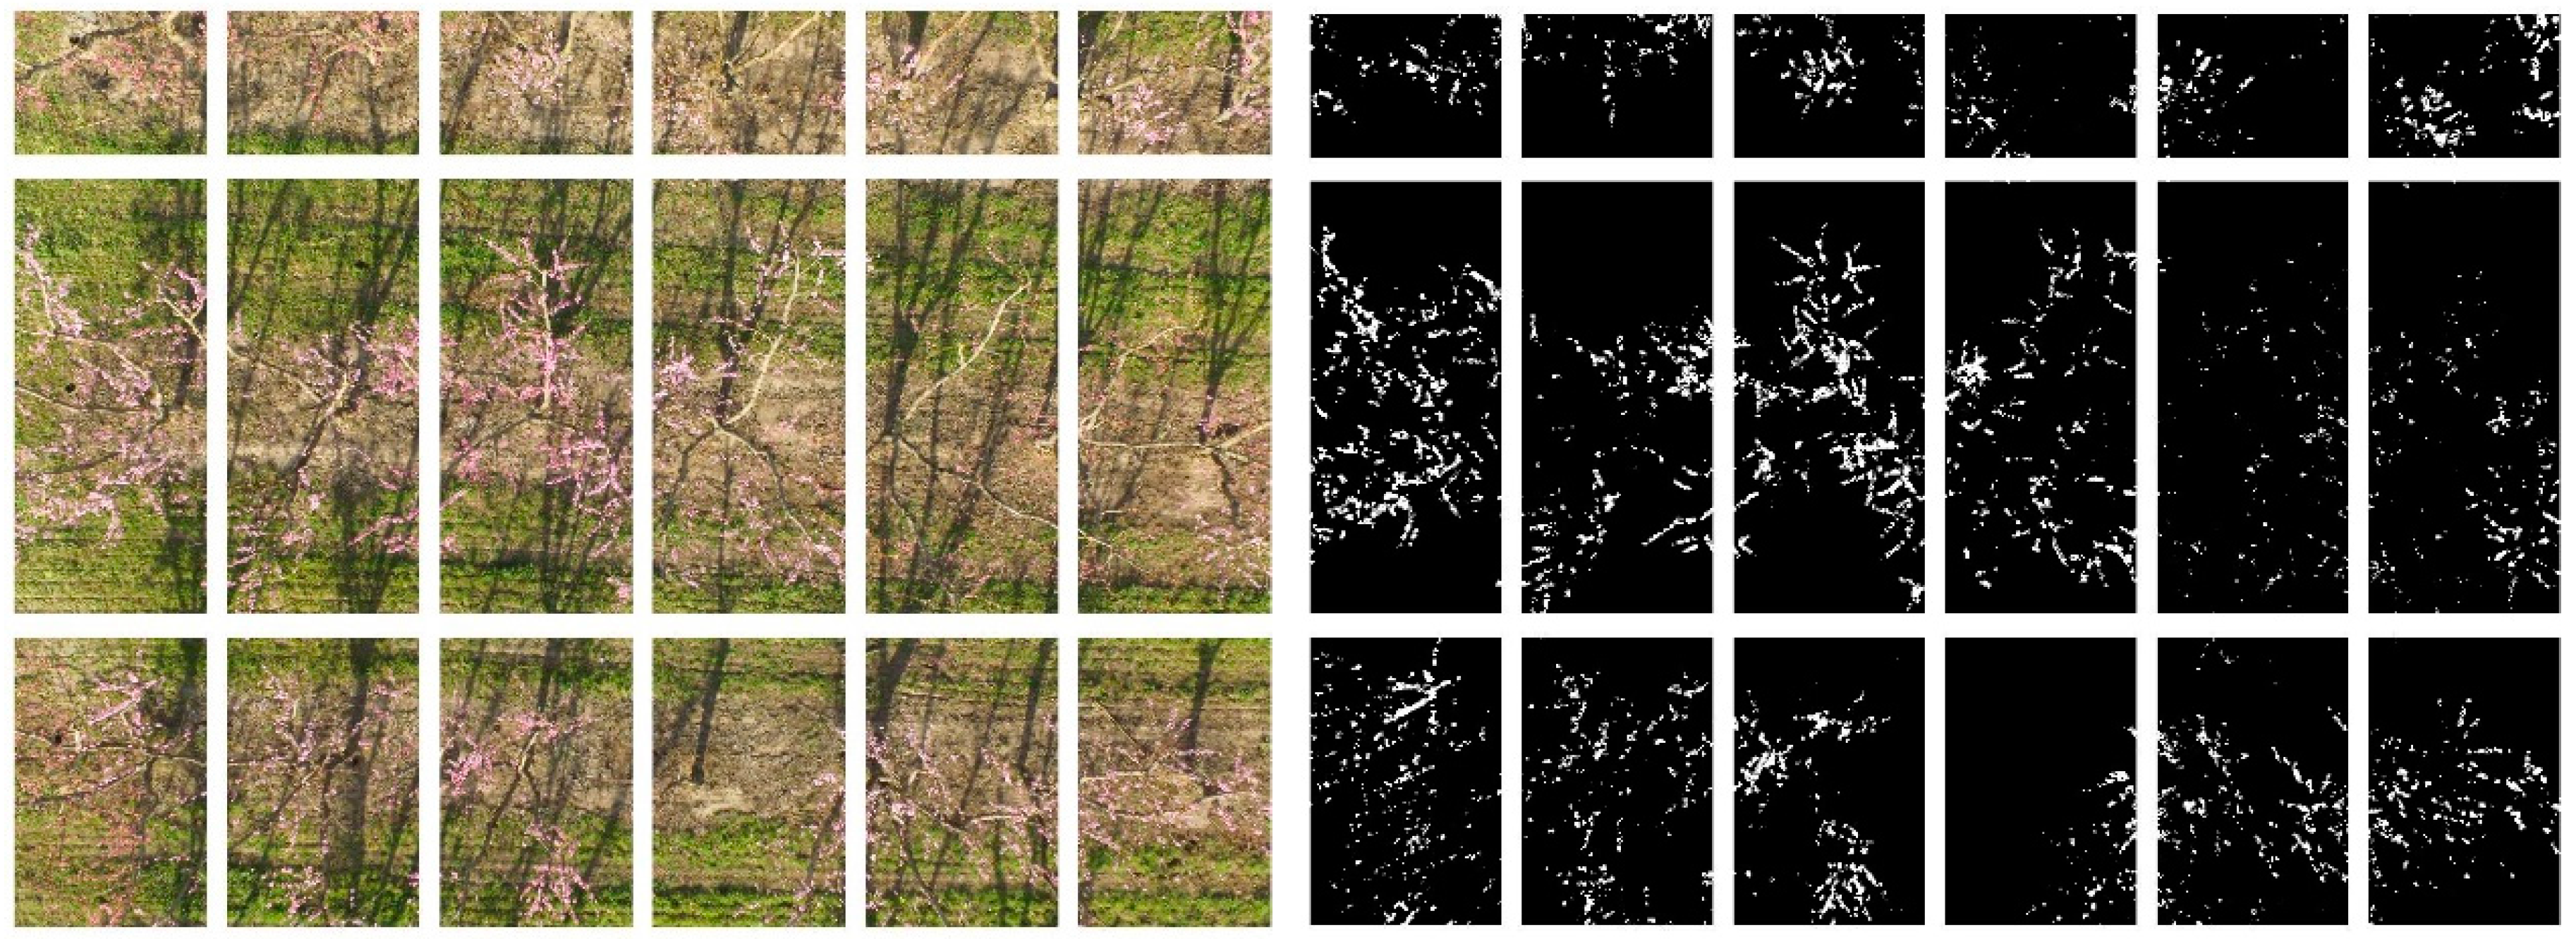
Since the peach trees are planted at about 3 m intervals, the trees in the images were separated by creating a grid over the image and putting the trees in individual boxes. Figure 11 shows the result of this grid as well as the resulting peach segmentation over the image. The blossom density from each tree can then be estimated by doing a pixel count in each box.
Although such a process of tree segmentation could not be done for every image and would be very inaccurate, future work of this study will involve the detection of individual trees by way of boundaries. Using the boundaries, the blossom density of each tree would then be directly and accurately calculated. A blossom density map can then be produced, which could be used to aid yield estimation and other subsequent orchard management operations. The farmer could also use the blossom density map to provide a temporal analysis of the orchard blossoms.

4. Conclusions

An image processing algorithm was developed to detect blossoms on peach trees. The image acquisition system used an on-the-shelf UAS, the DJI Phantom 3. The UAS camera was modified to allow near-infrared, green, and blue bands. Images from experimental and commercial peach orchards were used as target fields. The DroneDeploy software was used to plan the flight path, collect the images, and for image mosaicking. The image processing analysis showed that contrast stretching of the images’ three bands enhanced the color of the blossoms from the background. A very basic thresholding segmentation method was used to segment the blossoms. Initial results showed that the blossoms can be detected using the thresholding operation with an average detection rate of 84.3%. Future study will involve the improvement of blossom density calculation and the development of an algorithm for exact tree segmentation.

Acknowledgments

This research was supported by the Idaho State Department of Agriculture (Idaho Specialty Crop Block Grant 2014) and Northwest Nazarene University.

Author Contributions

Duke Bulanon conceived the study, created the literature review, designed the experiments, processed the collected data and wrote the paper. Ryan Horton and Esteban Cano acquired the images, developed the image processing algorithms, and processed the data. Esmaeil Fallahi designed the target orchard and its treatment, and supervised during the data collection.

Conflicts of Interest

The authors declare no conflict of interest.

Abbreviations

The following abbreviations are used in this manuscript:
C-MAPCrop monitoring and assessment platform
ENDVIEnhanced Normalized Difference Vegetation Index
GPSGlobal positioning system
NGBNear infrared, Green, Blue
NIRNear infrared
PVCPolyvinyl chloride
RGBRed, Green, Blue
UASUnmanned aerial system

References

  1. USDA-National Agriculture Statistics Service. State Agriculture Overview (Idaho). Available online: https://www.nass.usda.gov/Quick-Stats/Ag-Overview/stateOverview.php?state=IDAHO (accessed on 30 April 2016).
  2. Downey, D.R.; Ehsani, K.; Giles, S.; Haneklaus, D.; Karimi, K.; Panten, F.; Pierce, E.; Schnug, D.C.; Slaughter, S.; Upadhyaya, D. Advanced Engineering Systems for Specialty Crops: A Review of Precision Agriculture for Water, Chemical, and Nutrient Application, and Yield Monitoring. Landbauforsch.—VTI Agric. For. Res. 2010, 340, 1–88. [Google Scholar]
  3. Lee, W.S.; Alchanatis, V.; Yang, C.; Hirafuji, M.; Moshou, D.; Li, C. Sensing technologies for precision specialty crop production. Comput. Electron. Agric. 2010, 74, 2–33. [Google Scholar] [CrossRef]
  4. Pajares, G. Overview and current status of remote sensing applications based on Unmanned Aerial Vehicles (UAVs). Photogramm. Eng. Remote Sens. 2015, 81, 281–329. [Google Scholar] [CrossRef]
  5. Johnson, A.K.L.; Kinsey-Henderson, A.E. Satellite-based remote sensing for monitoring Baath land use in sugar industry. Proc. Aust. Soc. Sugar Cane Technol. 1997, 19, 237–245. [Google Scholar]
  6. Li, Z.; Liu, Y.; Walker, R.; Hayward, R.; Zhang, J. Towards automatic power line detection for a UAV surveillance system using pulse coupled neural filter and an improved Hough transform. Mach. Vis. Appl. 2010, 21, 677–686. [Google Scholar] [CrossRef] [Green Version]
  7. Coifman, B.; McCord, M.; Mishalani, R.G.; Iswalt, M.; Ji, Y. Roadway traffic monitoring from an unmanned aerial vehicle. IEEE Proc. Intell. Trans. Syst. 2006, 153, 11–20. [Google Scholar] [CrossRef]
  8. Ro, K.; Oh, J.S.; Dong, L. Lessons learned: Application of small UAV for urban highway traffic monitoring. In Proceedings of the 45th AIAA Aerospace Sciences Meeting and Exhibit, Reno, NV, USA, 8–11 January 2007; pp. 2007–2596.
  9. Boon, W.A.; Greenfield, R.; Tesfamichael, S. Wetland Assessment Using Unmanned Aerial Vehicle (UAV) Photgrammetry. In Proceedings of the International Archives of the Photogrammetry, Remote Sensing and Spatial Information Sciences, XXIII ISPRS Congress, Prague, Czech Republic, 12–19 July 2016.
  10. Bulanon, D.M.; Horton, M.; Salvador, P.; Fallahi, E. Apple Orchard Monitoring Using Aerial Multispectral Imaging; ASABE Paper No. 1913165; American Society of Agricultural and Biological Engineers (ASABE): St. Joseph, MI, USA, 2014. [Google Scholar]
  11. Bulanon, D.M.; Lonai, J.; Skovgard, H.; Fallahi, E. Evaluation of different irrigation methods for an apple orchard using an aerial imaging system. ISPRS Int. J. Geo-Inf. 2016, 5, 79. [Google Scholar] [CrossRef]
  12. Fujii, J.A.; Kennedy, R.A. Seasonal changes in the photosynthetic rate in apple trees—A comparison between fruiting and nonfruiting trees. Plant Pysiol. 1985, 78, 519–524. [Google Scholar] [CrossRef]
  13. Aggelopoulou, K.D.; Wulfsohn, D.; Fountas, S.; Gemtos, T.A.; Nanos, G.D.; Blackmore, S. Spatial variation in yield and quality in a small apple orchard. Precis. Agric. 2010, 11, 538–556. [Google Scholar] [CrossRef]
  14. Da-Jiang Innovations (DJI). Available online: http://www.dji.com/products/phantom (accessed on 30 December 2016).
  15. DroneDeploy. Available online: https://www.dronedeploy.com/ (accessed on 30 December 2016).
  16. Gonzalez, R.C.; Woods, R.E. Digital Image Processing, 3rd ed.; Pearson: New York, NY, USA, 2007. [Google Scholar]
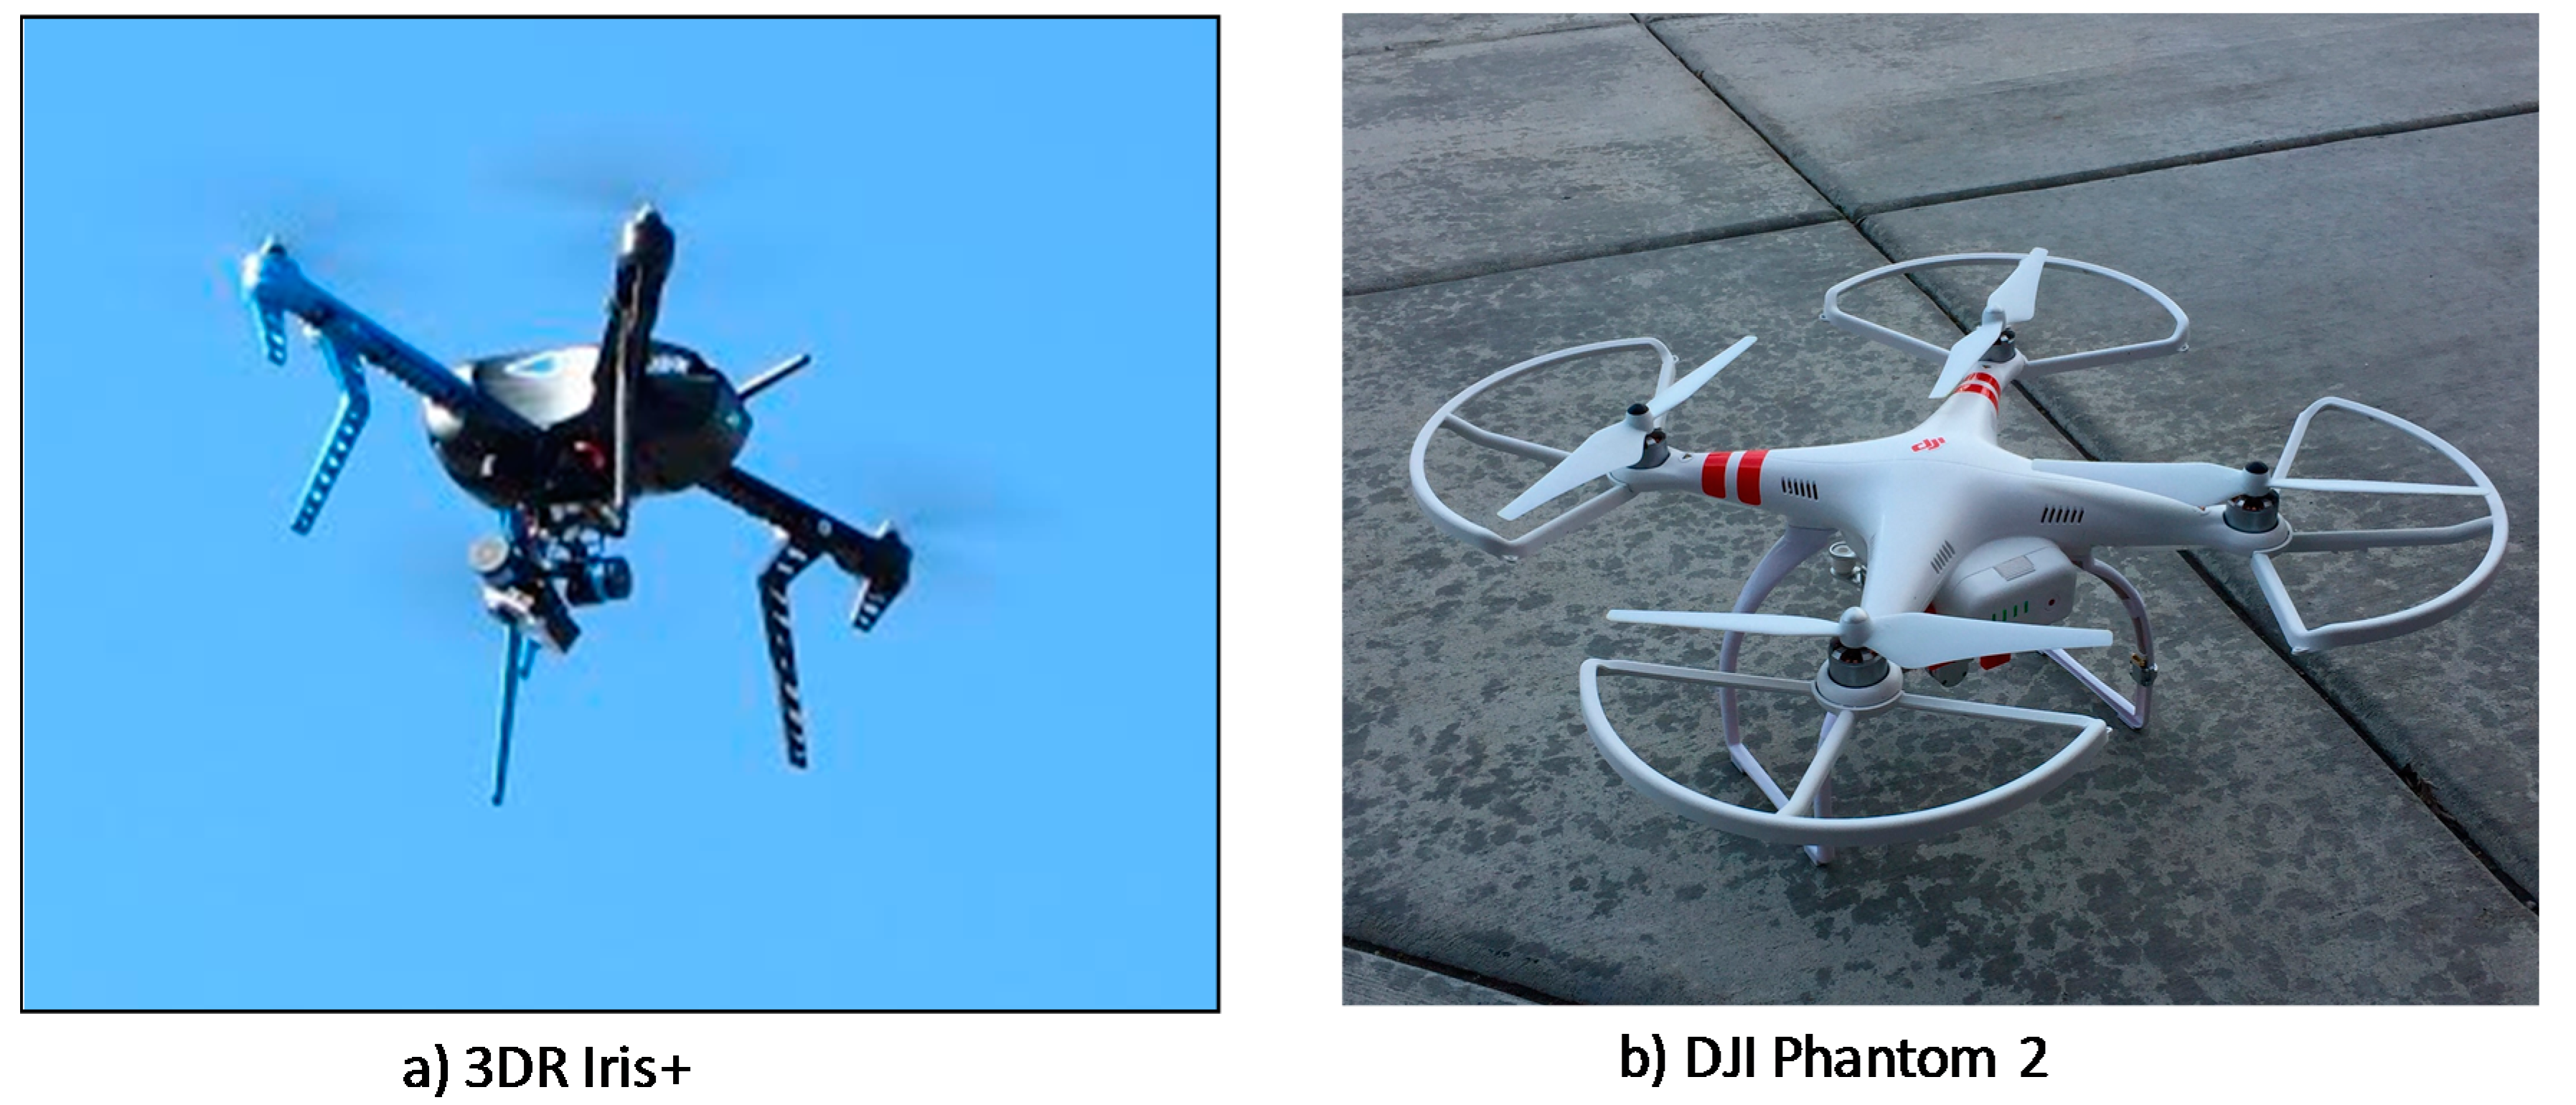
Figure 1. Off-the-shelf unmanned aerial systems. (a) 3DR Iris+; (b) DJI Phantom 2.
Jimaging 03 00002 g001
Figure 2. Monitoring of apple orchard using C-MAP. (a) UAS flying over an apple orchard; (b) False color image showing water variability.
Jimaging 03 00002 g002
Figure 3. Operation of UAS using DroneDeploy. (a) Planning the flight using DroneDeploy; (b) Sending flight plan to UAS; (c) UAS – DJI Phantom 3; (d) Orthomosaicked image.
Jimaging 03 00002 g003
Figure 4. Tablet screenshot of DroneDeploy.
Jimaging 03 00002 g004
Figure 5. Image acquisition and stitching using DroneDeploy.
Jimaging 03 00002 g005
Figure 6. Sample images acquired at peach orchards. (a) Sample RGB image of peach blossom; (b) Sample multispectral image of peach blossom.
Jimaging 03 00002 g006
Figure 7. Color distribution of blossoms and weeds. (a) Original image; (b) Contrast stretched image.
Jimaging 03 00002 g007
Figure 8. Image processing algorithm for blossom detection.
Jimaging 03 00002 g008
Figure 9. Image processing for blossom detection. (a) Original image (NGB); (b) Color stretching; (c) Blossom detection; (d) Blossom overlay.
Jimaging 03 00002 g009
Figure 10. Image processing process for pixel density calculation.
Jimaging 03 00002 g010
Figure 11. Image processing results for tree grid separation.
Jimaging 03 00002 g011