1. Introduction
Costs of production are major considerations for animal agriculture and, thus, growing animals more efficiently is a major driver for research. Furthermore, efficiency in animal production may contribute to environmental stewardship by reducing greenhouse gas emissions through selection of animals based on efficiency traits [
1]. Probably the most common expression of growth efficiency in beef cattle is residual feed intake (RFI), which is essentially the difference between the amount of feed an animal is expected to consume and what it actually consumes [
2]. There are five physiological process that broadly account for variation in RFI [
3]. These processes include feed intake, digestion, metabolism, activity and thermoregulation. By far the largest contributor is metabolism which accounts for approximately 37% of the variation in RFI [
3]. Residual feed intake is moderately inheritable with estimates ranging across studies (h2 = 0.16–0.52 (mean (s.e.) = 0.32 ± 0.09) [
4]. Thus, variation in RFI is considered to be mainly a function of the differences in metabolic processes among animals. The measurement of RFI of beef cattle requires accurate and precise measurements of feed intake and animal growth over at least 35 days [
5]. The procedures are impractical for most on-farm applications, and are usually performed by a service provider in North America such as GrowSafe Systems Inc. (Airdrie, AB, Canada). Consequently, efforts have been made to identify feed-efficient animals using genetic and metabolomic biomarkers that are associated with traits, such as RFI or metabolic efficiency. The hypothesis is that efficiency in animal growth is in part due to metabolic processes and, thus, by measuring those processes it may be possible to identify feed-efficient animals, i.e., animals that give the most growth for the least feed consumption.
Endothermic animals generate heat through metabolic processes. Heat is conserved or dissipated depending on environmental and physiological conditions. In addition, metabolic processes may be influenced by the amount of energy available to the system. Thus, if food is withdrawn, metabolism may slow down or reach a basal rate. The amount of radiated heat losses will differ enormously between different species. In healthy human subjects during fasting and under controlled environmental conditions radiated heat losses have been reported to be approximately 53%, compared to convective (27%) and evaporative (20%) [
6]. There were no differences in temperature measurements made by IRT and indirect calorimetry. An increase in radiated temperature was reported after eating. Furthermore, measurements of heat loss by IRT and indirect calorimetry were highly consistent within individuals over successive measurements on the same day and on alternate days. The study by Shuran and Nelson in 1991 [
6] provided some of the first evidence that IRT can accurately measure heat losses, that these measures may reflect energy intake (feeding), and that within-subject measurements are consistent over a short time frame. The application of IRT to measure heat losses, and by extension energy expenditure, has been applied to pre-term infants [
7] and dairy cattle [
8], with similar findings to those noted above. In the study by Montanholi et al. [
8], radiated temperature measurements of the flanks, rear, and front feet of dairy cows all exhibited significant correlations with heat production as measured by indirect calorimetry. The strongest correlation was between the radiated temperatures of the front feet with heat production.
Radiated heat measurements have been shown to be related to a variety of different physiological states including: oestrus in dairy cows and swine [
9,
10], stress responses to transportation and feed deprivation in beef cattle [
11], pregnancy in horses [
12], ante-mortem stress in swine [
13], milking and feeding of dairy cattle [
8], hypoxia in ground squirrels [
14], and residual feed intake in cattle [
15,
16]. Thus, measurements of radiated heat losses are associated with different metabolic states. However, if radiated temperature measurements are to have utility at the farm level, and to be predictive of important economic traits such as RFI, the capture of infrared images must be automated and conducted under field conditions. Furthermore, radiated thermal output must be shown to exhibit consistency over time in order to provide confidence that such measures are a predictable biomarker of metabolic activity. This has not been previously demonstrated using an automated image capture station under field conditions, which are inherently prone to numerous sources of confounding variation.
The accuracy and precision of temperature measurement by IRT is critically dependent on the operation of the thermal camera. The camera-to-subject distance and angle have profound effects. Variation in these parameters has been a major obstacle to comparing results from different applications of IRT for screening of febrile disease [
17]. The anatomical location of the image is also an important consideration. Images of the head and, particularly, the medial corner of the eye (canthus) are most often used for disease detection, but skin temperature may also provide valuable information with regard to metabolic activity [
17,
18]. In addition, the sheer scale of animal agriculture in which confined feeding operations, such as feedlots and swine barns, may contain thousands of animals necessitates automation of the image capture system [
18].
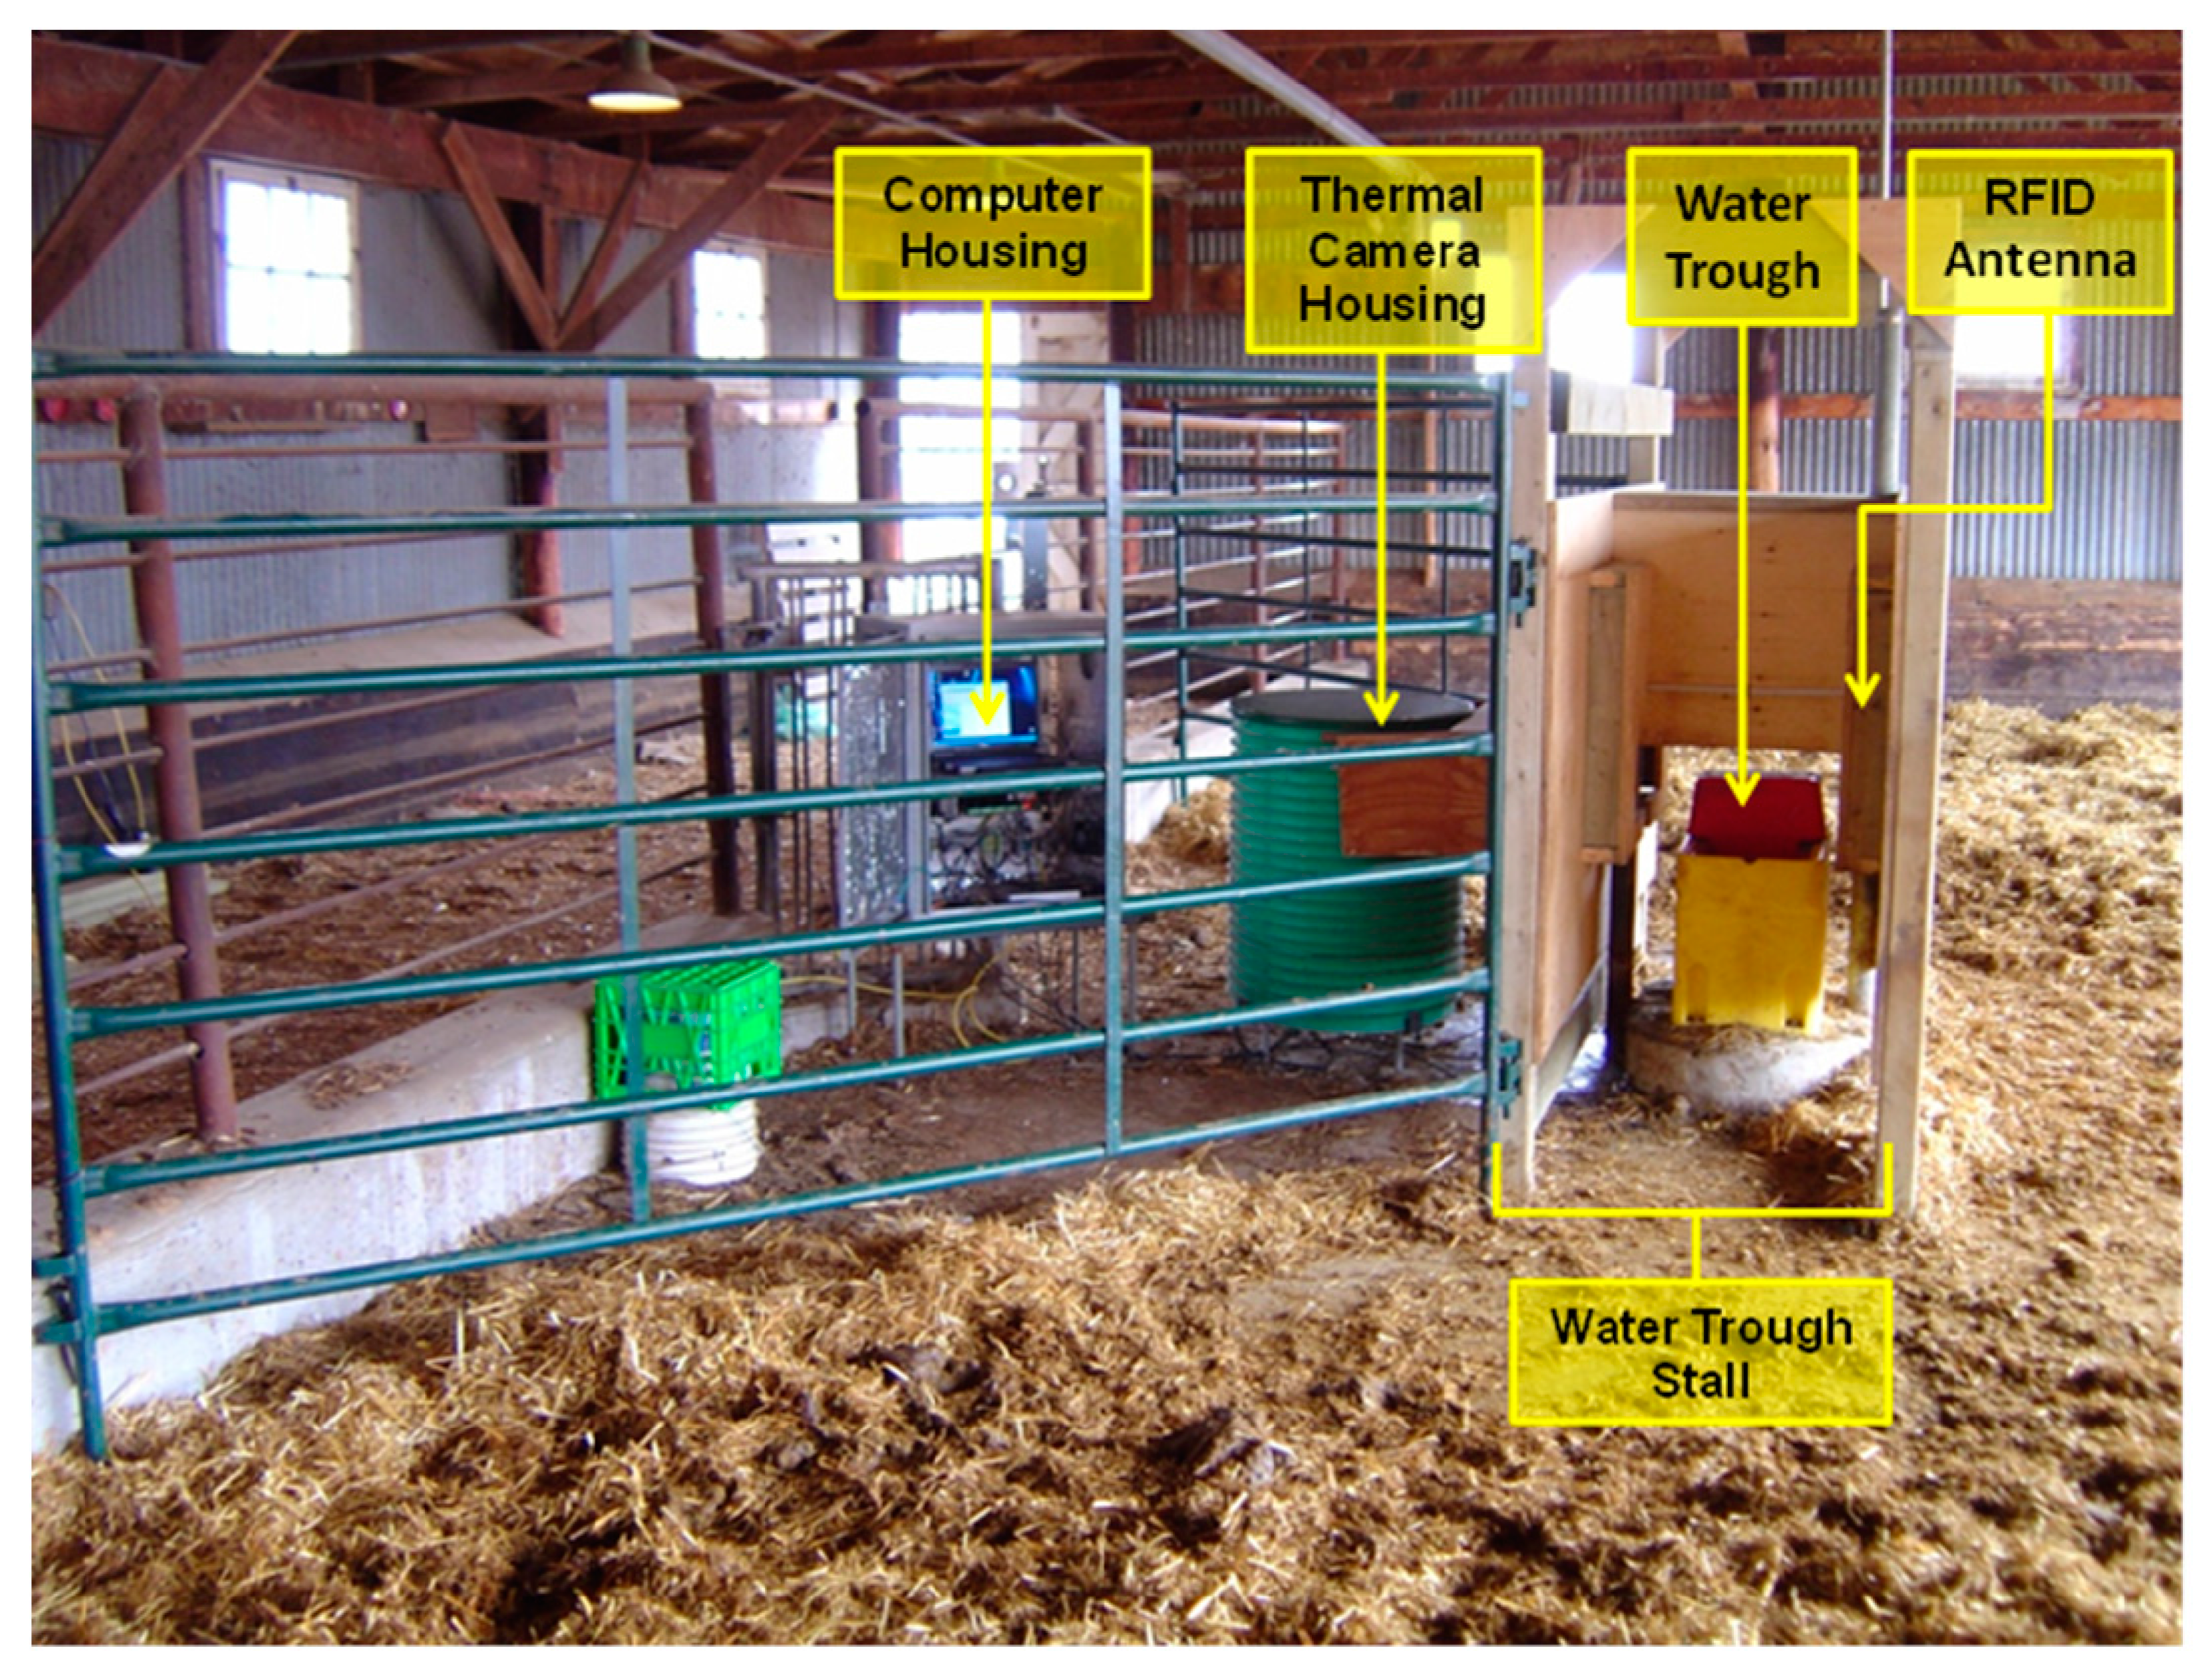
The present study reports on the repeated measurement of radiated temperature of areas around the eye and on the face of feedlot cattle. The images were automatically captured when cattle visited a water station located in their pen (
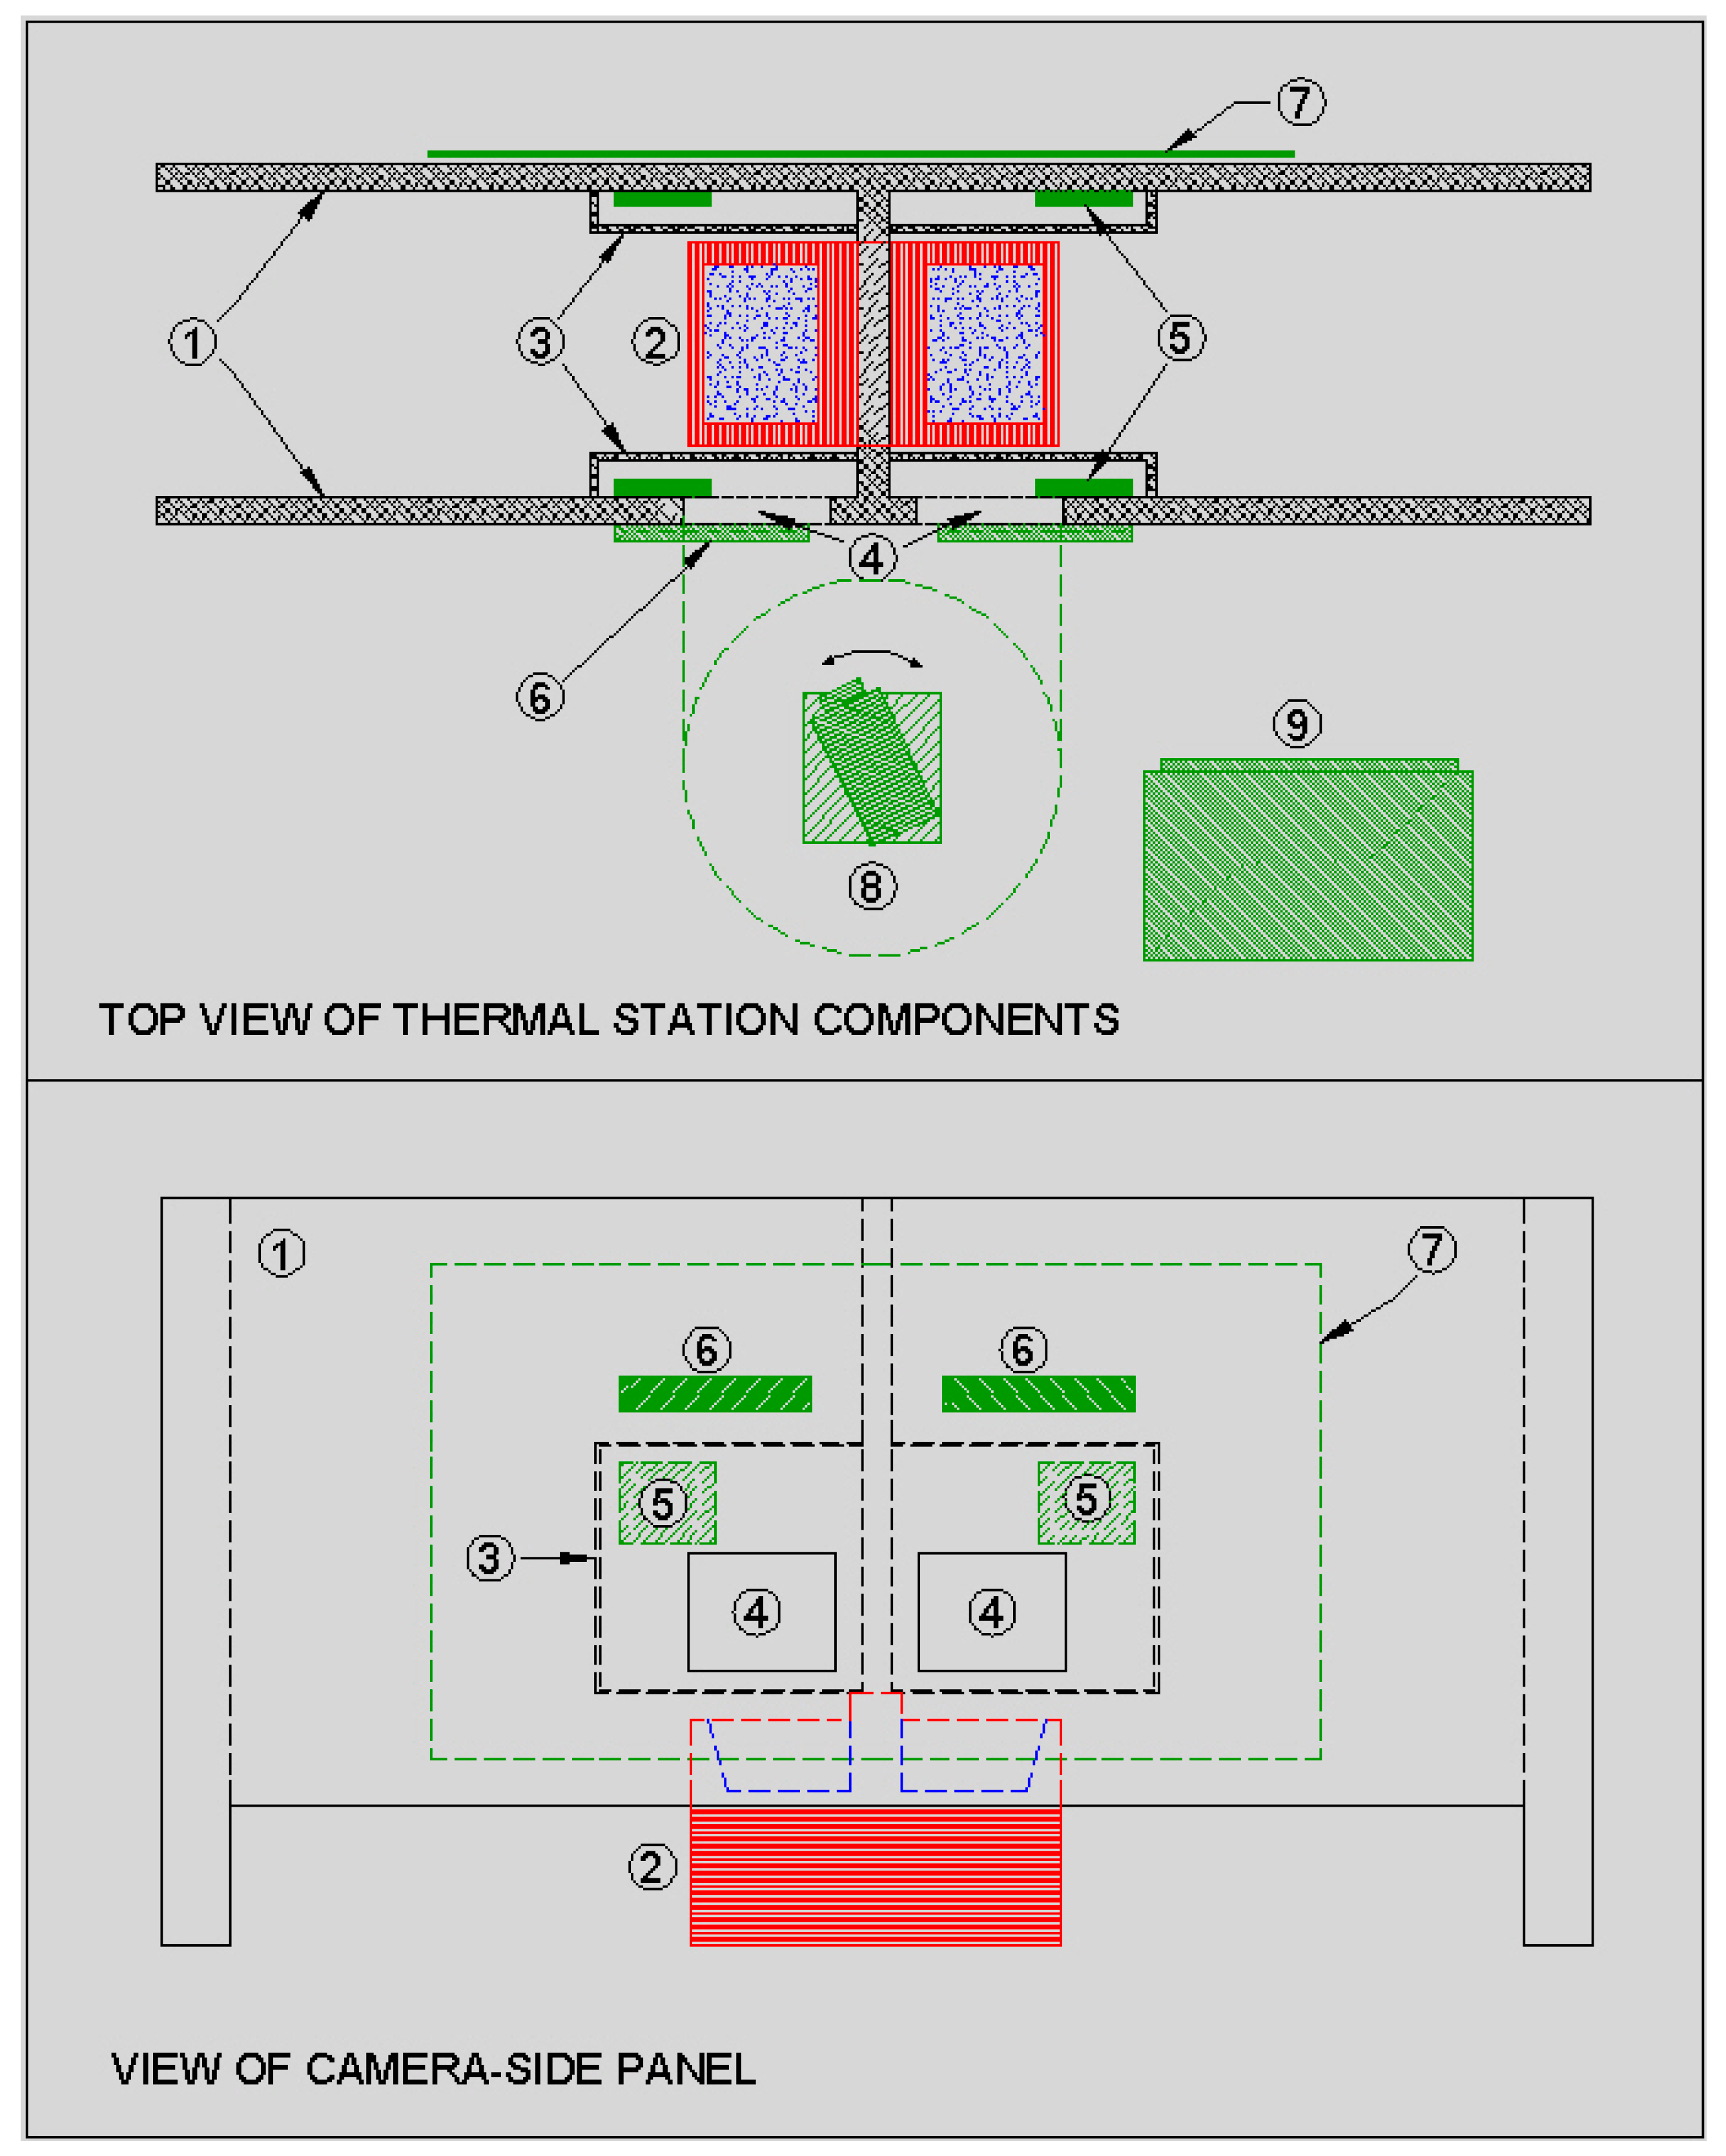
Figure 1 and
Figure 2). Cattle were housed in the pen for four weeks and feed was withheld on one day per week to test the response to metabolic challenge. The study goals were to automatically capture infrared images under field conditions and to investigate the consistency of radiated temperature output within-animals over a period of weeks during normal feeding activity and during periods of metabolic challenge by withdrawal of feed. The question being asked is; under normal and metabolically-challenging conditions are radiated temperatures characteristic of individual animals? If that is the case, then we should observe significant correlations within a group of animals over time. This is what is meant by consistency in radiated thermal output.
2. Materials and Methods
Animals used in this study were Hereford-Angus yearling beef steers (
n = 20) that were cared for in accordance with the Canadian Council on Animal Care in Science [
19]. The study was approved by the Animal Care Committee of the Lacombe Research Centre. The study was conducted over 26 days from the 4 August to the 29 August. Steers with an initial body weight of 326 kg (SD ± 46 kg) were housed in a feedlot pen with ad libitum access to 100% barley silage feed delivered once per day at approximately 10 a.m. Animals were housed in an outdoor pen with a dirt floor and straw bedding. Approximately 30% of the floor space at one end of the pen was covered by a roof. The water station and thermal measurement system were housed under the covered area. Animals were fitted with an electronic identification (EID) tag in the right ear.
Figure 1 shows the set-up at the water station with two opposing access stalls, computer and thermal camera housing.
Figure 2 shows a schematic representation of the thermal imaging station.
The thermal camera was an A310 (FLIR Visions Systems, Burlington, ON, Canada). This camera records images of 320 × 240 pixels, with a thermal sensitivity of 0.05 °C at 30 °C, a measurement range of −20 °C to 120 °C, and accuracy of ±2 °C or 2% of the measured temperature. The accuracy of the thermal measurements in the present study was approximately ±0.76 °C, based on an average animal temperature of 37.95 °C. The camera and image data were accessed and controlled using FLIR CamXI based on FLIR ThermoVision SDK v2.5. This software gives Windows Visual Basic/C++ programmers the ability to control access and manipulate image data from FLIR infrared cameras.
Two loop antennae were built to have a limited read-range, sufficient to read over a defined space where the EID tags were in a position close to the water trough. This helped to eliminate tag-reads from outside of the stalls and to capture the animal’s ID when it was close to the water trough. The coils of the antenna loops were placed on opposing walls of the stalls and produced a constructive, in-phase excitation and detection zone between the coils. Shielding was placed on the pen-side of the station to eliminate detecting EID tags on animals close to the water station but outside of the stalls. The antenna design compensated for effects of shielding in close proximity to one of the antenna pair. The antennae were connected to a remotely located PNL-OEM-MODLE-3 controller (Allflex Canada Inc., St-Hyacinthe, PQ, Canada) via a junction box. Tuning adjustments were made on the controller once the antennae were mounted.
The objectives for the image capture and analysis processes were to obtain infrared images of the eye region of the animals, and a similarly-sized area of skin on the face that was consistent across all images. These regions were chosen because radiated temperature measurements of the medial corner of the eye (inside canthus) has been consistently shown to be the best anatomical area for the detection of febrile response to disease [
17,
18], and temperature of the facial area has been shown to be related to residual feed intake in beef steers [
15] and bulls [
16]. The close proximity of these anatomical areas made it possible to obtain images that contained both regions of interest, while at the same time defining the areas in relation to an anatomically-consistent area, i.e., the eye.
When an animal entered the water station the RFID antenna detected a signal from the animal’s EID tag and the camera rotated to the window on the stall that the animal entered. Thermal images were captured at a rate of seven frames per second, but no images were retained at this point. A stepwise process was used to obtain temperatures of the eye region. In a complete image of the head the warmest area of the face is the inside canthus of the eye, and the eye itself constitutes a relatively small area compared the whole head or face. These observations were used to devise a method of automatically finding the eye in an infrared image. The first step involved finding a ‘potential’ eye and the second step involved selecting the ‘best’ image in a sequence of images. Firstly, an algorithm described by Parker [
20], was applied to each image captured by the camera. The algorithm [
20] detected the two highest temperature peaks within the whole image field, and defined a threshold value as the lowest temperature between these peaks. Thereafter, the warmest area of the image greater than the threshold temperature but <10% of the total image area was considered to be a potential eye. To isolate the eye in the image a convex polygon was fitted around the potential eye area using Andrew’s monotone chain convex hull algorithm [
21].
Typically, an animal remained at the drinking station for several minutes and at a rate of seven frames per second a large number of frames were recorded. Many of those images were unsuitable because the animal was either entering of leaving the water station. Thus, to select a suitable image from a sequence of images an in-house algorithm was applied that provided a method of consistently choosing an image that on visual inspection appeared to be close to the ‘best’ image. The three variables of importance were the eye box area, and the maximum and average temperatures within the eye box. The algorithm compared images in sequence according to the following rules. The area of the eye box was set at a threshold value of 1300 pixels because this was determined from previous work to be the mean minus one SD of the area of the eye box. Note that post hoc analysis of the eye box areas in the present study determined the mean (±SD) eye box area = 2333 ±1199 pixels i.e., the minimum box area would have been 1134 pixels if based on contemporary data. Thus, images with an eye box area <1300 pixels were rejected but only if there were others in the sequence that were >1300 pixels. This meant that not all retained images had an area >1300 pixels because, in some sequences, none of the box areas were >1300 pixels. This occurred in 17.6% of all retained images.
The maximum temperature was the primary factor such that in a sequence of images the one with the highest maximum temperature was retained. However, a restriction in box area of >1300 pixels was placed on the selection process. Thus, if there were two images in which one was <1300 pixels and the other >1300 pixels the maximum temperature of the image >1300 pixels was retained even if the maximum temperature in this image was lower than the maximum temperature in the image of <1300 pixels. Provided images had box areas >1300 pixels, then the retained image was the one with the highest maximum temperature. If more than one image in a sequence had the same maximum temperature and if the area was >1300 pixels, then the image with the highest average temperature was retained. If there were more than one image that met all criteria then the first recorded in the sequence was retained. In sequences where none of the images had a box area >1300 pixels the one with highest temperature was retained. If there was more than one image with the same maximum temperature then the one with the largest box area was retained. If there were two images with the same maximum temperature and box area <1300 pixels the one with the higher average box temperature was retained.
Box area was important to broadly define if an animal was in the ‘correct’ position. Boxes of <1300 pixels occurred mostly when the animal was entering of leaving the water station. Maximum temperature was the most important characteristic because this variable was most closely associated with the eye relative to any other area of the face. However, many images in a sequence had the same maximum temperature and, therefore, the average temperature was used as a discriminant. The highest average temperature was chosen because average box temperature was inversely related to box area (r = −0.46, p < 0.0001) and, thus, choosing the highest average temperature tended to limit the size of the eye box.
The relative contributions to the rejection of images in any sequence was approximately area > 1300 pixels = 40%, average temperature = 35%, and maximum temperature = 25%. Area contributed the highest fraction of rejected images because many images were recorded outside of the ideal position, i.e., animals were either entering or leaving the water station. Some animals loitered in the station without fully lowering their heads to the drinking position and repeatedly triggered the detection system. This behaviour was termed ‘fidgeting’ and is the subject of behavioural analysis related to the detection of respiratory diseases in feedlot cattle [
22]. In these cases the numbers of incomplete images were high and, thus, the box area was frequently <1300 pixels. Average temperature contributed to approximately 35% of the rejected images, i.e., the maximum temperature was the same between images in a sequence and the eye box was >1300 pixels and, thus, the choice of image was based on the highest average box temperature. Although the maximum temperature was the critical selection variable it contributed the least to image rejection because it was the variable that was most often the same within a sequence of images with box areas >1300 pixels.
It would have been possible to apply the above algorithm for selecting the best image to the area around the eye that was defined by the polygon [
21]. However, the position and size of the eye box was used to determine the same area and a relatively consistent position of the facial box from which the skin temperature measurements were made (see below).
The process of image capture continued for as long as the RFID reader detected a signal from the same EID tag. When the RFID reader detected a second animal the process started over. However, if an animal visited the water station, left, and then returned some time later, or repeatedly triggered the system by fidgeting, without the system detecting another EID in the meantime, then the first image recorded that met the above criteria was retained. The ambient air temperature was simultaneously recorded with each infrared image.
A facial box was placed on the image adjacent to the eye box. The criteria for the facial box were that it be the same size and located below the eye box. However, if the facial box did not entirely fit on the animal’s face, such that it contained temperature information from the image background, e.g., the wall of the stall, the box was moved to either one side or the other of the eye box. If none of the positions for a facial box of the same size as the eye box were entirely within the area of the animal’s face then the facial box was reduced in size until the extraneous background was eliminated. The method of fitting the facial box was intended to keep the measurements of skin temperature of the face as consistent as possible by fitting the facial box with reference to a defined anatomical feature, i.e., the eye.
The trial was conducted over a four-week period. On Day 4 of each week feed was not delivered to the feed bunk. All feed was consumed from the previous day’s delivery but the precise time that the bunk was emptied was not recorded. Neither was the last time that an animal consumed feed. Thus, the period of time off-feed could not be precisely identified for individual animals. The day that feed was not delivered until 10 a.m. the following day was identified as the off-feed period. However, post hoc analysis of the temperature data clearly showed lower temperatures during the first day back on feed. This was probably because the heat of fermentation took time to re-establish once the animals were back on feed. In addition, feed consumed after a period of withdrawal takes time to pass from the rumen to the gastrointestinal tract and, thus, to provide energy for metabolism. Consequently, the period of feed withdrawal was defined as the 48h period starting at 10 a.m. on Day 4 of each week. Thus, there were two ‘feed periods’ representing the days that animals were fed (on-feed) and days during which feed was withdrawn (off-feed). Two days per week were during the off-feed period, giving a total of four daily off-feed pairings, i.e., one pairing per week. Each of the off-feed days was either preceded, or was followed by, an on-feed day. Daily pairings between on- and off-feed days were termed transition days (N = 7); leaving a total of 14 daily pairings for on-feed days. Note that the fourth week of the study consisted of only five days because the silage ration was used up by that time.
3. Statistical Analyses
Statistical and regression analyses were performed using JMP v10 (SAS, Cary, NC, USA). The relationship between ambient air temperature and animal temperature measurements were examined by linear regression and Pearson correlation. These were performed for the average and maximum eye temperatures and for the minimum, maximum, and average skin temperatures measured in the facial box area. Correlations were performed for individual animals on the total number of paired temperature measurements irrespective of the feeding period. Linear regression equations were obtained for each animal and from these equations the expected eye and skin temperature variables were calculated from the ambient air temperature. The differences between the observed animal temperatures and expected temperatures derived from the linear equations were termed the residual temperatures. The residual temperature was considered to be the fraction of radiated temperature that was independent of thermoregulatory processes involved in the maintenance of a steady-state internal temperature, i.e., a reflection of energy expenditure on non-thermoregulatory processes.
Mixed model analyses were performed on each of the temperature variables with feed period as the fixed effect and animal ID nested within week as a random effect. The formula for this model is; y = Xβ + Zυ (a) [Zυ(w)] + e, where y = temperature, β = fixed effect and υ = random effect, w = week, a = animal, Z = incidence matrices (week n = 4) and (animal n = 20), and e = random effect.
The average daily and weekly temperature was obtained for each animal. Consistency in these variables was tested by Pearson correlations across consecutive days and weeks. Thus, significant correlations between consecutive daily and/or weekly periods indicated that warmer animals remained warmer, and colder animals remained colder, over time (day-to-day or week-to-week).
4. Results and Discussion
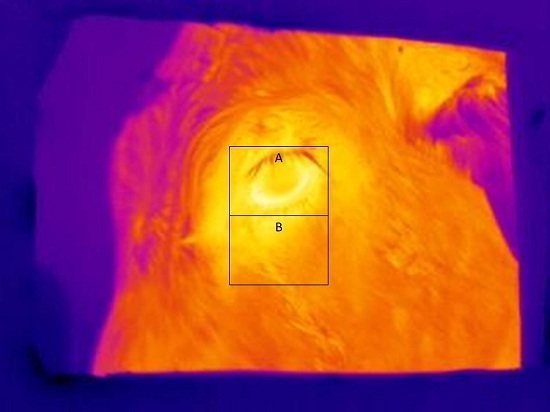
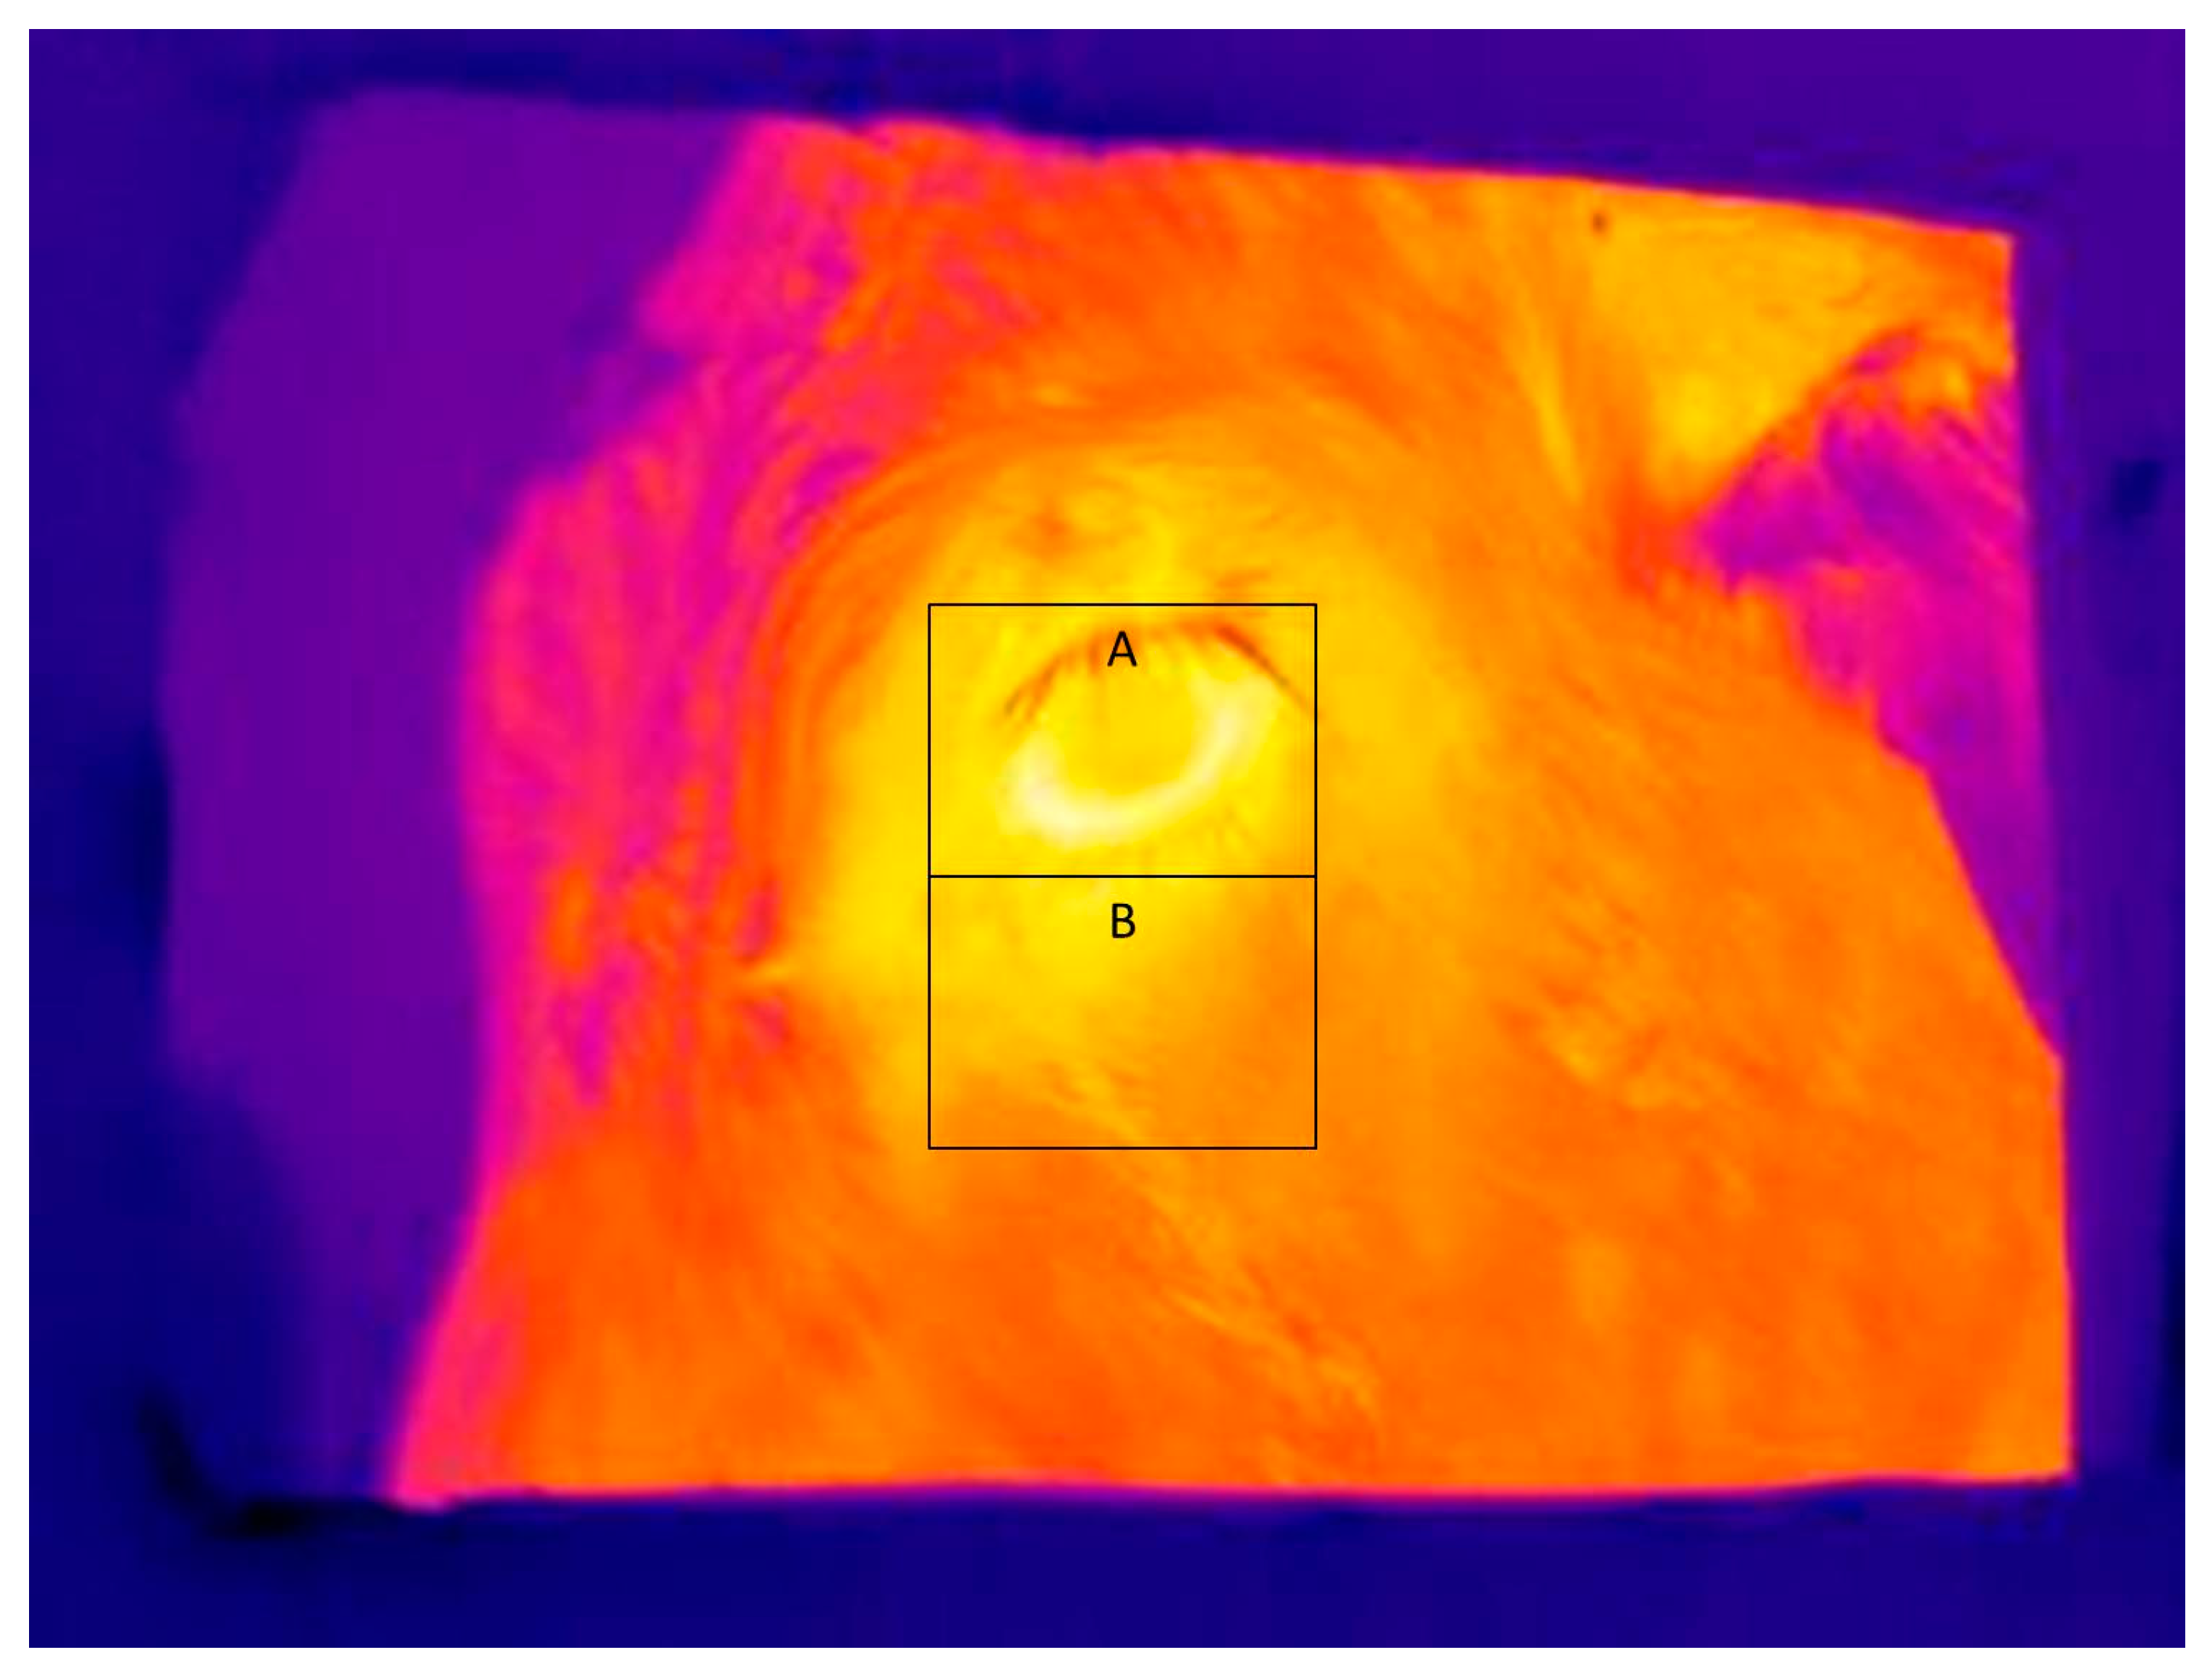
Figure 3 shows a typical infrared image used for determining eye and skin temperatures. Note that A and B boxes placed on the images in
Figure 3 and
Figure 4 are for illustrative purposes only. The maximum and average eye temperatures were used for statistical analyses. The minimum eye temperature was not used because it was often obtained from areas of the image that were not representative of the processes of thermoregulation, such as the eyelashes. Measurements were made of skin temperature from an area of the face, as previously defined. Skin temperature variables were the maximum, minimum, and average temperature within the facial box.
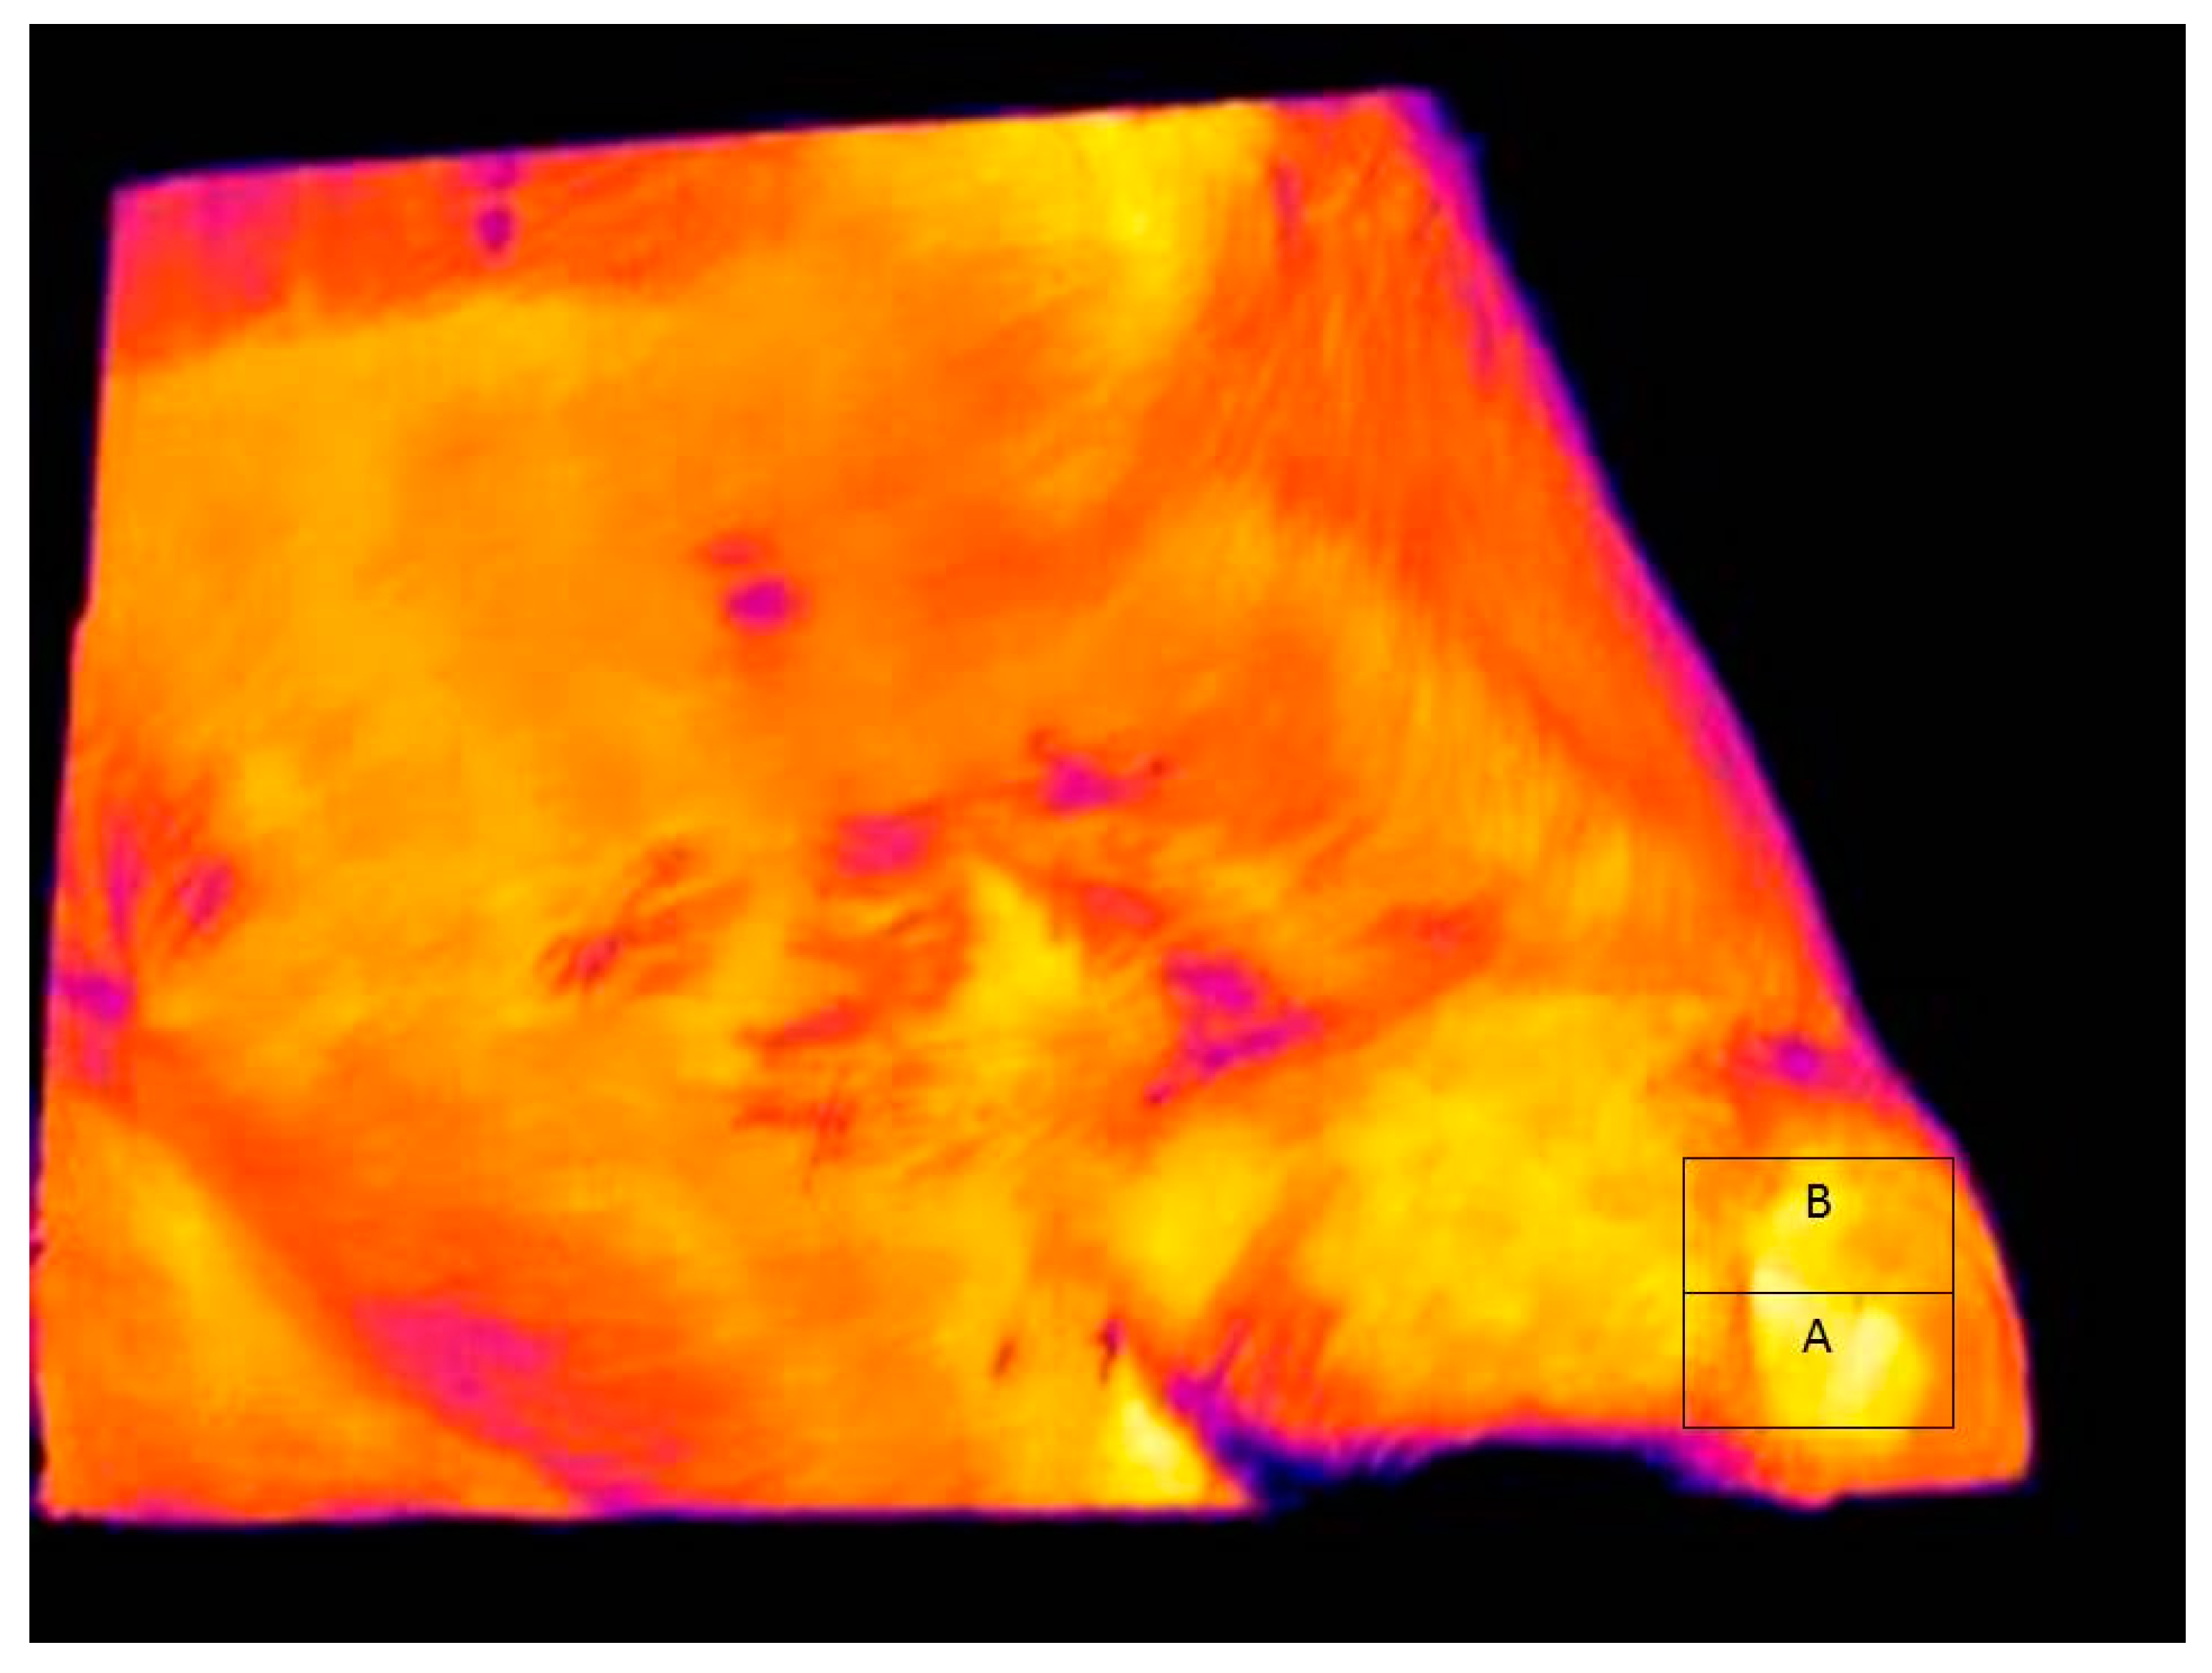
A total of 4591 images were automatically recorded over the study period. Unfortunately, many of those images were unsuitable for temperature analysis because they were incomplete facial images, or did not contain the eye within the image. The computer started saving images as soon as the animal’s EID was detected, and often animals were not at the drinking trough. Thus, many of the images were of the animal’s nose, or ear, or were otherwise incomplete (
Figure 4). The ability of the algorithm to select images in which the eye was present was validated by visually inspecting all the images and rejecting those that did not contain the eye. After an initial quality assessment the number of suitable eye images was 2769. Each of these images contained a facial box but this was not always the same size as the eye box. The eye and facial boxes were an exact size match in 88.2% of the images recorded. This means that in 11.8% of images the facial box had to be reduced in size to fit on the facial area. The relationship between temperature variables and the box areas were tested for correlation across the population of acceptable images. The maximum eye temperature was not related to the area of the eye box (
r = −0.06), but the average eye temperature was negatively related to the area of the eye box (
r = −0.45,
p < 0.0001). Thus, the larger the area of the eye box the lower the average temperature because of the relatively larger skin area captured in the box. The mean (SD) temperature for all images was 37.95 (±0.71) °C. There were 39 images that were lower than the mean minus three SD of the population, i.e., <35.82 °C. No temperature was recorded that was more than three SD higher than the mean temperature. Thus, the population of temperatures was skewed to the lower side of the mean. Note that temperatures below 35.82 °C were considered to be outliers for the environmental conditions experienced in this study and were omitted from the data. These outliers were probably due to extraneous material on the animal’s face, such as mud or water that gave a much lower temperature than the skin. Such outliers occurred relatively infrequently in the facial box area (1.4% of all images) and, thus, the minimum temperature was a valid parameter of skin temperature. Conversely, the minimum temperature in the eye box area was almost exclusively due to the eyelashes that were present in 100% of images.
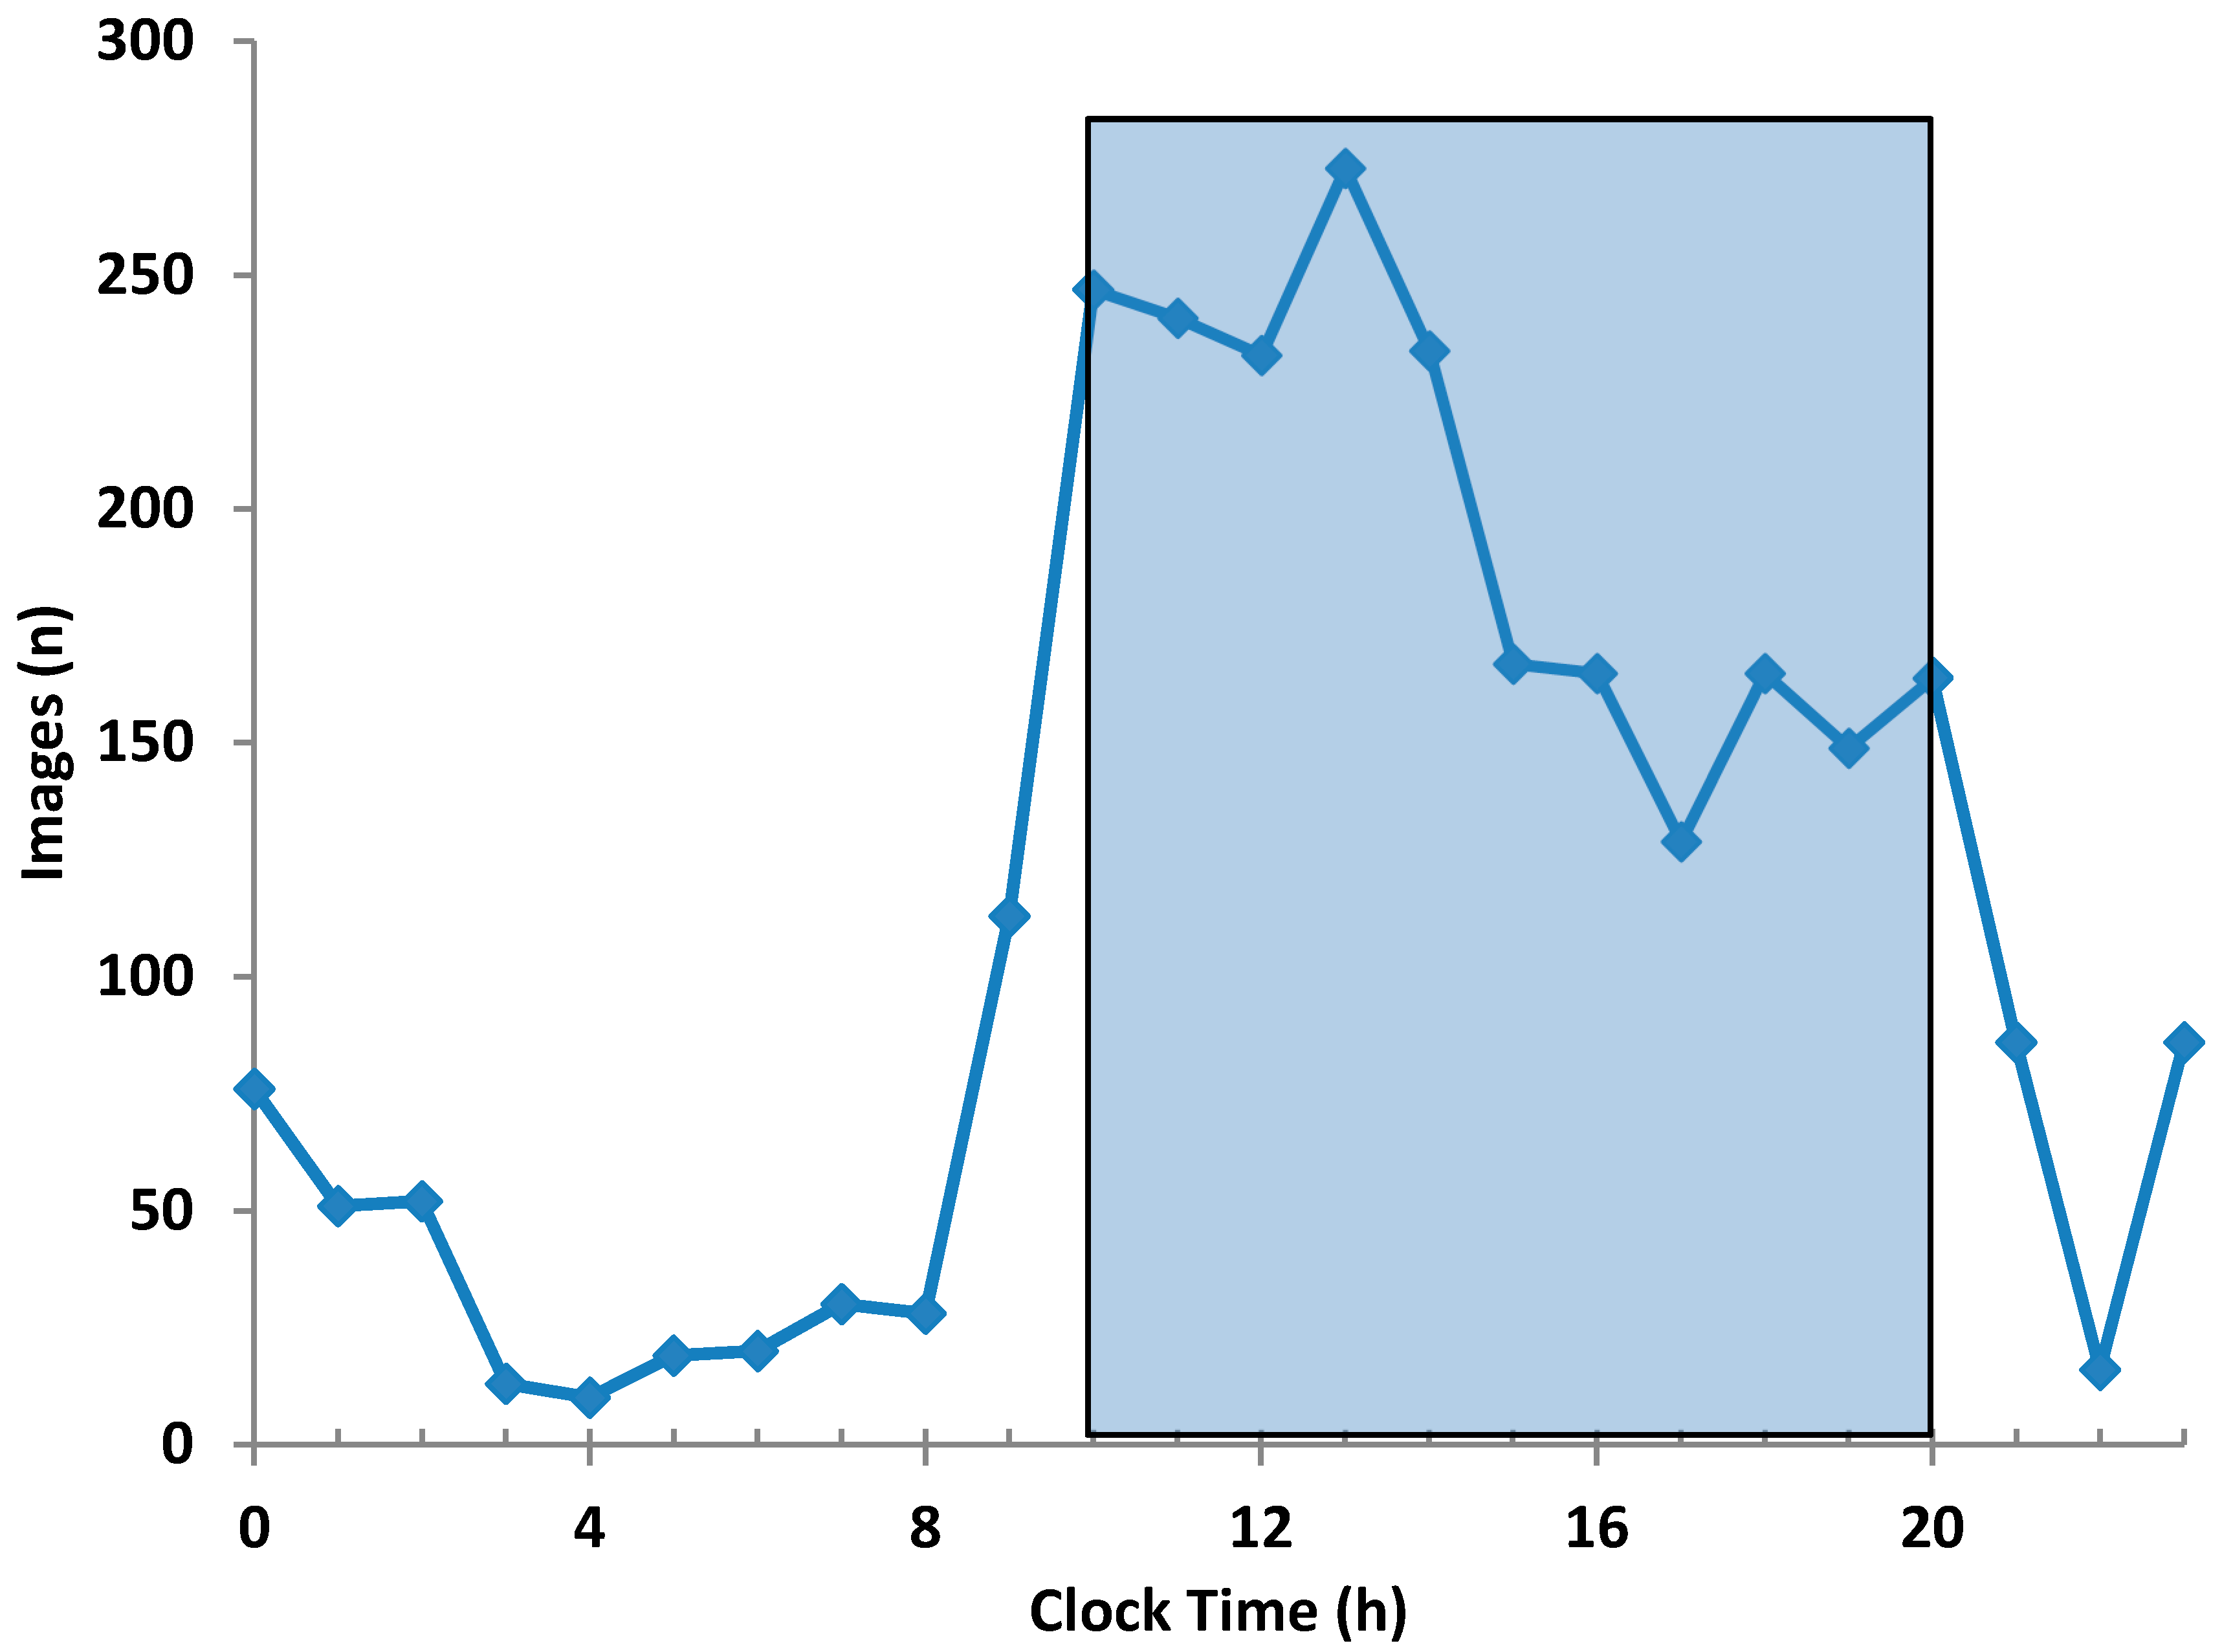
Images were individually time-stamped, but to obtain average temperatures across animals for treatments and time periods, it was necessary to assign common times. Thus, all images collected within an hour period were given the same common time, e.g., images between 09:00:00 and 09:59:59 were designated as “Hour 9”.
Figure 5 shows the total numbers of images collected for each hourly period. Note that 78.3% of images (2167 out of 2769) were recorded between Hour 10 and Hour 20, i.e., 10:00:00 to 20:59:59. Consequently, the period between Hour 10 and Hour 20 was designated as the “test period”. Note that 27 from 39 (72%) of the outlying low temperatures, i.e., <35.82 °C occurred outside of the test period. However, within the test period there were 12 images in which the maximum eye temperature was <35.82 °C, and these were also excluded from the dataset. Thus, the number of images in which the temperature data was considered usable was 2155, representing 46.9% of all the images that were automatically recorded.
4.1. Drinking Behaviour
The numbers of images recorded daily per animal during the on-feed periods was 0–28 (mean ± SD = 4.1 ± 3.5), and during the off-feed periods was 0–19 (mean ± SD = 4.2 ± 3.3). Pasture fed cattle typically make 1 to 4 drinking bouts per day, sometimes more during hot weather [
23]. Thus, both within and across animals, there was considerable variation in the numbers of suitable images recorded per day. Visiting the drinking station and the capture of images does not constitute an accurate measurement of drinking activity. Note that there were no visits (images) captured for some animals on some days. This does not mean that the animals did not visit the drinking station, only that their images were not captured, or the images were not considered of adequate quality for temperature measurements. However, an interesting observation was that the total numbers of images recorded per animal from week to week exhibited significant correlation across the population. The average Pearson correlation between weeks for the on-feed period was
r = 0.62 (
p < 0.01), and for the off-feed period
r = 0.54 (
p < 0.05). Furthermore, the correlation between on-feed and off-feed periods was
r = 0.69 (
p < 0.01). These observations indicated a behavioural component to the number of times that individual animals visited the water station. The observations suggest that some animals were consistently frequent drinkers and other consistently infrequent.
4.2. The Effect of Ambient Air Temperature
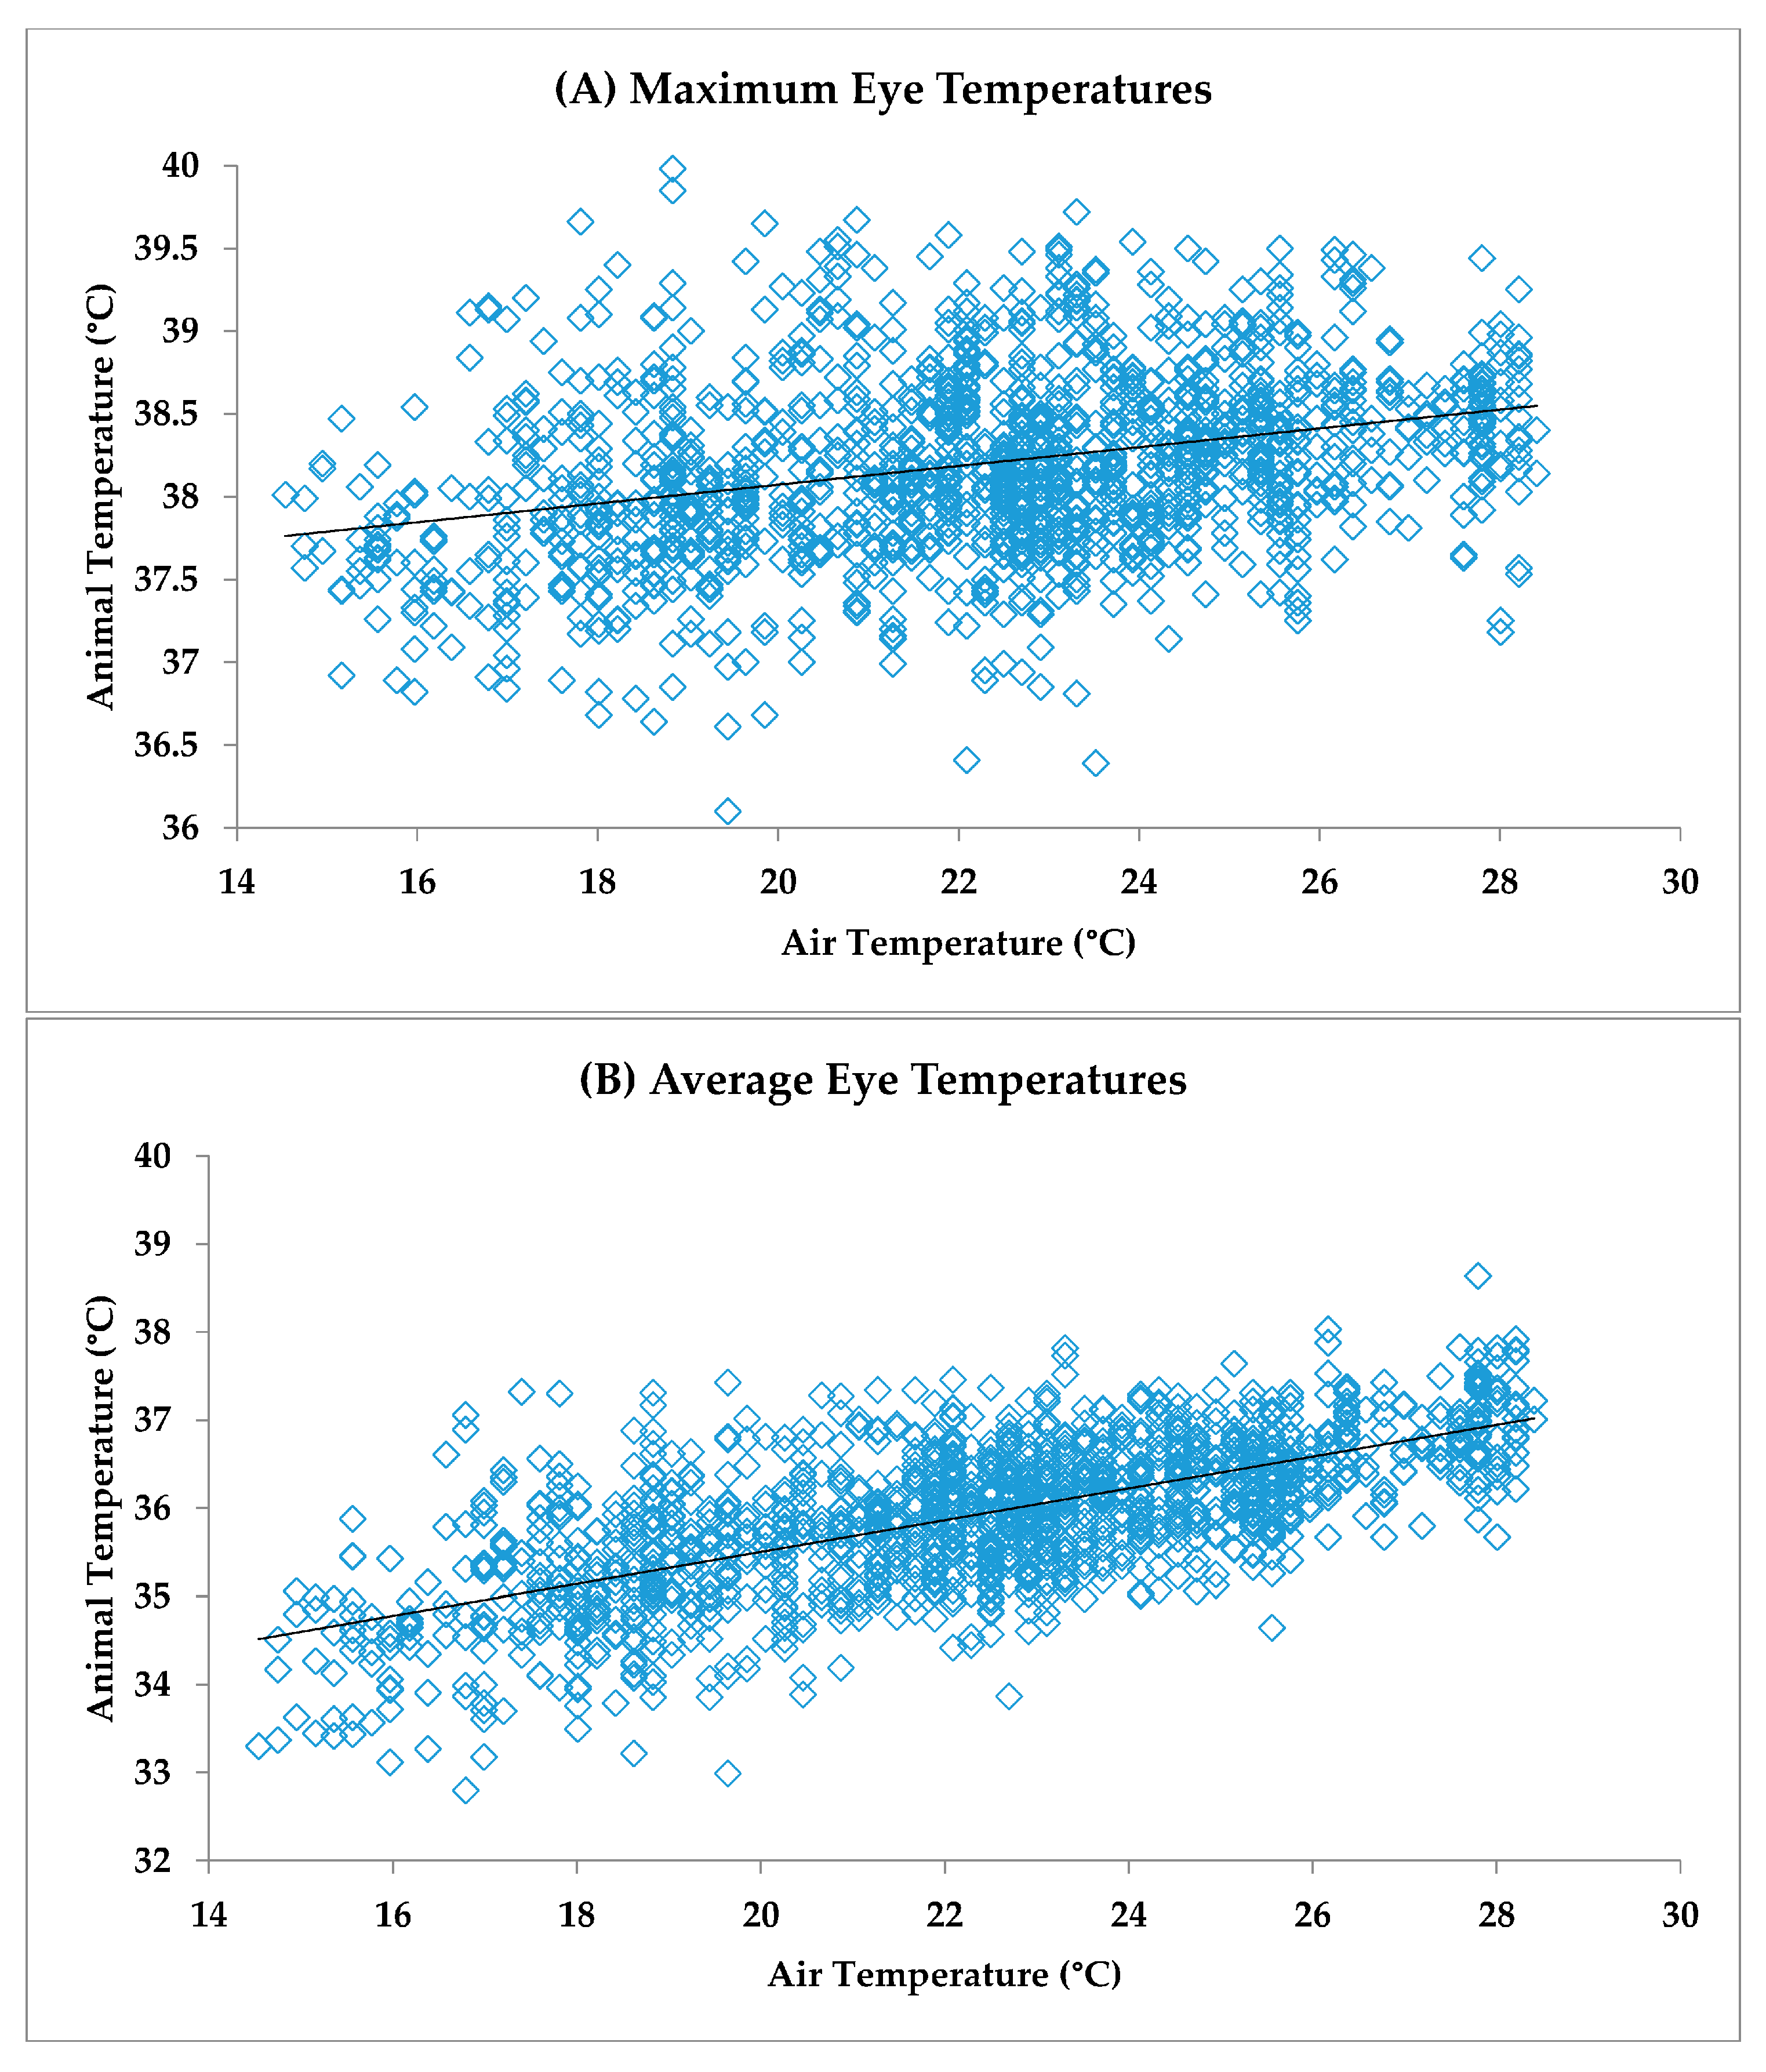
The effect of ambient air temperature on the eye and skin temperature variables was examined by Pearson correlation. The maximum eye temperature exhibited a correlation with ambient air temperature of
r = 0.24 across the population of animals, and was significant for 16 out of 20 animals (80%). The correlation for the average eye temperature with ambient air temperature over the total population of animals was
r = 0.74, and was significant for all individual animals. The average eye temperature was obtained from the whole of the eye box and included the surrounding skin, whereas the maximum temperature was most frequently recorded at the medial canthus of the eye.
Figure 6 shows the relationships between ambient air temperatures and the eye maximum (
Figure 6A) and eye average (
Figure 6B) temperatures.
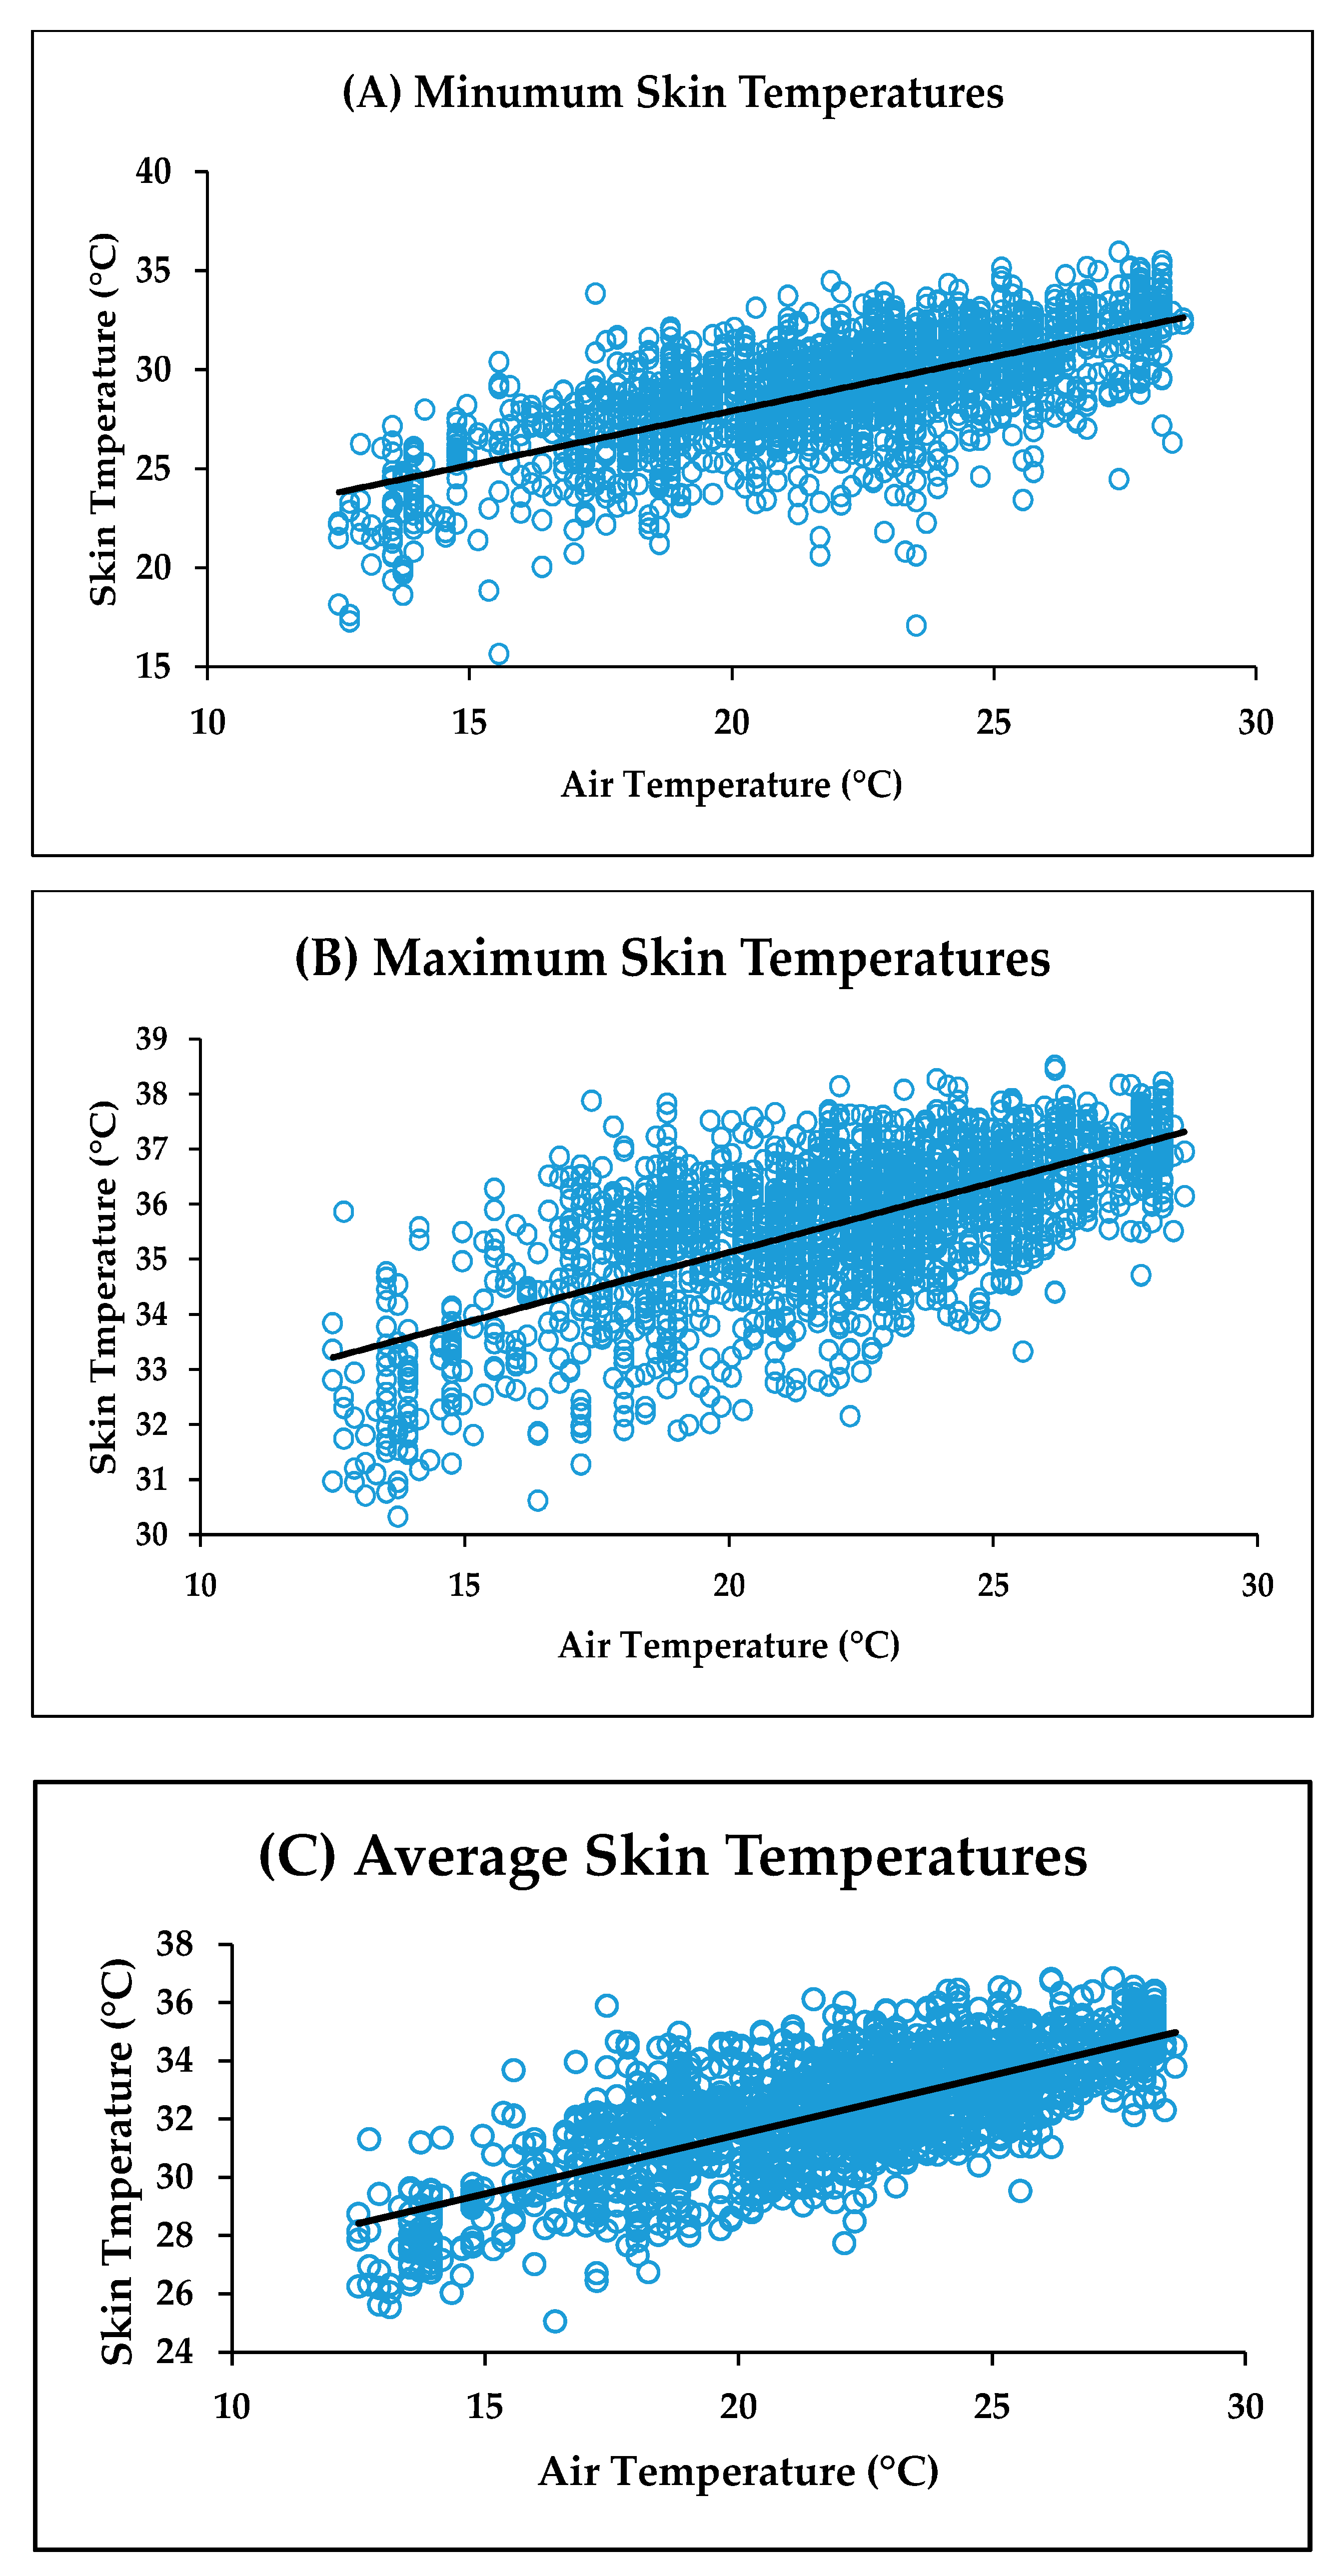
Correlation coefficients for ambient air temperature vs. minimum, maximum and average facial skin temperature were
r = 0.68,
r = 0.66 and
r = 0.73, respectively. The relationship between these variables and ambient air temperature is shown in
Figure 7. Note that the correlations for ambient air temperature with the eye and facial skin average temperatures were very similar (
r = 0.74 and 0.73, respectively). This was probably because the average eye temperature included the skin around the eye. All correlations were significant (
p < 0.0001).
The linear relationships between the eye and skin temperatures with ambient air temperature observed in the present study agree with similar observations in other studies involving a variety of different mammalian species and anatomical locations. The radiated surface temperature of the udders of dairy cattle [
24], and the coronary band of the hooves of beef cattle [
25] and dairy cattle [
26], have been shown to exhibit a linear relationship to ambient air temperature. The effects of ambient air temperature, humidity, humidity-temperature index (HTI), atmospheric pressure, and air speed were examined for their relationships to radiated temperature measurements of the hoof and udders of dairy cows and the eyes of sheep [
27]. In all cases, the observed temperature was linearly related to the ambient air temperature and, to a lesser degree, with the HTI, but was relatively unrelated to the other environmental factors. The skin temperature of pigs was shown to exhibit a cubic relationship with ambient temperature [
28]. The exact relationship is due to the range in ambient temperatures over which the observed temperatures are made. Thus, in the case of pig skin temperature [
28] the animals were exposed to a range of ambient temperatures that were below and above the thermal neutral zone for those animals. This was not the case for the steers in the present study and, thus, a linear regression equation adequately described the relationship to ambient air temperature and was consistent with observations in other studies.
4.3. The Effect of Feed Periods
Table 1 gives the mean (SD) of each temperature variable during the on- and off-feed periods, the F-ratio statistic for the differences between Feed Periods, and the variance components (%) for feed period and animal[week]. Note that all temperature variables were significantly lower during the off-feed period, including ambient air temperature. Thus, it was possible that the reduced ambient air temperature during the off-feed periods was at least partly responsible for the observed lower temperatures during these periods. Notwithstanding the above, Feed Period accounted for most of the component variance (%) within each of the temperature variables. In particular, Feed Period had the most profound effect on the residual temperature variables, accounting for a greater percentage of the component variance compared to the observed and expected temperatures for each of the temperature variables with the exception of the maximum eye temperature. The residual temperature variable was an attempt to express the component of radiated temperature that was not associated with ambient conditions. Thus, feed withdrawal had a significant effect of lowering the observed temperature variables, but had a greater effect on the residual temperature variables, indicating that feed withdrawal was a much greater factor in lowering radiated temperatures than ambient air temperature. Note that the exception to the above was the residual maximum eye temperature in which the variance component (%) for the period was 68.1% compared to ≥87% for the other residual temperature variables. Thus, the residual maximum eye temperature did not represent the metabolic responses to feed restriction as well as the residual temperatures of the other variables.
Calorie-restricted diets are well known to result in a reduction in core temperature of a variety of mammals, including
Bos indicus and
Bos taurus cattle [
29,
30], humans, rats, mice, goats, and sheep [
31,
32,
33]. The observed reductions in temperatures in response to calorie restriction are claimed to be heritable [
31], and associated with a reduction in metabolic activity driven by endocrine responses, particularly reductions in insulin and tri-iodothyronine, and an increase in cortisol [
34,
35]. However, all previous studies are based on the measurement of core temperature. To our knowledge, no previous study has used radiated heat losses to measure temperature responses to calorie restriction. The present study clearly demonstrates the effect of feed-restriction on radiated temperature.
4.4. Consistency in Temperature Variables
The daily mean temperature of each variable was calculated for individual animals. Days were numbered consecutively from 1 to 26. Mean temperatures on Day 1 were compared to Day 2 by Pearson correlation. Day 2 was compared to Day 3 and so forth, giving a total of 25 daily pairings. The average Pearson correlation was calculated for the on-feed, off-feed, and transition daily pairings, and after combining all consecutive daily pairings irrespective of feed period (overall). The average number of pairings between consecutive days was 18.9 and the degree of freedom (
n − 2) was 17. All temperature variables were tested, and the average Pearson correlation coefficients between daily pairings are given in
Table 2.
Correlations between daily pairings were significant for the expected temperatures. This was because the expected temperatures were derived from ambient air temperature; thus, the influence was the same for all animals. None of the observed or residual temperature variables exhibited significant correlations between daily pairs. These results are in contrast to the observations made on the udder surface temperature of dairy cattle in which the previous one to two days’ temperature measurements were highly predictive of the current udder temperature [
24]. The difference in observations between these studies was almost certainly due to the consistency in temperature measurements. Measurements of udder surface temperatures were made under highly controlled conditions whereas, in the present study, measurements were made under field conditions. Nevertheless, in the present study 55 out of 60 paired correlations gave a positive correlation coefficient, suggesting that there was some relationship between successive days. This relationship was too weak to be of statistical significance probably because, firstly, there were too few animals in some daily pairings and, secondly, because the daily average was not consistently representative of an animal’s radiated thermal output.
The weekly average for each animal was calculated for the on- and off-feed periods. The average Pearson correlations between consecutive Weeks for the eye and skin temperatures variables are given in
Table 3. Note that
Table 3 also gives the correlations between the on- and off-feed periods for the average temperature variables during these periods.
Similar to the daily correlations, the expected temperature variables were highly correlated between weeks because the direction of change for the ambient air temperature was the same for all animals. The observed temperature variables were also significantly correlated between weeks during the on-feed periods, accounting for between 47% (skin minimum) and 63% (skin average) of the variation in the observed average weekly temperatures. There were no significant correlations among weeks for the off-feed periods, or for residual temperature. The lack of significant correlations between weeks during the off-feed periods may have been because there were insufficient measurements during the off-feed periods to give an accurate representative temperature for each animal. This is similar to the problem encountered with daily average temperatures in that too few images were recorded to give an accurate measure of the animal’s radiated thermal output. Note that the weekly average temperature during the off-feed period was based on images collected over two days, whereas the weekly average temperature during the on-feed periods were based on five days of images. These observations suggest that given a sufficient number of measurements, i.e., a five-day average, the observed radiated skin and eye temperatures, representing thermoregulatory responses to the environment, were consistent across animals.
Despite the lack of significant correlations between weeks during the off-feed periods there was evidence that radiated temperature variables were related during the on- and off-feed periods. The mean temperature variables during the on-feed period were significantly correlated with the mean variables during the off-feed period (
Table 3). Thus, for the observed temperatures the mean on-feed temperature accounted for between 53% (eye maximum) and 81% (skin minimum) of the variation in the mean off-feed temperatures. This observation indicated that animals that were the warmest on-feed were also the warmest off-feed.
An interesting observation was the negative correlation coefficients between the on- and off-feed periods for the residual temperature variable. The animals exhibiting higher residual temperatures during the on-feed period may have been those animals in which a greater fraction of energy was expended on mechanisms other than thermoregulation, such as growth. These same animals exhibited lower residual temperatures during the off-feed period perhaps because they were able to reduce the fraction of energy expenditure on non-thermoregulatory processes to a greater degree. This would account for the negative correlations between the feed periods for the residual temperature variables. The hypothesis suggests that some animals are able to expend a larger fraction of their energy on non-thermoregulatory process than others, suggesting that these animals are likely to be the most efficient because relatively less energy is expended on thermoregulation and more on other metabolic processes, such as growth. The hypothesis also explains why the residual temperature variable may be a better biomarker of febrile responses than observed temperatures because it is more reflective of the energy expended by immunological processes than of exclusively thermoregulatory processes. Further studies are needed to test the relationship between the residual temperature response to feed withdrawal and feed efficiency traits such as RFI.
A constraint of the current system for automatically recording infrared images in a feedlot are the algorithms for finding and choosing the ‘best’ images for analysis. It is likely that setting a threshold temperature could eliminate many of the images that were not of the eye. Additionally, the current method of choosing the best image in a sequence excludes many images that might be of value because the current system only saves one image from multiple visits. This might be improved by introducing a time constraint to the algorithm such that multiple images are saved from the same visit or multiple visits to the water station.
5. Conclusions
Feed withdrawal was associated with a decline in all temperature variables, with the effect lasting for up to 24 h after feeding resumed. The effect was mainly due to the reduction in feed intake rather than a response to environmental conditions, and is probably a reflection of underlying metabolic processes, and a reduction in the heat of fermentation.
A representative measurement of radiated temperature is a consistent biomarker of thermal output in individual animals. Negative correlations between feed periods for the residual temperature variables suggested that those animals that were capable of expending more energy on non-thermoregulatory processes whilst on feed were able to conserve more energy when feed was withdrawn. This observation suggests that these animals are likely to be the most feed-efficient because they are able to expend a greater fraction of metabolic activity on non-thermoregulatory processes.
The above conclusions depend on obtaining sufficient numbers of temperature measurements on individual animals. Multiple measurements over approximately five days were required to provide a temperature that was representative of an individual animal’s radiated thermal output.
The observation that some animals are potentially frequent drinkers and others are infrequent, and that this behaviour is consistent over time, merits further investigation because it has implications for using drinking behaviour as a biomarker of illness. Previous work using the infrared imaging station to detect febrile responses to bovine respiratory diseases (BRD) has indicated that sick animals attend the water station with greater frequency as they mount a febrile response and reduce the frequency of visits once clinical signs are evident (unpublished data). The observations in the current study suggest that water station attendance could be assessed using the animal as its own control and changes to the frequency of attendance within-animal might be a factor for identifying illness.
The study provided empirical evidence that radiated temperature measurements can be made on animals in an uncontrolled, commercial environment and that these measurements may be used to classify animals based on their radiated thermal characteristics. The next stage in the application of this technology would be to obtain representative measurements of residual temperatures on individual animals and compare to growth efficiency attributes, such as RFI.


 ,
, 

