Abstract
In hyperspectral images, once the pure spectra of the materials are known, hyperspectral unmixing seeks to find their relative abundances throughout the scene. We present a novel variational model for hyperspectral unmixing from incomplete noisy data, which combines a spatial regularity prior with the knowledge of the pure spectra. The material abundances are found by minimizing the resulting convex functional with a primal dual algorithm. This extends least squares unmixing to the case of incomplete data, by using total variation regularization and masking of unknown data. Numerical tests with artificial and real-world data demonstrate that our method successfully recovers the true mixture coefficients from heavily-corrupted data.
1. Introduction
1.1. Hyperspectral Unmixing
Hyperspectral imaging is continuously being suggested for new industrial applications. While it has been used for decades in remote sensing (see, e.g., [1]), it is now being applied in various industrial sorting applications, such as recycling of polymers, paper and quality control of crops and fruit; see the references in [2]. It has also been suggested for controlling glue coverage in manufacturing of wood strand boards [3] or even gas plume detection [4].
In hyperspectral imaging, the electromagnetic reflectance of an object or scene is measured in several hundred wavelength ranges at once, so that the spectrum measured at one spatial pixel acts as a fingerprint of the mixture of materials at the corresponding point in the scene. A hyperspectral image of size with L wavelength ranges can be represented by a hypercube or, alternatively, by column-wise spatial reshaping, as two-dimensional array , where . In the following, we focus on the latter representation.
Mixing of materials can be macroscopic, when, due to low resolution, several materials are measured at one spatial pixel, or microscopic, when the surface layer is an intimate mixture of the pure materials at different concentrations. Usually, hyperspectral unmixing is based on the linear mixing model. The model comes from remote sensing, where the ground area corresponding to one pixel is large, e.g., meters, and is often made up of several kinds of ground coverage, such as grass, soil or asphalt. The intensities of light reflected by the partial areas over the measured electromagnetic range are collected in the sensor. If the partial areas of different coverage are disjoint, it is reasonable to assume that the spectral distribution of light collected in the sensor is the sum of the spectral distributions reflected by the individual types of coverage, multiplied by their respective partial areas. For the limitations of the model and algorithmic approaches, we refer to the survey by Bioucas-Dias et al. [5].
Hyperspectral unmixing assumes the existence of pure spectral signatures, called endmembers, and seeks to infer the fractions of these endmembers, called abundances, in each pixel of the scene. As the number of materials, here denoted p, is usually much smaller than the number of wavelengths, hyperspectral unmixing is also an important data reduction step. Denote by the endmembers, corresponding to pure (average) reflectance spectra of the individual coverage types and measured at L wavelengths. Let the respective relative areas that they occupy in the ground region corresponding to the j-th camera pixel, the abundances, be denoted by , . The linear mixing model says that the spectrum observed in the j-th position is the convex weighted sum of , weighted by the abundances plus some noise vector :
where:
These two conditions are referred to as abundance non-negativity constraint (ANC) and abundance sum-to-one constraint (ASC) in the literature; see, e.g., [5]. Setting , both conditions can jointly be written as simplex constraint:
Using the vectors in Equation (1) for as columns of corresponding matrices:
the linear mixing model becomes:
1.2. Contribution
In this paper, we make the additional assumption that only part of the entries of the data matrix are known; this can be specified by a mask , where:
Then, restricting to the known entries, the linear mixing model Equation (3) with missing pixels reads:
where the Hadamard matrix product is defined by .
Hyperspectral unmixing refers to the estimation of the abundance matrix X from the given data Y; the endmember matrix K is either known or has to be found, possibly from a larger dictionary. We assume that K is known. This is a realistic assumption, because in many applications, such as sorting of materials, manufacturing control or remote sensing, reference spectra are available (see, for example, [6] or glue coverage control in [3]).
In this paper, we propose a novel joint unmixing and inpainting approach. Unmixing directly the incomplete hypercube, our approach replaces the two-step procedure of inpainting followed by unmixing, where the inpainting step typically introduces artifacts. These artifacts are avoided in the joint approach, because the knowledge of the signal subspace is used from the beginning, and we successfully recover the abundances knowing only a small part of the data cube.
Our presentation is organized as follows: In Section 2, we introduce our novel variational unmixing model based on the linear mixing model with missing pixels and encourage spatial regularity by an edge-preserving discrete total variation regularizer. The minimizer of the corresponding functional is computed by primal-dual optimization methods in Section 3. Both on real and simulated data, our approach yields very good results, as can be seen in Section 4.
1.3. Related Work
The incompleteness of hyperspectral data cubes has different reasons and comes in different forms. In the first “traditional inpainting” case, the full spectrum has been measured correctly at most object locations, while at the other locations, nothing is known. A recent inpainting approach in this setting is [7,8], where missing lines from airborne push-broom scanning are inpainted by anisotropic diffusion. As seems inherent to the PDE approach, the information from other channels enters the restoration of some channel, apart from a normalization step, only in the strength coefficient for the diffusion. Another approach, suggested for example in the survey [5] by Bioucas-Dias et al., is to perform spectral unmixing first and then perform inpainting on the lower dimensional signal subspace. This reduces the computational cost, and the noise level is lower after the dimension reduction. Chen’s survey [9] combines PCA with diffusion or TV inpainting methods, successfully inpainting small missing regions.
In the second case, there are few object locations where all of the information is lost, but for many object pixels, only part of the spectral information is available. A typical application are hypercubes acquired by so-called push-broom scanning or line cameras with missing information due to faulty sensor pixels in the area sensor. One can attempt to use the methods from the traditional inpainting case. Furthermore, channel-wise inpainting works well if only a few neighboring lines of pixels are missing. If, however, missing regions become large, its performance degrades. There are inherent problems to channel-wise methods: The affected region may contain spectra that are not in the boundary of the missing region; it may contain intensities smaller than the minimum or larger than the maximum occurring on the boundary of the missing region in that channel or the missing region may have contour lines not meeting the boundary. If we are in one of these settings, channel-wise diffusion-based inpainting cannot be successful.
In the context of accelerated hyperspectral image acquisition, the authors of [10] try to recover the full cube from a partially-measured cube with a DCT sparsity prior on the spectra. As spatial regularization, they impose spatial sparsity w.r.t. a shift-invariant redundant wavelet basis.
So far, all approaches concentrate only on inpainting of corrupted hyperspectral images. To obtain the abundances, a second unmixing step would be required. An attempt for a joint unmixing and inpainting using beta priors for the coefficient vectors is [11]. They start from a larger endmember dictionary found by other methods (using Hysime [12]) and encourage spatial redundancy by learning a basis of atom cubelets for the abundance cube.
2. Novel Mathematical Model
In this section, we derive our unmixing model from incomplete data, combining spatial regularization with the masked unmixing data term. The model allows for the inpainting of missing data during the unmixing.
2.1. Unmixing Model with Spatial Regularization and Proposed Model
We start from Model (4) and add spatial regularization. If the noise W is independently Gaussian, the maximization of likelihood in Equation (4) leads us to seek X as:
where for a matrix Y, the square of its Frobenius norm is .
In real-world images, neighboring pixels are likely to contain the same mixture of materials, i.e., the same abundances. Therefore, the recovery of abundances can be improved by adding a spatial regularity prior, penalizing too much variation of the abundances. This is of particular importance for noisy data. Hence, we now introduce a discrete total variation (TV) functional, see [13], which has become one of the most widely-used regularizers in image restoration models, because it preserves sharp edges. We define the discrete gradient operator, as in [14], by:
Here, denotes the identity matrix; the Kronecker product of two matrices and is given by the matrix:
and:
denotes the forward difference matrix. Note that the zero row corresponds to mirrored boundary conditions. For an image , column-wise reshaped into a vector , let:
Throughout this paper, operates on a matrix by replacing, at each pixel, the vector of partial derivatives by its euclidean norm.
Recall that the reshaped abundance image of the r-th material, is contained in the r-th row of X, i.e.,
Summing over all materials, we add the regularization term to Equation (5) and arrive at the following unmixing model for incomplete data:
for regularization parameters and . This corresponds to the isotropic spatial TV-regularization with no coupling between the channels. As already mentioned, the simplex constraint is also known as ANC + ASC.
Remark 1.
A related functional has been investigated in [15]. Their model reads, for and ,
where and:
In contrast to our functional, this functional contains no mask, uses anisotropic TV, and the additional term encourages sparsity. In [15], sparsity is important, because the authors use a larger K with columns corresponding to spectra from a library. In the presence of the ASC, as in our model, this term is constant,
We have also performed experiments with anisotropic TV, i.e., replacing TV in Equation (6) with , and we comment on this briefly in Section 4.3. If not mentioned otherwise, all of our results are obtained for isotropic TV.
Lemma 1.
The proposed Model (6) is a convex function of X. If , then it is strictly convex in X, and therefore, has a unique minimizer in .
Proof.
The first term, is convex, and for each , is a convex function of . Therefore, the functional without the term is convex. The term is strictly convex; thus, for , the functional is strictly convex.
The set and, hence, also the set , which incorporates the ANC and ASC constraints is closed, bounded and convex. The existence of a minimizer is ensured because a continuous function on a compact set attains its minimum. The minimizer is unique for , because a strictly convex function has at most one minimizer on a convex set. ☐
2.2. Model Reformulation
In this section, we rewrite the proposed Model (6) in a sound matrix-vector form to better apply algorithms from convex analysis. Reshaping the matrices in Equation (4) appropriately into vectors, i.e., the abundance matrix , the data matrix and the mask into:
we can write the model with related Kronecker products. We make repeated use of the relation:
First note that:
Next, from , we have:
Inserting these equations in Equation (6) and writing the constraint with the help of an indicator function:
we obtain the vectorized unmixing model for incomplete data:
This can equivalently be written as:
3. Algorithm
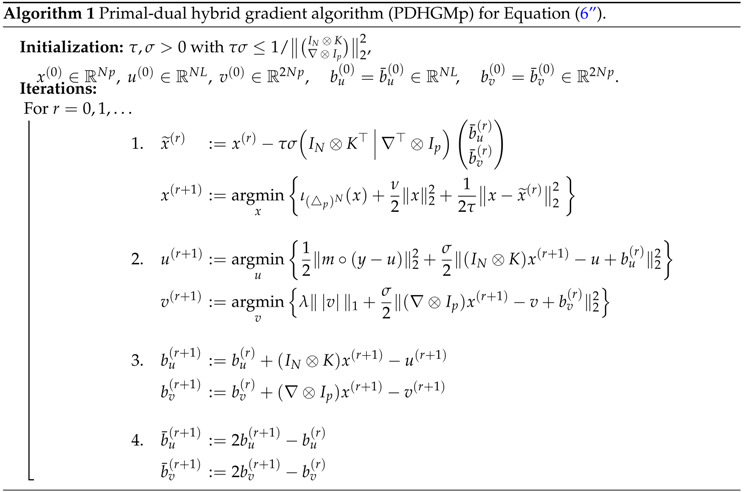
We use the primal-dual hybrid gradient algorithm (PDHGMp) [16,17] to solve Equation (6″) by finding a saddle point of the associated Lagrangian:
This leads to Algorithm 1, which is guaranteed to converge to a saddle point of the Lagrangian by [18] [Theorem 6.4].
All steps can be computed very efficiently. In Step 1, we compute an orthogonal projection of to . In Step 2, for , we compute a coupled-shrinkage of , with coupling within each pair of entries corresponding to the forward differences in both spatial directions at one pixel. The “Kronecker product-vector” multiplications in Algorithm 1 are implemented in “matrix-matrix” form, using Relation (7), e.g., for , we compute .
The number of elementary operations required for one iteration of the algorithm is linear in the number of entries of the hypercube, for constant p. In more detail, each iteration requires: N vector projections to , which are computable with operations each; the coupled shrinkage of pairs of entries, computable in constant time; further, multiplications and the same order of additions.
Remark 2.
(Parameters and initialization) As mentioned above, the term ensures strict convexity of the model. We set in all experiments below. In practice, setting works equally well, e.g., setting changes the recovery percentages in Section 4.3, Table 1, by less than %, where more than % of the pixels are known.
The parameters τ and σ influence only the convergence speed of the algorithm. They could be chosen adaptively [19]; here, we fix them both to , which ensures the required bound on the product .
The remaining regularization parameter λ is chosen heuristically taking the strength of the noise and the size of the image features into account.
As initialization for X, we start with a uniformly random matrix and then normalize, so that the columns sum to one. Finally, we always use zero initialization for .
 |
4. Numerical Results
We start with a brief introduction to hyperspectral image acquisition by a hyperspectral line camera in Section 4.1, before giving results on real data in Section 4.2 and on simulated data in Section 4.3, Section 4.4 and Section 4.5.
4.1. Hyperspectral Line Camera
A standard approach in hyperspectral image acquisition is to measure lines of the image one by one simultaneously at all wavelengths. In Earth observation, this is referred to as push-broom scanning. The method is also used in industrial applications, such as plastics sorting for recycling purposes. A typical camera is shown in Figure 1 (left).
At any time, one line of the image is measured at all wavelengths simultaneously. The incoming light from the current line is diffracted by an optical grid onto the area sensor of the camera (see Figure 1 (right)) and recorded as one “sensor frame”. The full 2D object is measured by moving the object relative to the camera. While the lines add up to the full 2D object, the sensor frames with spectral and along-the-line directions are stacked along the second image direction to form the full 3D hypercube.
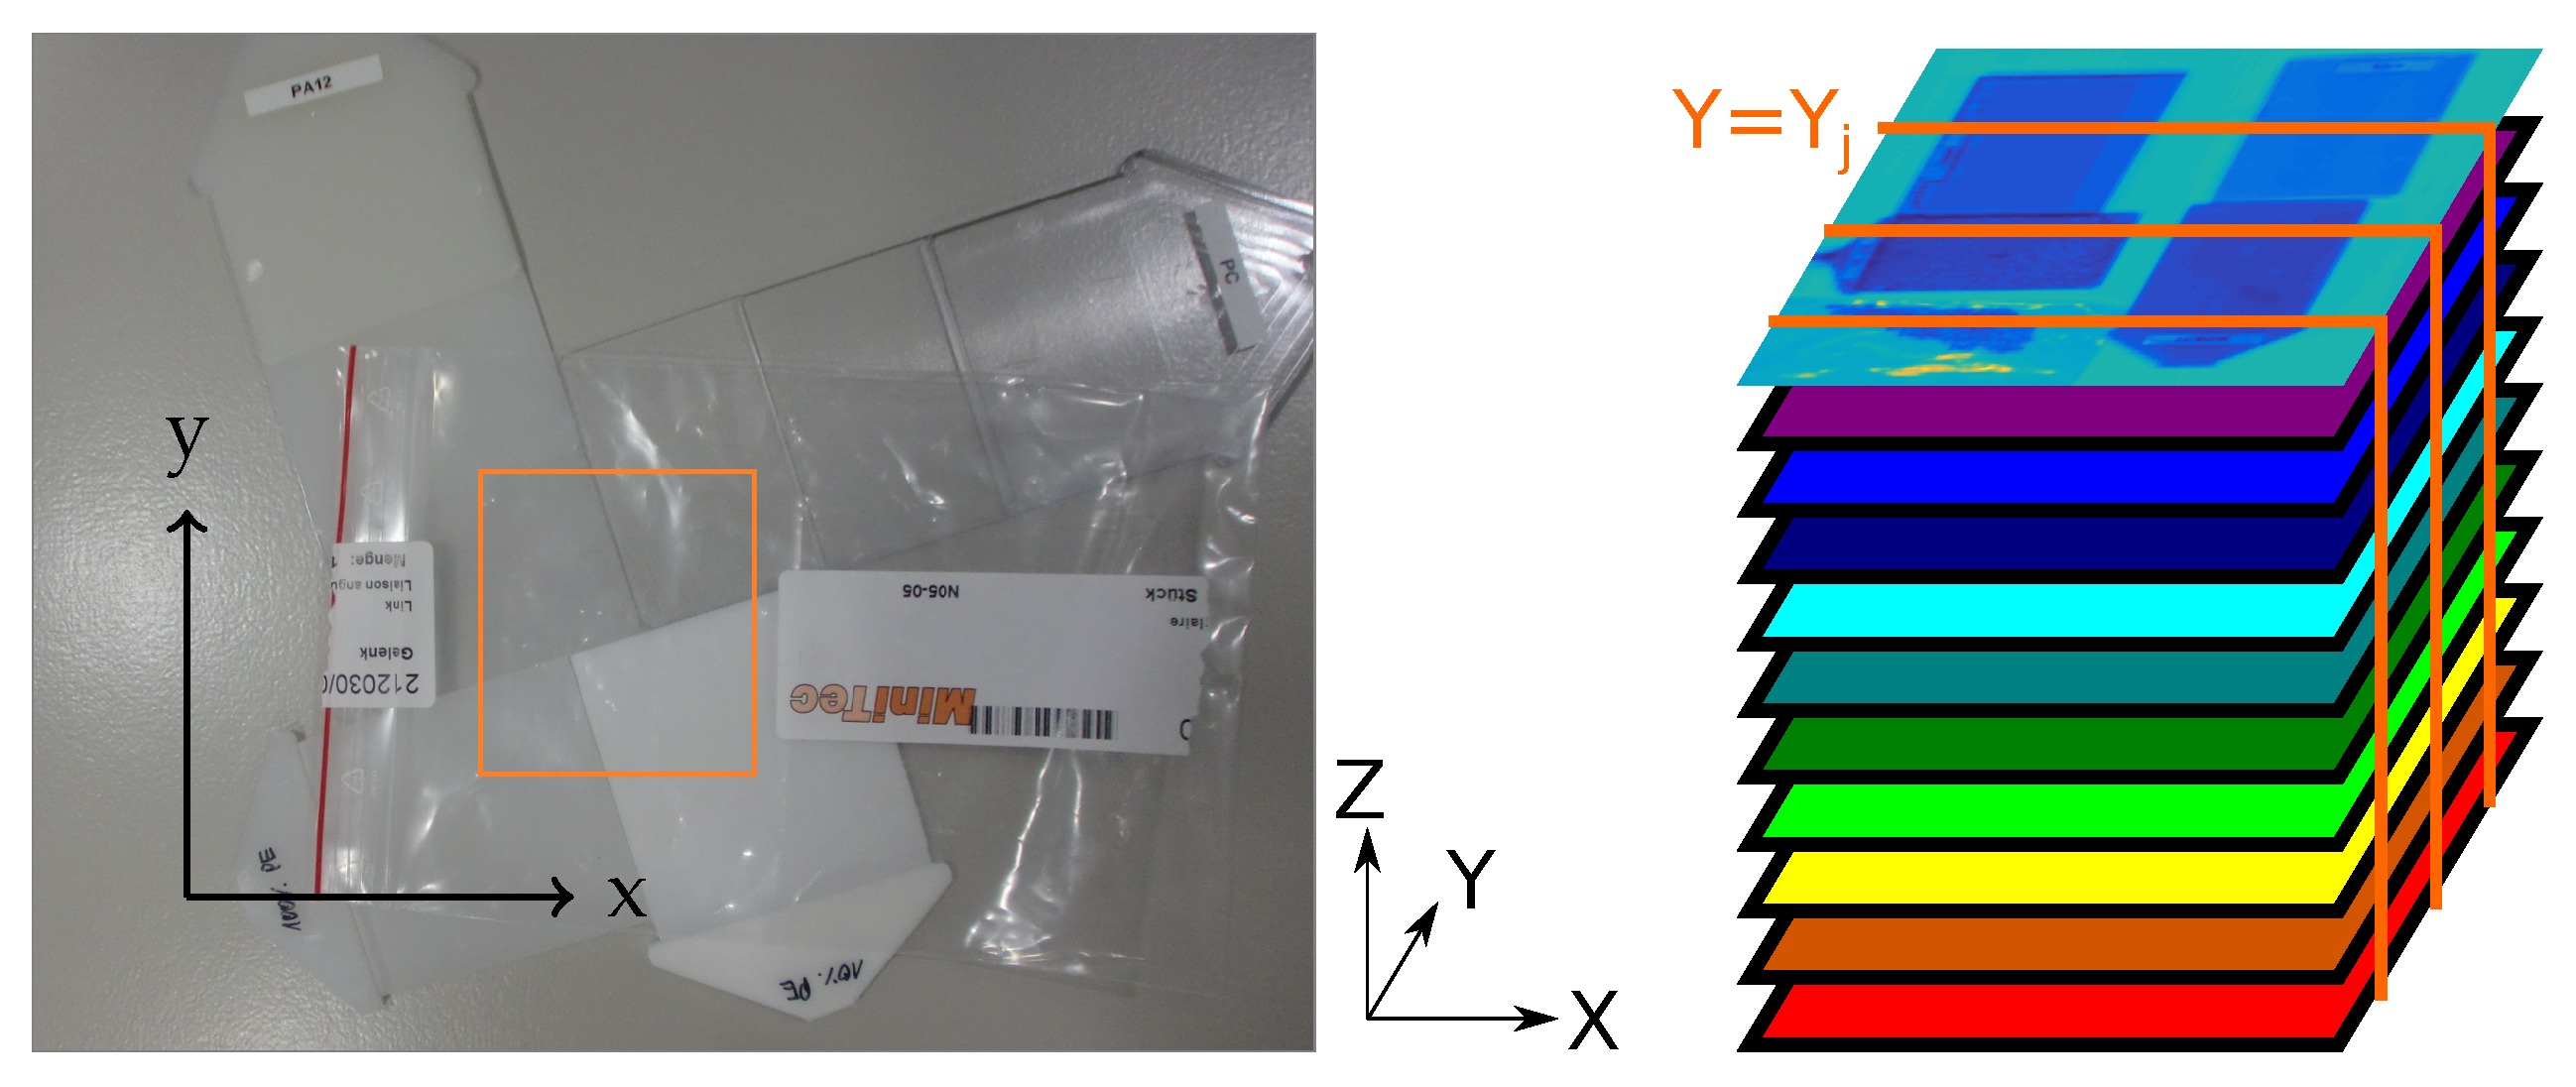
The snapshot of the area sensor taken for the line of the object yields a section of the hypercube as depicted in Figure 2 (right), where the z-axis is the spectral direction.
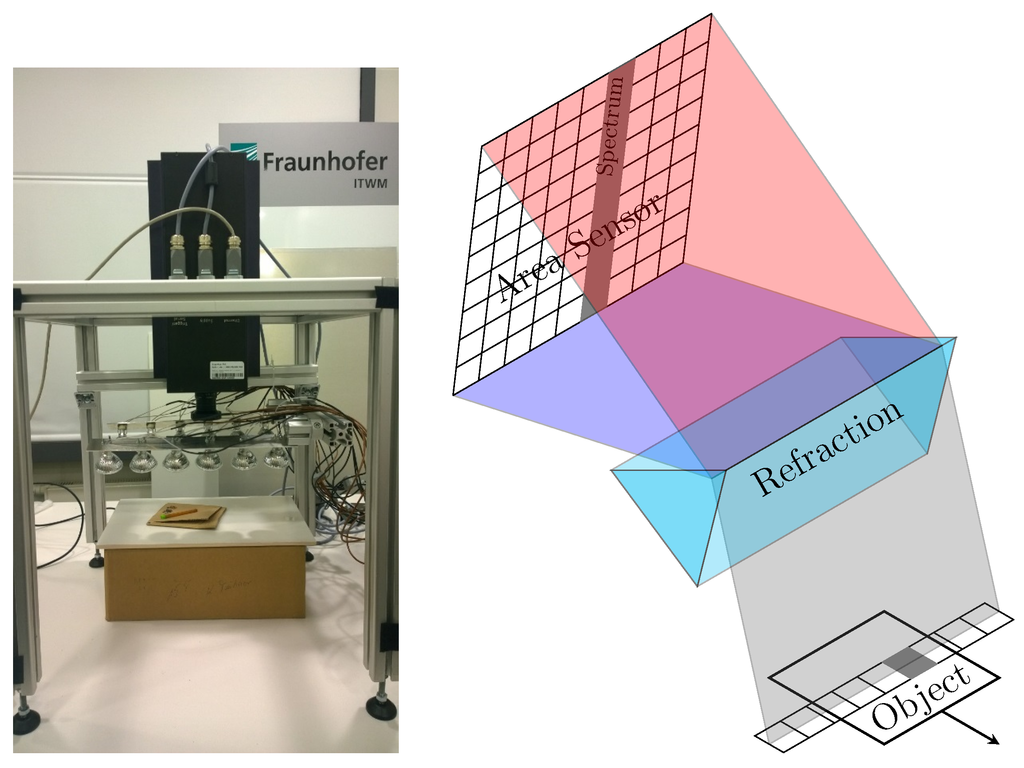
Figure 1.
Hyperspectral line camera (left) and principle of measuring a line simultaneously at all wavelengths (right).
Figure 1.
Hyperspectral line camera (left) and principle of measuring a line simultaneously at all wavelengths (right).
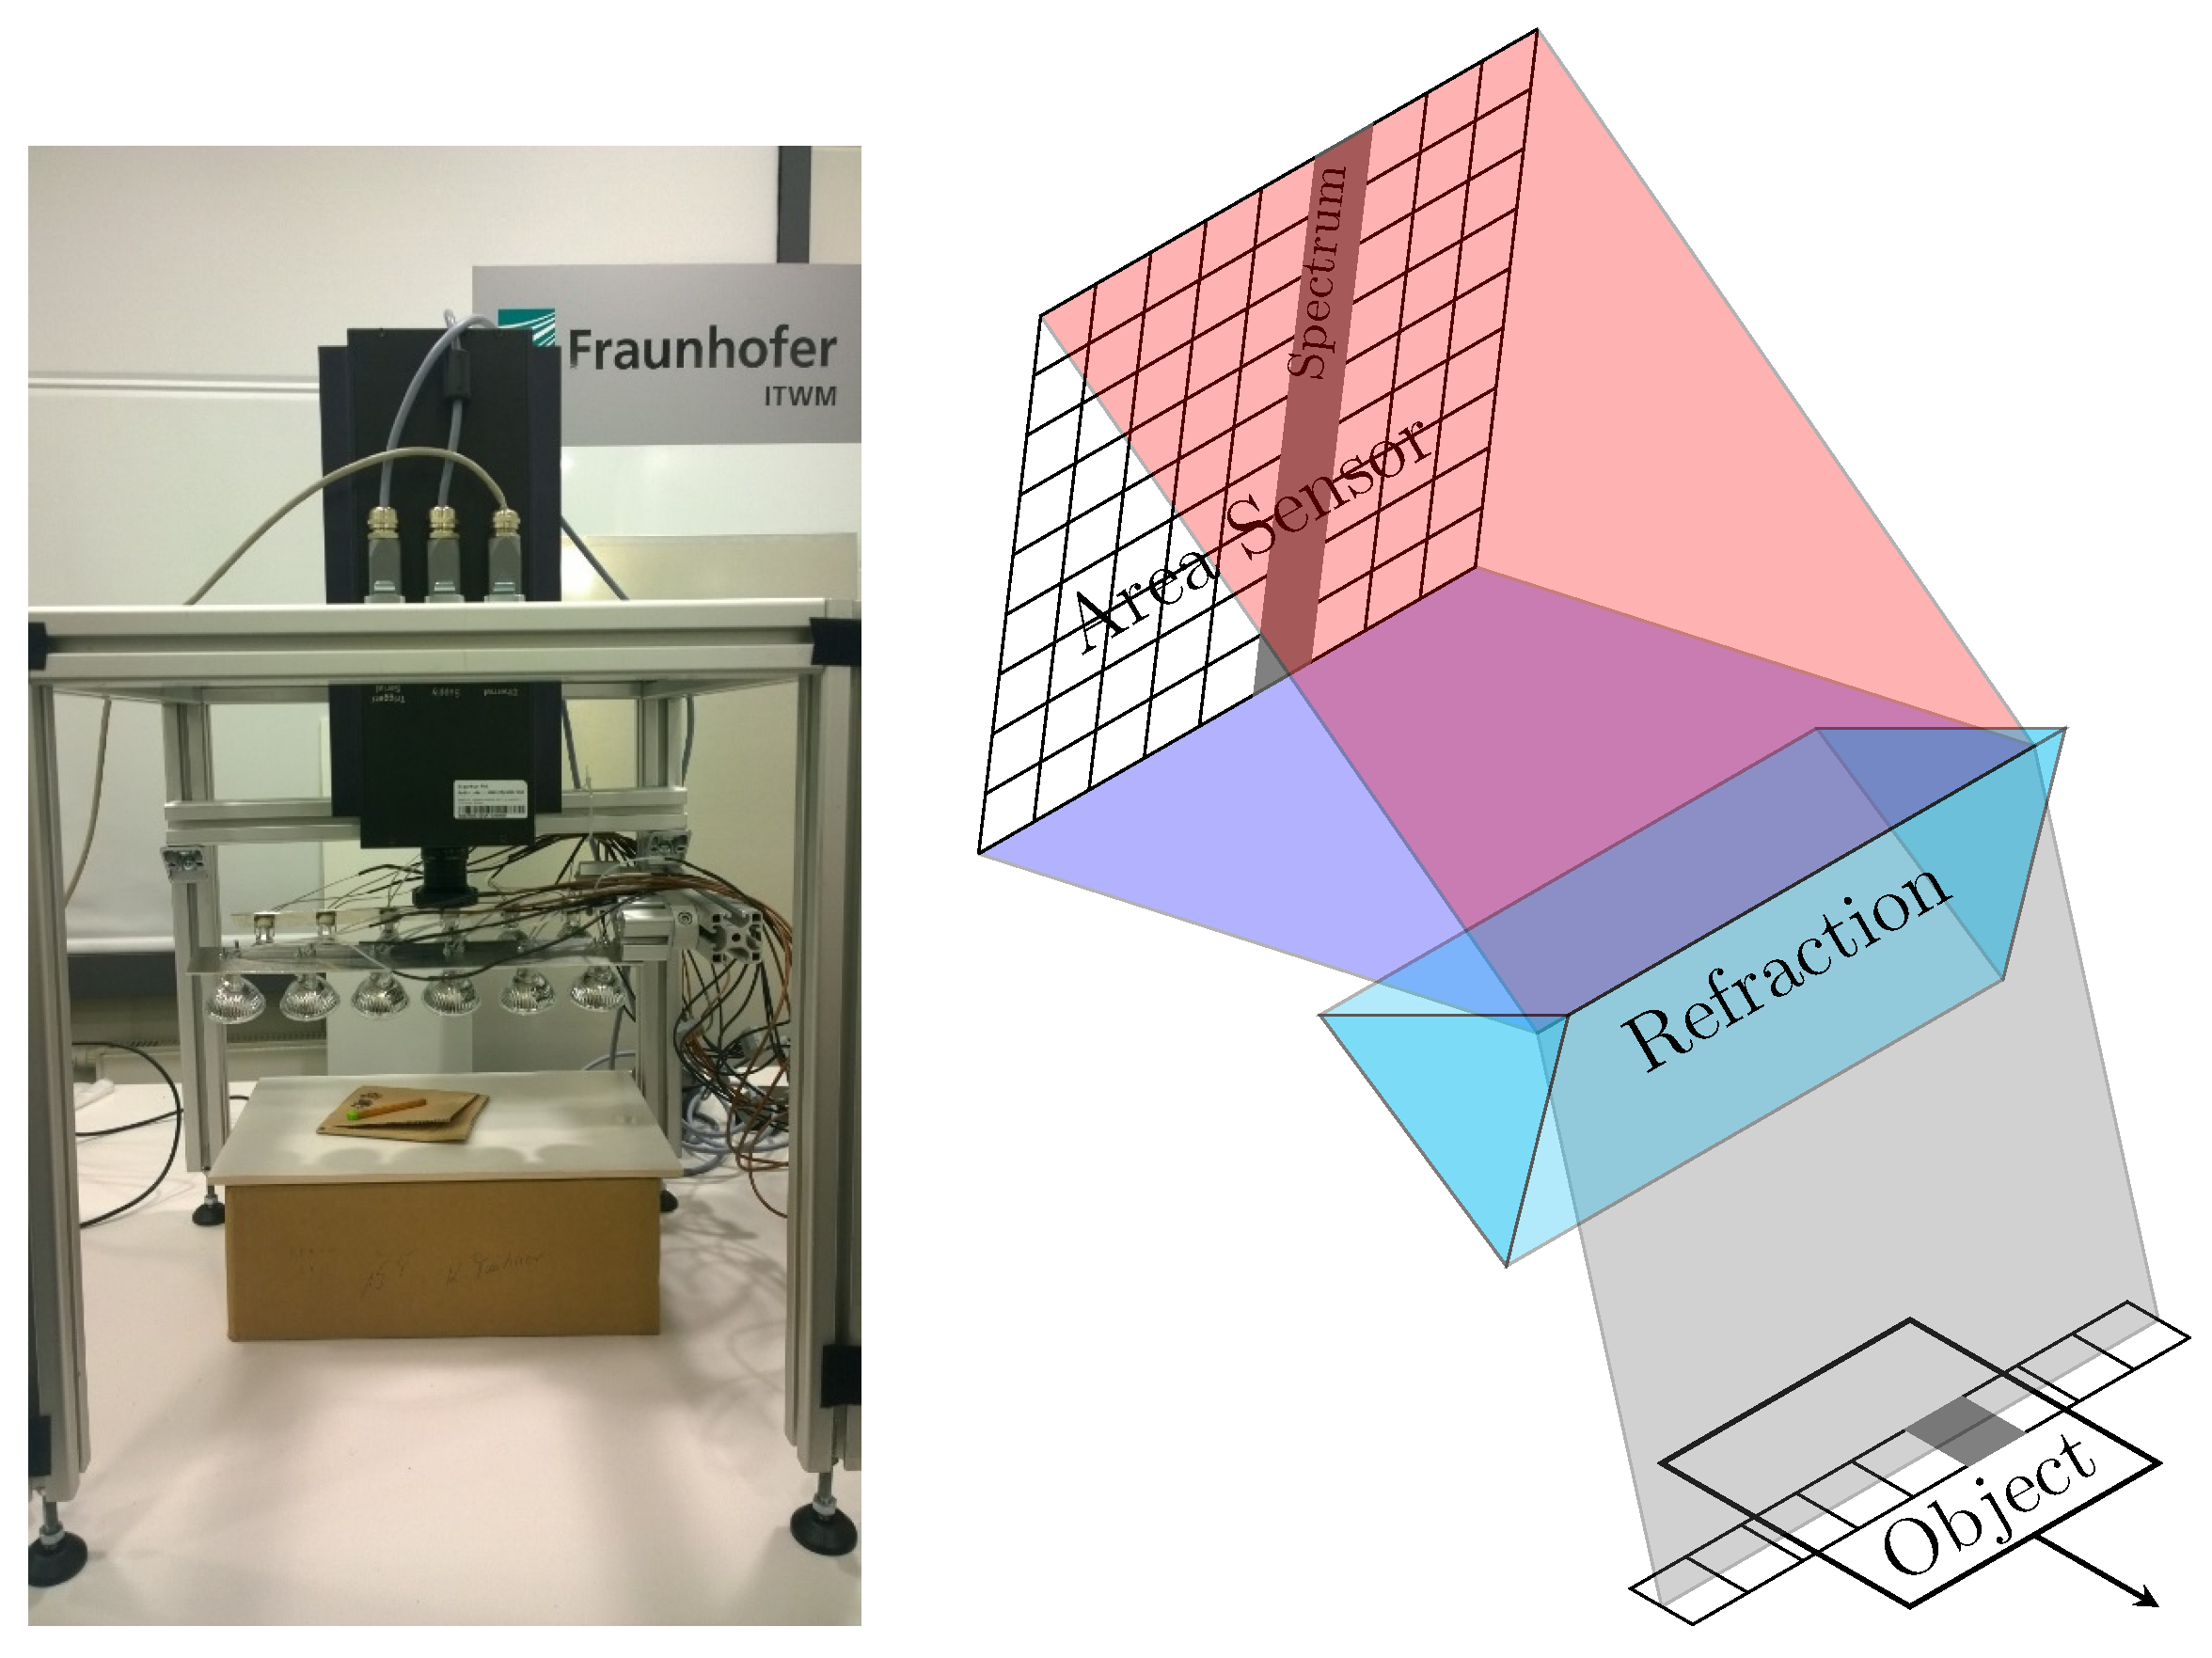
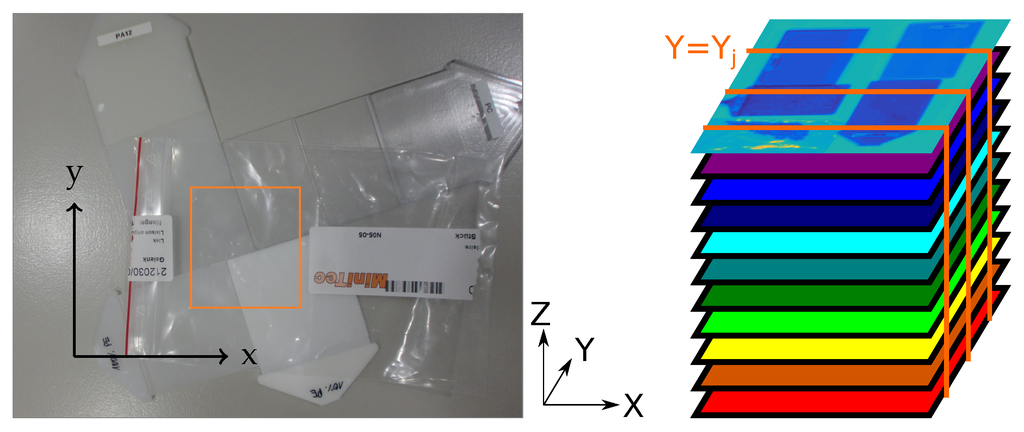
Figure 2.
Measured object region (left) and sensor frames of the hypercube measured each in one sensor snapshot (right); they correspond to one line of the object.
Figure 2.
Measured object region (left) and sensor frames of the hypercube measured each in one sensor snapshot (right); they correspond to one line of the object.
The manufacturing process of the sensor commonly produces some defect pixels. For push-broom scanning, each sensor frame has the same pattern of missing pixels. One missing pixel thus creates a missing line, and a cluster of missing pixels creates a cylinder of missing entries in the hypercube.
4.2. Numerical Results for Real Data
In this section, we present results for a hyperspectral image measured at the Fraunhofer Institute for Industrial Mathematics ITWM with the line camera shown in Figure 1, comparing the restoration obtained as a by-product of our unmixing to a traditional inpainting.
We have measured the marked region in Figure 2 (left), in the wavelength range 1073–2300 nm, at a spectral resolution of channels. The four regions contain plastic mixtures with different spectral signatures, and the assembly has been covered with a plastic foil.
Figure 3c shows the mask of working pixels with a few circular regions of corruption artificially added, marked in violet as “simulated defects”. The small circle marked in red is a real defect, and a camera with such a defect is sold at a considerably reduced price.
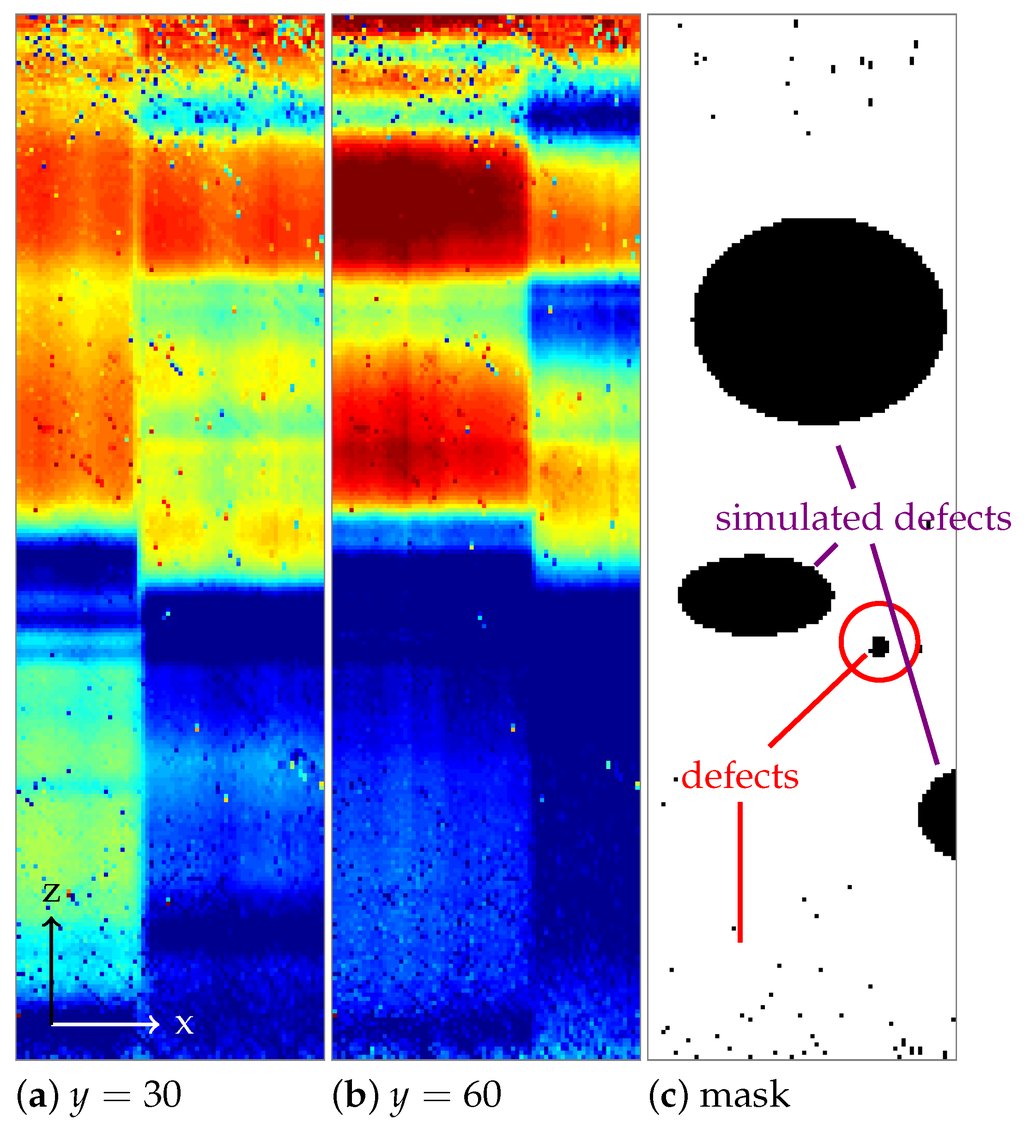
Figure 3.
(a,b) Two sensor frames with the spectral direction along the z-axis and (c) the mask of working sensor pixels.
Figure 3.
(a,b) Two sensor frames with the spectral direction along the z-axis and (c) the mask of working sensor pixels.
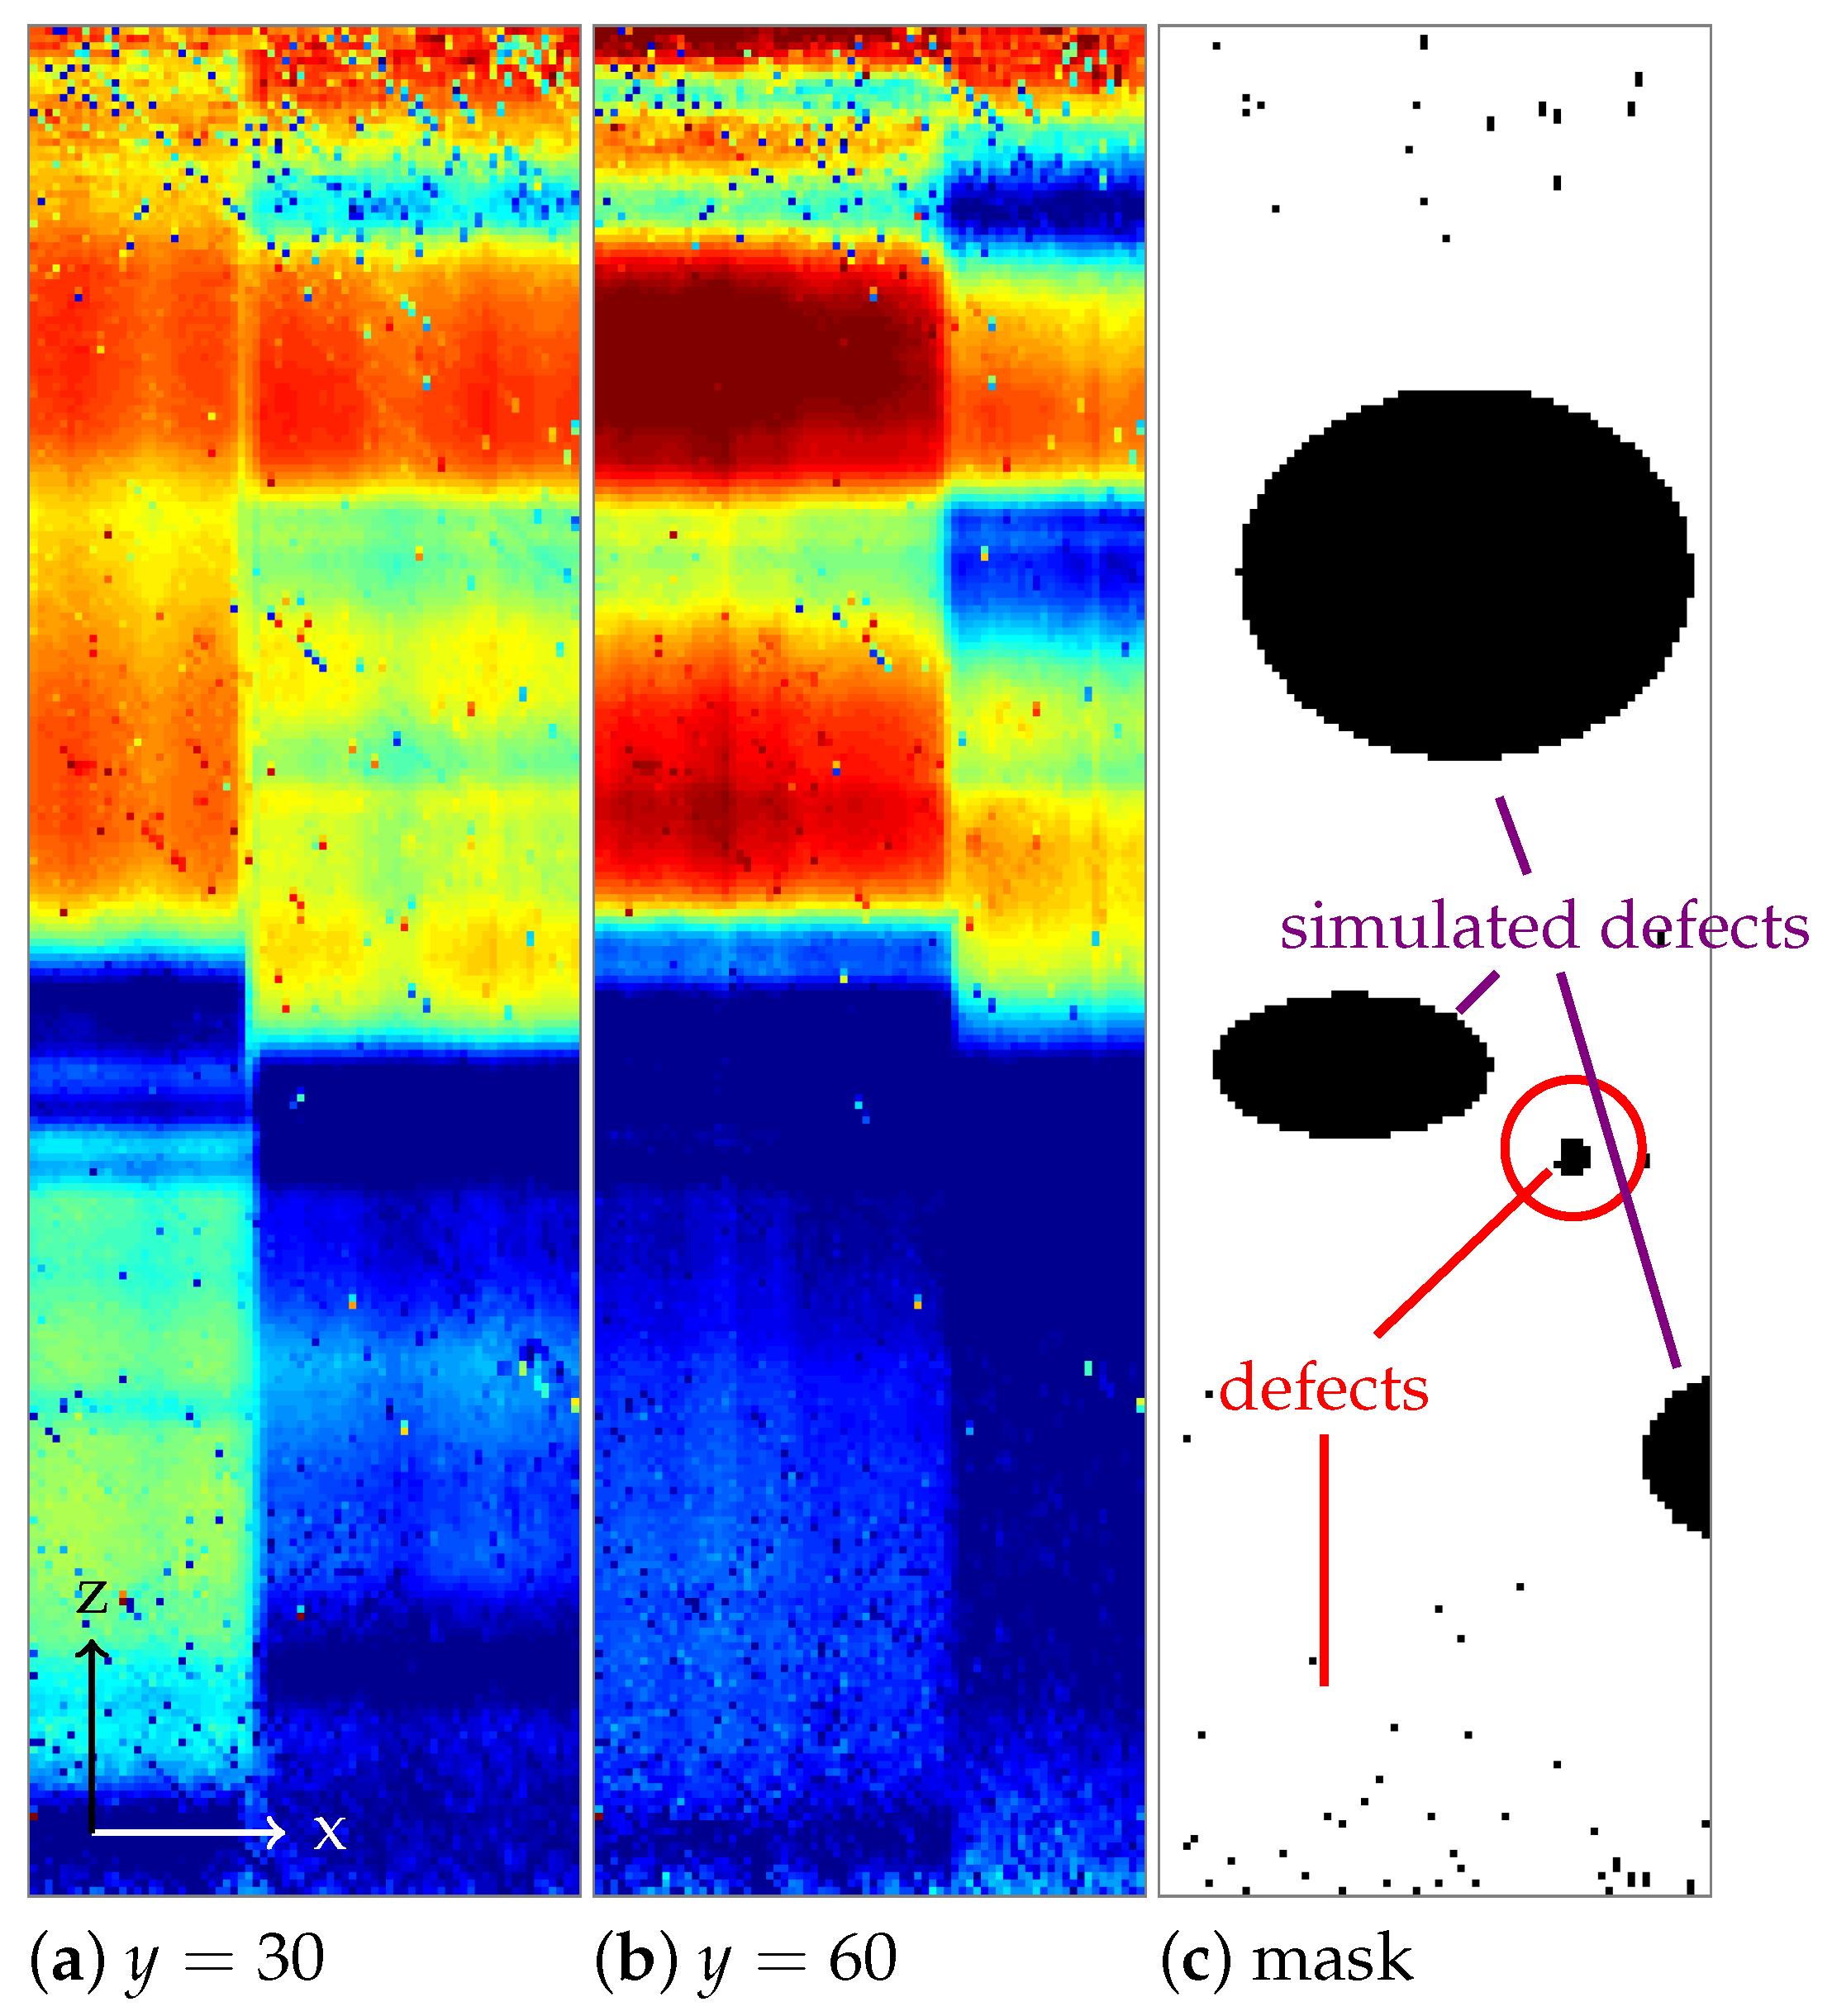
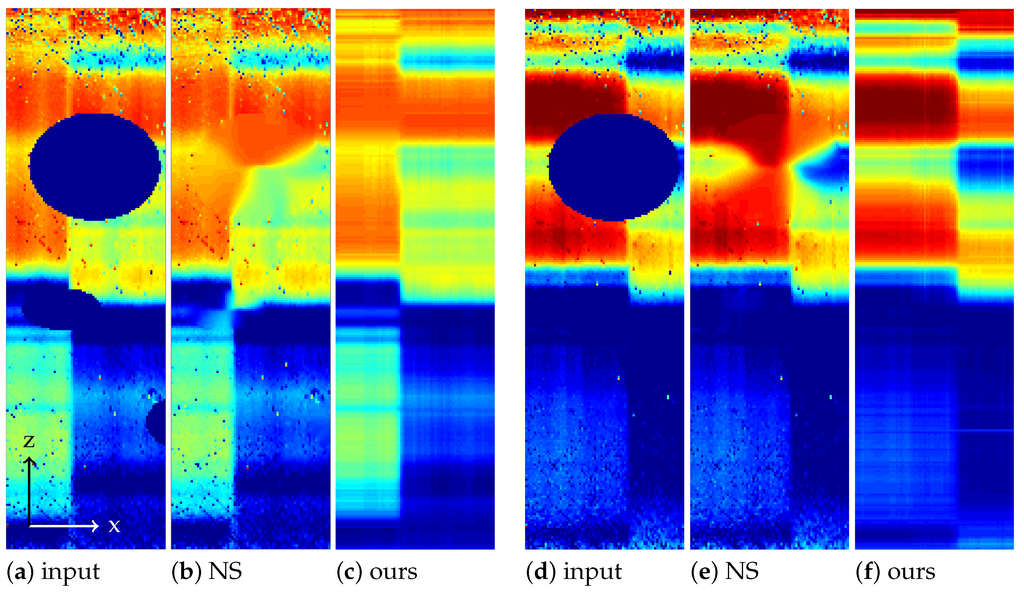
Figure 4.
Sensor frames of masked noisy original input and after inpainting by Navier–Stokes (NS) and our Model (6), respectively; (a–c): sensor frame , and (d–f): .
Figure 4.
Sensor frames of masked noisy original input and after inpainting by Navier–Stokes (NS) and our Model (6), respectively; (a–c): sensor frame , and (d–f): .
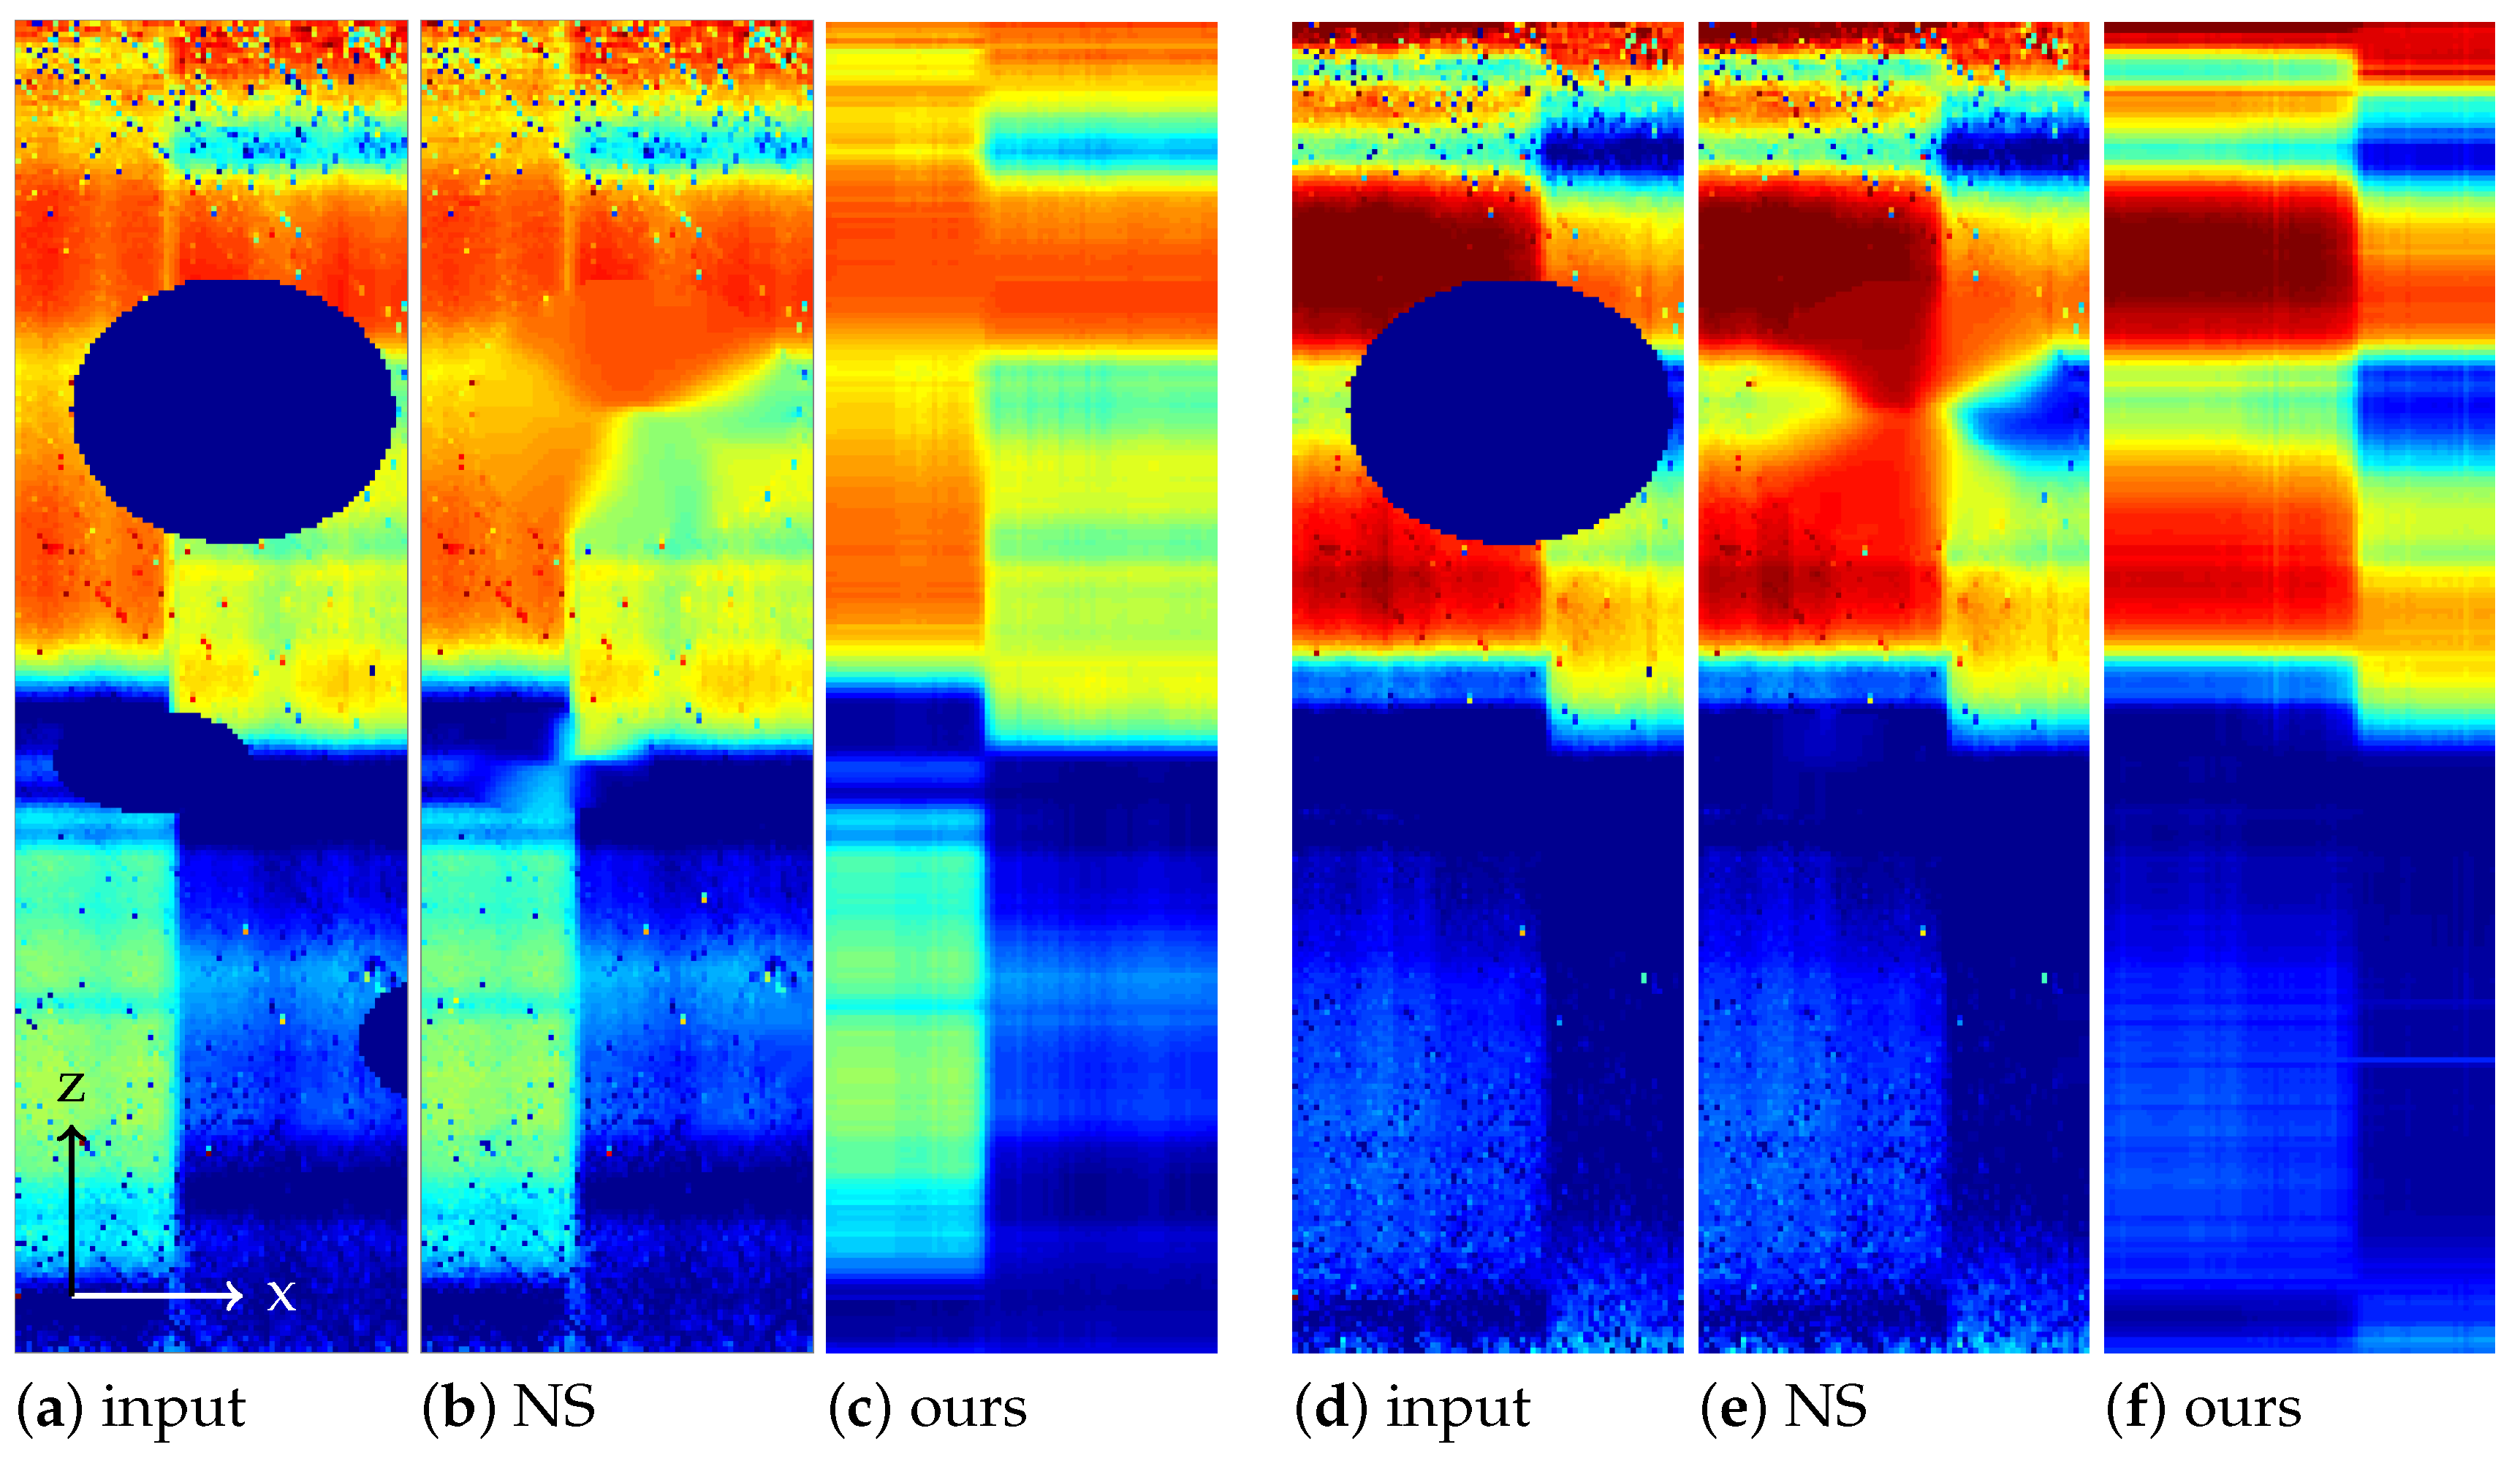
Figure 3a,b shows two sensor frames of the measured hypercube. Being snapshots of the area sensor, they have the same pattern of missing pixels. Figure 4a,d shows the same sections with the artificially added circular defects.
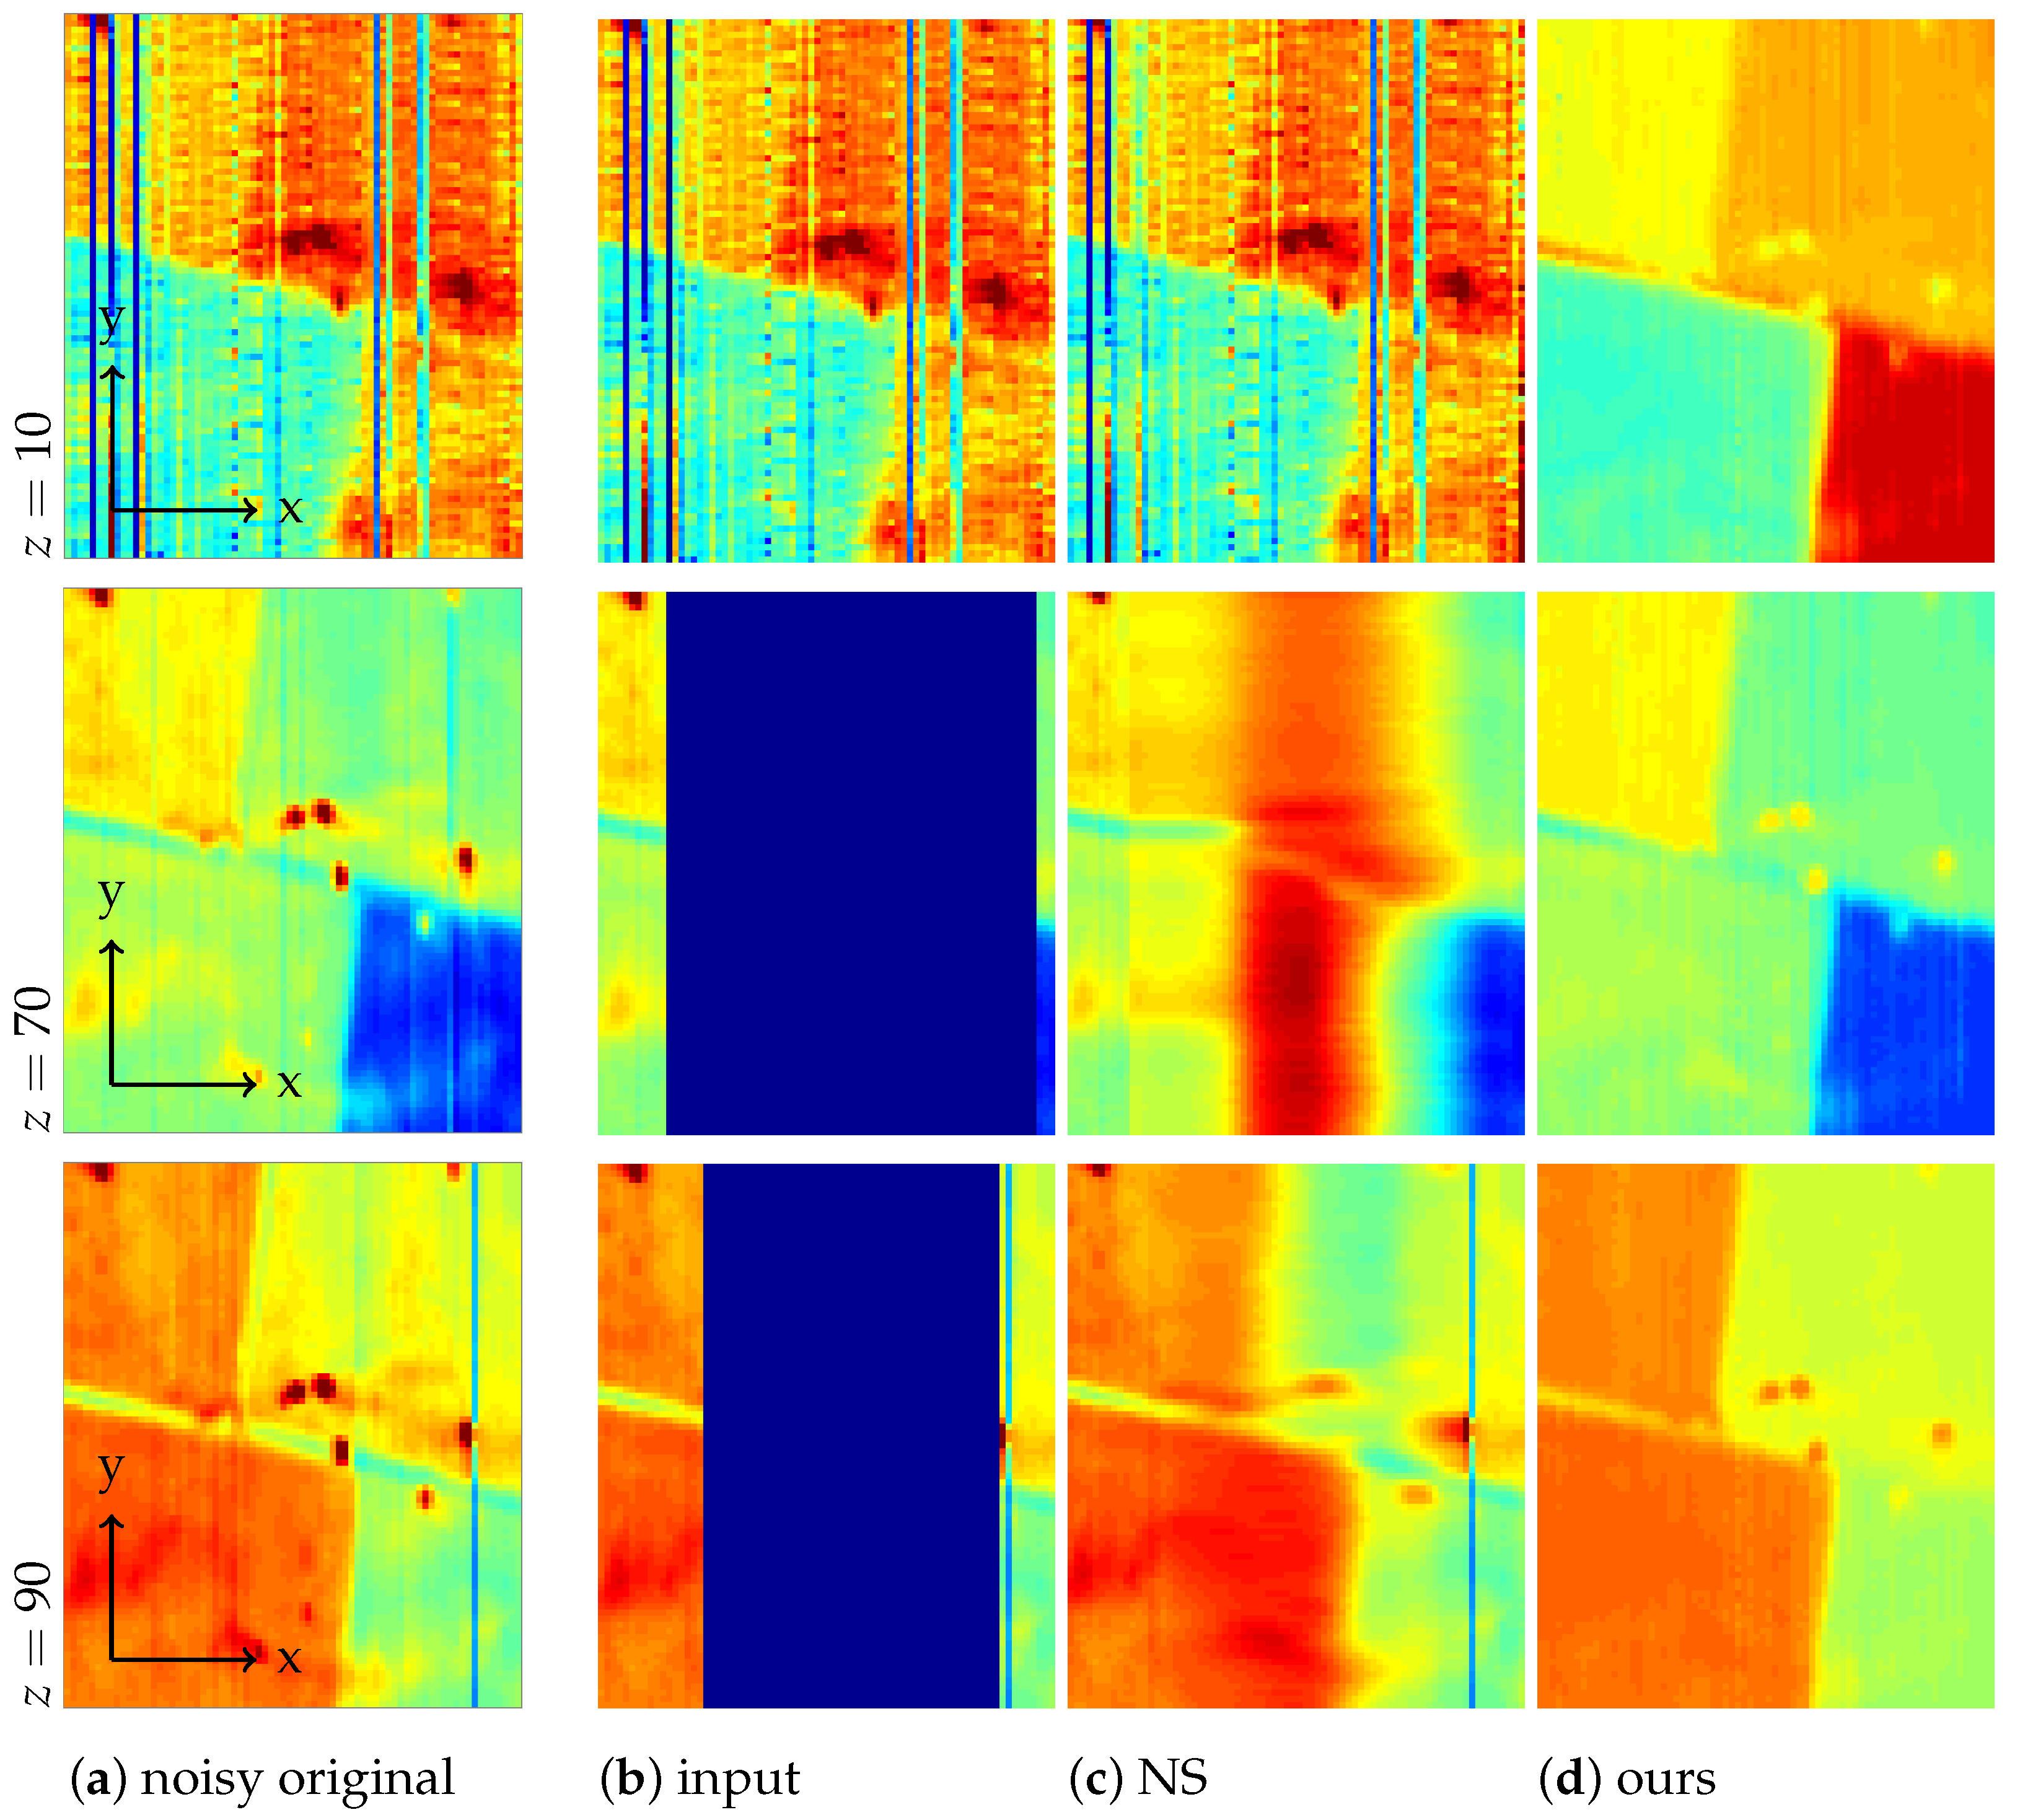
Slices , of the hypercube corresponding to a particular wavelength are called channels. Figure 5a shows Channels . Here, Channel 10 is noisy and affected by individual broken sensor pixels, each creating one missing line. Figure 5b shows the same channels, after the artificial defects have been added, i.e., masked, and while Channel 10 stays unchanged, we see that not much remains of Channels 70 and 90.
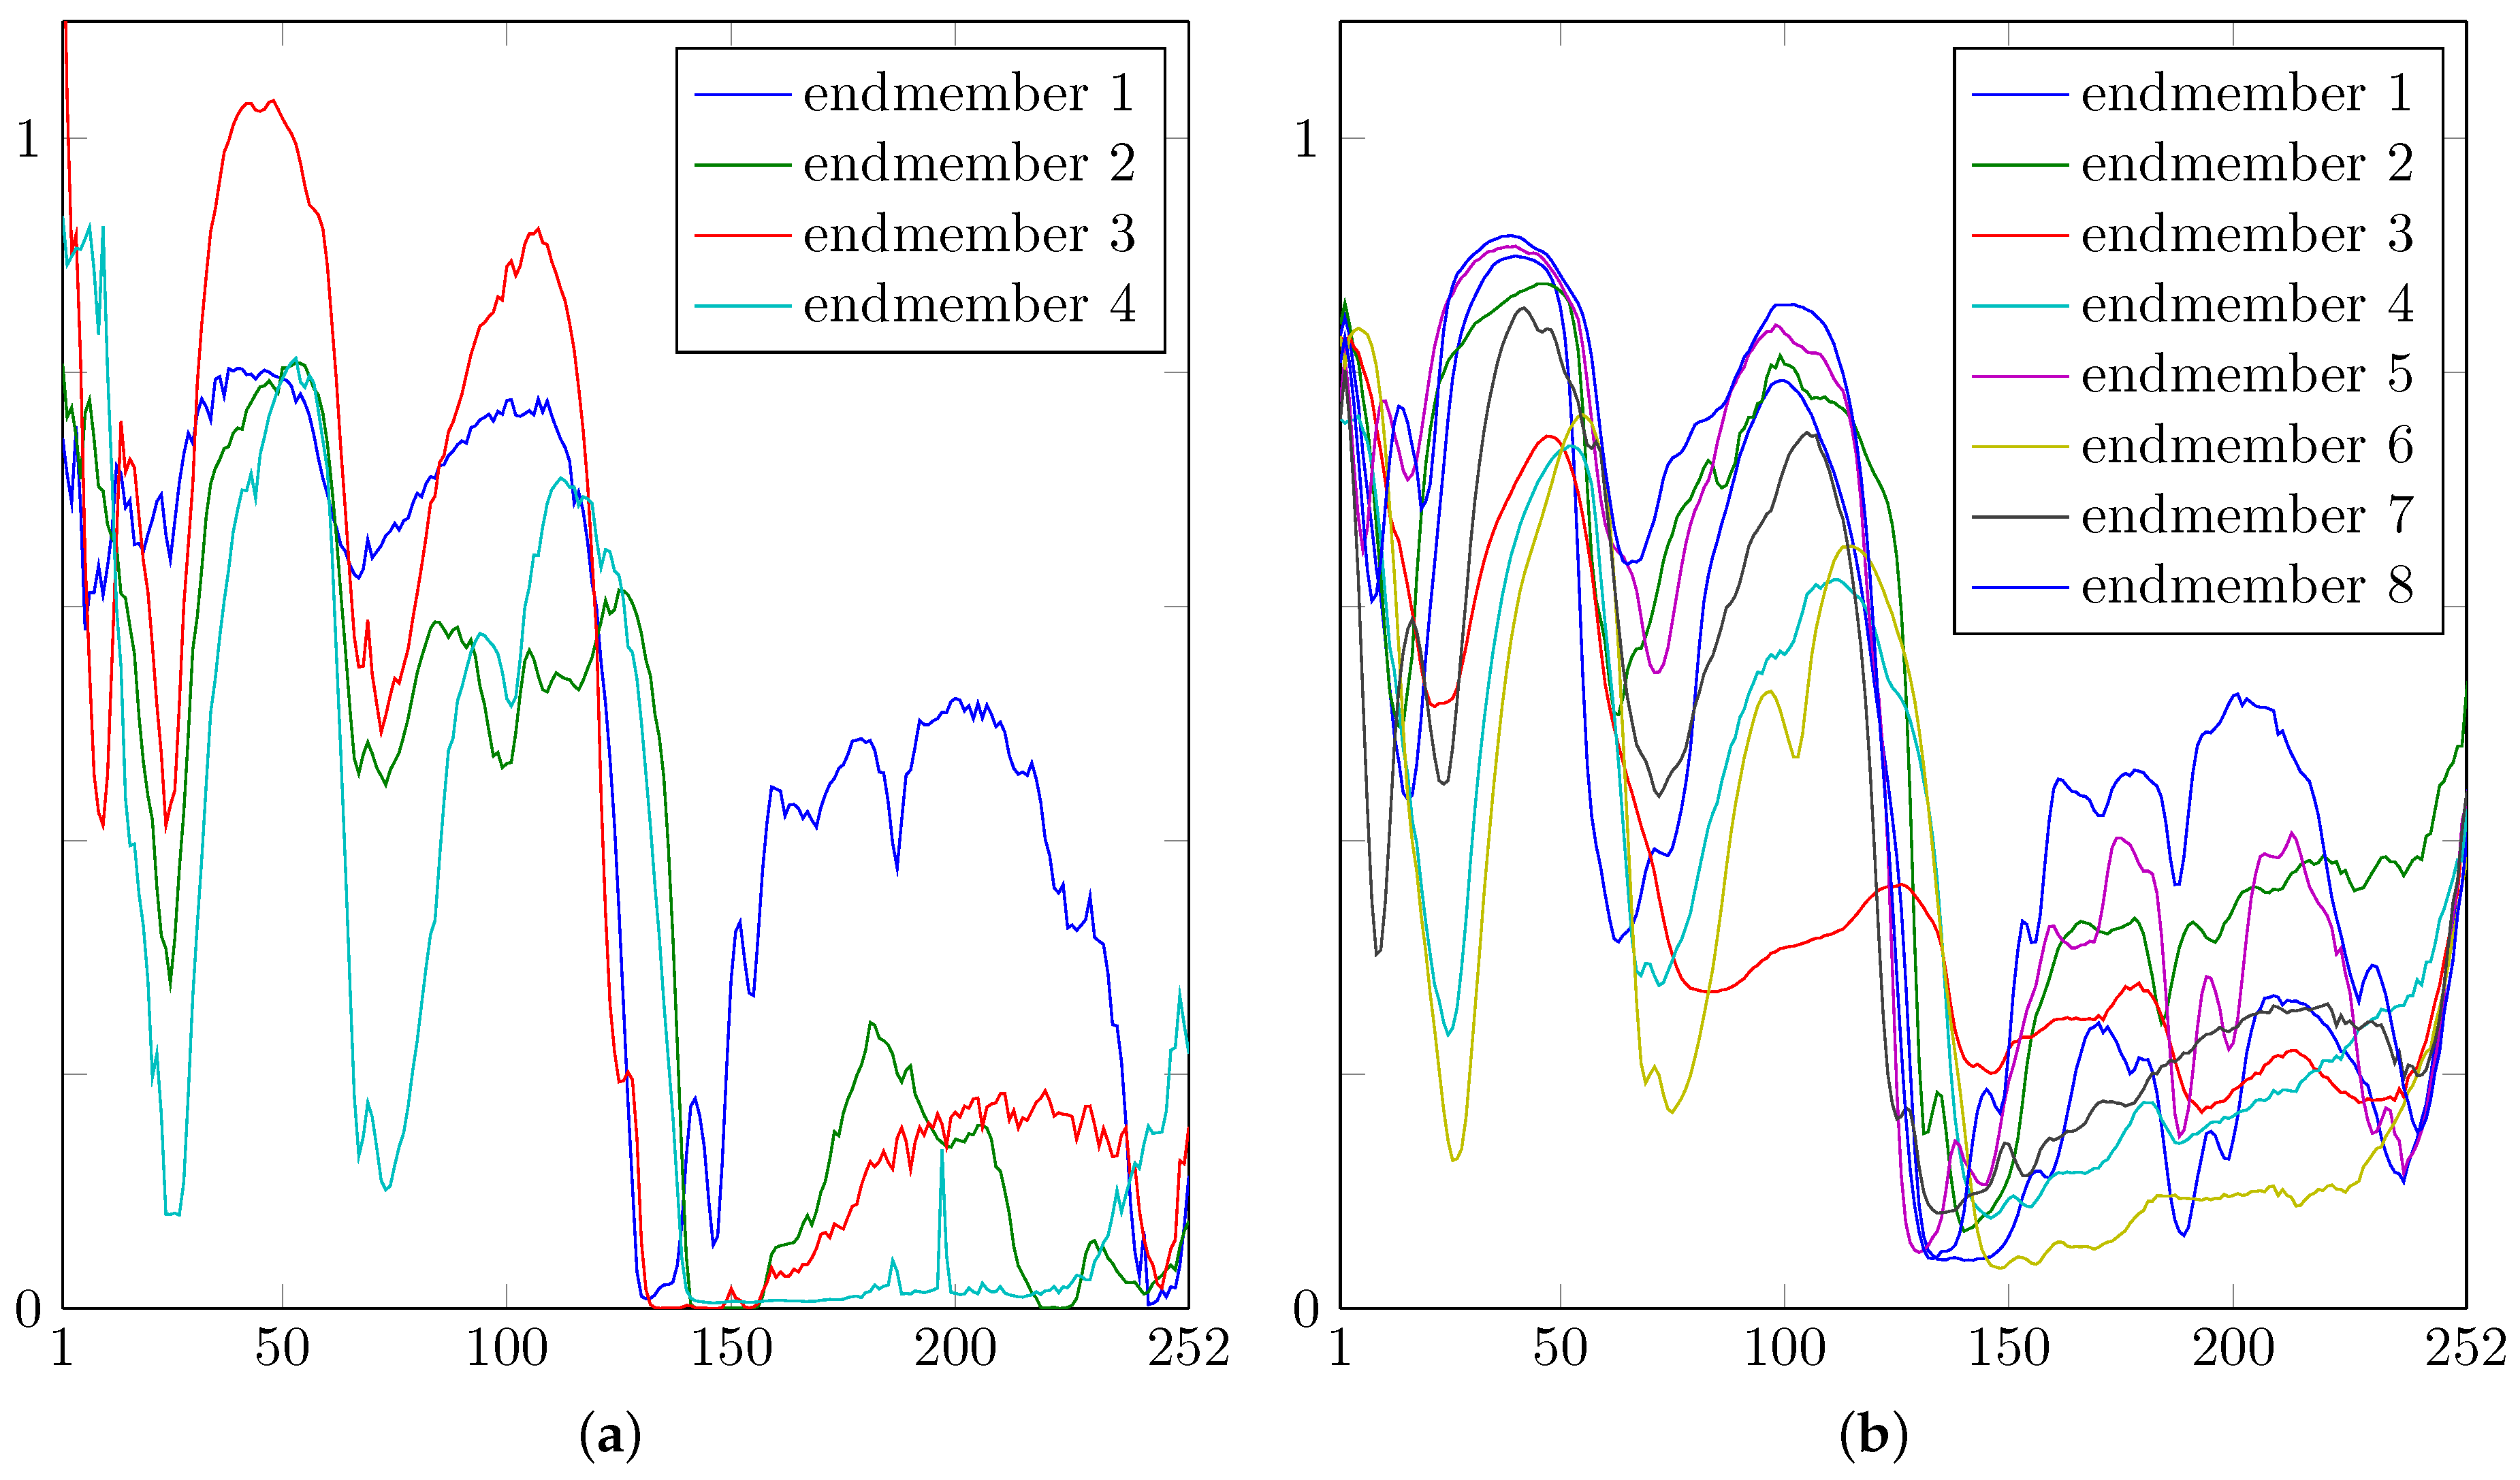
For the unmixing, we give to Algorithm 1 the hypercube together with the mask and the four pure spectra present in the scene, i.e., , as columns of K. These have been obtained from averaging spectra over manually selected rectangles and are shown in Figure 6a.
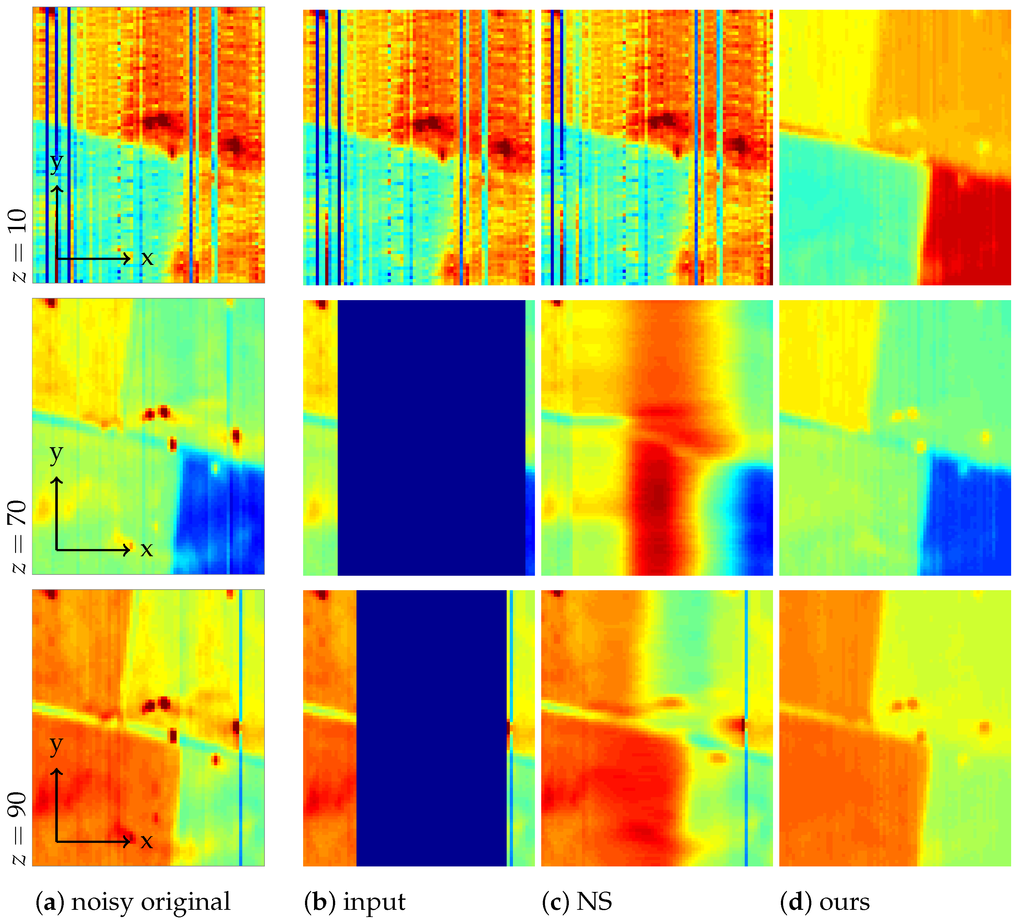
Figure 5.
Channels of: (a) the noisy original hypercube; (b) the masked original known to the algorithm; (c) the restoration by Navier–Stokes; and (d) the restoration by our method.
Figure 5.
Channels of: (a) the noisy original hypercube; (b) the masked original known to the algorithm; (c) the restoration by Navier–Stokes; and (d) the restoration by our method.
For the comparison, we take the following approach: Starting from the unmixing coefficients X obtained by minimizing Equation (6) with Algorithm 1, we form the product , which is an approximating restoration of the data matrix Y. After reshaping, we compare this restoration to an inpainting of the hypercube Ycube by [20].
We have chosen the Navier–Stokes-based inpainting [20] as representative of neighborhood-based inpainting methods. The Navier–Stokes inpainting is performed in each x-z-plane of the hypercube and estimates missing data looking at surrounding pixels in that plane. In contrast to the proposed method, such neighborhood-based inpainting of the data cube lacks the capacity of utilizing the provided information about pure spectra. Runtime is several minutes.
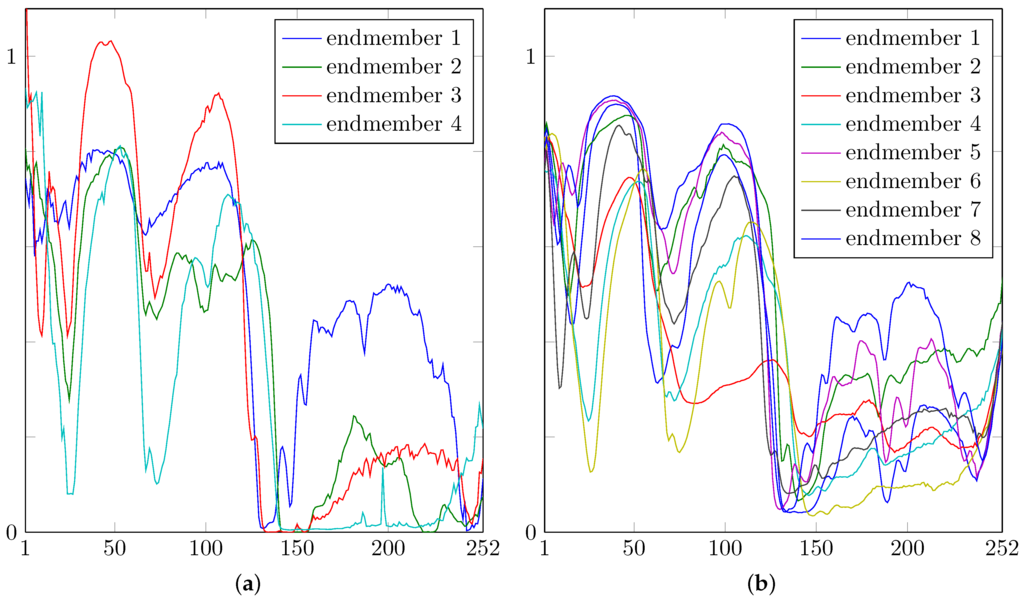
Figure 6.
(a) The four endmember spectra () corresponding to each of the plastics blends in Figure 2 (left); (b) the eight endmember spectra () used in Section 4.5.
Figure 6.
(a) The four endmember spectra () corresponding to each of the plastics blends in Figure 2 (left); (b) the eight endmember spectra () used in Section 4.5.
For Algorithm 1, we used the parameters from Remark 2 and . The relative primal step fell below after 111 iterations, which took s on an Intel Core i7 with GHz. The graphics shown are after 1000 iterations.
In Figure 4 and Figure 5, we compare the performance of Algorithm 1 to a Navier–Stokes inpainting of each x-z-plane of the hypercube.
For larger clusters of defect pixels, the inpainting of the hypercube by Navier–Stokes is not satisfactory: looking at Figure 4, the large masked region could still be guessed from the images inpainted with Navier–Stokes. On the other hand, the inpainted sensor images obtained from our method in Figure 4c,f agree well with the measured sensor frames in Figure 3a,b, also removing some noise, which was not contained in the mask.
In Figure 5, we see that the broader missing stripes in Channels 70 and 90 cannot be restored by Navier–Stokes inpainting and, hence, would introduce errors to any following unmixing step, whereas our joint unmixing remains unaffected and gives a satisfactory (denoised) restoration of the original, because the information from all intact channels is being used.
4.3. Numerical Results for Artificial Data (Pure Regions)
We have seen that our unmixing model performs well even if large parts of the hypercube are missing. To analyze which percentage of sensor pixels can be missing, i.e., to quantify the unmixing results in some way, in this section, we use an artificial input image with a small level of noise added.
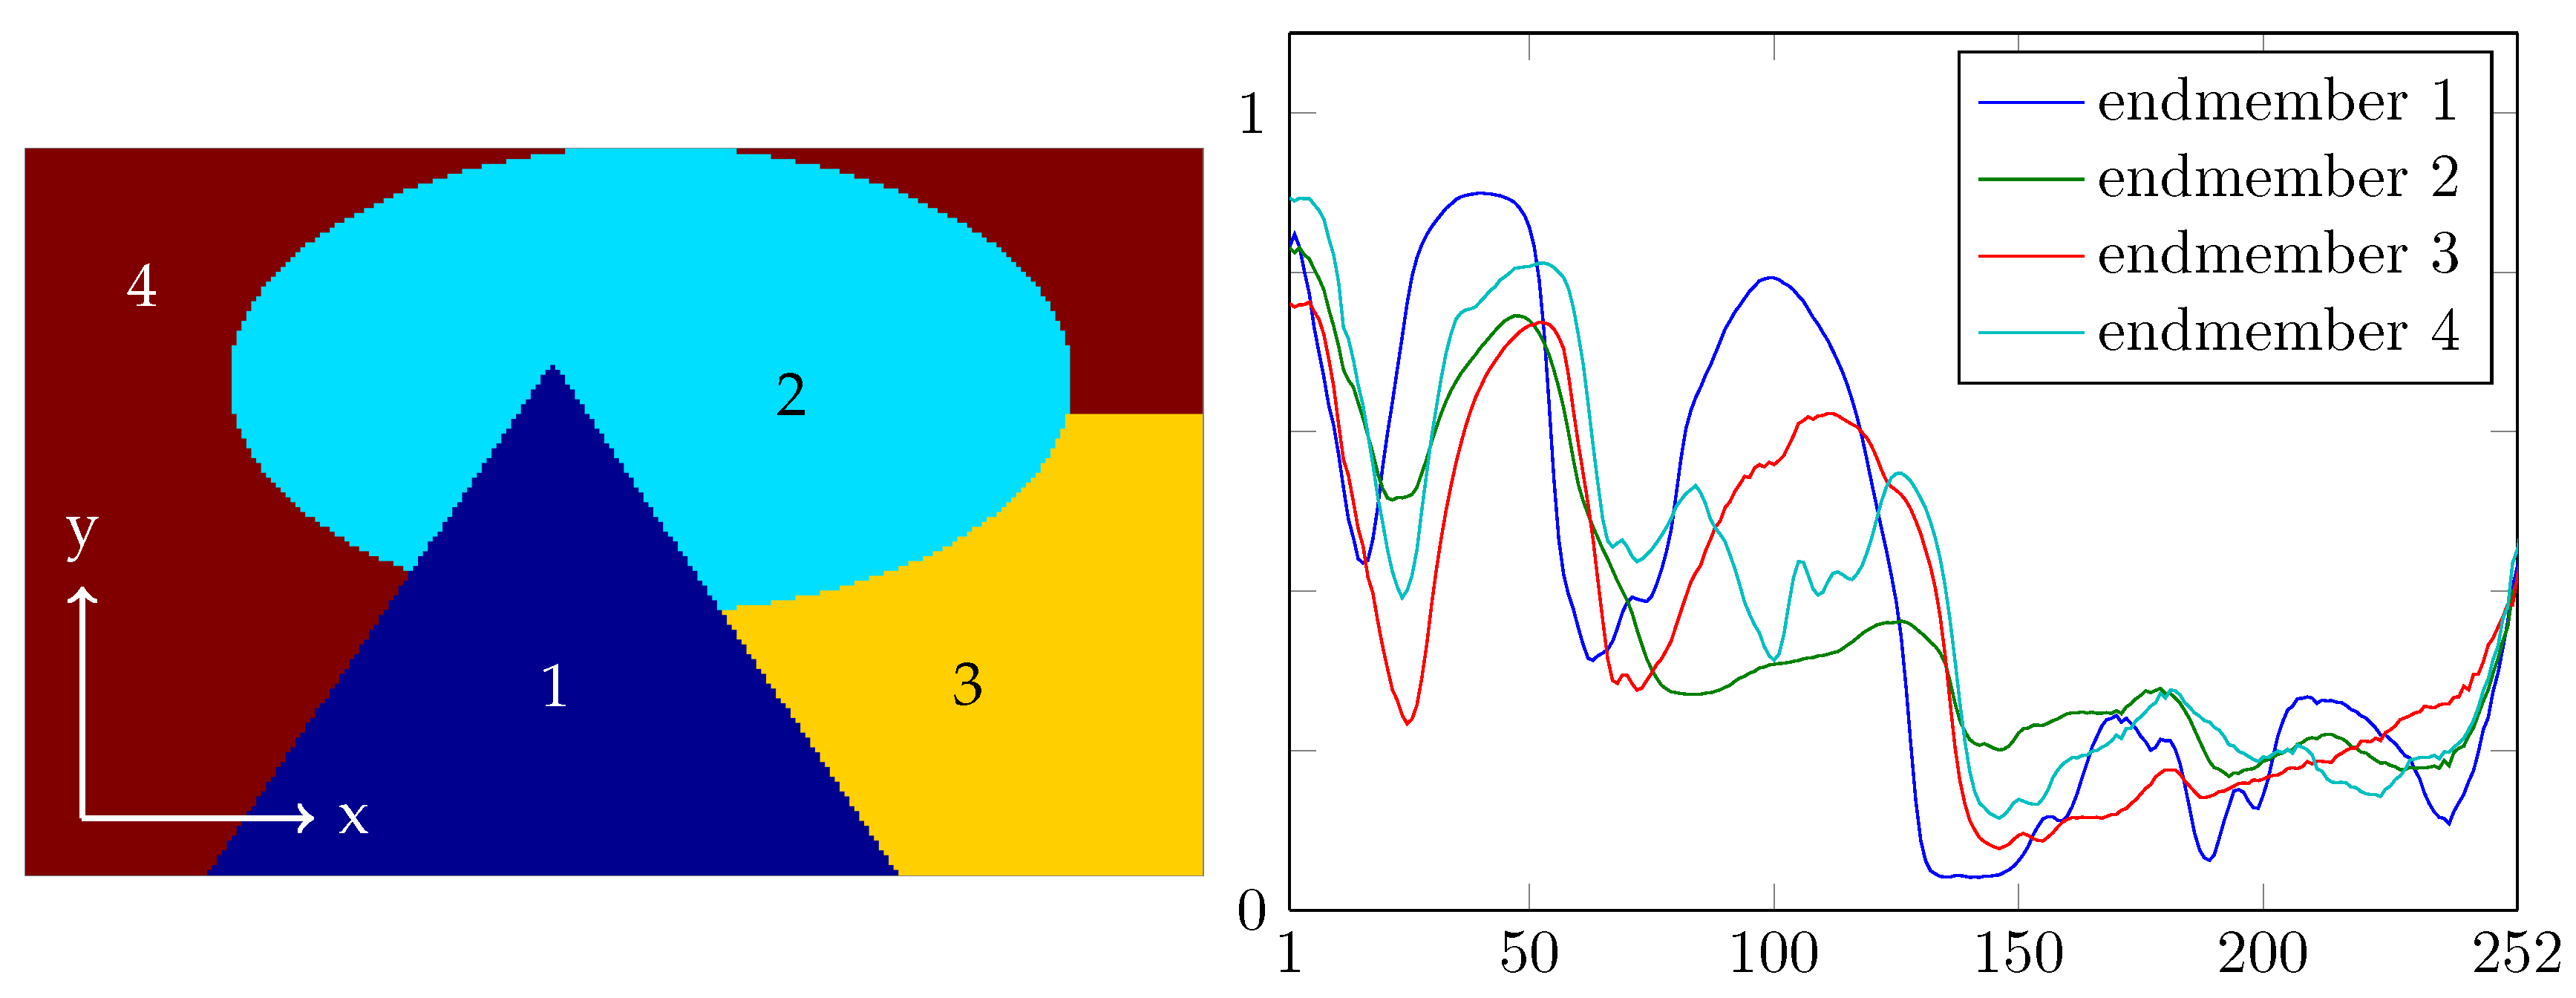
The artificial image is constructed as follows. The j-th of the four regions of the piecewise constant ground truth image in Figure 7 (left), is filled with copies of the j-th endmember spectrum. The four endmember spectra, which form the columns of the matrix K, are shown in Figure 7 (right). The spectra come from our measurements of common plastic blends. The resulting hypercube belongs to . We add independent zero-mean Gaussian noise to each entry , obtaining the hypercube . Here, the standard deviation was taken slightly larger than 1% of the maximal entry of .
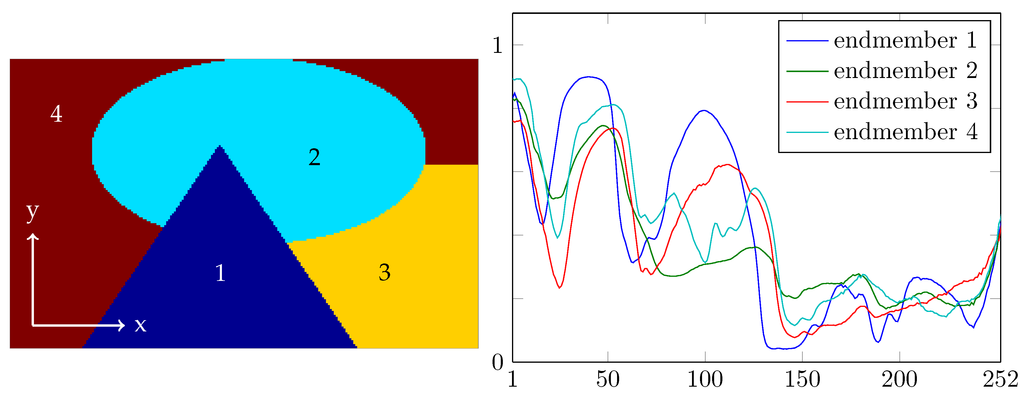
Figure 7.
The artificial image is constructed by filling region j of the image on the left with the j-th endmember spectrum on the right ().
Figure 7.
The artificial image is constructed by filling region j of the image on the left with the j-th endmember spectrum on the right ().
For several percentages from 100% down to %, we randomly generate sensor masks of size with approximately this percentage of working pixels, by flipping a biased coin for each pixel. Figure 8a shows the upper left quarter of the sensor mask for 3% working pixels. Note that the percentage of known sensor pixels and the percentage of entries of which are known to the unmixing algorithm, are the same, because each masked sensor pixel corresponds to one line in the hypercube along the y-axis.
For each percentage and corresponding mask applied to , we find the minimizer X of Equation (6) by Algorithm 1 with and other parameters as in Remark 2; running 300 iterations took an average of s per image. Then, we reshape X into the cube of unmixing coefficients. To quantify the quality of , we assign to each image pixel the endmember corresponding to the largest of the four unmixing coefficients at that image pixel. Some of the resulting label images are shown in Figure 8b. Table 1 lists the percentages of correctly assigned pixels depending on the percentage of known sensor pixels. For more than 10% working sensor pixels, the algorithm found the largest material abundance at the correct material for 100% of the image pixels.

Figure 8.
(a) Upper left corner of the mask for 3% working sensor pixels; (b) label maps obtained from the unmixing by assigning to pixel the index r of the largest coefficient at that location.
Figure 8.
(a) Upper left corner of the mask for 3% working sensor pixels; (b) label maps obtained from the unmixing by assigning to pixel the index r of the largest coefficient at that location.

Furthermore, in Table 1, we give the results from minimizing the model obtained by replacing isotropic TV in Model (6) with anisotropic TV, as introduced in Remark 1. The results are slightly worse, though not much.

Table 1.
Percentage of image pixels, for which the largest of the material abundances found by the unmixing, correctly identifies the material at that pixel.
| sensor pixels known, in % | 30 | 10 | 3 | 1 | 0.3 | 0.1 |
| correctly assigned image pixels using TV, in % | 100 | 100 | 99.5 | 96.3 | 83.9 | 54.1 |
| correctly assigned image pixels using , in % | 100 | 100 | 99.4 | 95.5 | 82.8 | 52.7 |
4.4. Numerical Results for Artificial Data (Mixed Regions)
Next, we construct a test image comprising patches of linear mixtures of the endmembers, to meet the real-world scenario of mixed pixels. We take again the four endmembers shown in Figure 7, hence again . As shown in the false color visualization of the ground truth in Figure 9 (left), the corners are filled with pure spectra, and along the sides of the image, we form linear mixtures. Then, a larger amount of noise, with a standard deviation of about 10% of the maximum, is added to the hypercube, and only about 10% of the pixels are retained. As in the previous section, we do this by first sampling a sensor mask under the assumption that each sensor pixel works with a probability of 10% and then simulating the line camera measurement. In Figure 9, we plot Channel 40 of the hypercube, in the middle before masking, and on the right, as known to the algorithm.

Figure 9.
Ground truth in false colors (left); Channel 40 of the noisy hypercube (middle); Channel 40 noisy and masked (right); here, 10% are known.
Figure 9.
Ground truth in false colors (left); Channel 40 of the noisy hypercube (middle); Channel 40 noisy and masked (right); here, 10% are known.

Figure 10 shows the obtained abundances, for parameters as in Remark 2 and after 918 iterations, which took s on an Intel Core i7 with GHz. The result is visually identical to the ground truth.

Figure 10.
Unmixing result, knowing 10% of the noisy hypercube. The images show the estimated abundances corresponding to the four pure spectra.
Figure 10.
Unmixing result, knowing 10% of the noisy hypercube. The images show the estimated abundances corresponding to the four pure spectra.

4.5. Numerical Results for Non-Occurring Endmembers
In applications, some of the expected materials might not be present in the image. We proceed as in the previous Section 4.4, except that the endmember matrix K now contains the eight spectra shown in Figure 6b (), of which four are chosen and mixed using the same abundances as in Section 4.4. The abundances obtained from unmixing 10% of the hypercube are shown in Figure 11.
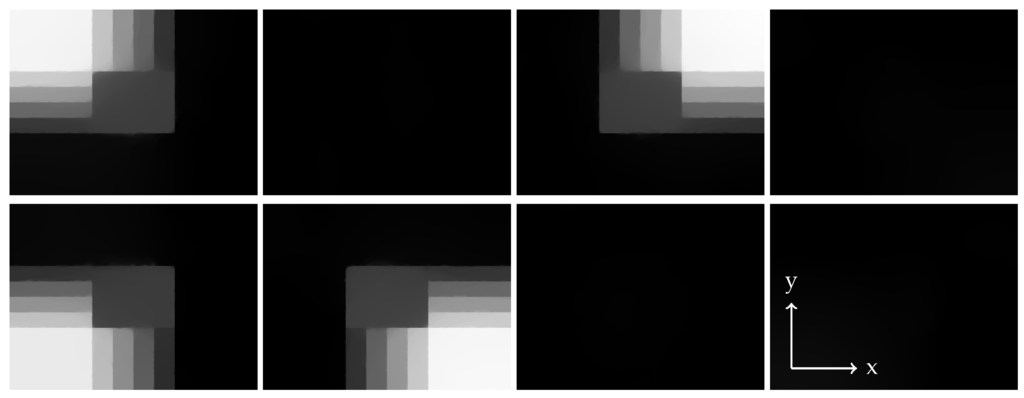
Figure 11.
Unmixing result with eight endmembers of which four occur in the image; with 10% of the noisy hypercube known. The images show the estimated abundances corresponding to the eight pure spectra.
Figure 11.
Unmixing result with eight endmembers of which four occur in the image; with 10% of the noisy hypercube known. The images show the estimated abundances corresponding to the eight pure spectra.
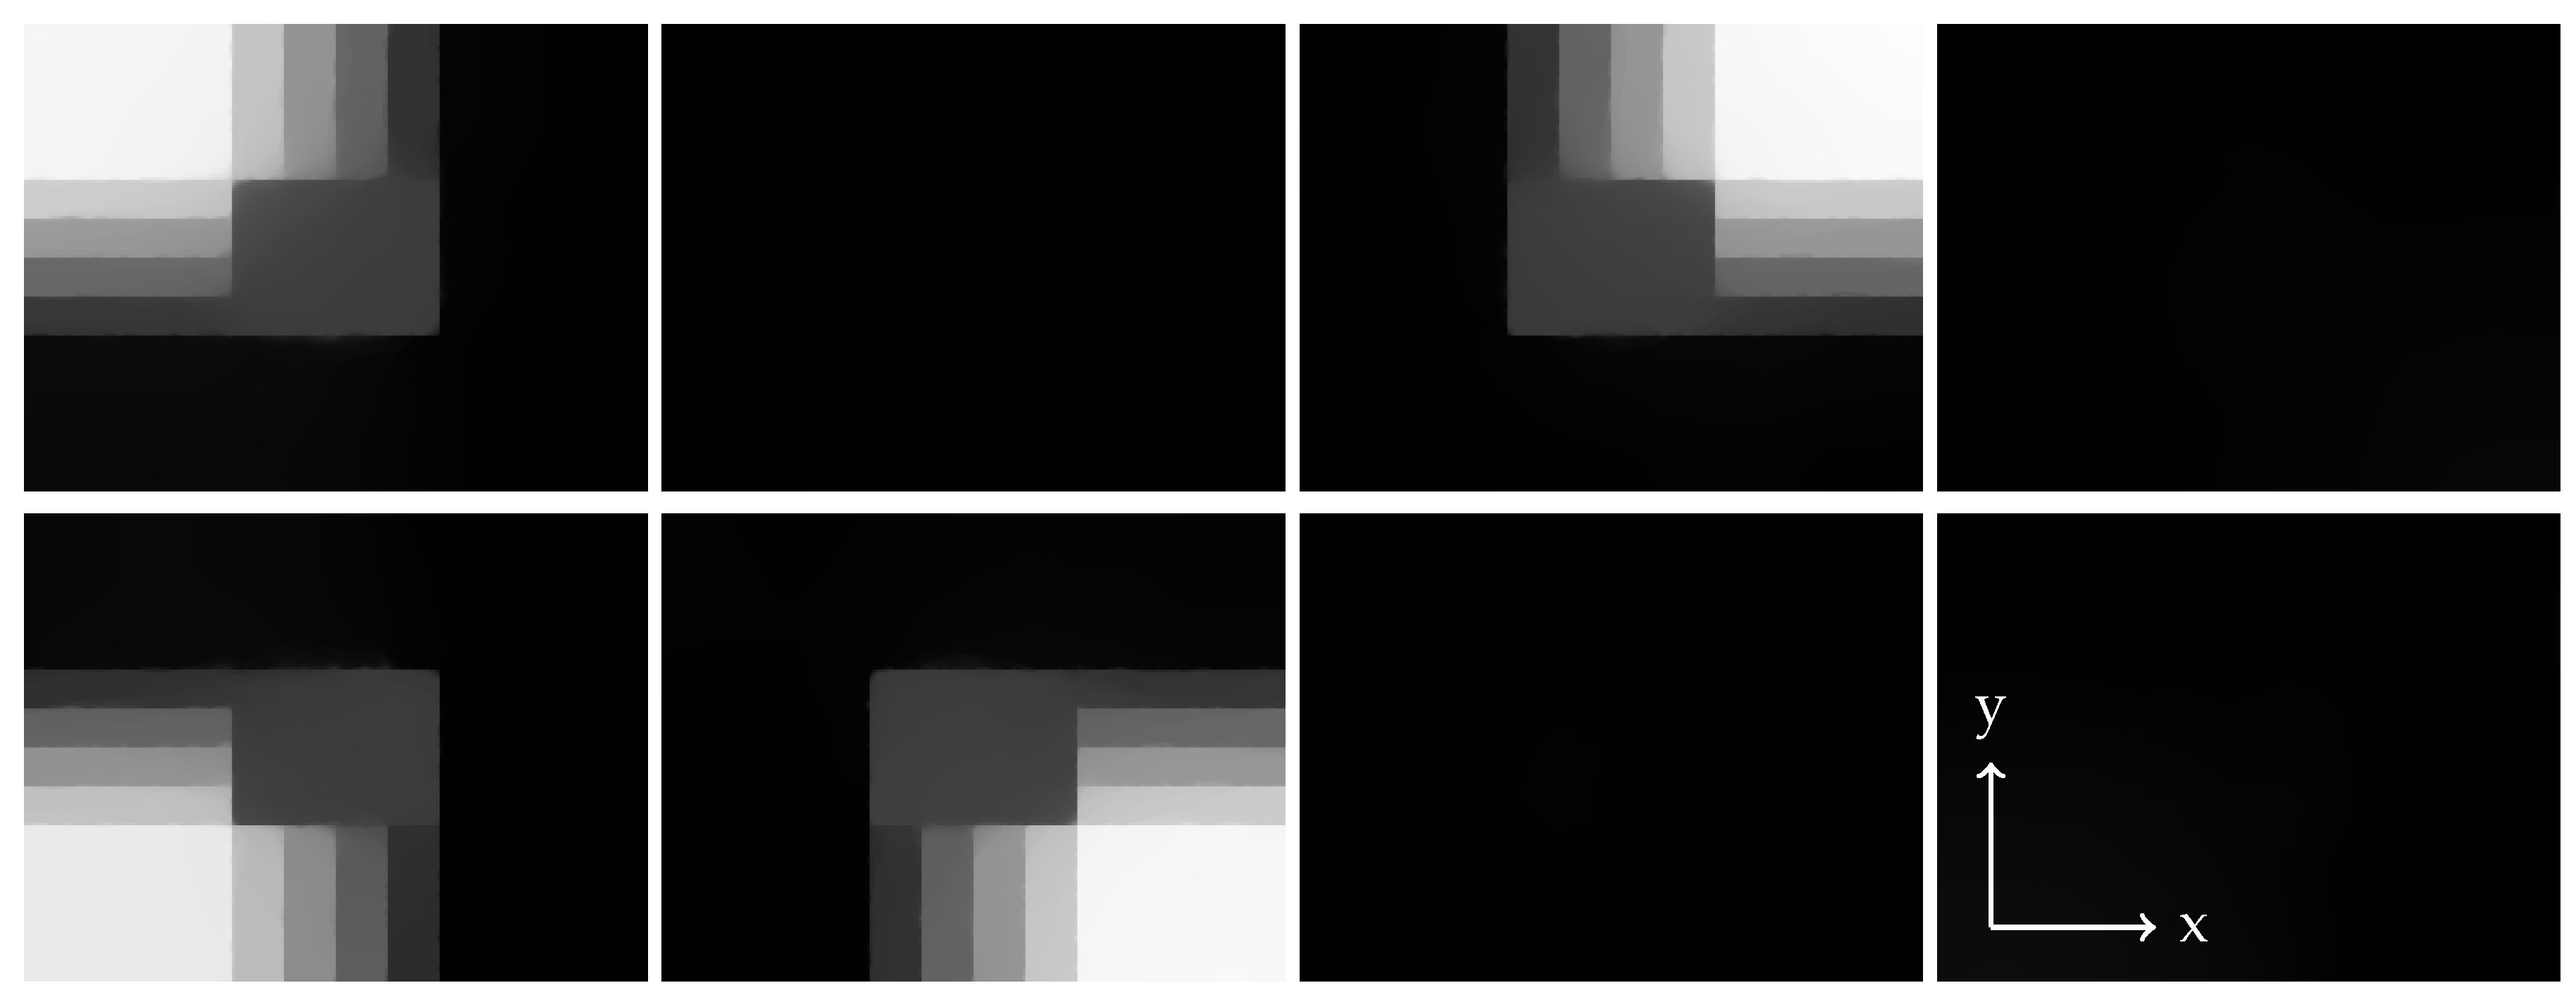
Again, the true abundances are perfectly recovered.
5. Conclusions
In this paper, we have introduced a novel model for hyperspectral unmixing from incomplete and noisy data, provided that an estimate of the signal subspace is available. The model applies if an arbitrary part of the hypercube is known, e.g., a random selection of entries.
The model allows unmixing in one step from incomplete data cubes, having larger regions of missing data than could be restored by preprocessing methods unaware of the signal subspace.
We demonstrated results from line cameras, for which the mask of known entries is structured: lines along the second spatial direction of the hypercube are either fully known or fully unknown, which leads to a more difficult inpainting problem compared to, say, a random distribution of known entries in the hypercube. For large missing regions, where traditional Navier–Stokes inpainting failed, the data term approximation, obtained by our unmixing, provided a good inpainting.
We simulated artificial data with this special structure of the mask. For an image composed of pure materials, knowing only 3% of the sensor pixels in the simulated measurement, the rounded unmixing is a % correct assignment of pixels to materials. For a mixed and noisy image, knowing 10% of the sensor pixels, we obtain a visually perfect recovery of the abundances.
Our results show on real data that unmixing results can be perfect in spite of missing regions in the hypercube, which are orders of magnitude larger than for current line cameras. This shows the potential for further applications, such as those arising from novel image acquisition techniques. That the variational model is simple and can be easily extended is certainly a further benefit.
Acknowledgments
Martin J. Montag would like to thank G. Steidl for discussions and advice. The polymer samples were provided by the Süddeutsche Kunststoff-Zentrum (SKZ) and the hyperspectral camera has been cofinanced by the European Regional Development Fund (ERDF). This work was partially funded by the German Federal Ministry of Education and Research through Project 05M2013 (HYPERMATH).
Author Contributions
Martin J. Montag and Henrike Stephani discussed the design and practical relevance of this paper. Martin J. Montag developed the model and performed the experiments with the presented algorithm. Henrike Stephani performed the experiments with the comparative Navier–Stokes method. Martin J. Montag wrote the paper.
Conflicts of Interest
The authors declare no conflict of interest.
References
- Settle, J.J.; Drake, N.A. Linear Mixing and the Estimation of Ground Cover Proportions. Int. J. Remote Sens. 1993, 14, 1159–1177. [Google Scholar] [CrossRef]
- Paclík, P.; Leitner, R.; Duin, R.P. A Study on Design of Object Sorting Algorithms in the Industrial Application Using Hyperspectral Imaging. J. Real-Time Image Process. 2006, 1, 101–108. [Google Scholar] [CrossRef]
- Asbach, M.; Mauruschat, D.; Plinke, B. Understanding Multi-Spectral Images of Wood Particles with Matrix Factorization. In Proceedings of the Optical Characterization of Materials (OCM) Conference 2013, Karlsruhe, Germany, 6–7 March 2013; pp. 191–202.
- Theiler, J.; Wohlberg, B. Detection of Unknown Gas-Phase Chemical Plumes in Hyperspectral Imagery. Proc. SPIE 2013, 8743. [Google Scholar] [CrossRef]
- Bioucas-Dias, J.; Plaza, A.; Dobigeon, N.; Parente, M.; Du, Q.; Gader, P.; Chanussot, J. Hyperspectral Unmixing Overview: Geometrical, Statistical, and Sparse Regression-Based Approaches. IEEE J. Sel. Top. Appl. Earth Obs. Remote Sens. 2012, 5, 354–379. [Google Scholar] [CrossRef]
- Leitner, R.; Mairer, H.; Kercek, A. Real-Time Classification of Polymers with NIR Spectral Imaging and Blob Analysis. Real-Time Imaging 2003, 9, 245–251. [Google Scholar] [CrossRef]
- Méndez-Rial, R.; Calvino-Cancela, M.; Martín-Herrero, J. Accurate Implementation of Anisotropic Diffusion in the Hypercube. IEEE Geosci. Remote Sens. Lett. 2010, 7, 870–874. [Google Scholar] [CrossRef]
- Méndez-Rial, R.; Calvino-Cancela, M.; Martín-Herrero, J. Anisotropic Inpainting of the Hypercube. IEEE Geosci. Remote Sens. Lett. 2012, 9, 214–218. [Google Scholar] [CrossRef]
- Chen, A. The Inpainting of Hyperspectral Images: A Survey and Adaptation to Hyperspectral Data. Proc. SPIE 2012, 8537. [Google Scholar] [CrossRef]
- Degraux, K.; Cambareri, V.; Jacques, L.; Geelen, B.; Blanch, C.; Lafruit, G. Generalized Inpainting Method for Hyperspectral Image Acquisition. ArXiv E-Prints 2015. [Google Scholar]
- Valiollahzadeh, M.; Yin, W. Hyperspectral Data Reconstruction Combining Spatial and Spectral Sparsity; Technical Report TR10-29; Rice University: Houston, TX, USA, 2010. [Google Scholar]
- Bioucas-Dias, J.; Nascimento, J. Hyperspectral Subspace Identification. IEEE Trans. Geosci. Remote Sens. 2008, 46, 2435–2445. [Google Scholar] [CrossRef]
- Rudin, L.I.; Osher, S.; Fatemi, E. Nonlinear Total Variation Based Noise Removal Algorithms. Phys. D 1992, 60, 259–268. [Google Scholar] [CrossRef]
- Shafei, B.; Steidl, G. Segmentation of Images with Separating Layers by Fuzzy c-Means and Convex Optimization. J. Vis. Commun. Image Represent. 2012, 23, 611–621. [Google Scholar] [CrossRef]
- Iordache, M.D.; Bioucas-Dias, J.M.; Plaza, A. Total Variation Spatial Regularization for Sparse Hyperspectral Unmixing. IEEE Trans. Geosci. Remote Sens. 2012, 50, 4484–4502. [Google Scholar] [CrossRef]
- Chambolle, A.; Pock, T. A First-Order Primal-Dual Algorithm for Convex Problems with Applications to Imaging. J. Math. Imaging Vis. 2011, 40, 120–145. [Google Scholar] [CrossRef]
- Pock, T.; Chambolle, A.; Cremers, D.; Bischof, H. A Convex Relaxation Approach for Computing Minimal Partitions. In Proceedings of the IEEE Conference on Computer Vision and Pattern Recognition, Miami, FL, USA, 20–25 June 2009; pp. 810–817.
- Burger, M.; Sawatzky, A.; Steidl, G. First Order Algorithms in Variational Image Processing . Technical Report. ArXiv E-Prints 2014. [Google Scholar]
- Goldstein, T.; Li, M.; Yuan, X.; Esser, E.; Baraniuk, R. Adaptive Primal-Dual Hybrid Gradient Methods for Saddle-Point Problems. ArXiv E-Prints 2013. [Google Scholar]
- Bertalmio, M.; Bertozzi, A.; Sapiro, G. Navier-Stokes, Fluid Dynamics, and Image and Video Inpainting. In Proceedings of the IEEE Conference on Computer Vision and Pattern Recognition (CVPR), Los Alamitos, CA, USA, 8–14 December 2001; Volume 1, pp. 355–362.
© 2016 by the authors; licensee MDPI, Basel, Switzerland. This article is an open access article distributed under the terms and conditions of the Creative Commons by Attribution (CC-BY) license (http://creativecommons.org/licenses/by/4.0/).
