Figure 1.
Overview of the proposed method.
Figure 1.
Overview of the proposed method.
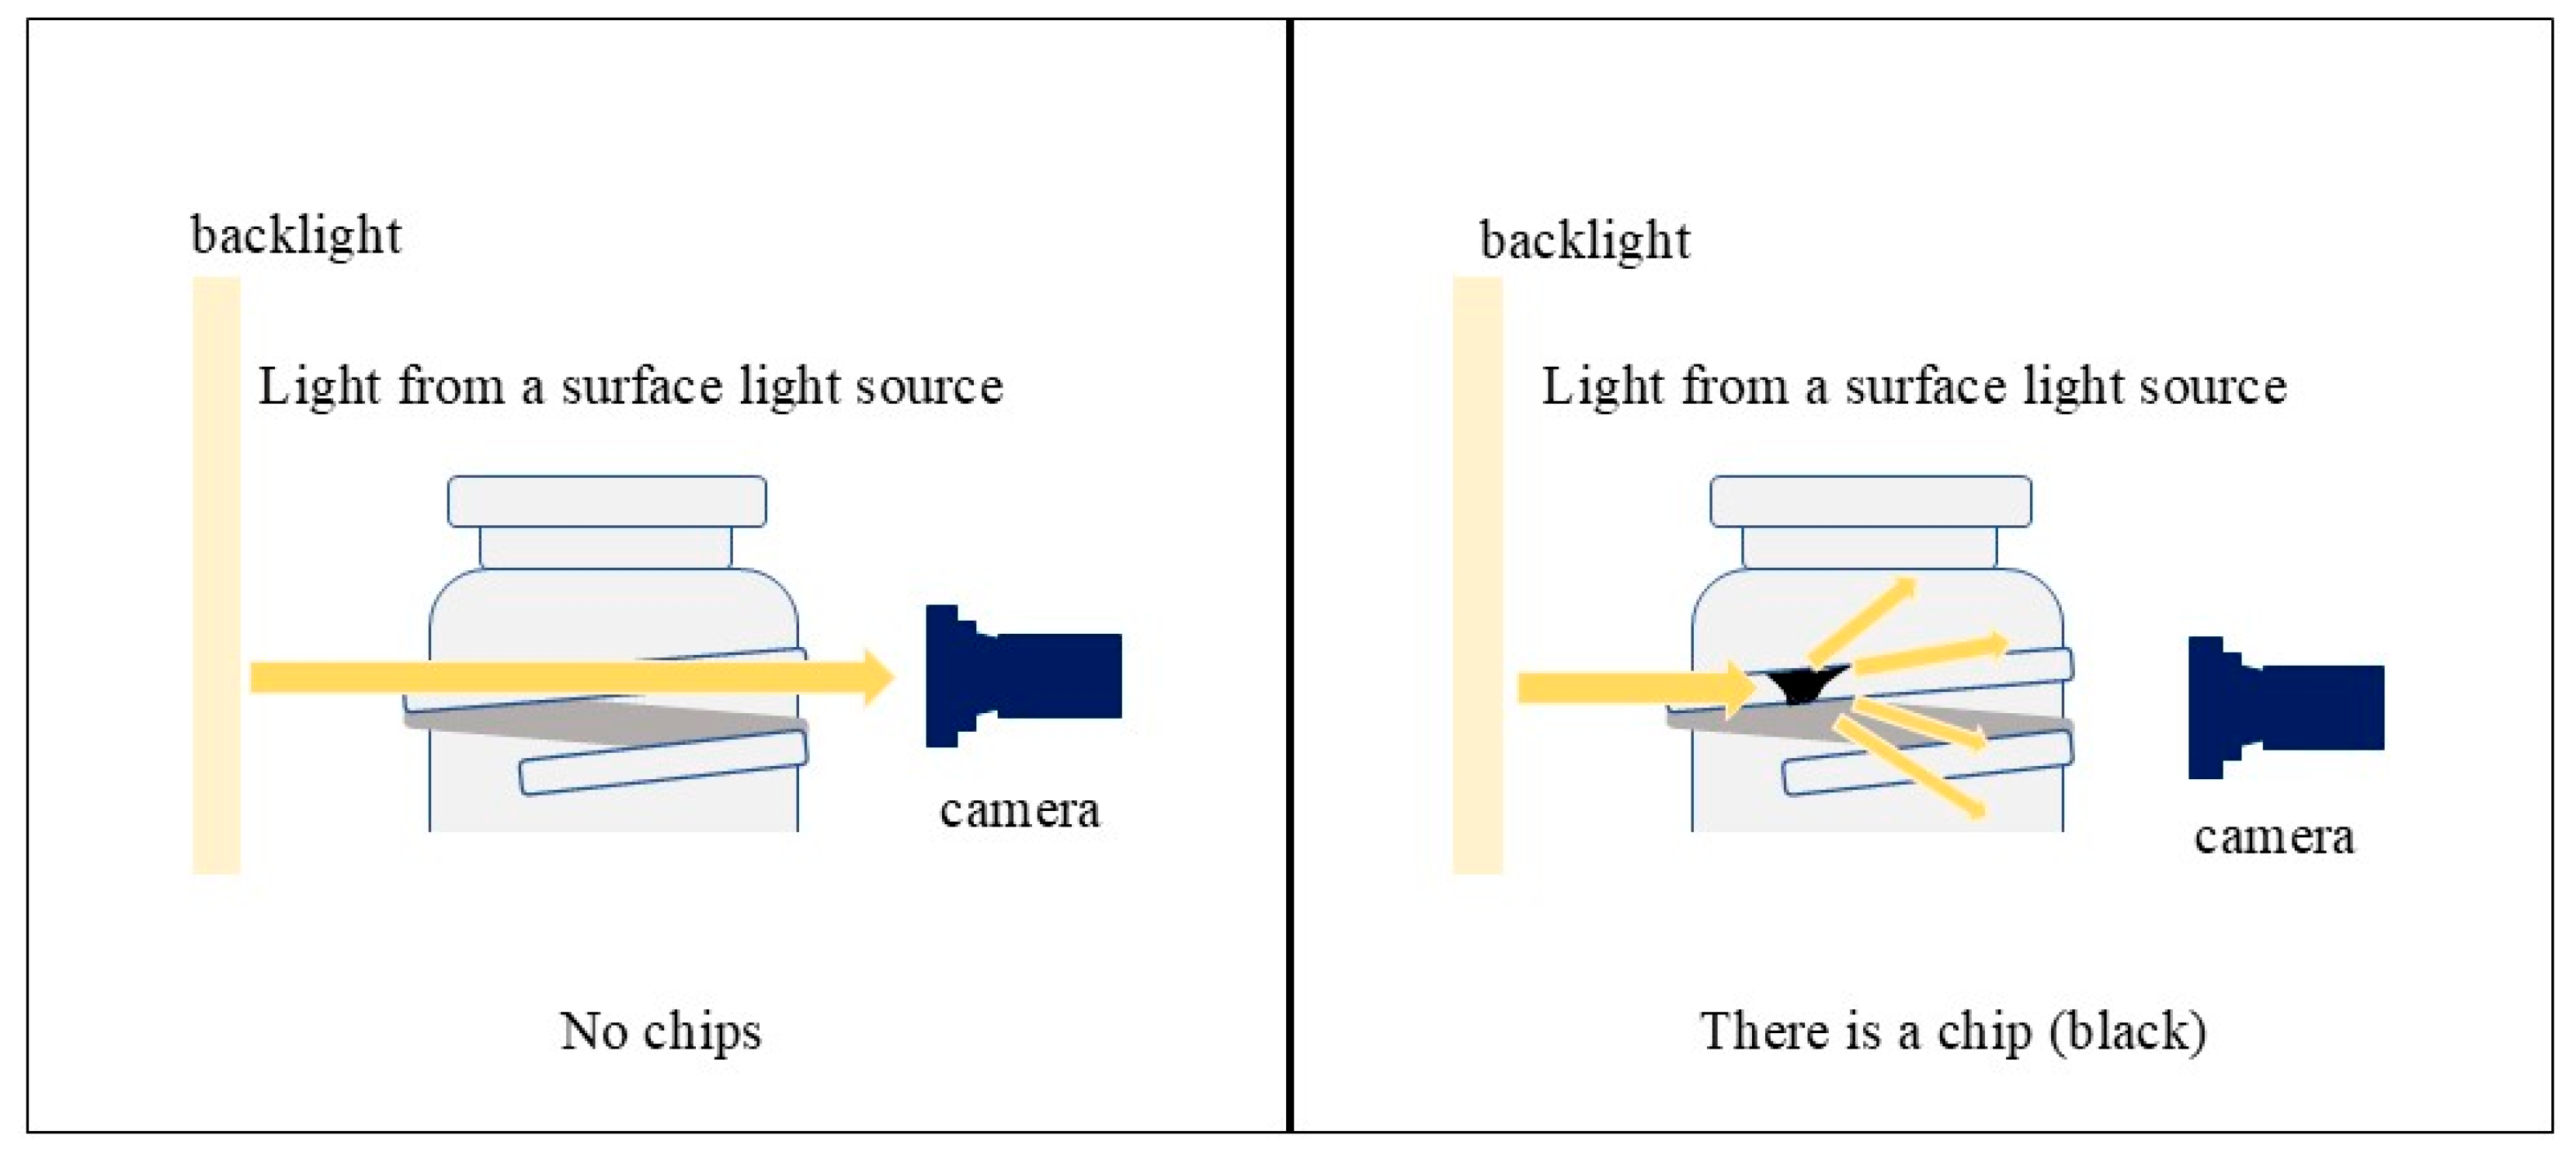
Figure 2.
Overview of glass bottle photography.
Figure 2.
Overview of glass bottle photography.
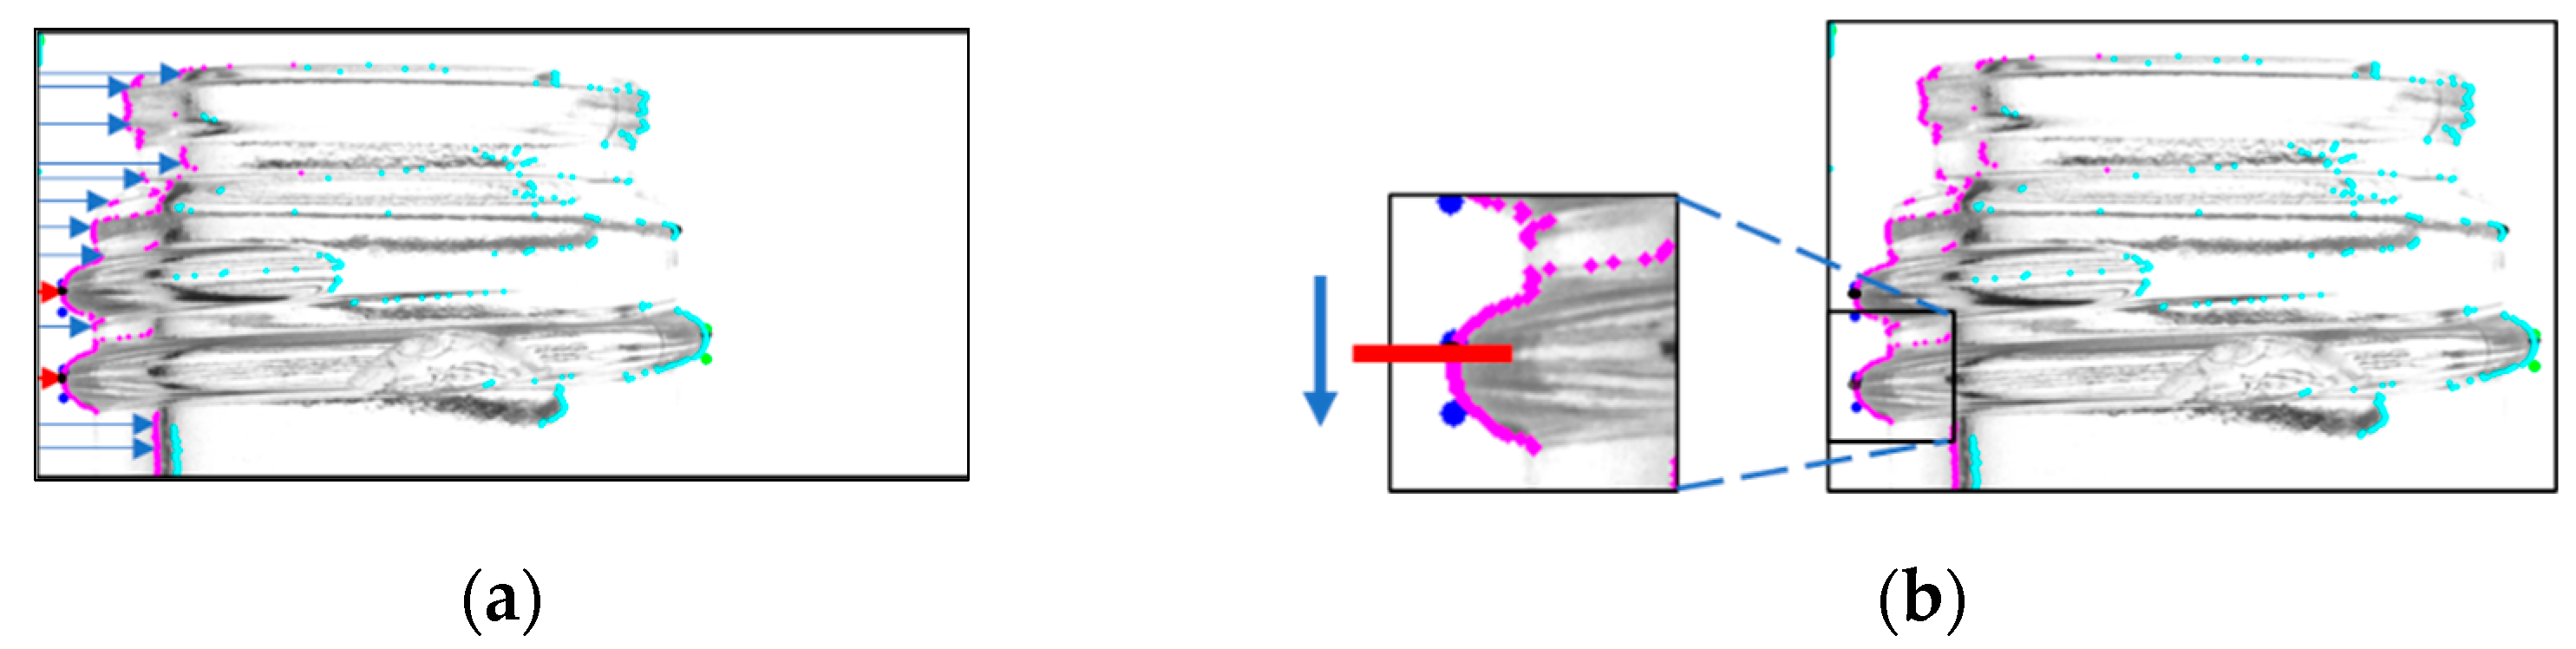
Figure 3.
Process to search both ends of the screw threads. (A process that searches both ends (a) and a process that further searches the screw thread region (b)).
Figure 3.
Process to search both ends of the screw threads. (A process that searches both ends (a) and a process that further searches the screw thread region (b)).
Figure 4.
Screw thread range depicted when both endpoints are successfully identified (Solid line; for screw threads on both ends. Dotted line; for screw threads on only one side and complements by predicting).
Figure 4.
Screw thread range depicted when both endpoints are successfully identified (Solid line; for screw threads on both ends. Dotted line; for screw threads on only one side and complements by predicting).
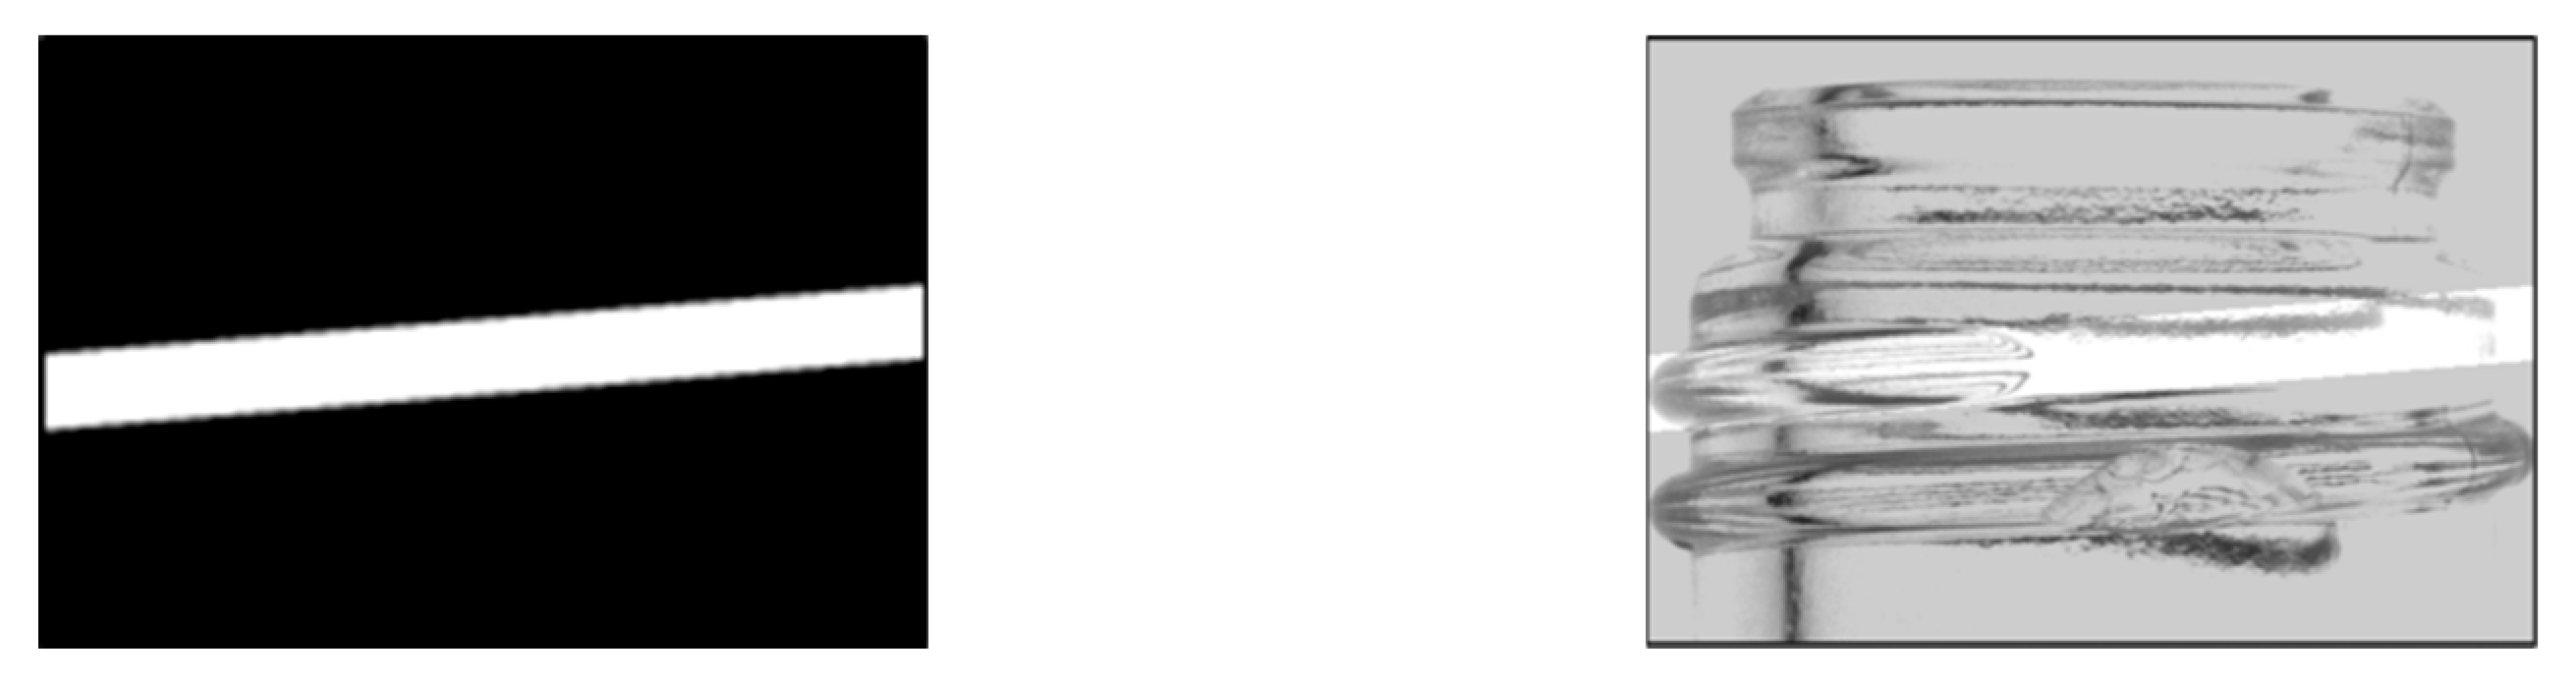
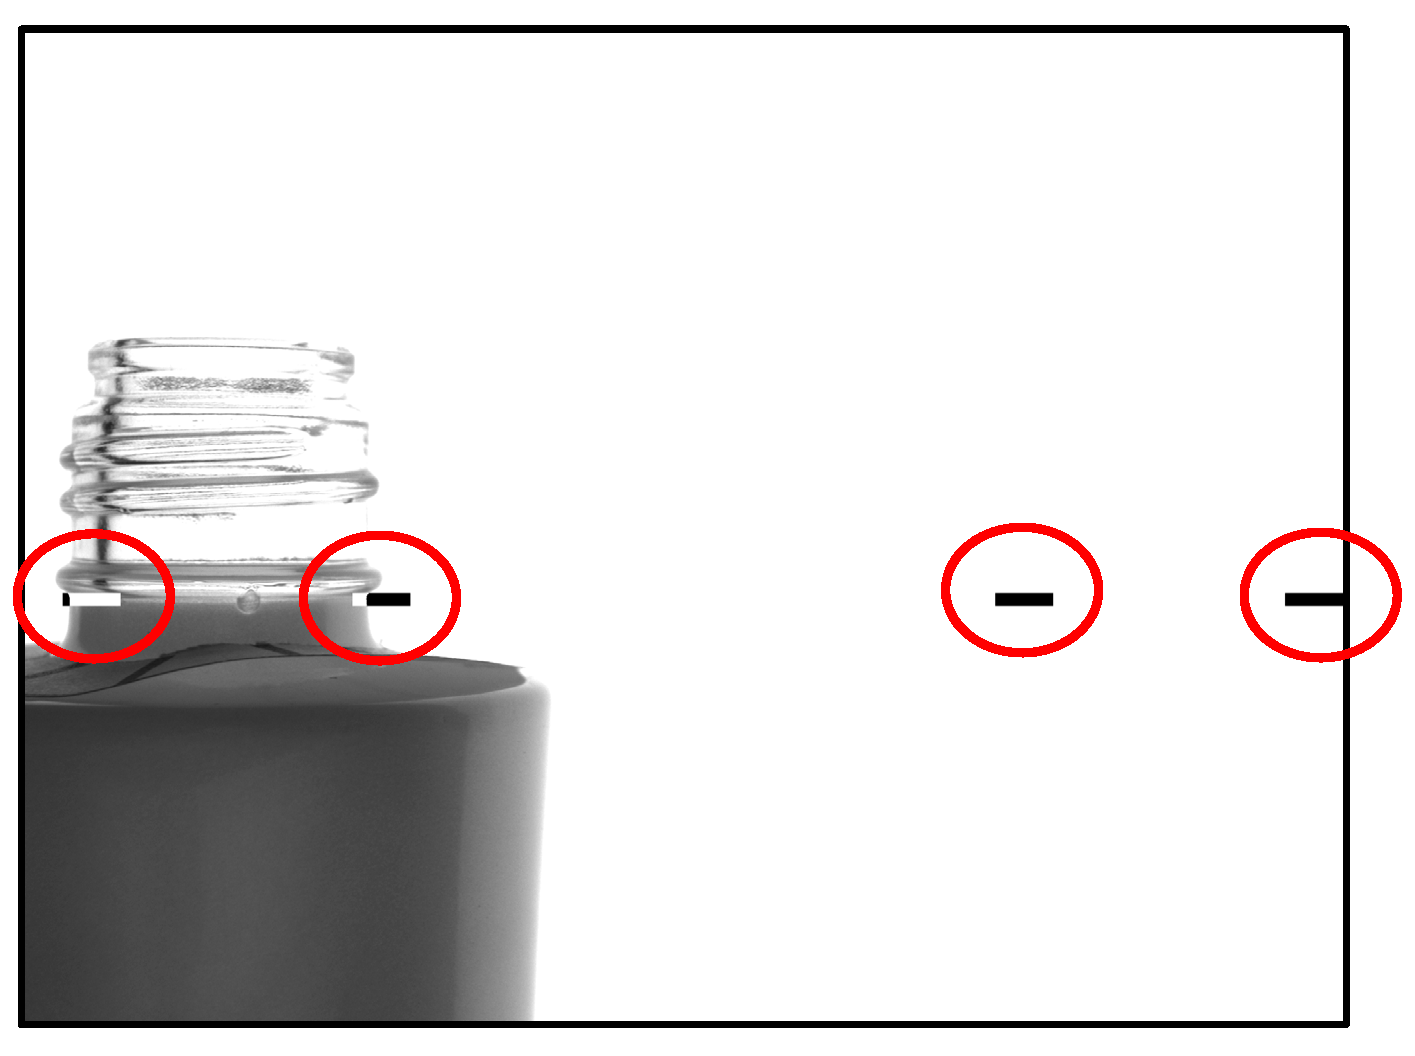
Figure 5.
Generated mask image and the resulting composite image.
Figure 5.
Generated mask image and the resulting composite image.
Figure 6.
Labeling process.
Figure 6.
Labeling process.
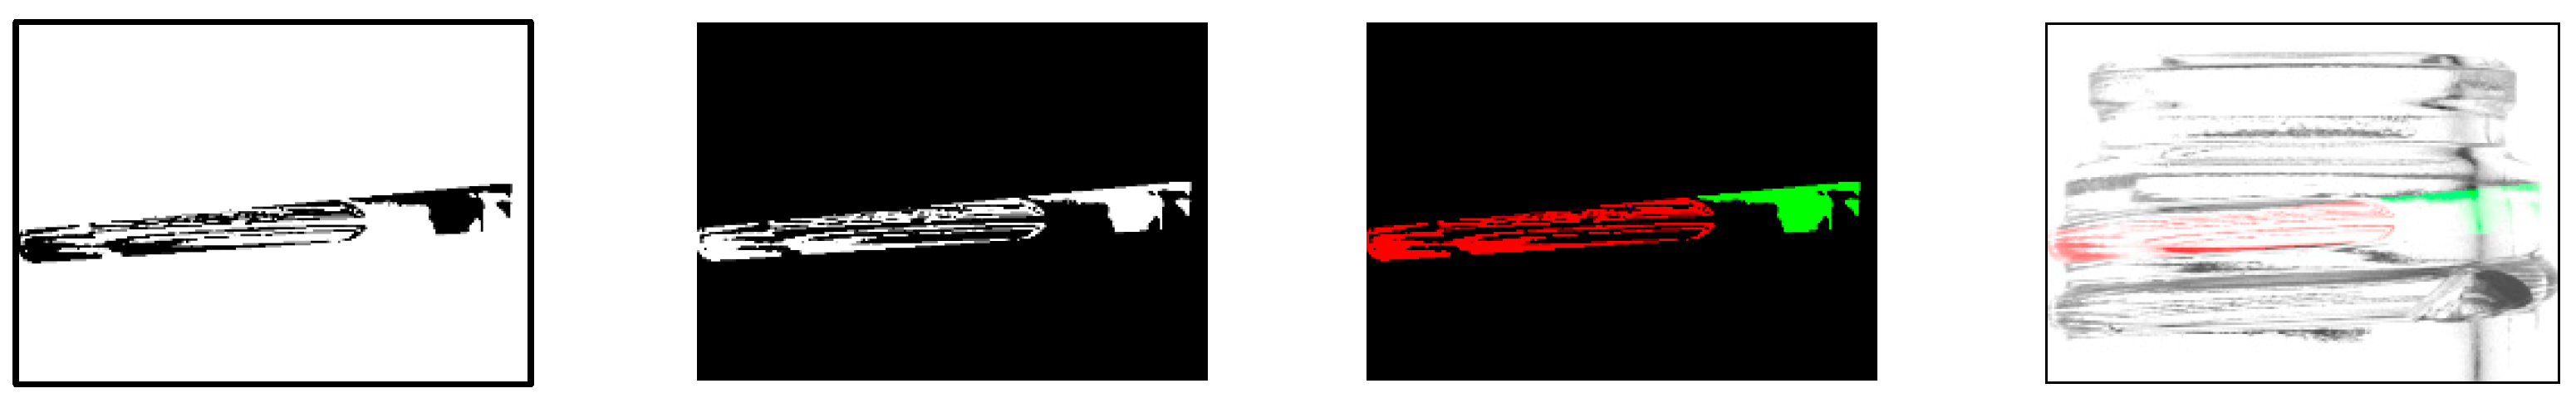
Figure 7.
Generated mask and synthesized images. (a) Label image, (b) mask image, (c) composite image.
Figure 7.
Generated mask and synthesized images. (a) Label image, (b) mask image, (c) composite image.
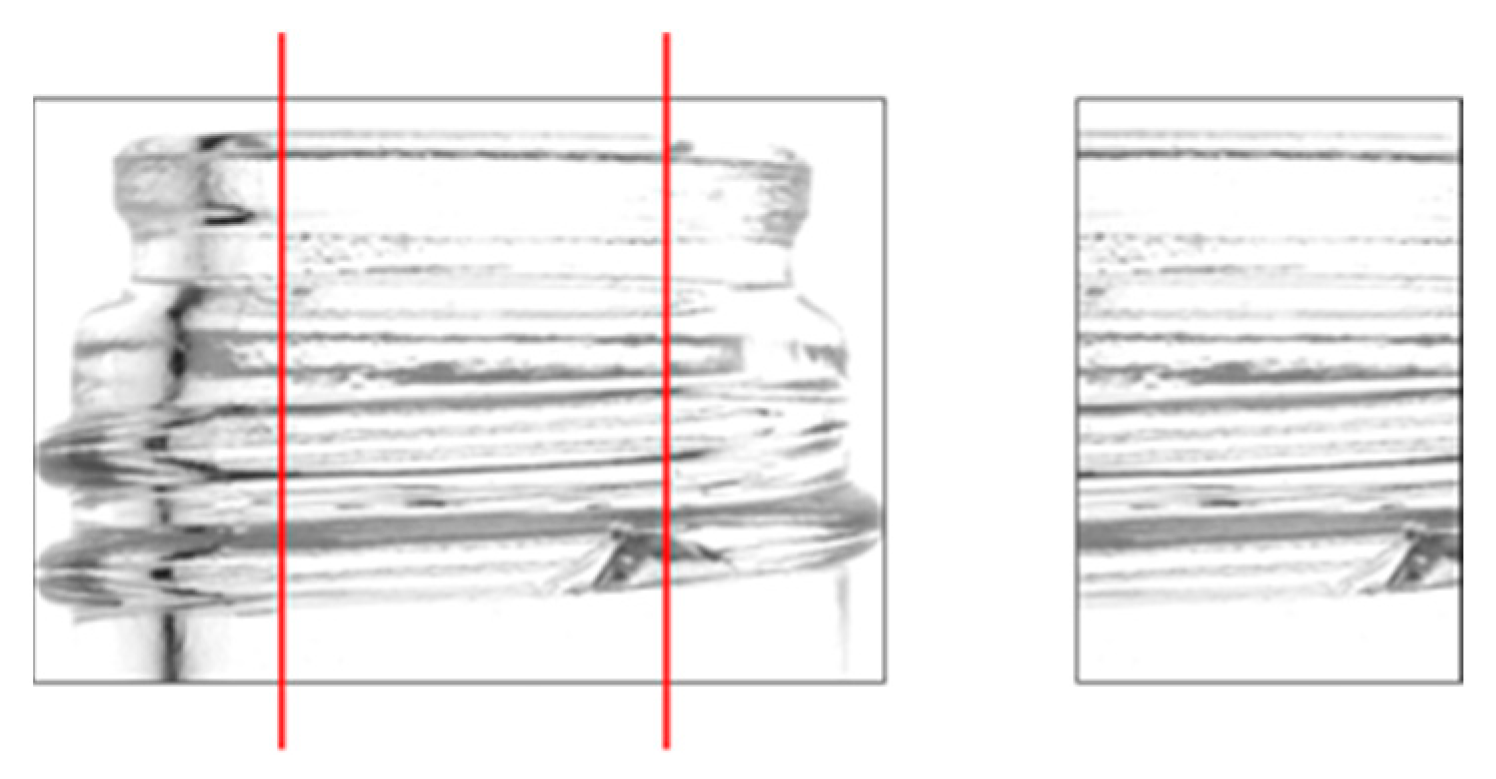
Figure 8.
Cutout portion of the bottle image used for the detection. (The image to be cropped and retrieved with the red line is on the left).
Figure 8.
Cutout portion of the bottle image used for the detection. (The image to be cropped and retrieved with the red line is on the left).
Figure 9.
Hough transform process. (a) Hough transforms for each label, (b) generated mask image, (c) composite image.
Figure 9.
Hough transform process. (a) Hough transforms for each label, (b) generated mask image, (c) composite image.
Figure 10.
Process for extracting missing parts.
Figure 10.
Process for extracting missing parts.
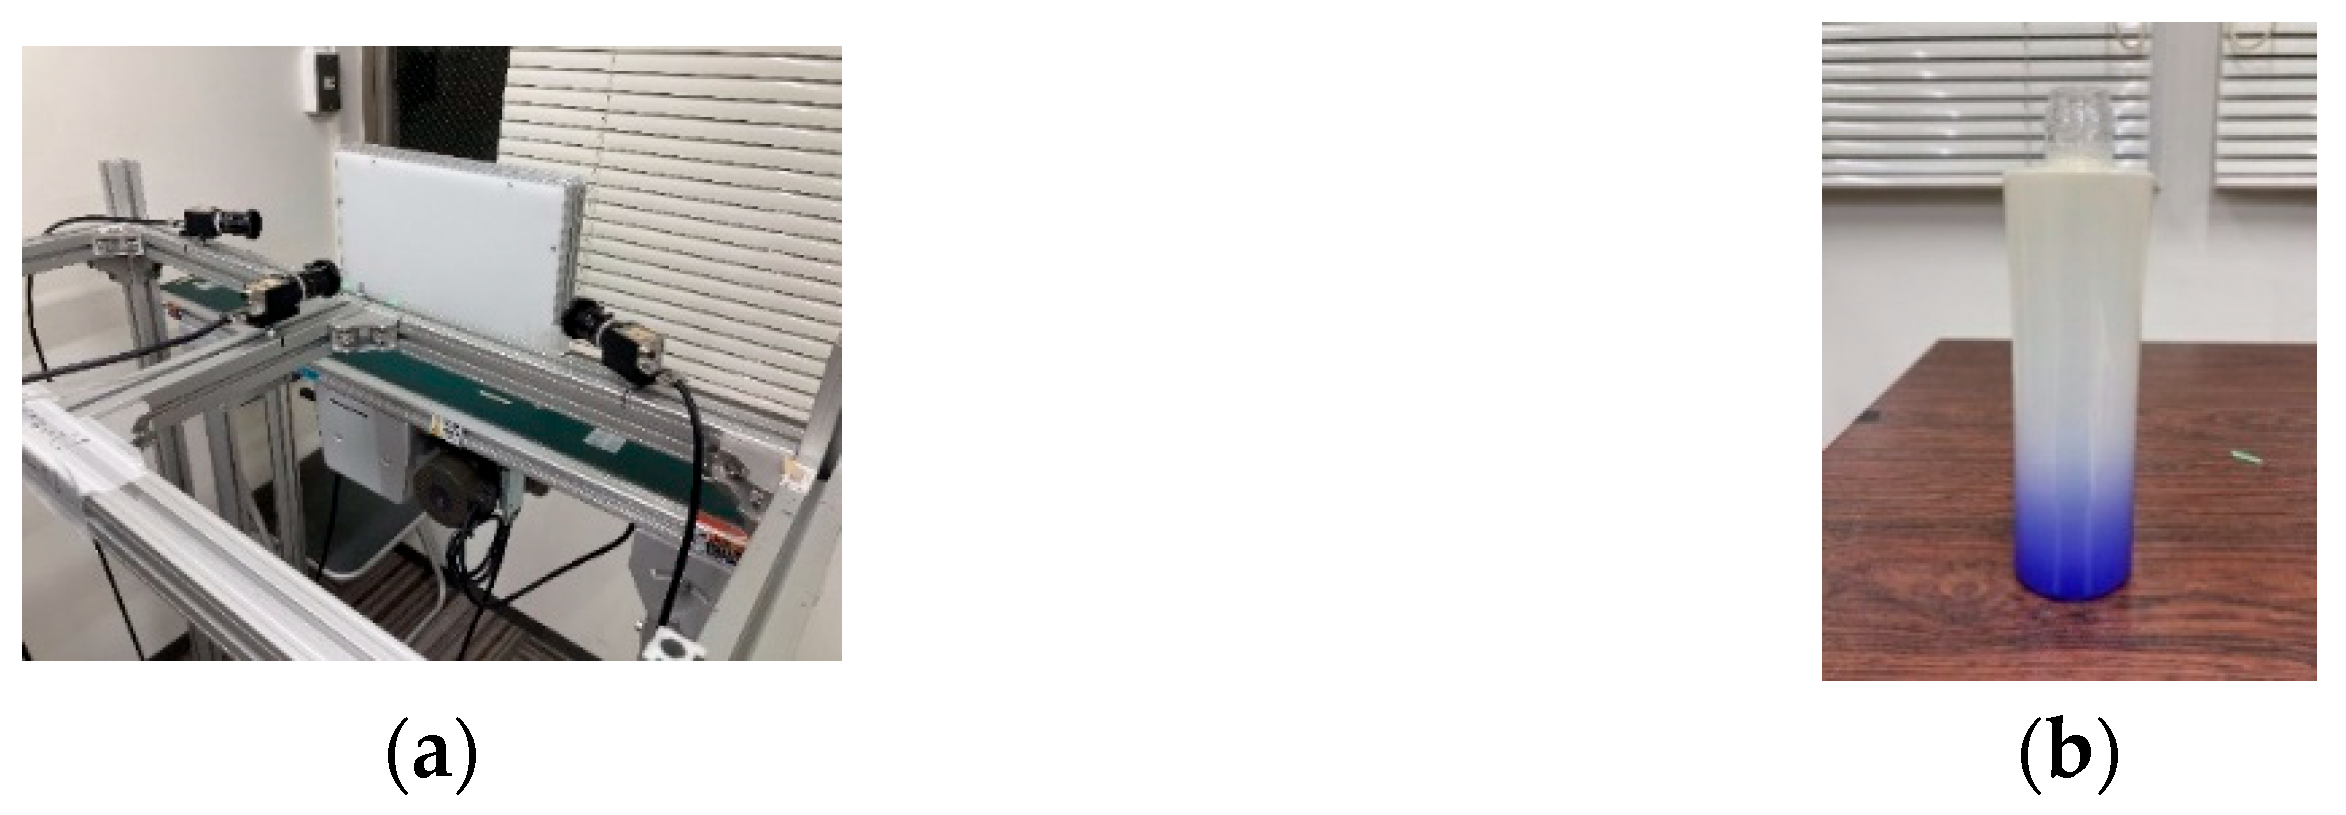
Figure 11.
Experimental environment. (a) Experimental setup and (b) glass bottle used in the study.
Figure 11.
Experimental environment. (a) Experimental setup and (b) glass bottle used in the study.
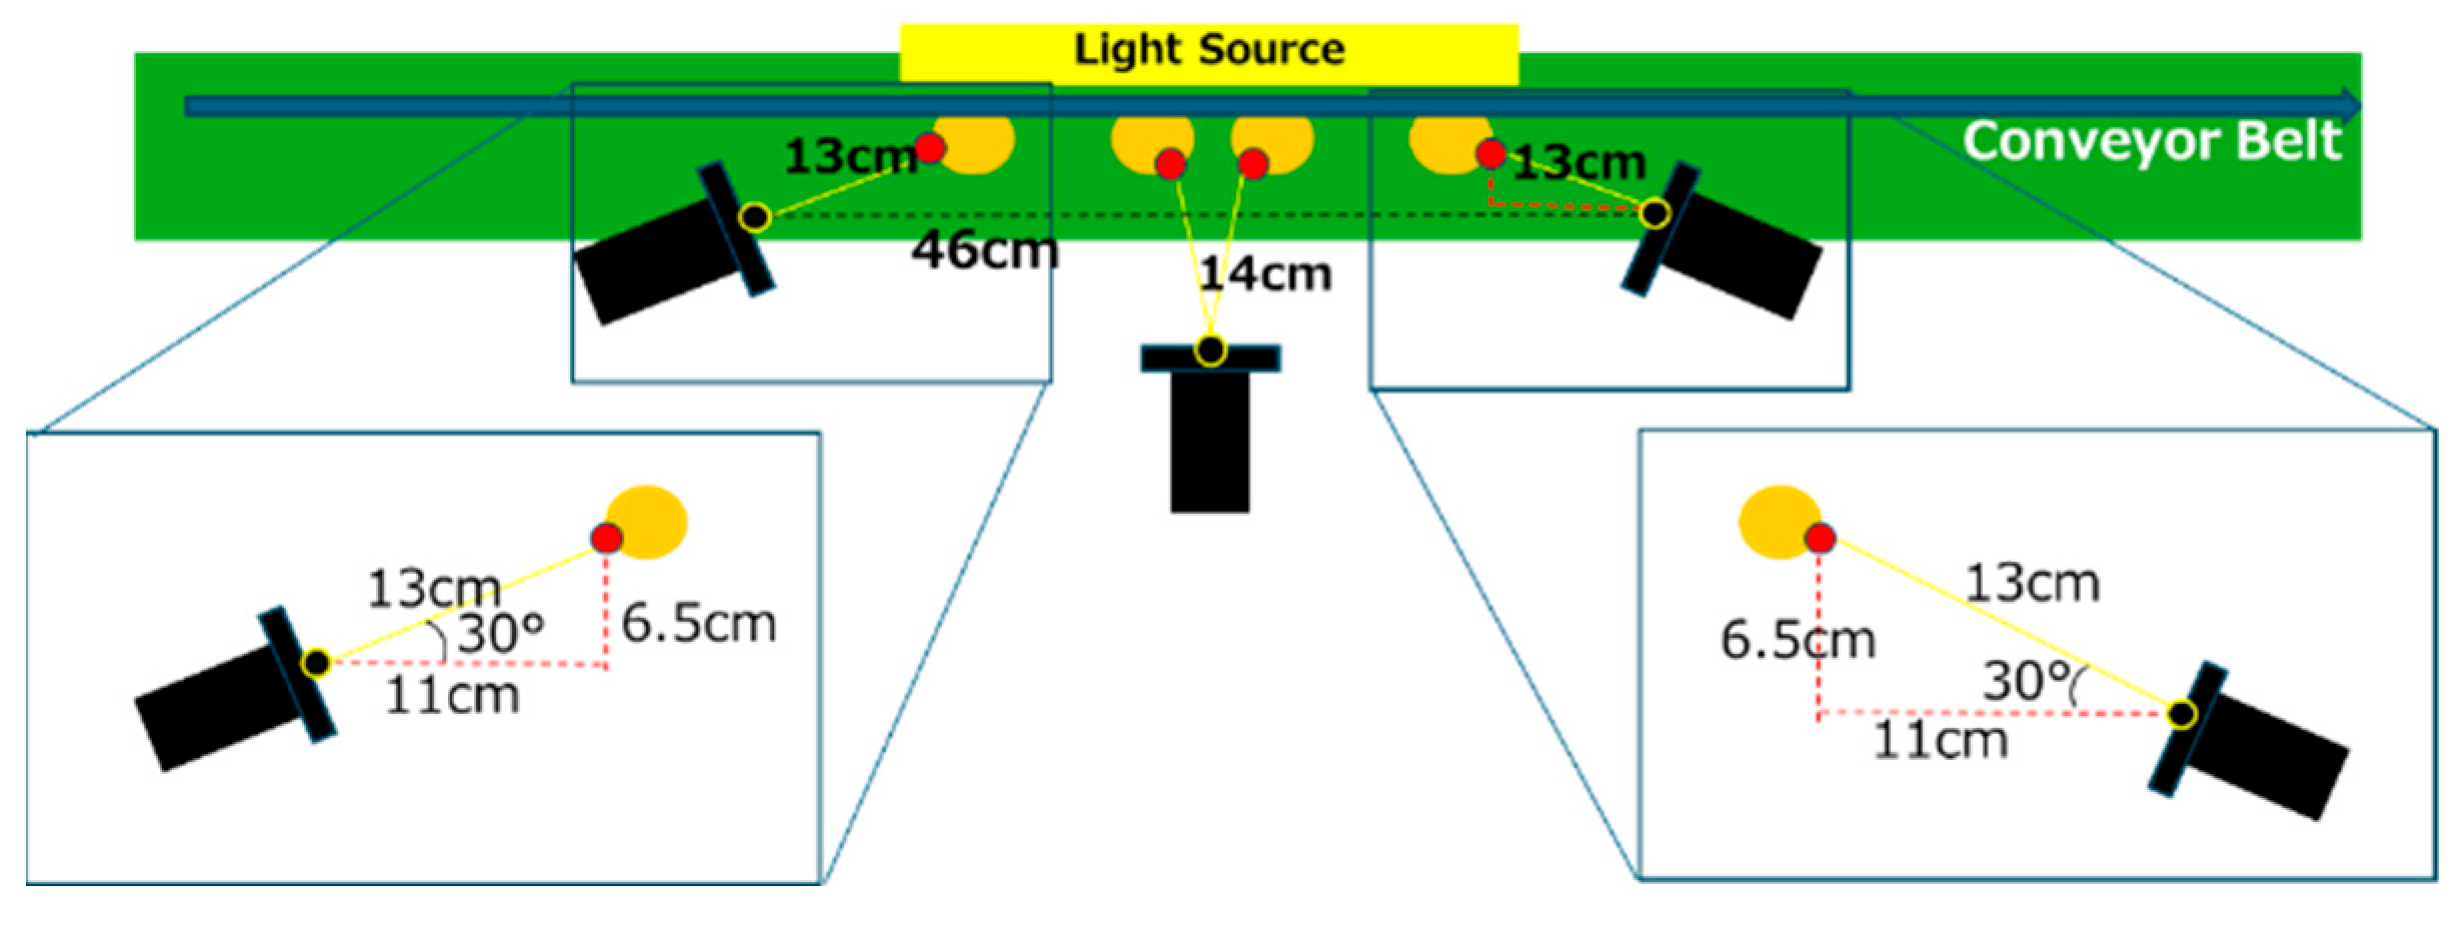
Figure 12.
Schematic drawing of the experimental environment.
Figure 12.
Schematic drawing of the experimental environment.
Figure 13.
How to take bottle images.
Figure 13.
How to take bottle images.
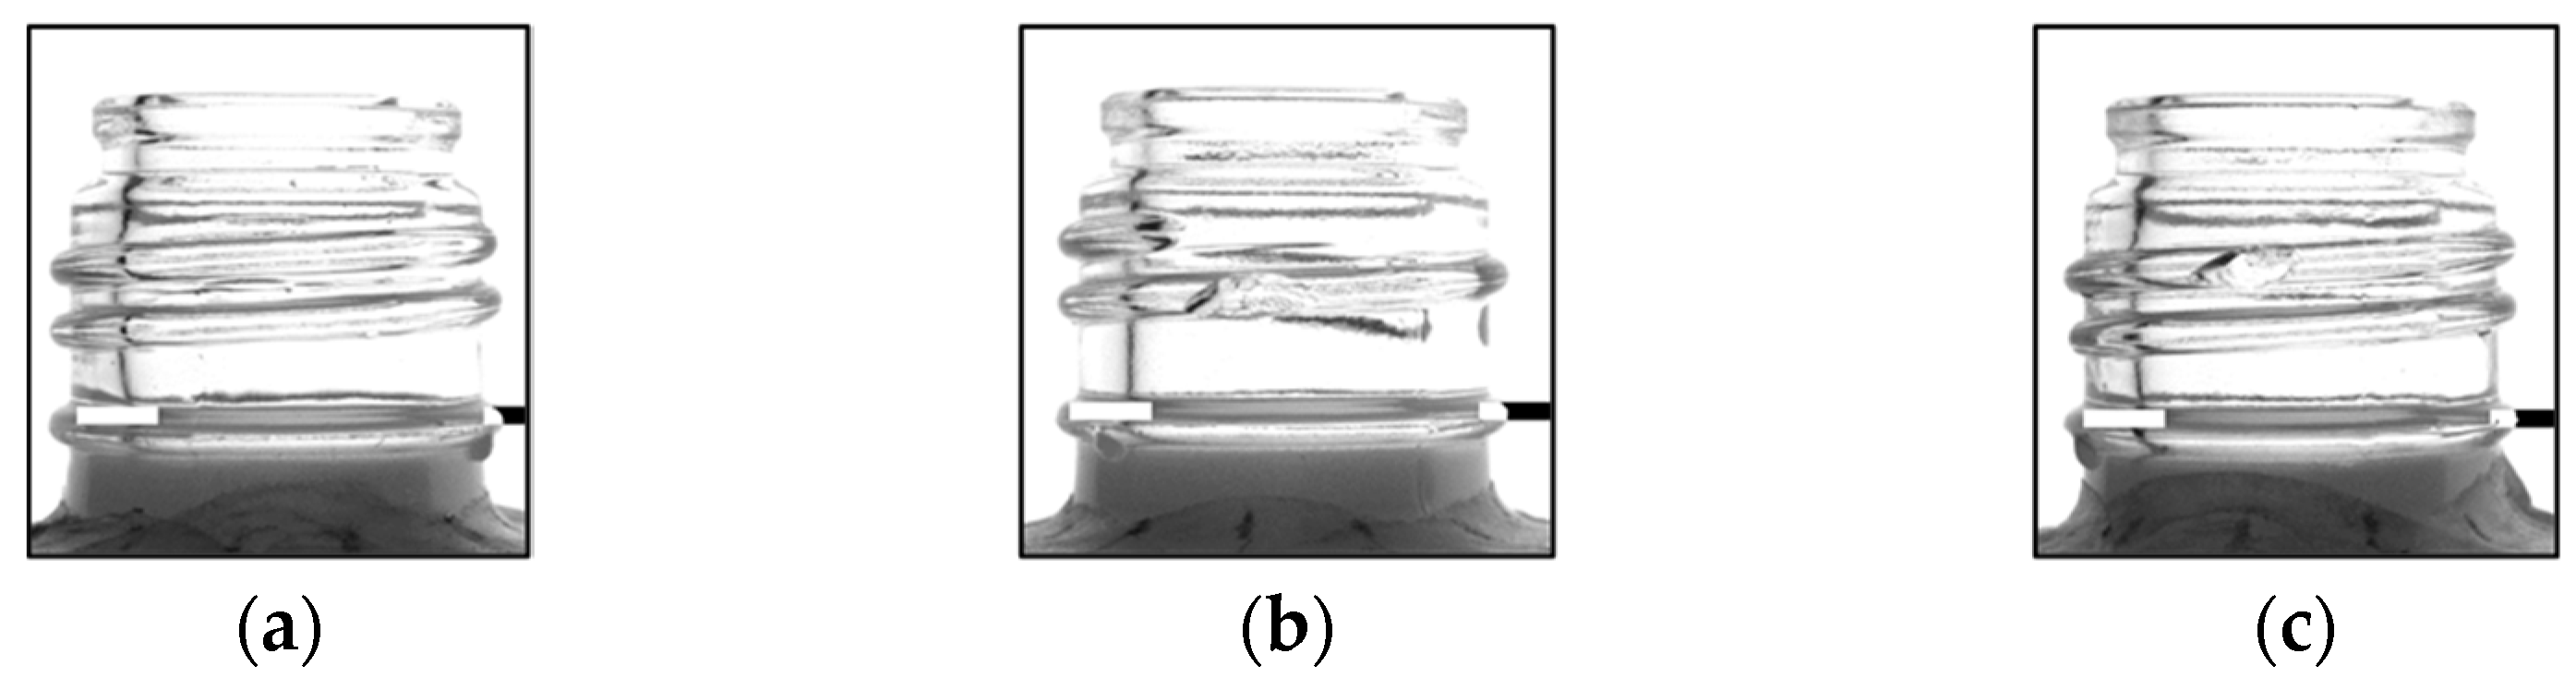
Figure 14.
Examples of good bottles and defective bottles presenting chips. (a) Good, (b) D1, (c) D2.
Figure 14.
Examples of good bottles and defective bottles presenting chips. (a) Good, (b) D1, (c) D2.
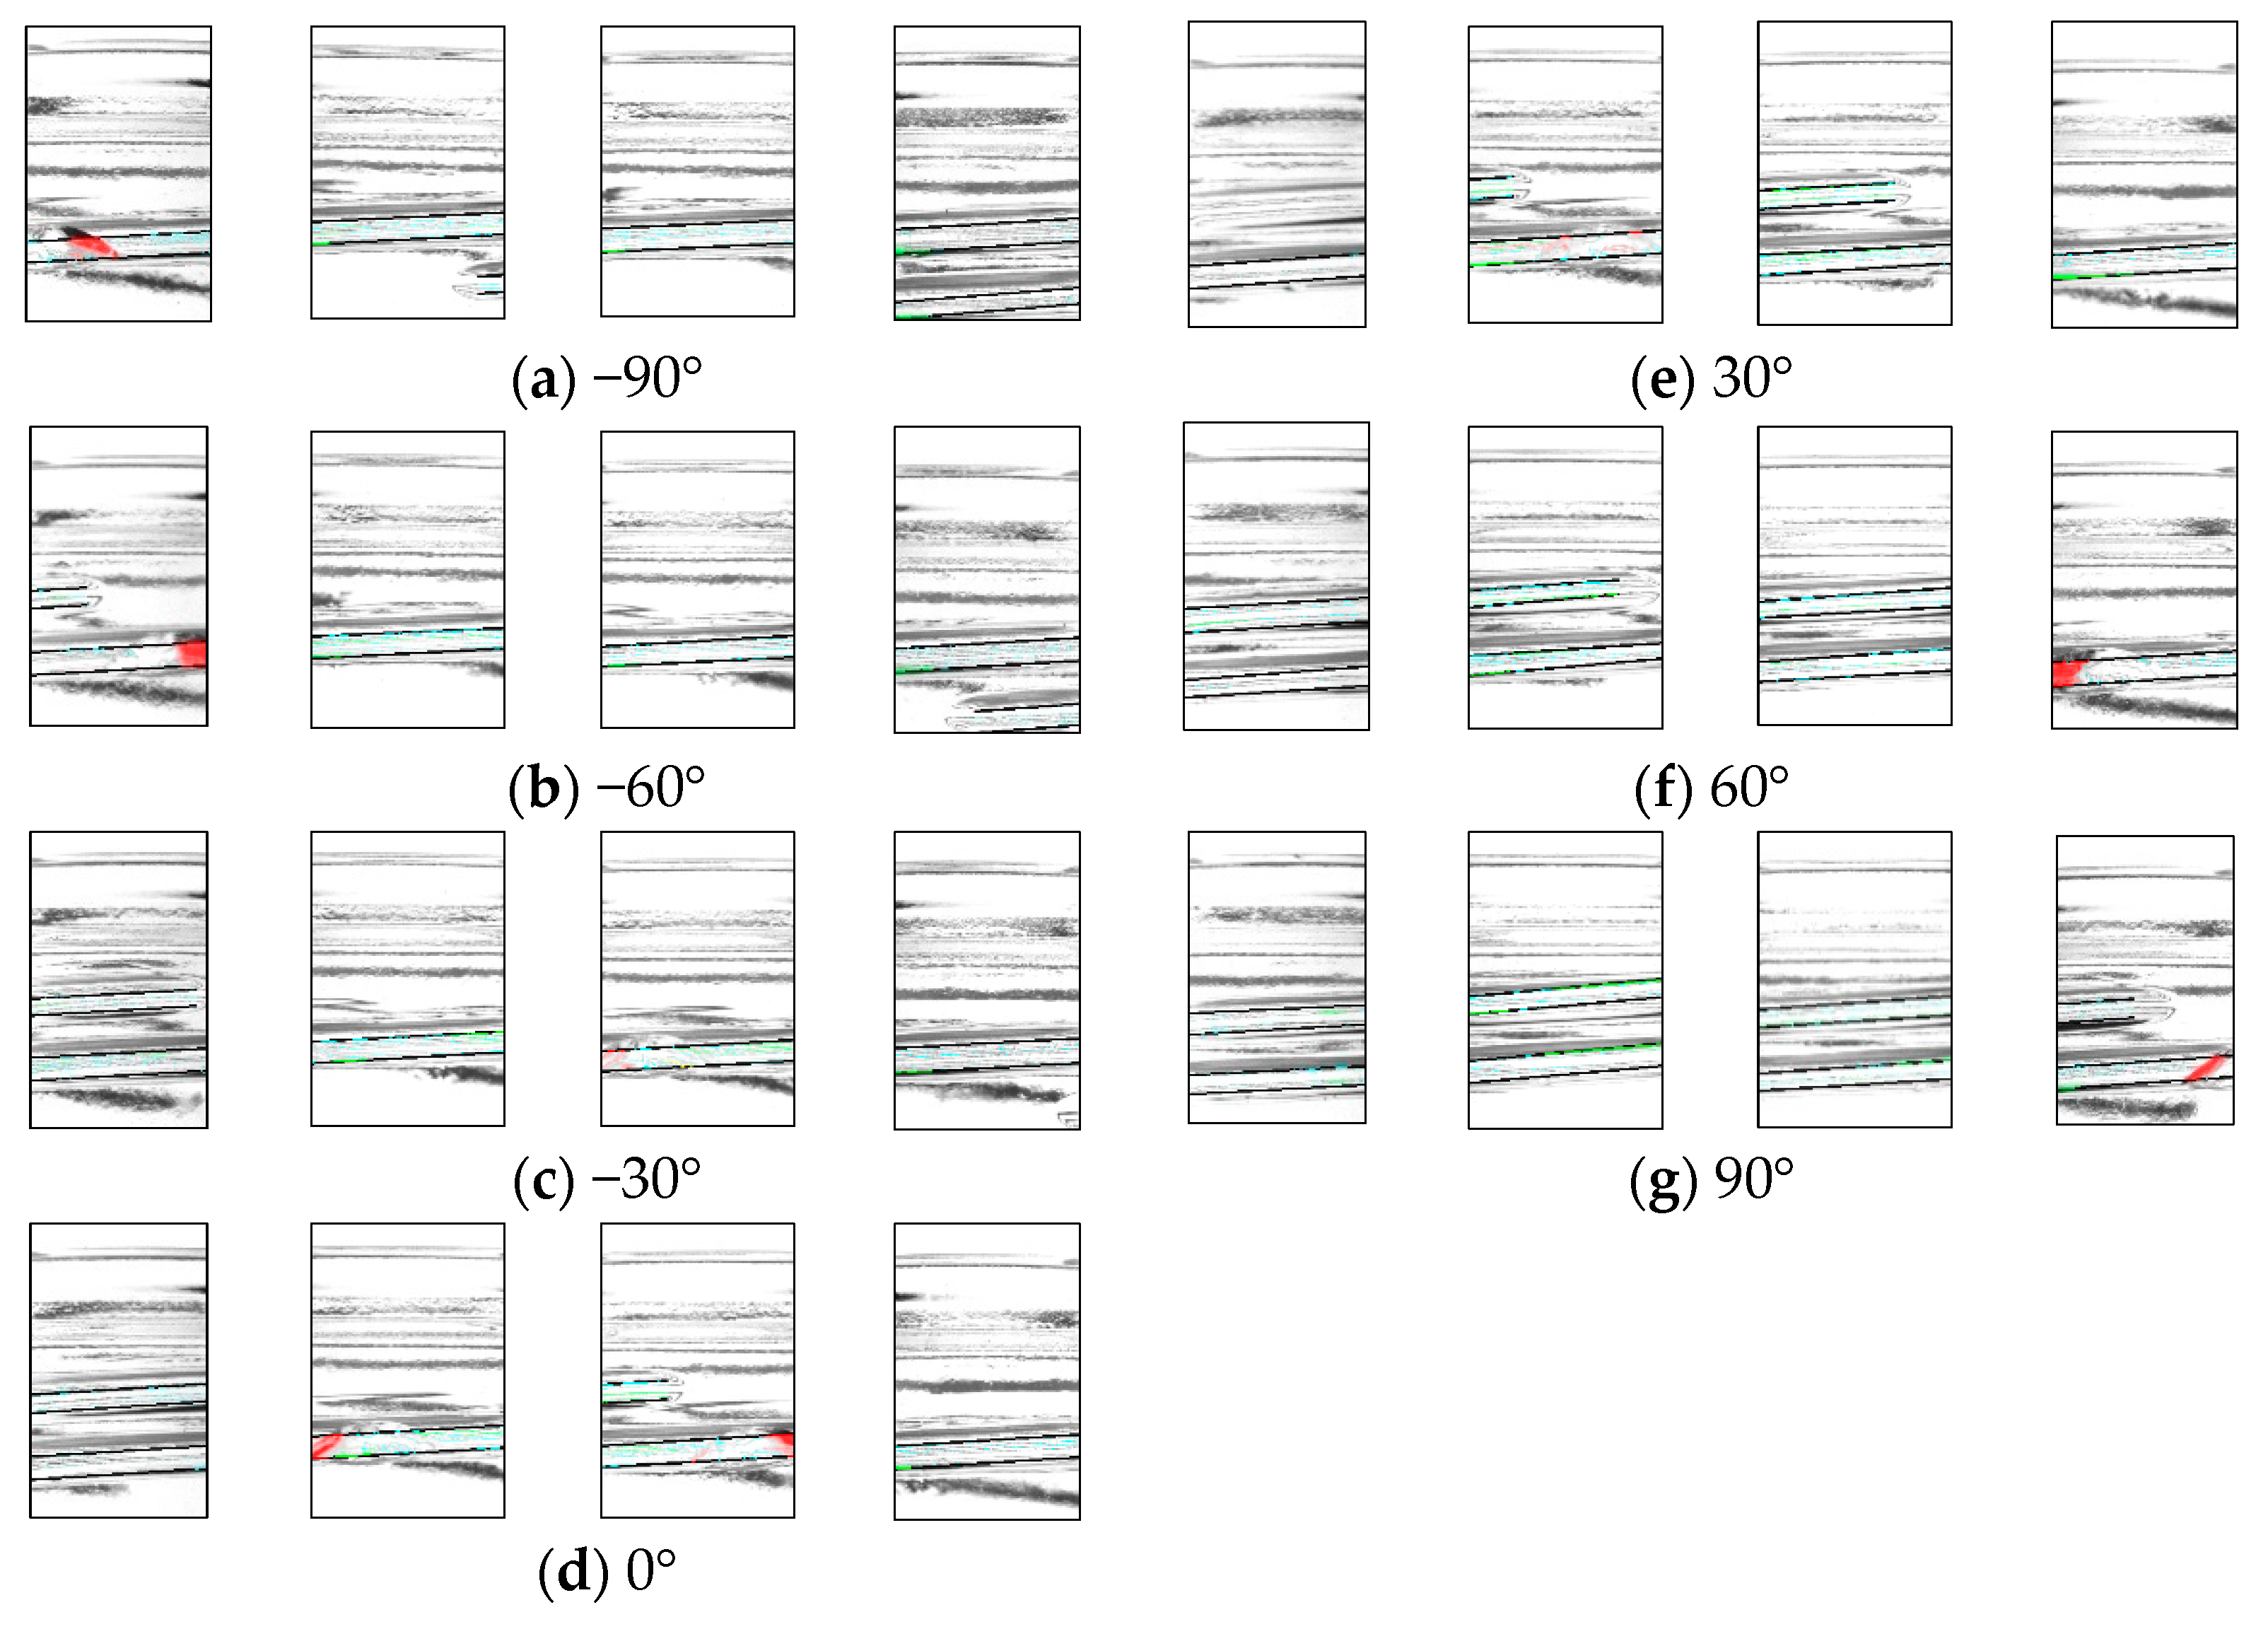
Figure 15.
Experimental results show images of bottle defective 1 at different angles.
Figure 15.
Experimental results show images of bottle defective 1 at different angles.
Figure 16.
Example of the false detection.
Figure 16.
Example of the false detection.
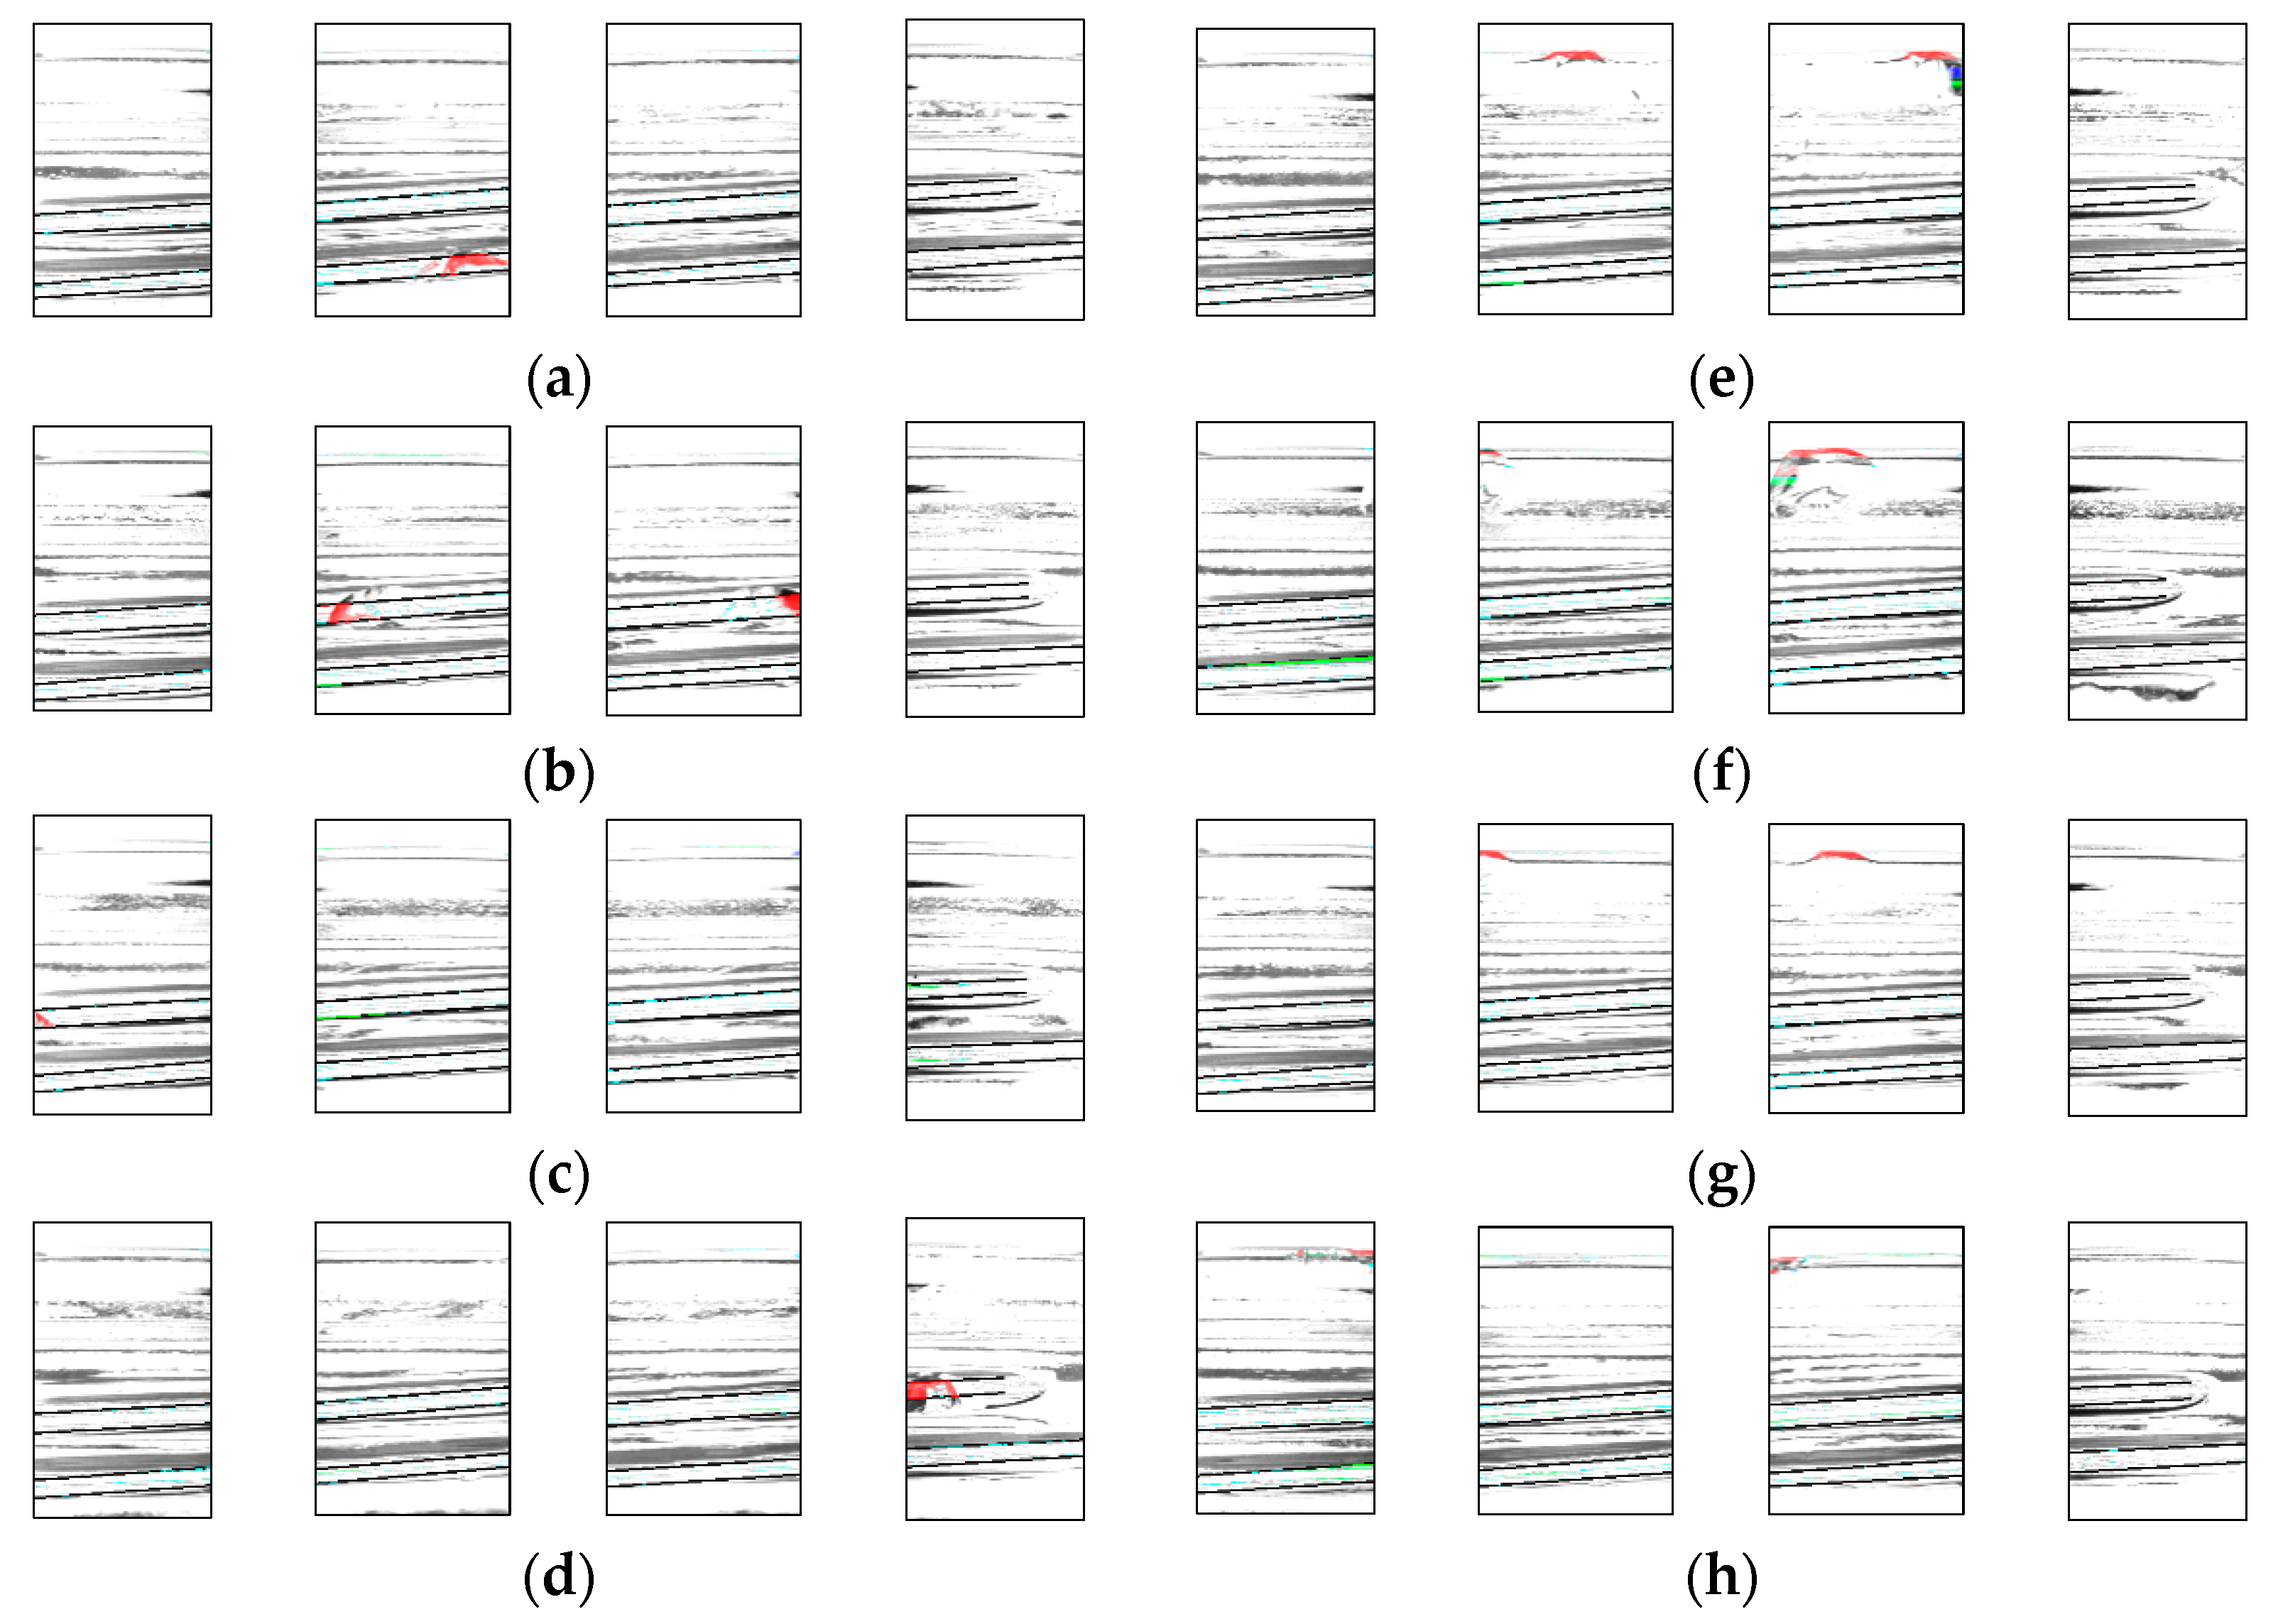
Figure 17.
Example of detection. Result for (a) chip1, (b) chip2, (c) chip3, (d) chip 4, (e) chip5, (f) chip6, (g) chip7, (h) chip8.
Figure 17.
Example of detection. Result for (a) chip1, (b) chip2, (c) chip3, (d) chip 4, (e) chip5, (f) chip6, (g) chip7, (h) chip8.
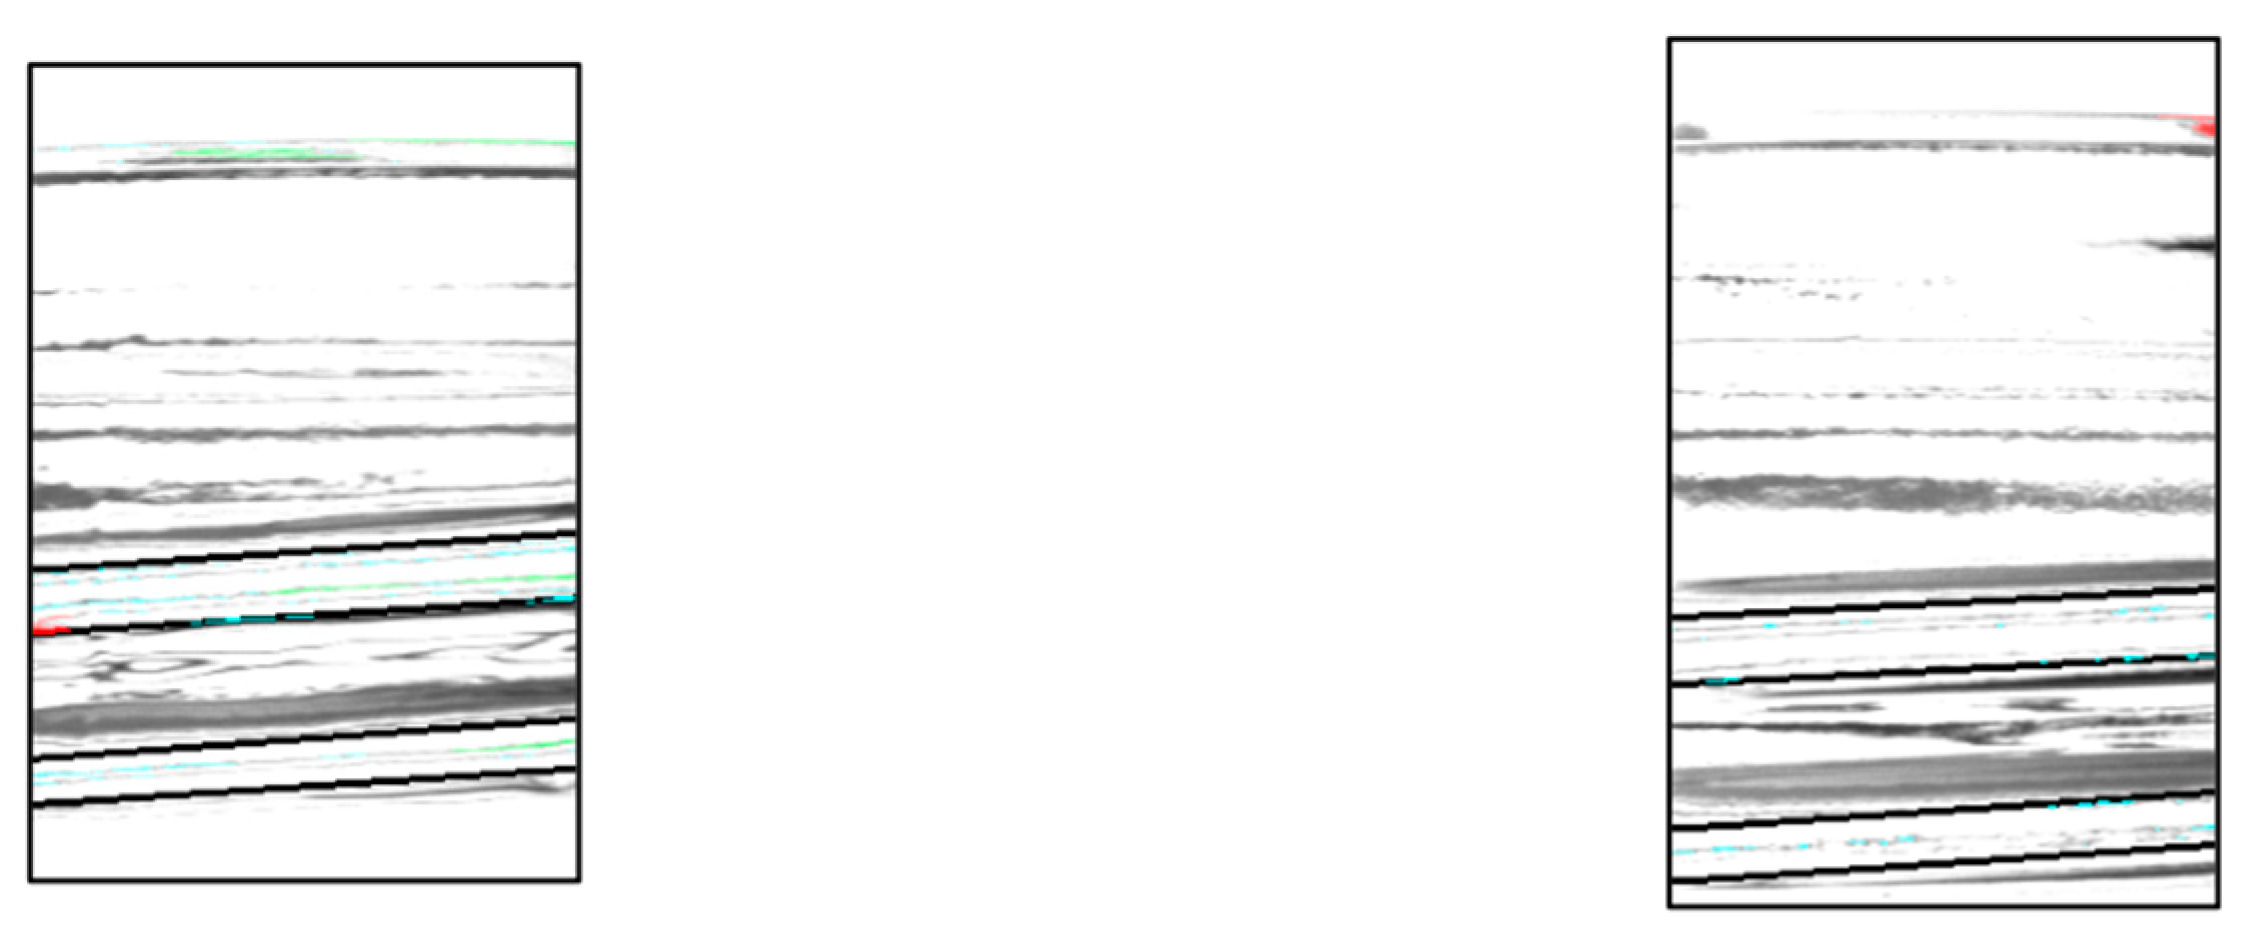
Figure 18.
Example of false positive.
Figure 18.
Example of false positive.
Figure 19.
Example for minute angle changes.
Figure 19.
Example for minute angle changes.
Figure 20.
Relationship between inspection image and luminance value (center camera).
Figure 20.
Relationship between inspection image and luminance value (center camera).
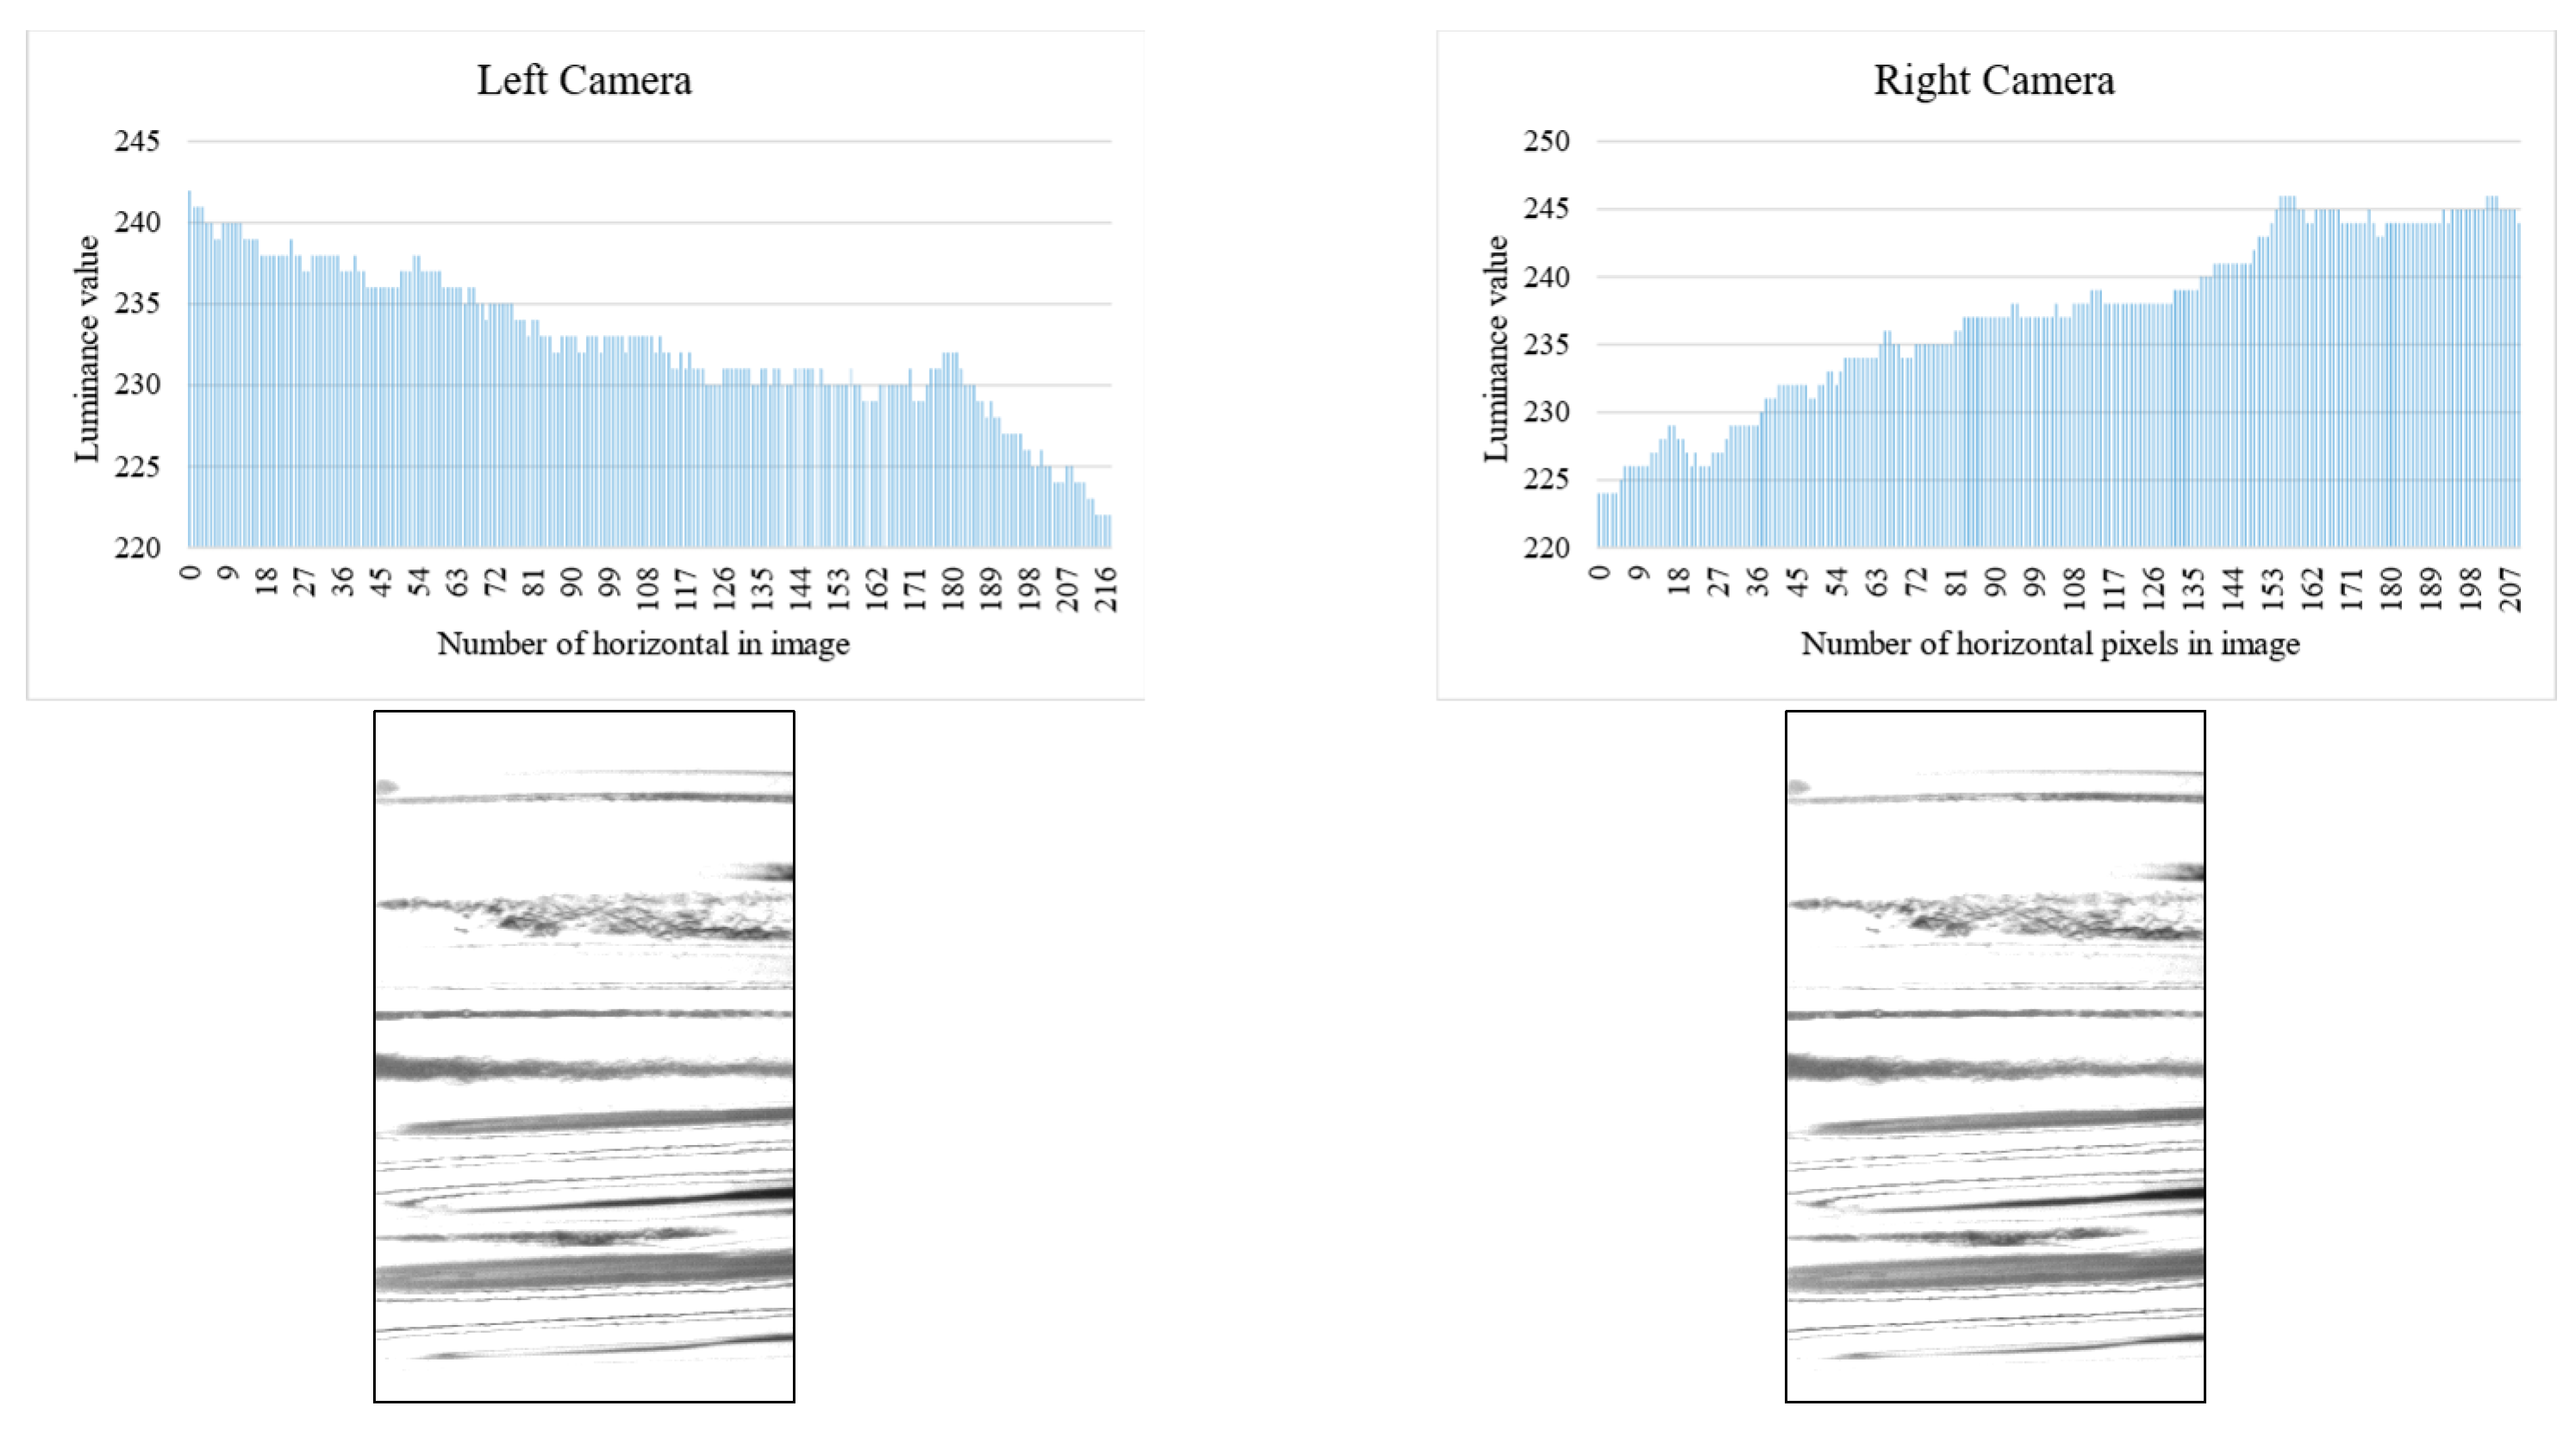
Figure 21.
Relationship between inspection image and luminance value (left and right camera).
Figure 21.
Relationship between inspection image and luminance value (left and right camera).
Figure 22.
Threshold change process.
Figure 22.
Threshold change process.
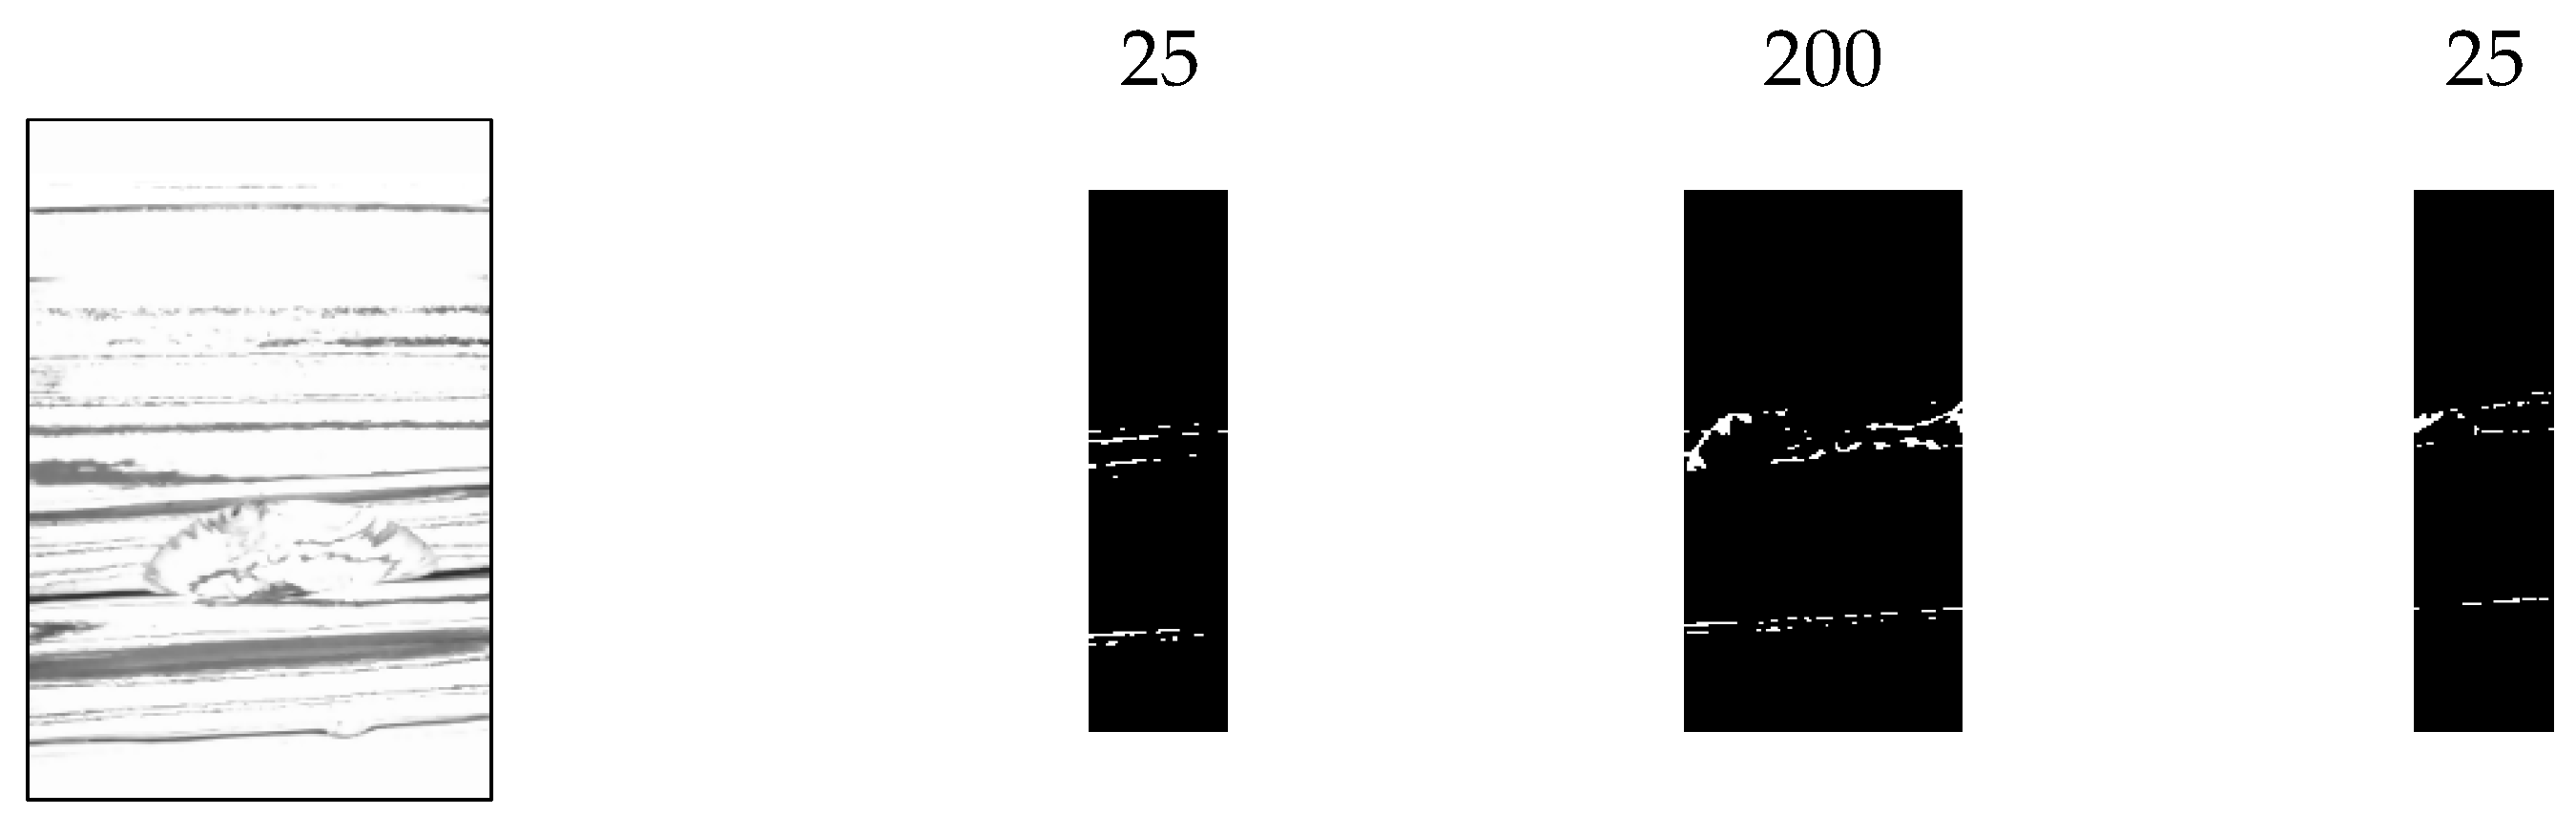
Figure 23.
Pixel value addition process. (a) Photographic image, (b) added image, (c) enhanced image, and (d) result image.
Figure 23.
Pixel value addition process. (a) Photographic image, (b) added image, (c) enhanced image, and (d) result image.
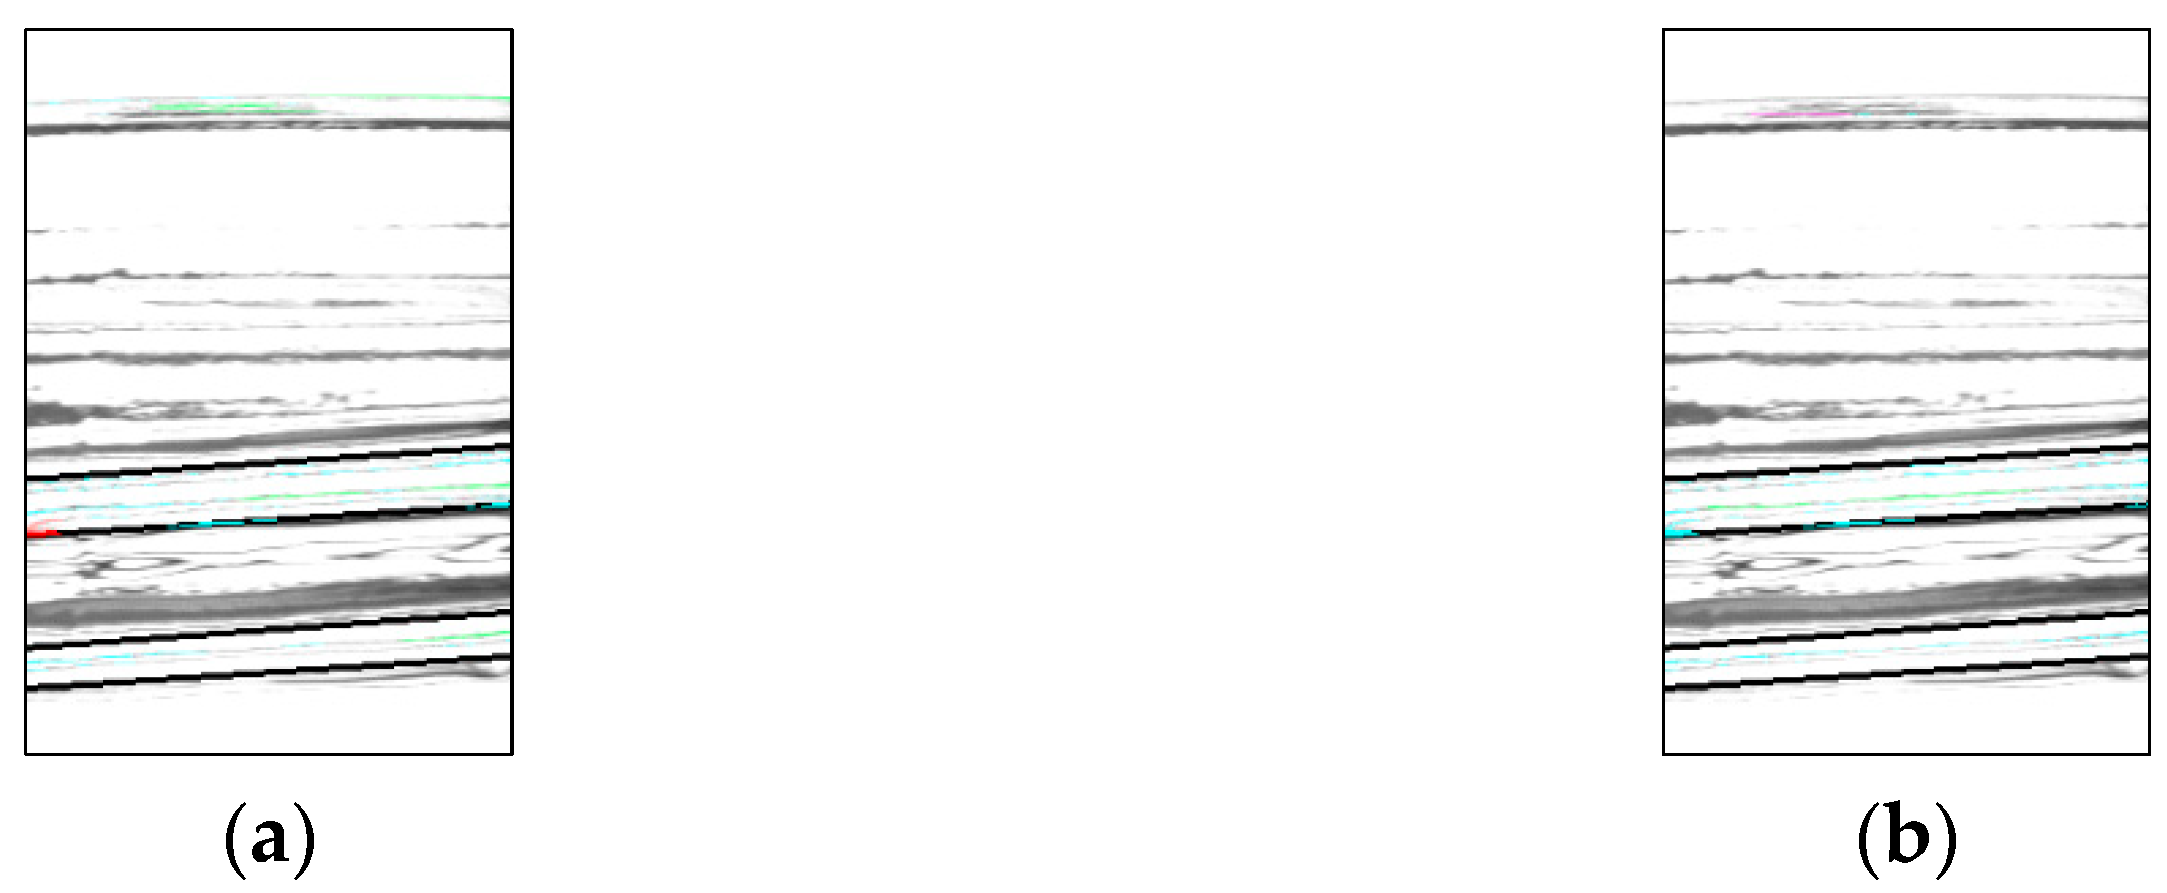
Figure 24.
Comparison with Experiment 2 (screw thread). (a) Experiment 2 and (b) Experiment 3.
Figure 24.
Comparison with Experiment 2 (screw thread). (a) Experiment 2 and (b) Experiment 3.
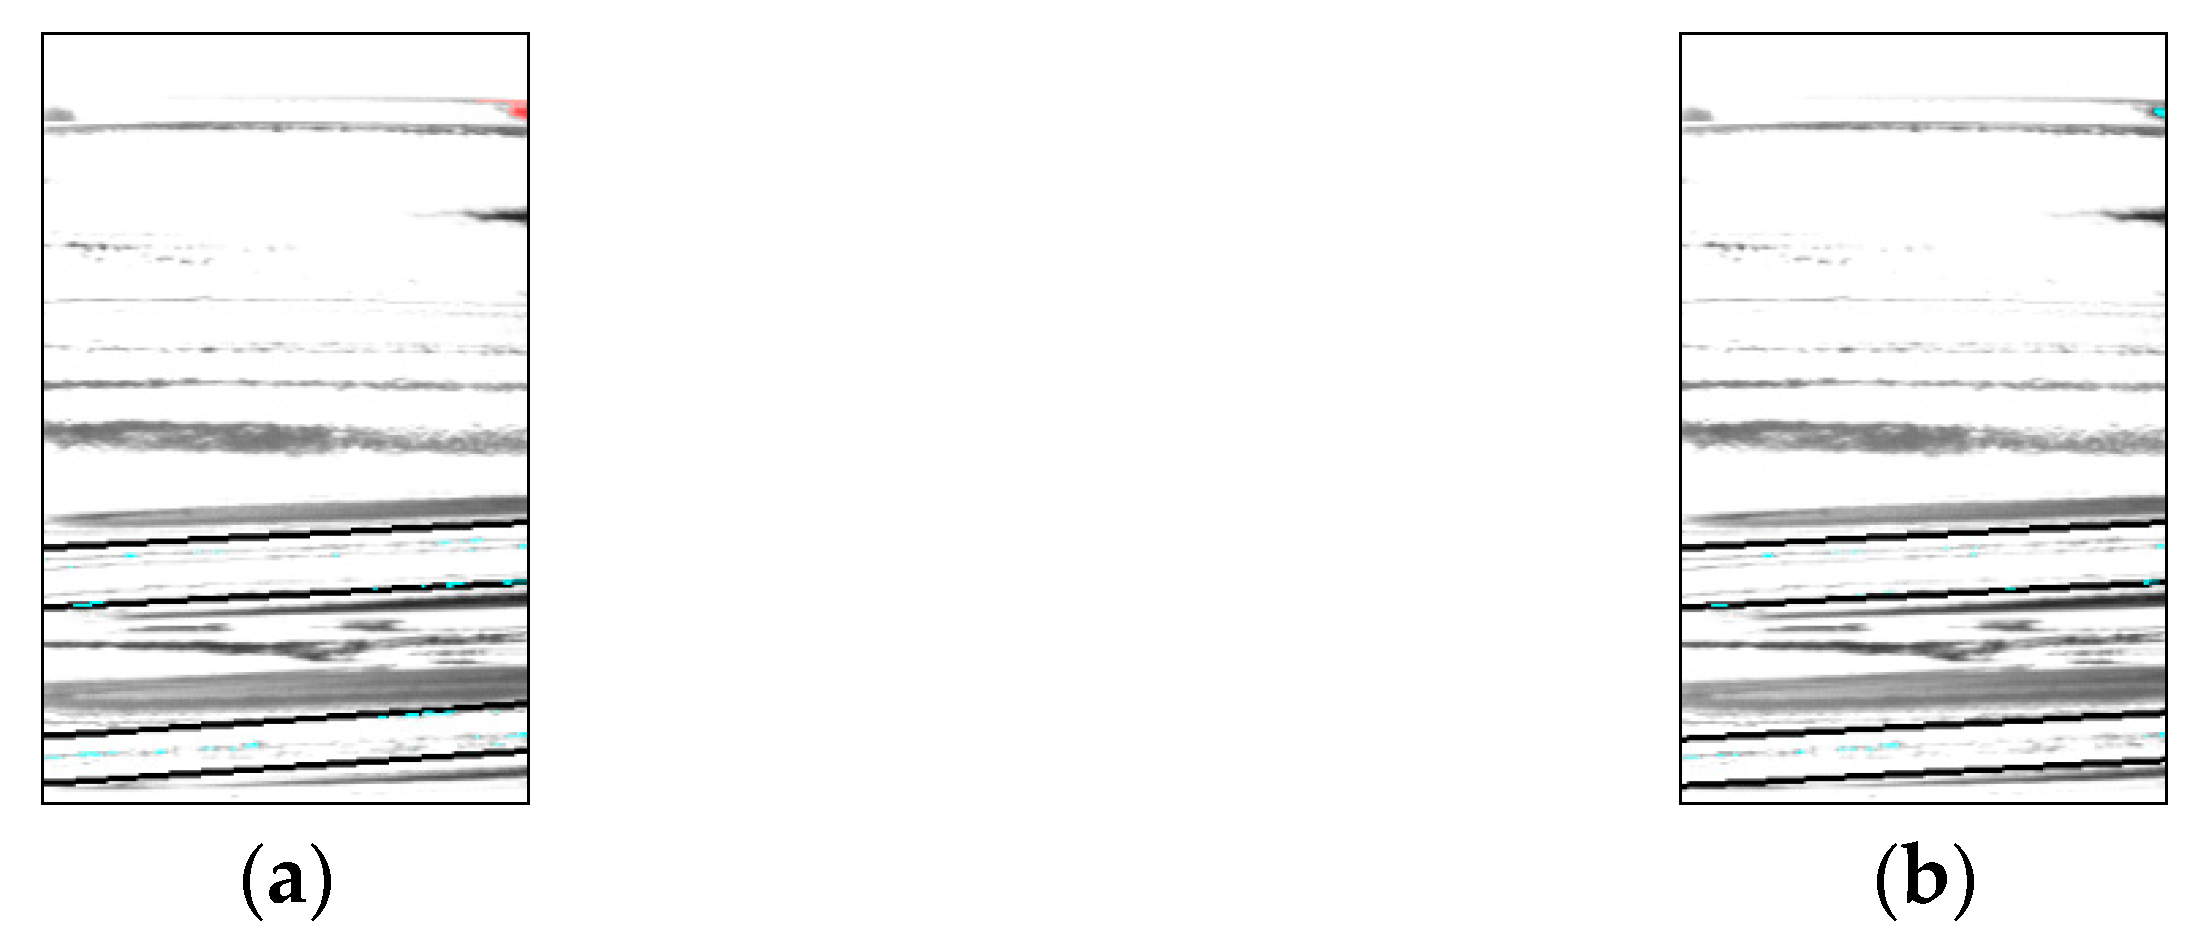
Figure 25.
Comparison with Experiment 2 (top). (a) Experiment 2 and (b) Experiment 3.
Figure 25.
Comparison with Experiment 2 (top). (a) Experiment 2 and (b) Experiment 3.
Figure 26.
Comparison with Experiment 2 (defect bottle). (a) Experiment 2 and (b) Experiment 3.
Figure 26.
Comparison with Experiment 2 (defect bottle). (a) Experiment 2 and (b) Experiment 3.
Table 1.
Criteria for chip detection and corresponding label colors.
Table 1.
Criteria for chip detection and corresponding label colors.
| Detection Criterium | Label Color |
|---|
| Area < Minimum area threshold | Light Blue |
| Area > Maximum area threshold | Pink |
| Spans the entire width of the inspection area | Blue |
| Width/Height > Set threshold | Green |
| Width/Area > Set threshold | Yellow |
| Other (Chipping, cracks) | Red |
Table 2.
Equipment used in the experiment.
Table 2.
Equipment used in the experiment.
| Component Parts | Specification |
|---|
| Camera | Model number | VCXU-32M |
| Resolution | |
| Lens | Model number | VS-1218VM |
| Focal Length | 12 mm |
| Angle of view (1/1.8″) | |
| Filter | Model number | ZOMEI IR850 |
| Infrared backlight | Model number | IFD-300/200IR-850 |
| Light source power supply | Model number | IWDV-300S-24 |
Table 3.
Experimental results for the good bottle.
Table 3.
Experimental results for the good bottle.
| Detection | | | | 0 | | | |
|---|
| Positive | 10 | 10 | 10 | 10 | 10 | 10 | 10 |
| False | 0 | 0 | 0 | 0 | 0 | 0 | 0 |
Table 4.
Experimental results for D1.
Table 4.
Experimental results for D1.
| Detection | | | | 0 | | | |
|---|
| Positive | 10 | 10 | 8 | 10 | 10 | 10 | 10 |
| False | 0 | 0 | 2 | 0 | 0 | 0 | 0 |
Table 5.
Experimental results for D2.
Table 5.
Experimental results for D2.
| Detection | | | | 0 | | | |
|---|
| Positive | 10 | 10 | 10 | 10 | 10 | 10 | 10 |
| False | 0 | 0 | 0 | 0 | 0 | 0 | 0 |
Table 6.
Experimental results.
Table 6.
Experimental results.
| | Good | Defective |
|---|
| Positive | 378 | 58 |
| False positive | Screw thread | 3 | 0 |
| Top | 19 | 0 |
| Detection rate | 94.5% | 100% |
Table 7.
Experimental results.
Table 7.
Experimental results.
| | Good | Defective |
|---|
| Positive | 400 | 56 |
| False positive | Screw thread | 0 | 0 |
| Top | 0 | 2 |
| Detection rate | 100% | 96.2% |
Table 8.
Detection accuracy of the conventional method [
4].
Table 8.
Detection accuracy of the conventional method [
4].
| | Sample | Recognized | Recall |
|---|
| Good bottles | 100 | 98 | 98% |
| Defect bottles | 100 | 98 | 98% |
Table 9.
Detection accuracy of the proposed method.
Table 9.
Detection accuracy of the proposed method.
| | Sample | Recognized | Recall |
|---|
| Good bottles | 400 | 400 | 100% |
| Defect bottles | 58 | 56 | 96.5% |


