1. Introduction
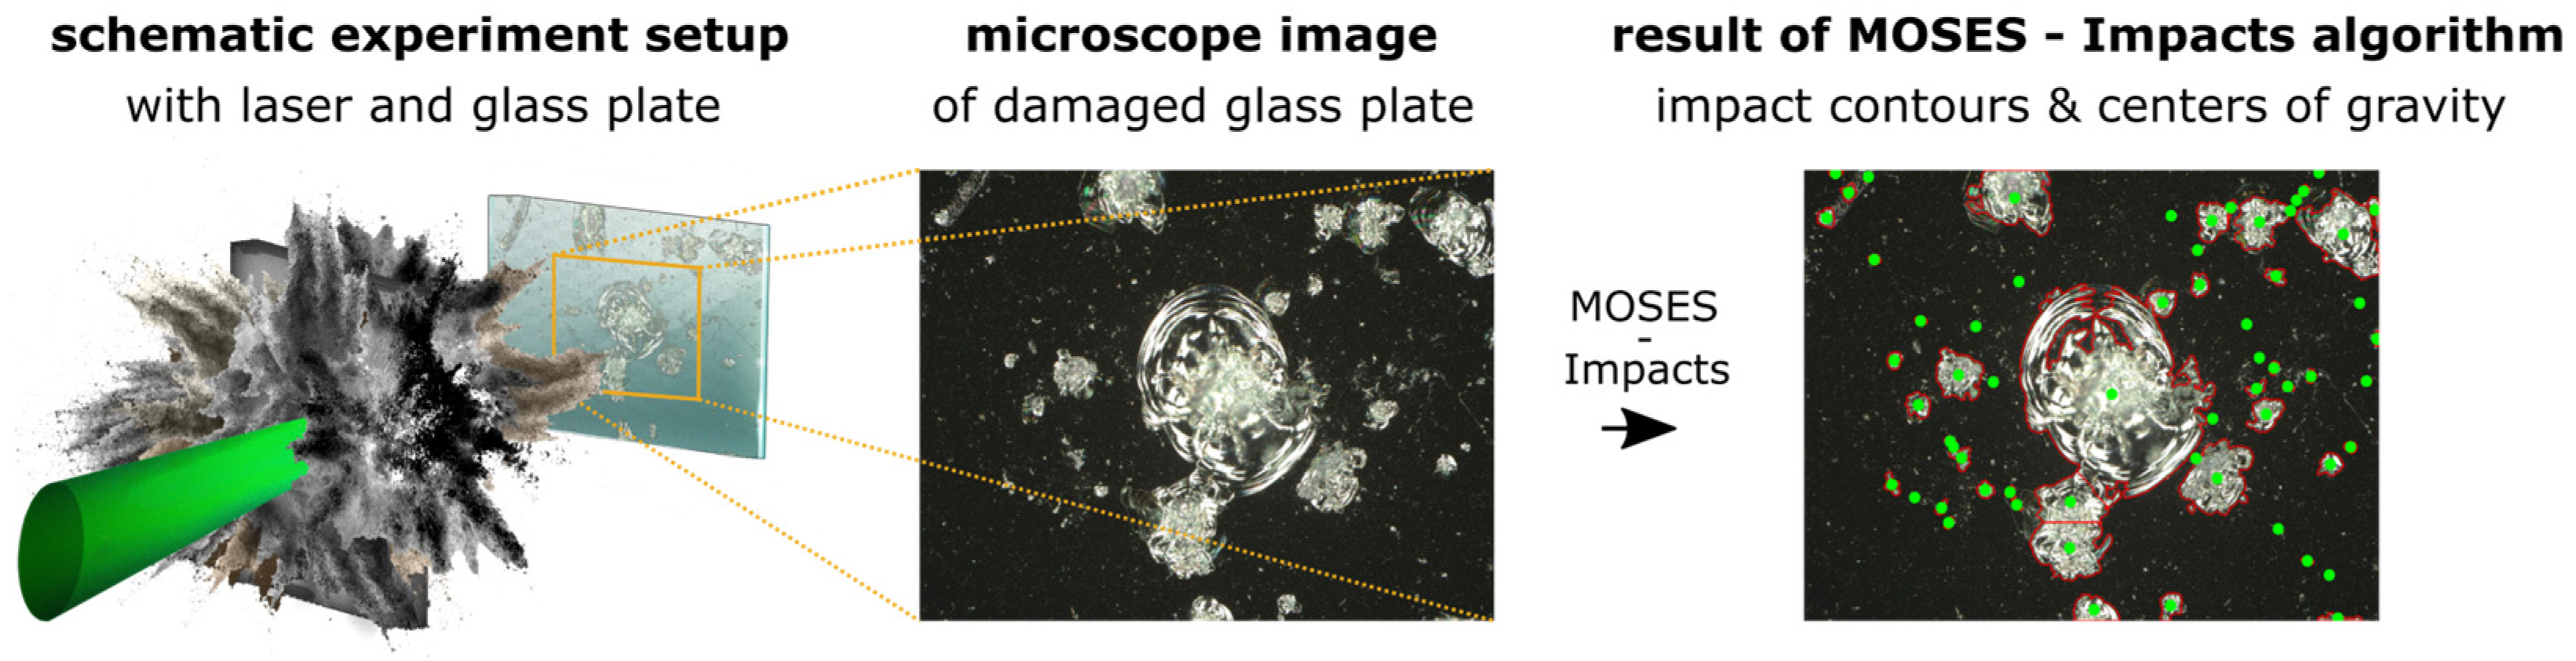
Damage to glass plate surfaces in laser–matter experiments (
Figure 1 (left and center)) causes unwanted products that increase experimental costs and limit the number of experiments that can be carried out per experiment period.
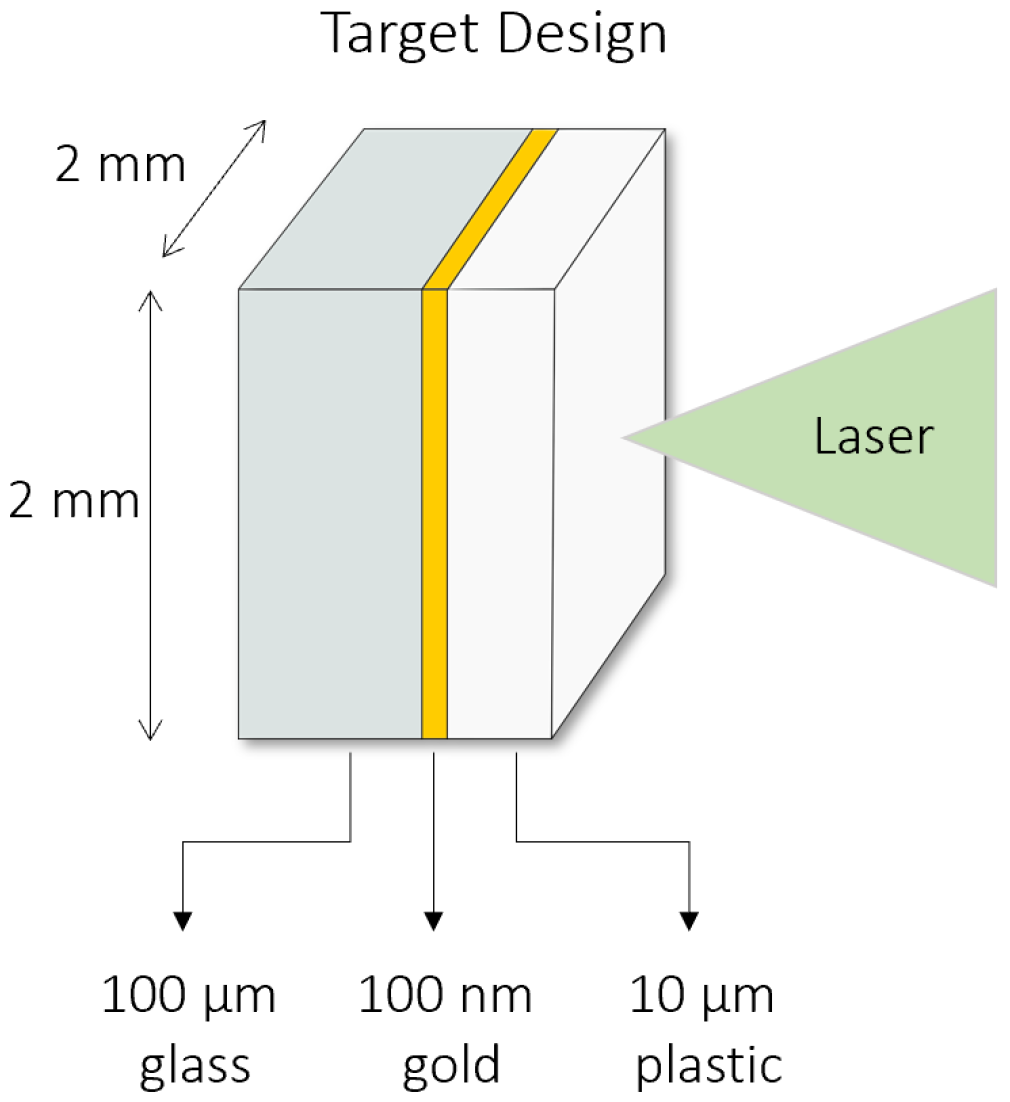
In these laser–matter experiments, a high-intensity laser beam is directed to an object in a vacuum, called a target (
Figure 1 (left)). The high laser energy involved causes the target to explode and the released material fragments to reach a relative speed of several kilometers per second [
1]. In this context, the laser energy, the target material, and the size of the accelerated material fragments are decisive for the degree of damage to a glass plate. As a result, small fragments, called debris, mainly settle as a thin film of material on surrounding surfaces, while larger fragments, called shrapnels, permanently limit the lifetime of the experimental apparatus due to impacts [
2].
The study of laser-induced damage is of increasing interest as high-power laser systems, such as the Center for Pulsed Lasers (CLPU) in Spain or the Extreme Light Infrastructure (ELI) beamlines facility in the Czech Republic with high-repetition rates of 10 Hz [
3], are currently being commissioned. These high-power, high-repetition lasers, on the one hand, enable scientists to research basic physics experiments faster than former laser systems. On the other hand, the facilities are faced with an increased factor of wear and tear [
4]. In particular, damage to optical components is an increasing problem for highly frequented experimental operations [
5]. To minimize costs and extend the lifetime of optical components, inexpensive glass protection plates are used to protect expensive optical components from direct damage [
6].
Camera-based recycling processes [
7] that help to minimize the optical effects of damaged areas, caused by impacts on optical components, have been developed. A state-of-the-art recycling method is surface smoothing through a small carbon-dioxide laser (CO
2) laser system, which is used at the largest laser system in the USA, the National Ignition Facility (NIF) [
7]. Surface smoothing transforms impacts into smooth and harmless cone-shaped dips [
7]. For such recycling procedures, the precise location of impacts [
8], as well as the optimal laser spot size are of interest.
Due to the high frequency of the impacts and a micrometer-sized structure, impacts may also be clustered and connected. Such connected impacts are potentially recognized as a single damage and thus classified as major damage, rather than multiple smaller damages. This circumstance may lead to an oversized spot size of the CO2 recycling laser, which implies that undamaged areas are unnecessarily included in the recycling process. A separation of connected impacts in the recognition of damages is therefore crucial for further optimizing the recycling process.
In this work, a processing method for microscope images of damaged glass plates has been developed to minimize the recycling laser spot size error in recycling processes. The aim of the processing method is to separate connected damages based on the microscope glass plate images by combining multiple image processing functions. The method consists of a two-step process and is structured as follows: first, the Pre-Processing Phase, where impacts are detected, and second the Processing Phase, where connected impacts are separated (
Figure 1 (right)). To lead our research on the recognition and evaluation of shrapnel impacts on glass plates, two research questions were defined:
RQ1: What is the effect of the damage separation on the total area to be repaired?
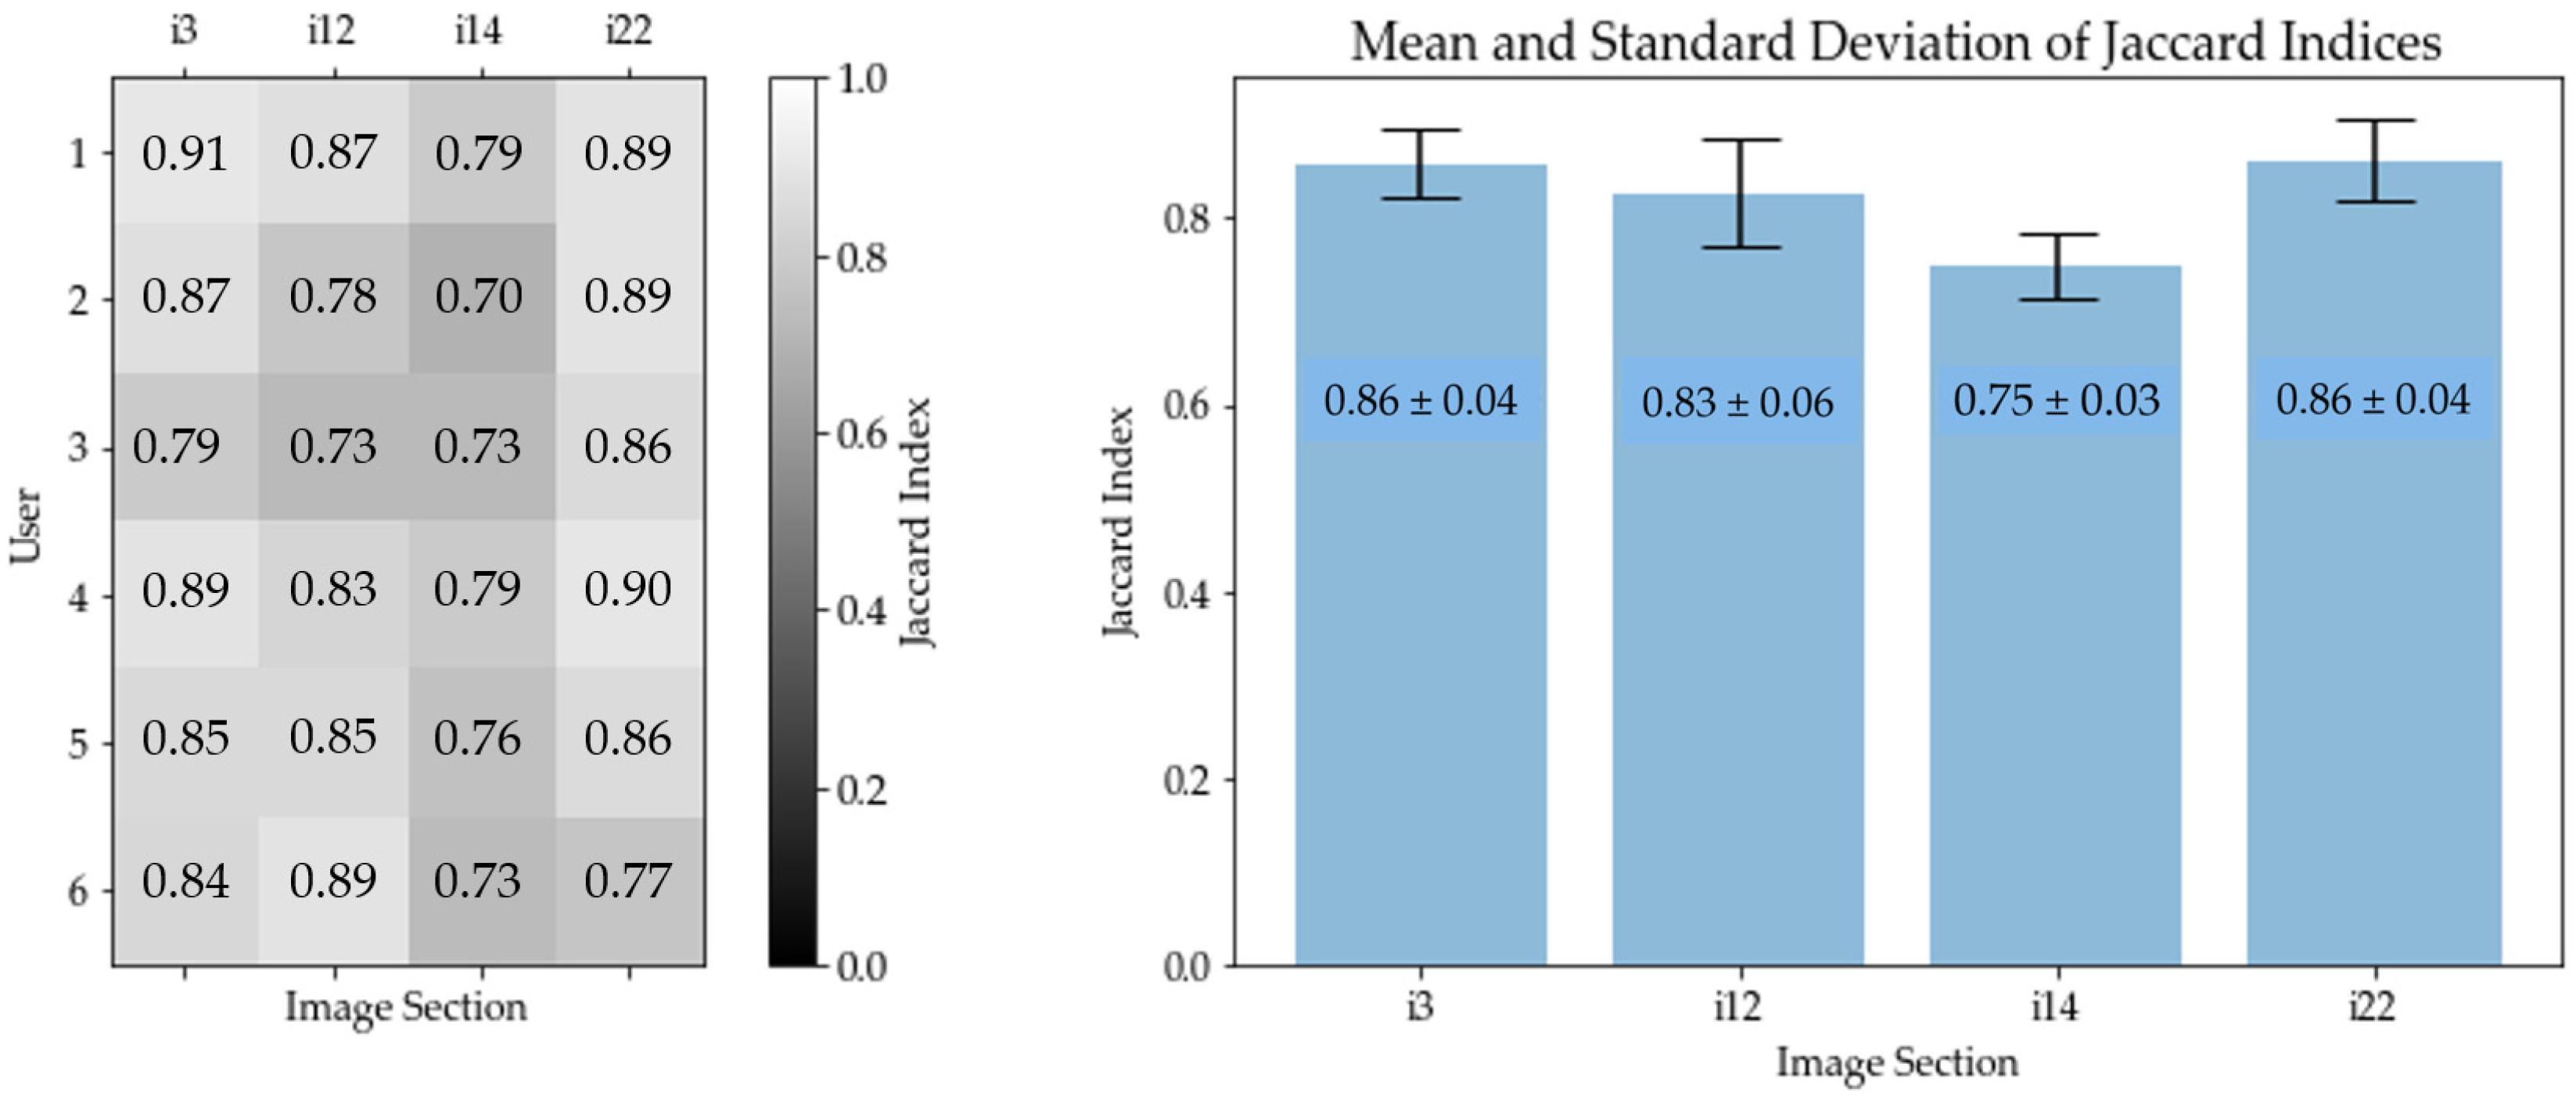
RQ2: What is the similarity of the developed processing method in detecting impacts on glass plates compared to human users?
The main contribution of this paper is a new method for detecting laser–matter impacts that allows an optimization of recycling processes of damaged glass plates through separating impacts. This method differs from existing detection methods and algorithms in the field of quality glass inspection [
9] by detecting a large number of impacts on small areas with connected impacts instead of a single impact on larger areas. The second contribution is the evaluation of similarity of detection results compared to human users.
The following sections are structured as follows:
Section 2 provides an overview of related work on the topic, while
Section 3 presents the experiment information and the digitization of the glass plates. In
Section 4, a definition of a shrapnel impact is given, and, in
Section 5, the processing method is presented with a flow chart. In
Section 6, the method is evaluated in comparison to a human user study and research results are discussed in relation to the research questions. Finally, in
Section 7 future work is presented.
2. Related Work
In this section, we want to give an overview of related work in the field of damage detections on surfaces and an analysis of accelerated material fragments by grouping findings into two major topics: first are the results of accelerated material fragments, caused by laser–matter interaction as well as recycling methods to minimize damage; and second is the state of the art in the computer vision of glass plate inspections.
In 1998, Lebert et al. [
10] provided the first description of surface damages caused by laser–matter interactions in a vacuum with different target materials, while four years later, in 2002, Azuma et al. [
11] determined the average area of impacts via the angular orientation of the glass plate to the target normal and showed that the average impact size remains small from an angle of 60°. In 2005, Higashiguchi et al. [
12] investigated the area of damages by their frequencies and thus provided the insight that impacts with a size between 3 and 10 µm occur most frequently. Three years later, Andrew et al. [
2] observed that the angle of incidence of the shrapnel on a glass plate determines the shape of the impact. Shrapnel with small angles of incidence produces circular impacts and becomes comet-like as the angle increases [
2]. Furthermore, Andrew et al. [
2] documented that the most energetic material fragments gather in the center of the impact area and the distribution of impacts decreases symmetrically around the center.
In 2013, Martinkova et al. [
13] extended the previous two-dimensional results with the volume of individual impacts. Plasticine was used to create impressions of the impacts of the damaged surfaces. This enabled them to estimate the volume of material removed from a glass plate. For impacts with a diameter of (1.0–2.0) mm, the volume was (0.14–0.48) mm
3 and for larger diameters between (2.75–8.4) mm, the volume was (0.45–37.4) mm
3 [
13]. Furthermore, correlations could be found between the impact diameter, the impact depth, the shrapnel diameter, and its material density. These correlations enabled them to estimate the shrapnel velocity, which resulted in (288–534) m/s for the small impact diameters [
13]. In addition to the previous experimental results, Aubert et al. [
14] provided a contribution to the topic of impact simulations in 2019. Their simulation of impacts differed from previous impact studies due to the point of origin. The simulated impacts refer to the location on the target surface where the laser–matter interaction takes place. For these investigations, a finitely thick target is assumed, which is non-explosive. Damage in the form of larger craters occurs on the target surface due to the interaction. The simulation enables the prediction of crater dimensions as a function of laser energy. Bude et al. [
5], in this context, highlight that all high-power laser systems have similar sources of damage.
In the US, the National Ignition Facility (NIF) is equipped with the largest high-power laser system. Its optics have thousands of damages greater than 10 µm, as well as many more damages smaller than 10 µm in size. Tobin et al. [
15] proposed guidelines for conducting experiments at the NIF to increase the lifetime of protective glass plates against shrapnel damage. The authors discovered a correlation between shrapnel size, shrapnel velocity, and the thickness of a glass plate required to withstand a collision. Tobin et al. suggested that a 50 µm shrapnel with a velocity of 1 km/s requires a 100 µm thick glass plate to withstand, while a shrapnel four times as large and twice as fast would require a 1 mm thick glass plate. Tobin et al. [
15] also referred to the potential danger of breaking protective glasses, which may result in higher material loss than through impacts. They explained that the spallation typically generates a cone-shaped impact [
15]. Typical quantitative measurements of shrapnel size can be characterized with as aerogels that absorb shrapnels [
1], shadowgraphs [
16], and high-speed video recordings [
17]. The use of aerogels stops shrapnels before touching the surface and is solely suitable for measuring the shape and volume of shrapnels. It cannot be used to draw conclusions about the potential damage caused. Shadowgraphs and high-speed video recordings do not interact with the shrapnel. However, information about shrapnel volume has to be extrapolated from two-dimensional images.
Spaeth et al. [
7] emphasized the importance of developing efficient strategies to reduce and fix damage to glass optics. One promising strategy is the optics recycling loop, which involves steps designed to evaluate, repair, and minimize damage to optics [
7]. These steps include regular replacement, cleaning, polishing, coating, and optics testing [
7]. Carr et al. [
18] presented comprehensive strategies for mitigating, managing, and repairing the damage that occurs at NIF, which is crucial in preserving the functionality of the optics. The damage is mainly caused by laser-induced processes. The recycling process involves using automated CO
2 laser systems that apply Rapid Ablation Mitigation (RAM) to repair the damaged optics. RAM uses concentrated laser beams to remove damaged areas and repair optics [
18]. The recycling process is initiated by measuring the surface of optics on an automated inspection microscope, which locates all damages larger than about 7 µm [
18]. Afterwards, the automated CO
2 laser systems are used to repair any damaged area larger than 10 µm [
18]. Miller et al. [
19] consider, in a similar process, previously repaired optics. Their examined optical surface of 43 cm × 43 cm is scanned and analyzed by the recycling process within 4 h by a resolution of about 5 µm per pixel [
19]. In this process, the previously repaired spots have to be identified first. Thereafter, new damages can be classified and repaired accordingly [
19]. Negres et al. [
8] rely on human evaluations for analyzing damage, which is a labor intensive process. This procedure, however, prevents possible threshold errors in image processing steps. In their work, they stress the importance of detailed knowledge on the locations of damages to design more robust recycling processes in the future [
8].
Research in this area shows a clear trend for the development of more advanced diagnostic and repair technologies that focus more on automated systems. The constant improvement in these technologies is essential for the stability and lifetime of high-energy laser systems.
Computer Vision enables non-contact inspection systems based on image processing algorithms that are used to detect surface damages automatically [
9,
20,
21,
22,
23]. For example, Peng et al. [
9] provide an overview of improving glass quality at production by detecting defects. Zhao et al. [
20] and Liu et al. [
21] make use of computer vision and developed glass defect classification methods that are useful for low and differing resolutions. While Makaremi et al. [
22] described a new approach in 2018 for texture defect detection based on a modified version of the local binary pattern (LBP), Hoang et al. [
23] presented a method for detecting spall objects using Gabor filters, texture analysis, and adaptive optimized logistic regression models. These studies contributed to the improvement in defect detection and classification techniques, applying advanced image processing methods to increase product quality in various industrial applications and to improve safety in the construction industry.
By analyzing existing computer vision processes for detecting shrapnel impacts on glass plates, an overarching structure can be identified in the inspection systems presented: The majority of image processing algorithms follow a typical pattern. First, the removal of background information is carried out by applying filter operations [
9], followed by a segmentation method [
23] or edge detection method, used to identify impact contours [
20]. Finally, binarization of the images is undertaken [
9,
20,
22,
23].
4. Definition of a Shrapnel Impact
For determining the accuracy of shrapnel impact recognition on glass plate surfaces, a definition of a shrapnel impact is needed. Since there is no general definition in the literature so far that describes shrapnel impacts in detail, we introduce and use a definition in the following part, which considers borderline cases, on the one hand, and distinguishes areas of impact, on the other hand.
A shrapnel impact on a glass plate is a material change caused by accelerated fragments of a material, which hit the glass surface. The impact area of a shrapnel can be divided into four subcategories, which can be described as follows:
- (a)
Crater area;
- (b)
Ring area;
- (c)
Partially disconnected material area;
- (d)
Molten material area.
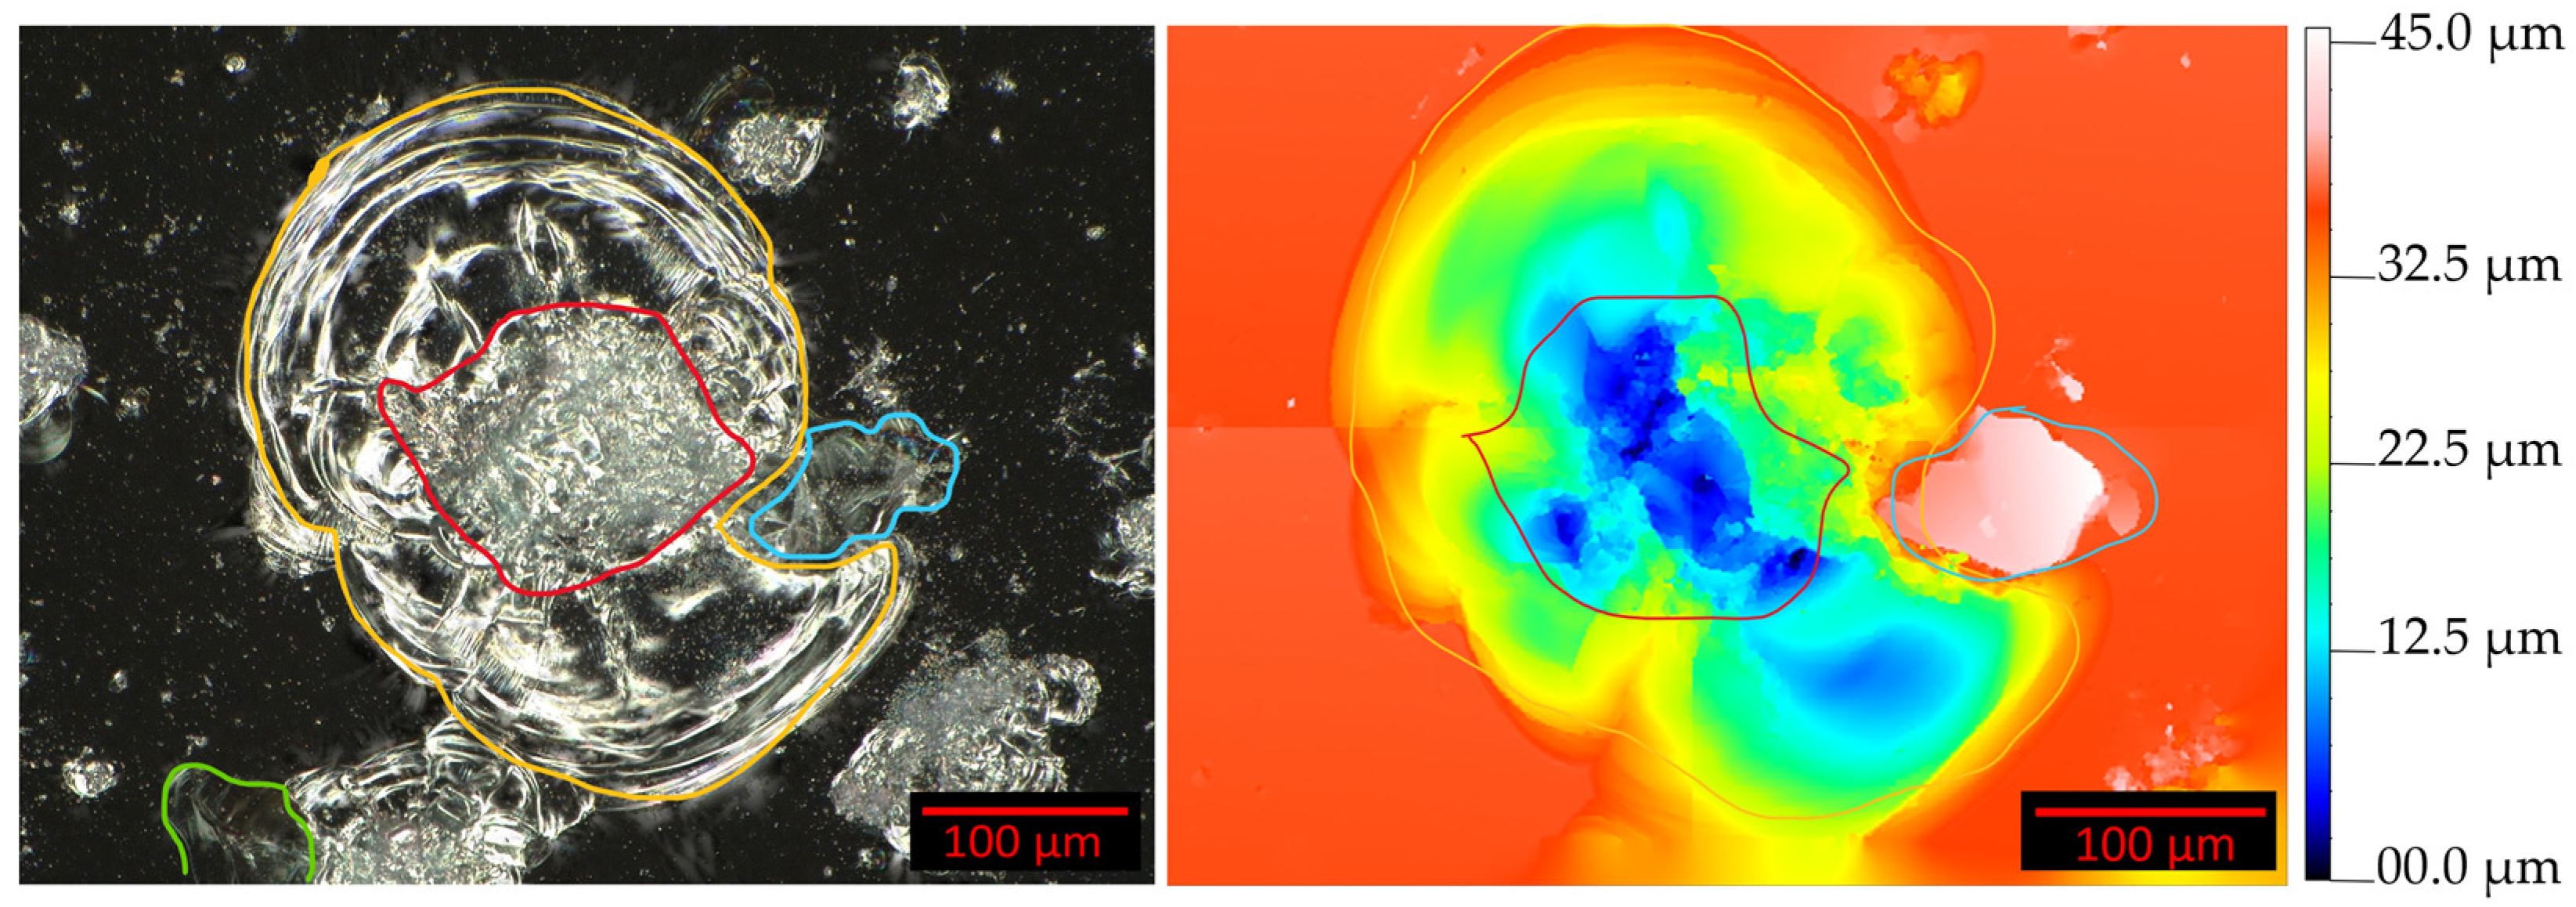
Figure 5 shows two images of the same impact, captured with two different microscopes and divided into four subcategories, drawn as colored contours. The left image shows a two-dimensional image, acquired with a digital microscope. The right image shows a corresponding three-dimensional image as a color map, acquired with a confocal microscope.
Both categories—the crater (
Figure 5, red contour) and ring areas (
Figure 5, yellow contour)—are regions that lost material compared to an undamaged glass plate surface. They usually differ in the depth of the damage and constitute large parts of the impact areas. The three-dimensional image helps us to detect the molten material (
Figure 5, blue contour). It can be detected through a deviation in height relative to the undamaged glass plate surface and hardly shows any color changes in a two-dimensional image.
A dark field illumination setting enables the detection of partially disconnected material (
Figure 5, green contour) by indicating spectral color components in these areas, while a bright field illumination setting shows deviations from the background color (
Figure 6, red boxes).
5. Processing Method
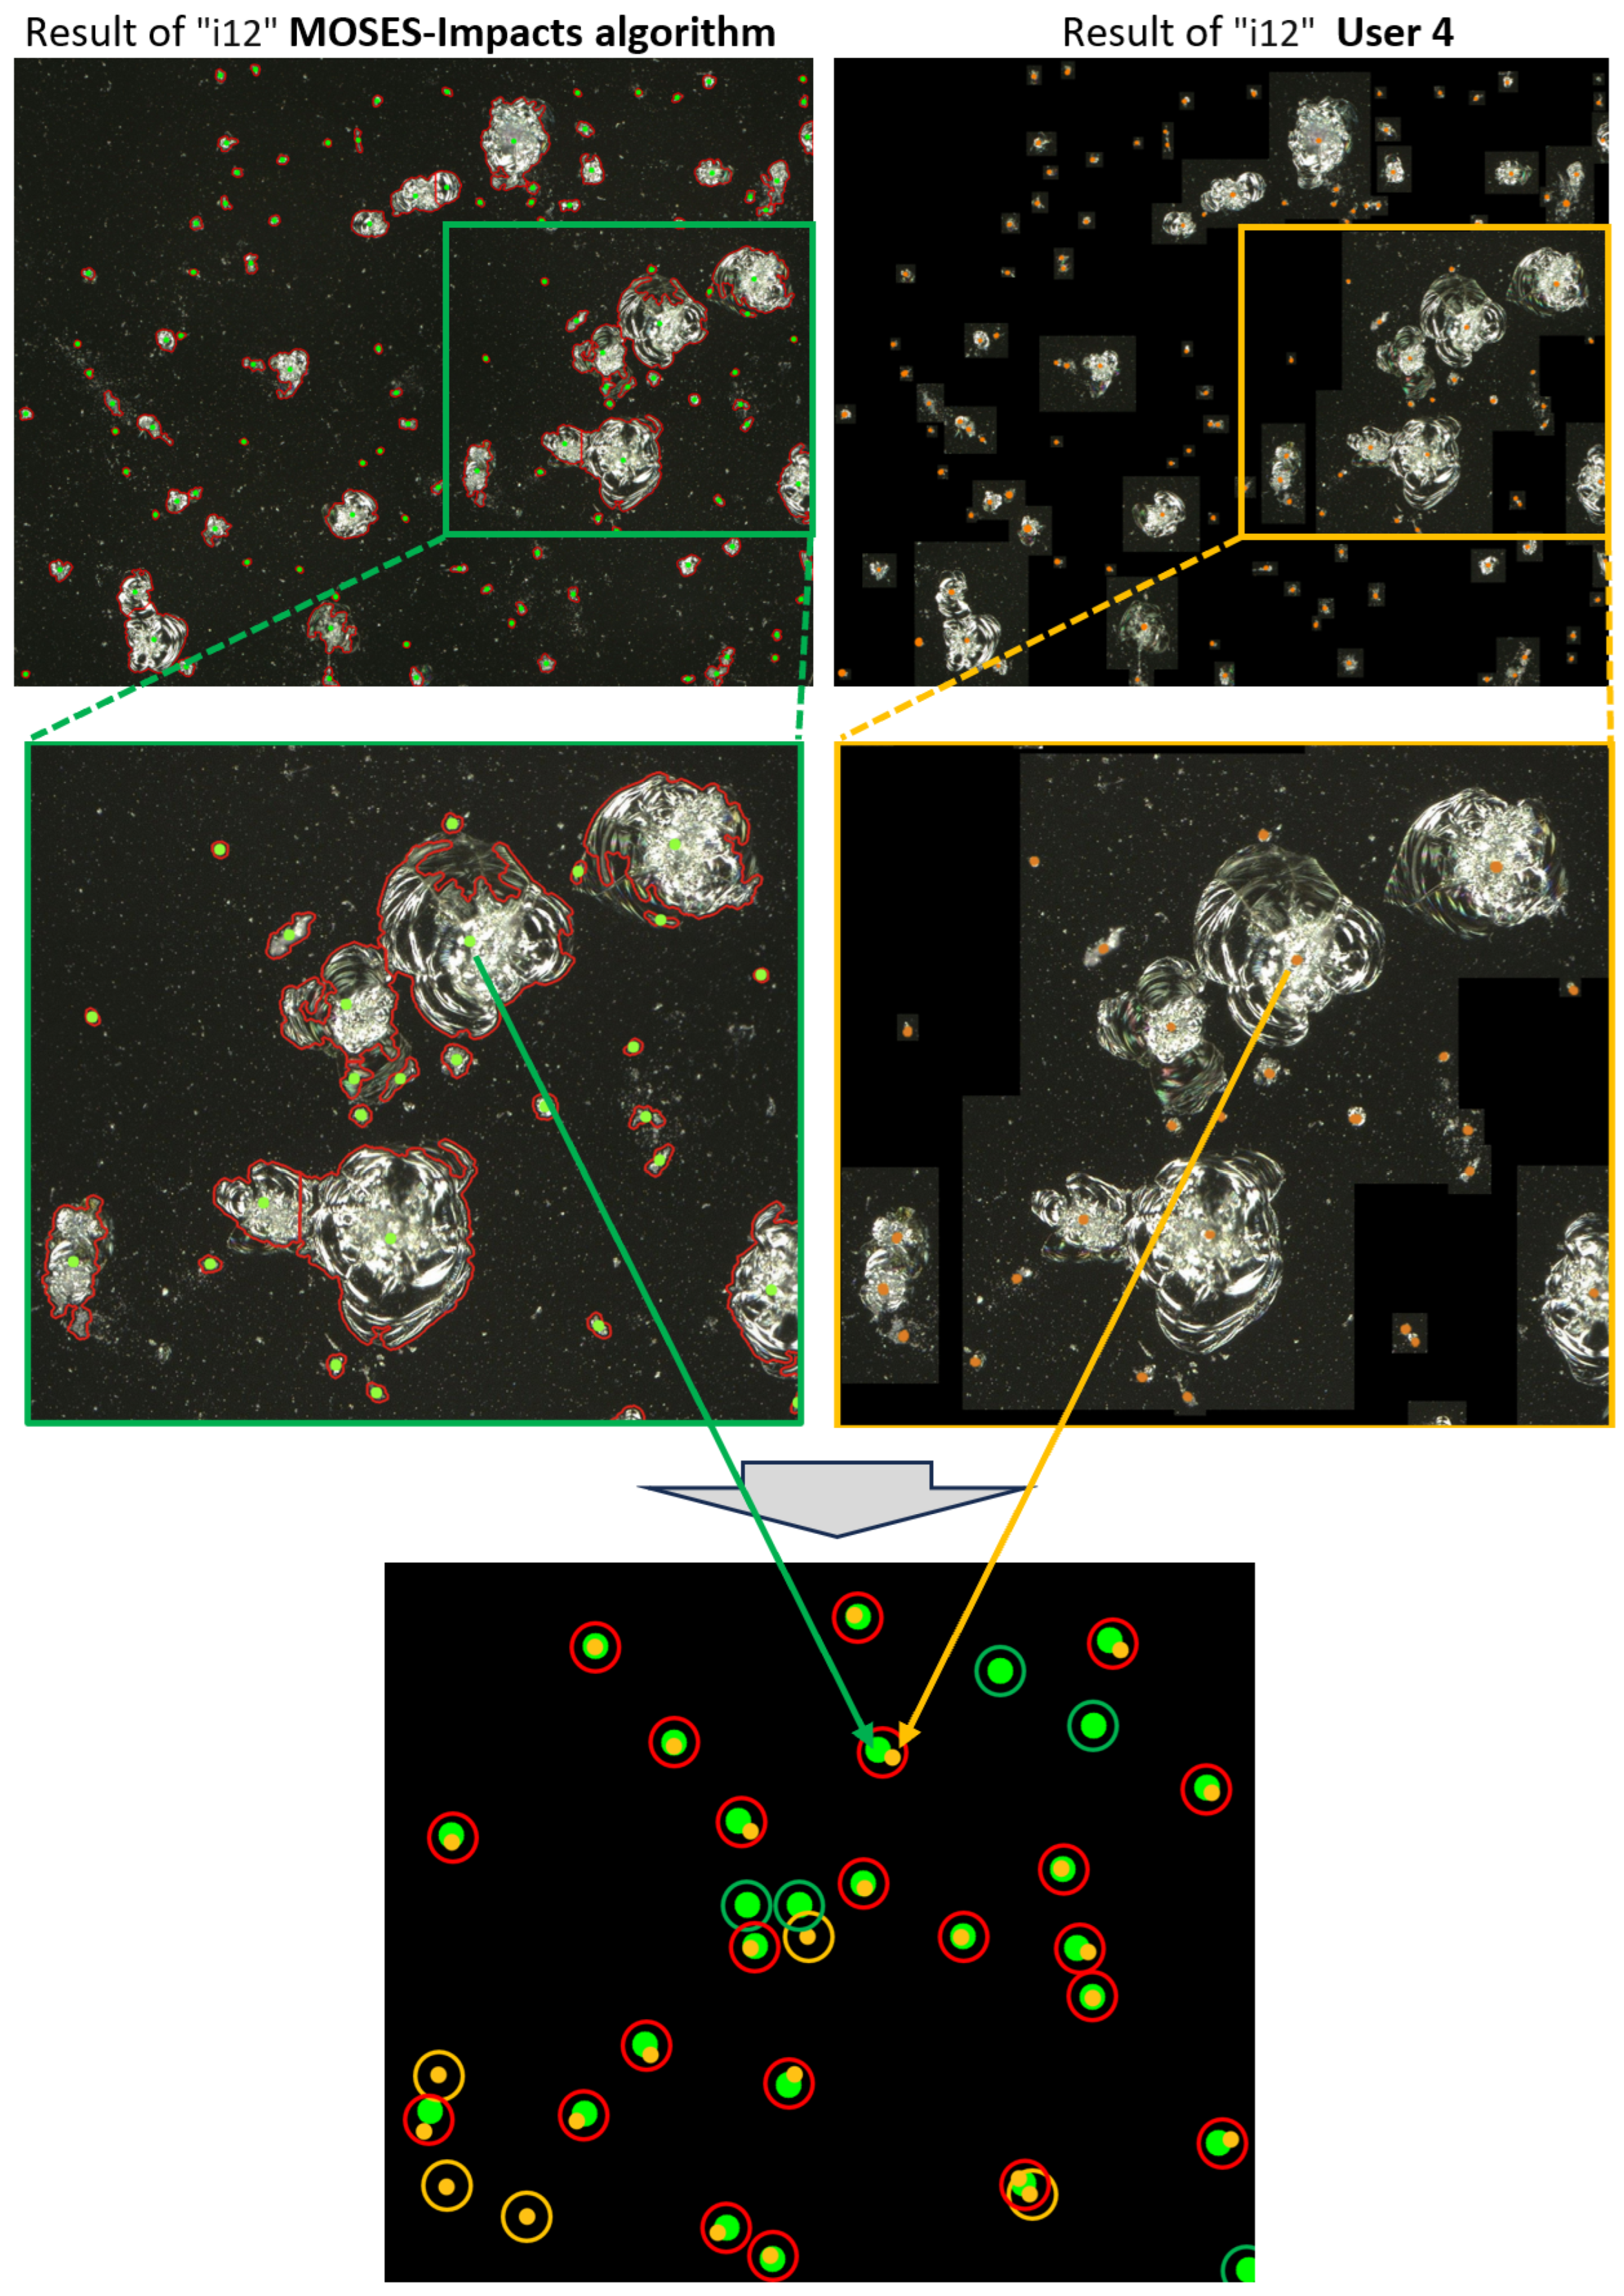
In this section, we describe the proposed processing method, the MOSES—Impacts (Method for Outlining and Separating Existing Surface—Impacts) algorithm, for detecting and separating connected shrapnel impacts on glass plate surfaces, as well as calculating the centers of gravity of the impacts. To detect and separate shrapnel impacts (as foreground) from intact glass plate areas (as background), the identification of impact contours is a crucial step. This method focuses on accurately identifying the impact area without dividing it into sub-areas and labeling them.
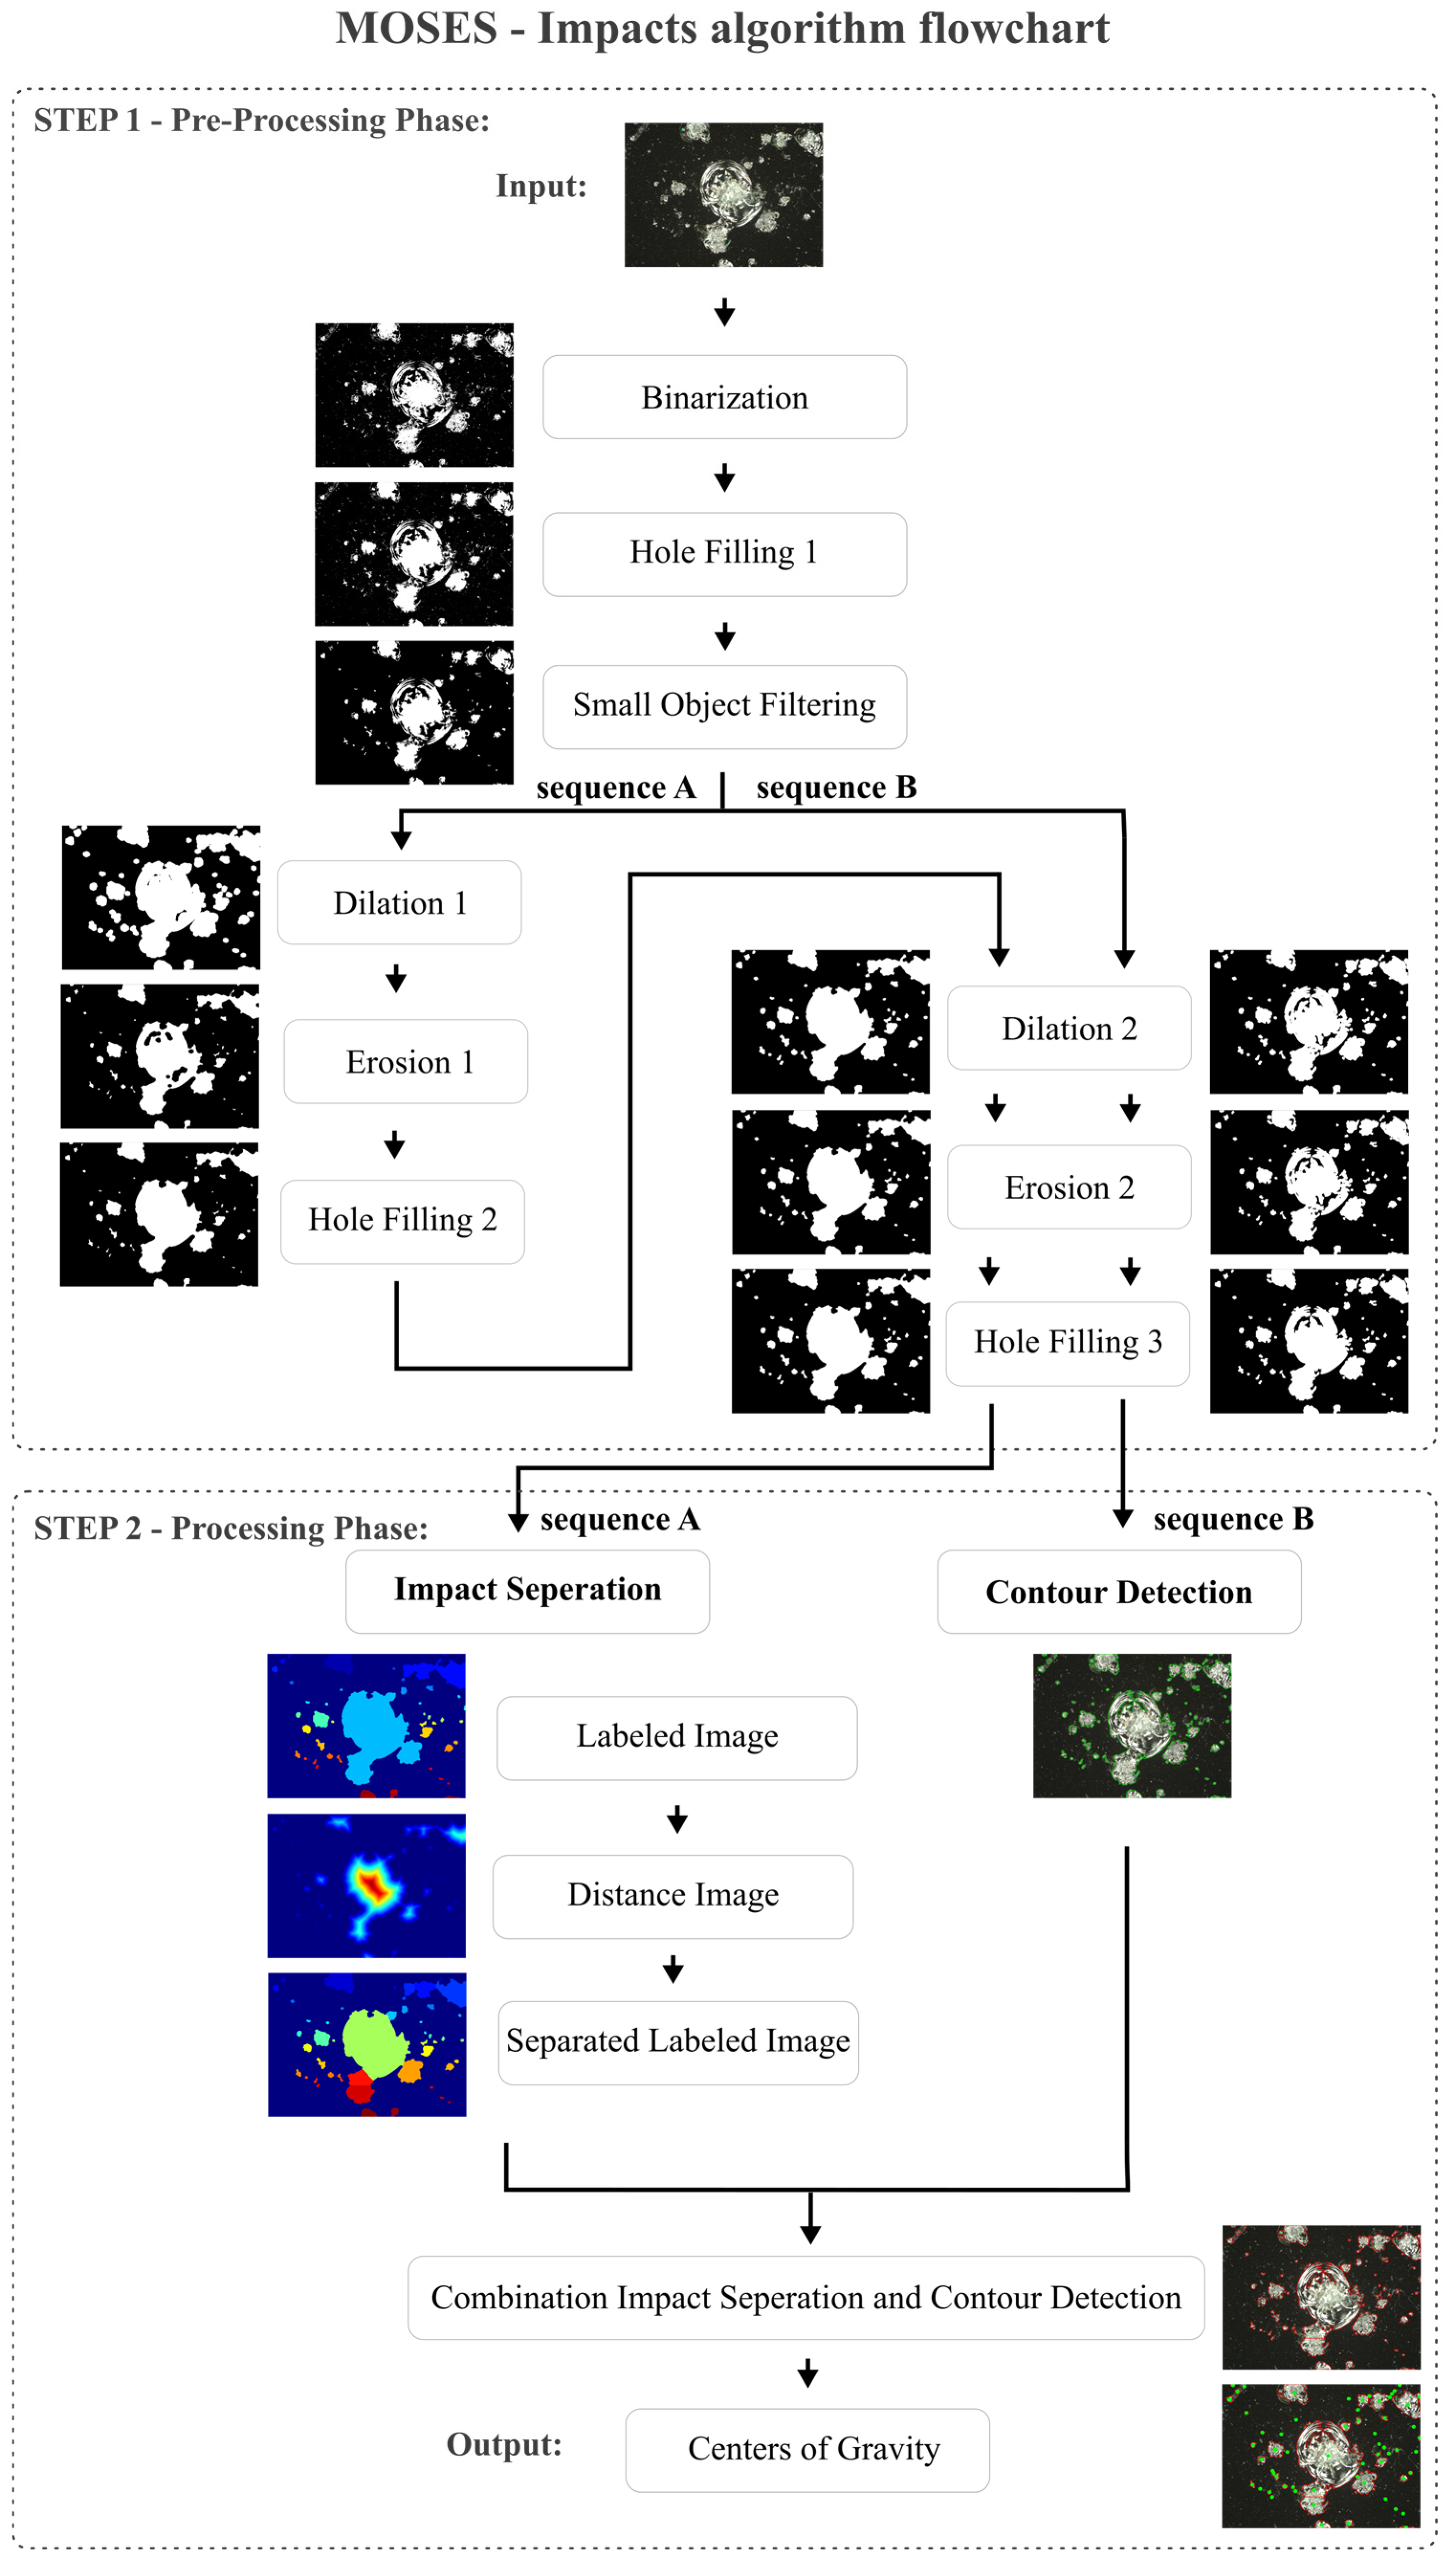
The MOSES—Impacts algorithm is shown as flow chart in
Figure 7, which was implemented in Python 3.9.8, including the open-source libraries of cv2, numpy, matplotlib, math, sys, pandas, PIL, skiamge, scipy, argparse, and imutils. It utilizes color images as input data and consists of two steps: The Pre-Processing and Processing Phase. Both steps are described in detail in
Section 5.1 and
Section 5.2.
A characteristic of the MOSES—Impacts algorithm is the parallel sequence, which starts from the Pre-Processing Phase and extends to the Processing Phase. In this parallel sequence, which is divided into sequence A and sequence B, two different images are calculated: one for the separation and one for contour calculation. This is required to obtain the best possible result between impact separation and contour detection. The difference between sequence A and sequence B at the end of the Pre-Processing Phase in combination with the Impact Separation step is shown in
Figure 8. Here, the applied Dilation 1 + 2 and Erosion 1 + 2 in
Figure 8(A1) result in a single recognized impact (white box in the upper right corner). In contrast, Dilation 2 and Erosion 2 applied in
Figure 8(B1), without Dilation 1 and Erosion 1, result in multiple separated impacts (white box in the upper right corner). In
Figure 8(A2,B2), the distance images of detected impacts of
Figure 8(A1,B1) are shown. The distance image of sequence A, in general, shows larger distances compared to the distance image of sequence B. In
Figure 8(A3,B3), the separation of connected impacts is visualized. Compared to sequence A, sequence B tends to separate individual impacts as well (white center boxes).
To assess these results, three measures should be used: 1. the number of detected impacts; 2. the accuracy of contour detection; and 3. the performance in separating connected impacts. Regarding the first two measures, Sequence B leads to more accurate results. However, the performance in separating impacts of sequence B is surpassed by sequence A. In order to utilize the advantages of Sequence A and Sequence B, both sequences are applied and combined at the end of the Processing Phase. Both phases are described below and are structured as follows:
In step 1—Pre-Processing Phase—a color image is converted into a greyscale image and binarized (Binarization) (see
Figure 7). Existing holes in the foreground are then filled (Hole Filling 1) and a filter is applied afterwards. The filter removes small impacts (Small Object Filtering), as the resolution of these is too low meaning they could not be separated from image and digitization noise. This image is further processed in sequence A with two morphological operators (Dilation 1 + 2 and Erosion 1 + 2) and in sequence B with only one morphological operator (Dilation 2 and Erosion 2), resulting in two different images being generated. The main difference between Dilation 1 and Dilation 2 in this parallel sequence is the number of single operator repetitions. In Dilation 1, the image is dilated 10 times, while in Dilation 2, it is dilated 4 times. Similarly, in Erosion 1, the image is eroded ten times, while in Erosion 2, it is eroded once. After each erosion, existing holes in the foreground are filled again (Hole Filling 2 and 3) to ensure that a larger impact can be recognized as such.
In step 2—Processing Phase—the two resulting images of Hole Filling 3 are further processed in sequence A and sequence B. In sequence A, connected impacts can automatically be separated from each other (Impact Separation). For the separation, a labeling (Labeled Image) is used at first, then a distance calculation of foreground to background pixels (Distance Image), which is supplemented by a watershed transformation, is carried out and finally a new labeled image (Separated Labeled Image) is calculated. In sequence B, the contours of impacts are calculated with a contour tracking code (Contour Detection). The images of sequence A and sequence B are then merged to create a combined image of separated impacts and optimized contours (Combination Impact Separation and Contour Detection). The combined image is created by adding the separation lines of the Separated Labeled Image step to the Contour Detection image. In this context, contours identified in the Pre-Processing Phase serve as a hard boundary between the foreground and background and are used for the calculation of the centers of gravity for each impact (Centers of Gravity).
5.1. Step 1—Pre-Processing Phase
This section describes the Pre-Processing Phase mathematically. It is introduced by binarization. In general, binarization in combination with a correct threshold leads to a good extraction of an impact in an image. In this case, an automatically determined threshold value
t is calculated by Nobuyuki’s OTSU method [
24], which delivers usable results even with slight variations in image brightness. The OTSU method used is defined by the following scheme [
25]:
where ω
1(
t) and ω
2(
t) are the probabilities that a pixel is identified as foreground or background, while
(
t) and
(
t) are the variances in the pixel intensities in the foreground and background. After applying the thresholding method, a binary image
consists of foreground and background areas incorporating holes, which are then filled through a modified flood fill algorithm. The flood fill algorithm is based on matching neighboring pixels by changing each background pixel found in a hole to a foreground pixel [
26]. The modified flood fill algorithm consists of a recursive approach instead of an iterative approach, which stores colored neighbor pixels by a stack [
27]. In this way, no pixel is checked and filled multiple times, which saves computing time. The steps of the modified flood fill algorithm are described in Algorithm 1.
| Algorithm 1. The steps of the modified flood fill. |
Initialization—choosing a background pixel = of the image as the starting point and creating a foreground color-filled pixel mask in the same shape as the image. Creating an empty stack and adding the starting point onto the stack. Iterating while the stack is not empty: - a.
Storing the first element of the stack as = ; - b.
Removing the top element from the stack; - c.
Checking if is within the image boundaries and has a background color; - d.
If yes: - i.
Setting . - ii.
Adding the four neighbor pixels to the stack:
Setting —end.
|
After holes are filled, contours of impacts are tracked. The retrieval method from Suzuki and Abe [
28] is used for contour tracking. This method identifies contour points of an object by searching for a foreground pixel with a value of 1 first. Once found, the algorithm checks the 8 neighboring pixels counterclockwise and follows object pixels until the edge of an object is reached. At this point, the contour pixel is stored and the retrieval method continues checking neighboring pixels, follows edge pixels found counterclockwise, and stores them in a list. The algorithm stops when it reaches the first edge pixel again. All the edge pixels found correspond to the contour points that form a polygon and represent the object’s contour. This process is repeated recursively for all object pixels found until there are no more object pixels left to be examined. The results of the retrieval method are used to determine the impact area.
Subsequently, small impacts with an area lower than 100 px, approximately corresponding to an impact with an 6 µm diameter are removed from the contour due to a low image resolution and the limitation of recycling methods, which are, in general, limited to spot sizes larger than 10 µm [
18].
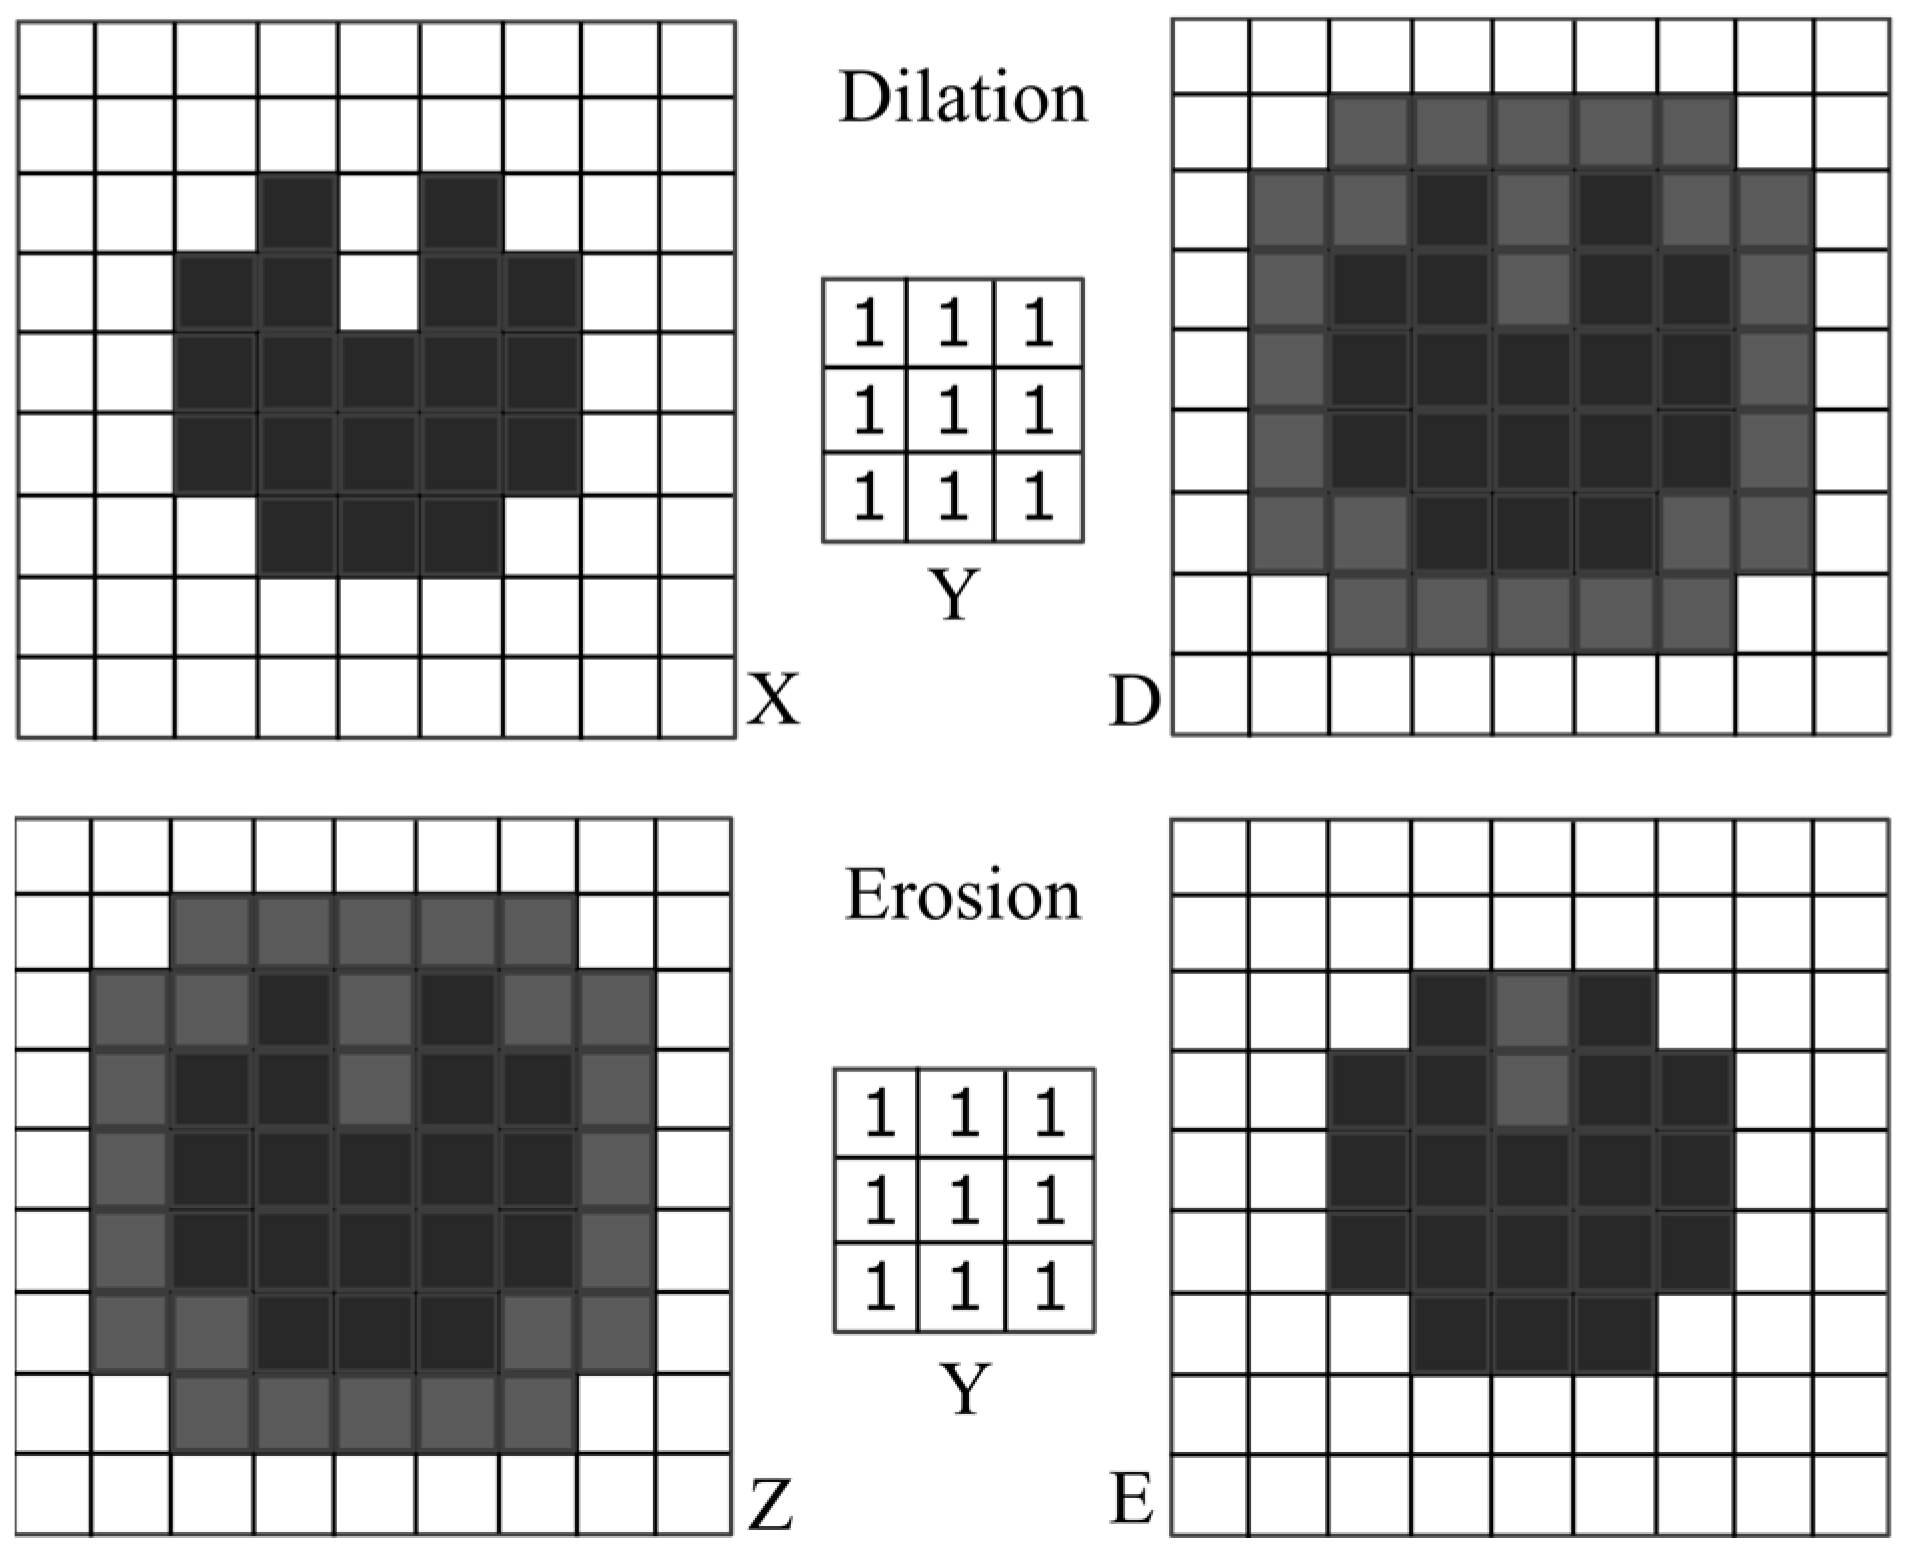
From here, two different images are created, which continue being processed in sequences A and B. Dilation D and Erosion E belong to the morphological operators and optimize the shape of the impacts (
Figure 9).
With both operators, a structural element
Y is moved over the image
X(
x,
y) or
Z(
x,
y) [
29]. The size of structural element
Y should be in relation to the shape of the image to be processed. In traditional image processing, the size of the structural element
Y and the number of repetitions for filters are usually determined experimentally to find the best configuration. A smaller structural element
Y (e.g., 3 × 3 or 5 × 5) is suitable for small details or fine structures. For larger objects or areas, on the other hand, a larger structural element
Y is recommended (e.g., 7 × 7 or 9 × 9). Most structural elements
Y are square (e.g., 3 × 3, 5 × 5, 7 × 7), but asymmetrical structural elements
Y (e.g., 3 × 5) are also possible. The dilation is based on the Minkowski addition:
The image
D(
x,
y) is therefore a union of the set
Y of all displacements from the structural element
Y +
x, where the translation vectors
x come from the image
X(
x,
y). The erosion is calculated according to the Minkowski subtraction:
It results in the foreground picture
Z(
x,
y) being reduced again. In this context, the subtraction is not an inversion of the addition, as illustrated in
Figure 9; here,
X(
x,
y) ≠
E(
x,
y).
5.2. Step 2—Processing Phase
This section describes the Processing Phase mathematically, which receives images with filled holes from the Pre-Processing Phase in sequences A and B. The resulting images can be used for the separation of connected components or contours. The contours are calculated using “Suzuki’s and Abe’s approach” [
28] again, which has already been described in
Section 5.1. The separation of connected impacts is reached through a combination of distance images
D*(
x,
y) and a watershed transformation. For the calculation of the distance image
D*(
x,
y), the Euclidean distance transformation is used, which calculates the smallest Euclidean distance d to the background pixel b within its 8 neighboring pixels and assigns it to each foreground pixel f [
30].
To separate the impacts, Beucher’s [
31] watershed transformation is applied to the distance image
D*(
x,
y), shown in false color in
Figure 7. It interprets the Euclidean distances d in the distance image
D*(
x,
y) and can be symbolically regarded as a “mountain landscape” [
30], whereas the distance value d indicates the height of the mountain range. The watershed transformation then symbolically floods the valleys (local minima) with water, starting from the minimum [
30,
32,
33]. When two filled valleys meet, a “dam” is built. This dam is called the watershed and acts as an impact boundary. As soon as the entire image is filled, the algorithm ends [
30] and the resulting impacts are separated from each other.


