Abstract
The valorization technique successfully transformed waste polyethylene terephthalate (PET) into valuable carbon nanomaterial (CN)/graphene, while doped and undoped ZnO nanopowders were synthesized via sol–gel methods. Utilizing XRD, BET, TEM, EDX, FTIR, and TGA analyses, the synthesis of sp2 2D sheet, pristine, and doped ZnO nanostructures was confirmed. Solid-state gas sensor devices, tested under 51% relative humidity (RH), 30 °C ambient temperature, and 0.2 flow rate, exhibited a 3.4% enhanced response to H2 gas compared to CO2 at 50 ppm concentrations over time. Notably, the ZnO/CN sensor surpassed CN and ZnO alone, attributed to CN dopant integration with decreasing order of response performance as ZnO/CN > CN > ZnO. This study underscores the efficacy of valorization techniques in generating high-value carbon nanomaterials and their efficacy in bolstering gas sensor performance, with ZnO/CN demonstrating superior response capabilities.
1. Introduction
Plastics are complex synthetic organic polymers created from fossil monomers and obtained from natural gas or crude oil. Plastics, which form a major constituent of municipal solid waste, are characterized by relatively versatile usefulness, chemical stability, longevity, and convenience features as embraced by the modern economic trend [1,2,3]. Their widespread use in products like pipes, frames, and packaging films has led to a surge in plastic consumption in recent decades. However, the durability and resistance to biodegradation of plastics mean they persist in the environment for years after disposal, contributing to a growing environmental challenge [4,5,6]. A typical municipal-generated solid waste contains approximately 42% of all single-used, non-fibrous waste plastics, that is, polypropylene (PP), polyethene terephthalate (PET), and polyethylene (PE) [7,8,9,10,11,12]. The inability to manage these waste plastics causes environmental nuisances on arable lands, water bodies, and the ecosystem as a whole [7,13,14,15]. PET, a widely used plastic, stands out due to its relatively high density (1.33 kg/m3), second to polyvinyl chloride (PVC), which increases its recyclability. It has proven to be an affordable and suitable material precursor for carbonaceous dopants/adsorbents, essential for modern technology [8]. Several studies in the literature have reported PET as an excellent option for upcycling into various beneficial substances, including liquid and gaseous fuels, as well as carbon-based compounds like activated carbon and carbon microspheres [16]. Carbon can be an additive in material synthesis, considering its tunable features and enormous benefits [17,18]. Graphene remains one of the unique carbon derivatives that could be obtained as an upcycled product from PET [19]. As a sp2 hybridized two-dimensional (2D) carbon monolayer, its high electrical and thermal conductivity, wider surface area, stability, and exceptional mechanical strength make it a priority option and a valuable carbon material for doping purposes [20,21,22,23,24,25].
Meanwhile, the continuous discharge of pollutants from anthropogenic operations into the environment keeps degrading air quality globally [26,27]. These pollutants, whether in gaseous, solid, or liquid form, pose significant health risks, leading to respiratory and neurological disorders [28,29,30]. Extreme concentrations of pollutants such as NOx, O3, CO, and PM have been known to cause inflammation, conjunctivitis, and irritation of the human eyes [31,32]. Carbon dioxide (CO2) has found extensive applications in the chemical industry, medicines, food packaging (5–100%), wastewater treatment, and other fields [33]. Despite the non-toxicity of carbon dioxide, it can, however, be lethal or cause severe health issues such as breathing difficulty, headaches, or dizziness in its high concentrations within an enclosed space [34]. In indoor spaces, its abundance displaces oxygen, thereby causing death through asphyxiation [35]. CO2 is a major cause of climate change through its global warming potential [36,37]. Hydrogen (H2) gas remains one of the most useful gases due to its wide environmental applications. In civil and industrial fields, for instance, colorless or odorless hydrogen forms a major component of mine gas used for fueling purposes and as a feedstock [38,39]. Nevertheless, the presence of approximately 4–75% H2 in the air can result in an explosion that can affect processes, properties, lives, and the environment entirely. H2 also remains a major threat, considering that its flashpoint is as low as 0.02 mJ. CO2 and H2 sensing have, therefore, become imperative considering the global safety and climate demands [38,40]. That is, air quality degradation is hardly detected by the human senses beyond limited thresholds; hence, higher exposure to these odorless gases becomes difficult to detect and detrimental as the human body may develop signs of poisoning such as breathing difficulties, increased pulse rate, and sweating [37,41]. Sensitive and high-performing gas sensing devices are needed to sense harmful gases and vapors precisely at extremely low concentrations.
Metal oxide semiconductors (MOSs) have proven to be good for wider environmental applications, including antimicrobial inactivation, photocatalysis, and sensing of redox gases due to their electrical conductivity. Chemiresistive-based MOS sensors have gained much research interest as their gas-sensing mechanism is simpler [34,39]. The chemical adsorptive and electronegative O2 molecules withdraw electrons from the conduction band of the MOS, leading to the creation of a depletion region. However, the presence of analyte gases breaks the boundary for easy electrical conductivity. Band gap and activation energy control techniques have been widely investigated by several studies to control or tune the resistivity feature of MOS for advanced gas sensing [42,43]. MOS-based gas sensors with low activation energy and wide band gaps are good; however, low band gap MOS are generally advantageous for gas sensors in room temperature environments [44,45]. Metal oxides such as ZnO, In2O, WO3, and TiO2-based sensors have gained much interest among metal oxide semiconductor gas sensors due to their non-toxicity, affordability, and chemical stability [46,47,48]. ZnO has proven to function effectively in ambient environments given a band gap range (2.72–4.37 eV) and an exciton binding energy of 60 meV [39,49].
In this study, carbon nanomaterial (CN)/graphene is synthesized via a pyrolytic approach [50,51] as a dopant to offset drawbacks that impede the easy mobility of electrons and low sensitivity in Chemiresistive-based MOS gas sensors. ZnO nanopowders are studied due to their non-toxicity, electron abundance, and chemical stability. Sol–gel, a wet synthesis technique, was adopted in this study due to its ability to produce ultrafine and homogenous nanopowders on a larger scale. Moreover, it is a cheaper and less energy-intensive synthesis approach [52]. CN-doped and undoped ZnO nanopowders will be analyzed to assess the dopant effect on the response of the fabricated sensor devices.
2. Results and Discussion
2.1. Yield of Carbon Nanomaterial
Thermal degradation of hydrocarbons leads to the C–C and C–H bonds emitting gases while forming solid charred carbon. Hydrogen, water vapor, and other gaseous hydrocarbons within the pyrolytic chamber served as reductants to maintain the carbon in the solid or charred condition [53,54]. The obtained 30.02% CN yield was used as the dopant precursor.
2.2. Material Characterization
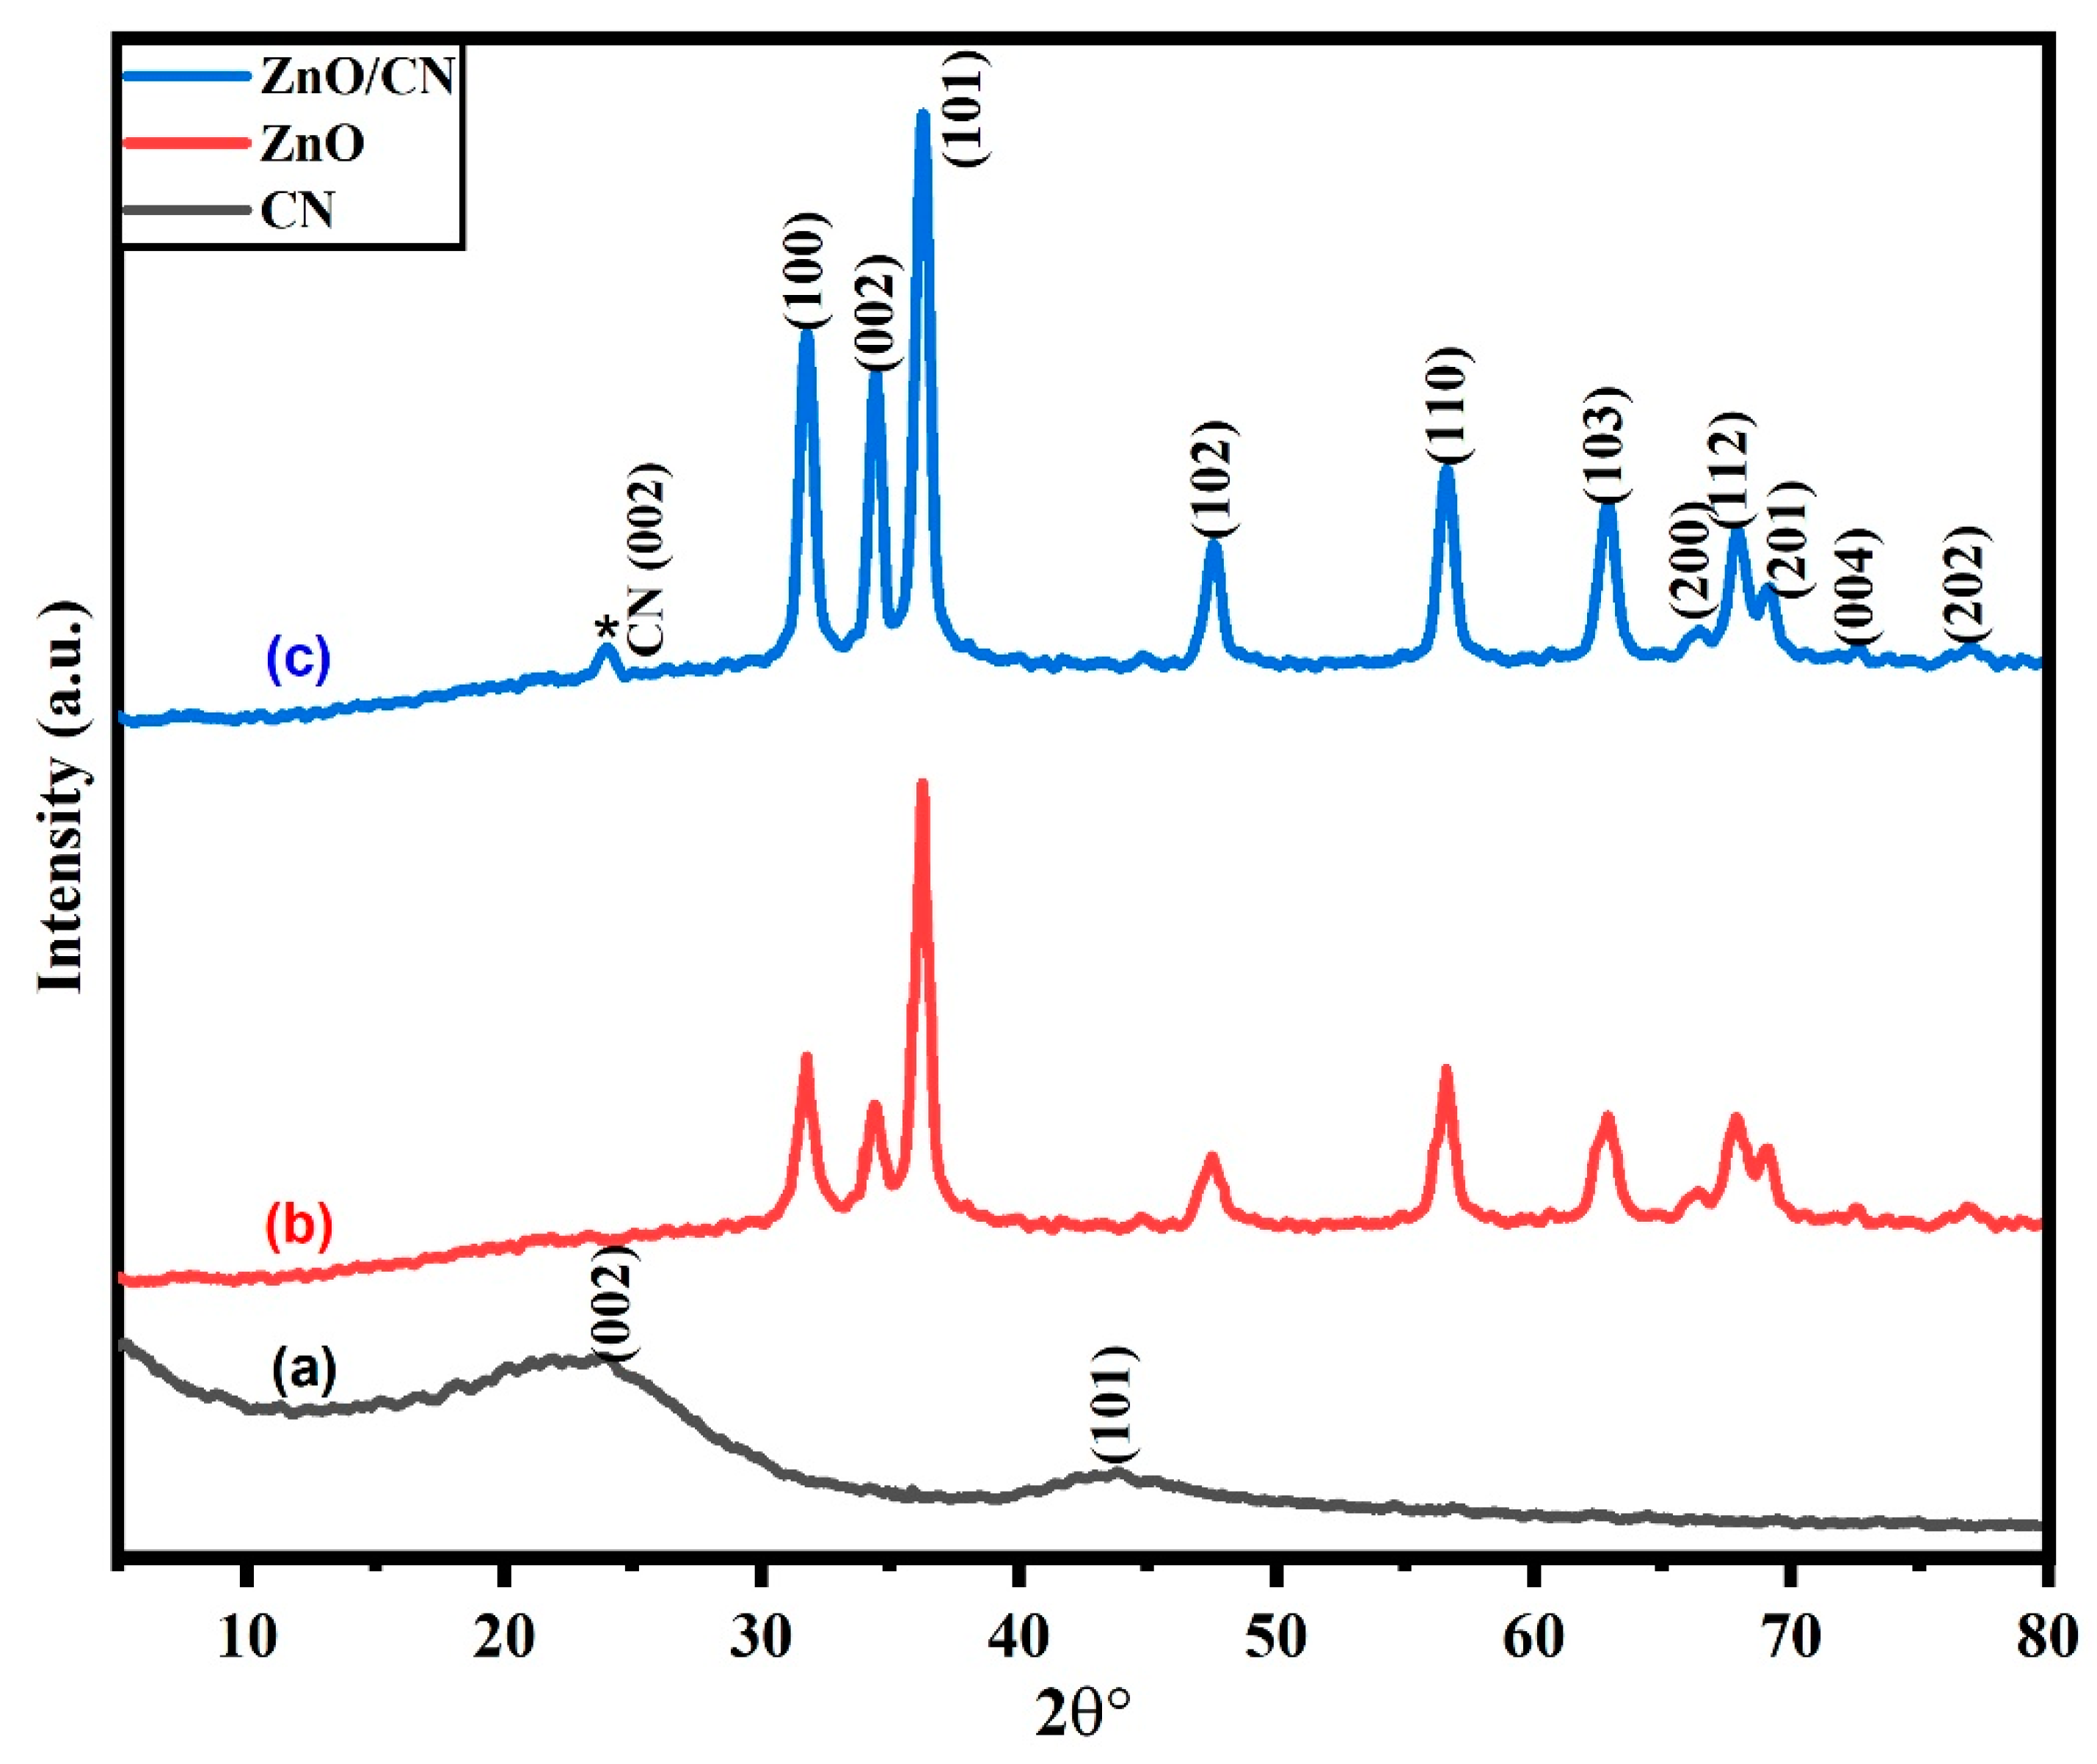
Crystallographic analysis. As shown in Figure 1a, JCPDS card no. 87-1526 [13], the synthesized CN exhibited diffraction peaks at 24.09° and 43.92° 2 with (002) and (101) correspondences of graphene planes, respectively. The broad interlinear spacing for the plane (002) is 3.71. This is ascribed to amorphous graphene, which frequently exhibits a greater interlinear spacing between the graphene sheets than is seen in the crystalline structure of graphite (3.44–3.55). According to Hussin et al. [10], the amorphous feature of the CN results from the sp2 bonding of all carbon atoms or the hexagonal planar units introduced by O2, which disturbs any pattern within the graphitic plane. Peak (101) shows firmly bound hybridized carbon atoms and parallel two-dimensional graphene-layered stacks stacked hexagonally in a translational order. The synthesized doped and undoped ZnO nanopowders showed diffraction patterns structured as wurtzite with a crystalline hexagonal phase and JCPDS card no. 01-089-0138 [37]. The observable sharp peaks imply high crystallinity. None of the peaks could be attributed to impurities in the nanopowders. Figure 1b depicts a characteristic pattern of undoped ZnO nanopowder. There are no peak traces of CN in the undoped ZnO. However, post-doping with CN (*) results in very small but relevant peak diffraction occurring at 23.9° Figure 1c. There were no traces of impurities in the synthesized nanopowders.

Figure 1.
XRD pattern of synthesized (a) CN; (b) ZnO; (c) ZnO/CN.
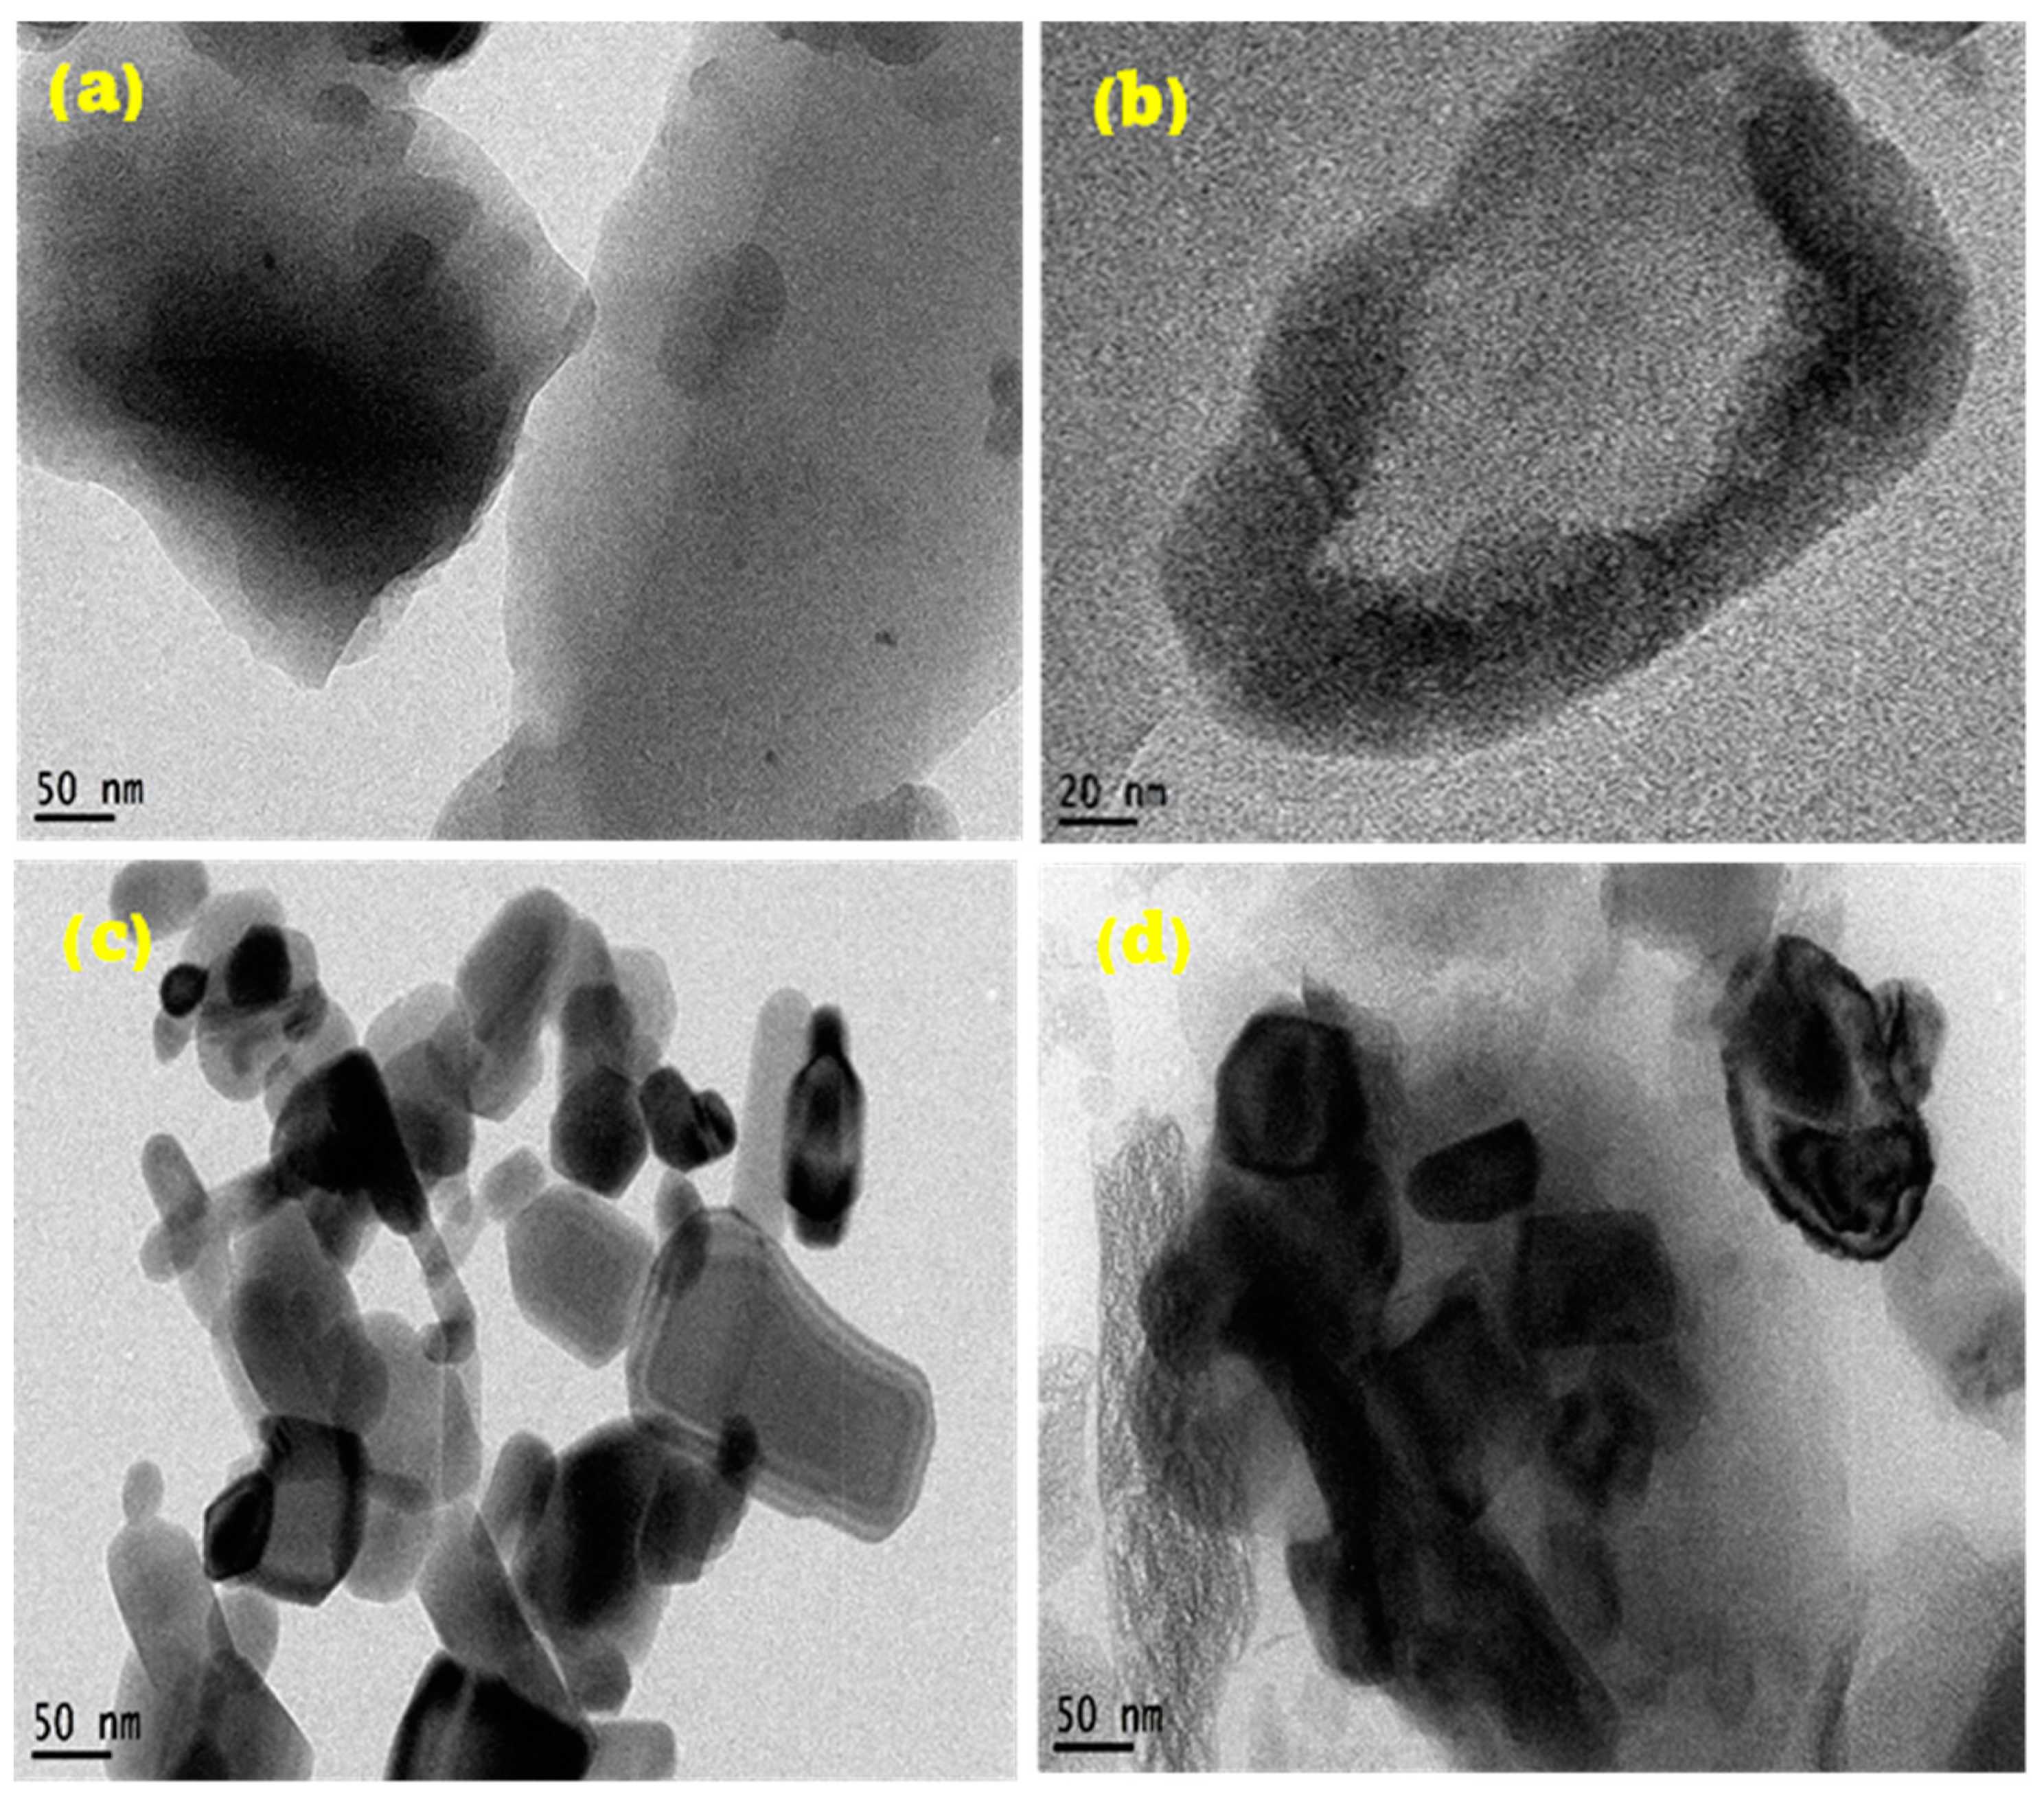
TEM analysis of samples. The TEM micrograph of the CN depicts two-dimensional layered sheets of graphene, as shown in Figure 2a, with enhanced magnification depicted in Figure 2b. This shows that the synthesized nanomaterial is monolayer graphene. Figure 2a further indicates an enhanced graphitization of the PET material given the residence time of pyrolysis and set temperature. The carbon sheets show slight agglomeration in the dark region due to the autogenic pressure at 700 °C. Figure 2c,d illustrates synthesized ZnO nanoparticles, both doped and undoped. The morphological structure of Figure 3c depicts highly crystalline hexagonal wurtzite as it aligns with the XRD crystallographic patterns shown in Figure 1. The introduction of 5 wt% dopant material (CN) has been attributed to the creation of relatively more pore sizes within the lattice sites of the undoped ZnO nanopowder, evidenced in Figure 1b. The absence of impurities signifies the synthesis of pure materials. Dark areas (spots) within the impregnated ZnO nanomaterial (Figure 2d) depict homogeneously doped hexagonal wurtzite structures, with the dark spots indicating CN. The white areas (region) reflect the ZnO nanoparticles. The adsorption–desorption processes are greatly influenced by the characteristic features (tunable pore sizes, wider surface area) of the synthesized CN dopant material. The average particle size distribution, as depicted in Figure 2e–g, demonstrates synthesized nanostructures with mean sizes of 50.60 nm, 30.62 nm, and 34.94 nm for CN, ZnO, and ZnO/CN, respectively, using the ImageJ software (version 1.54).

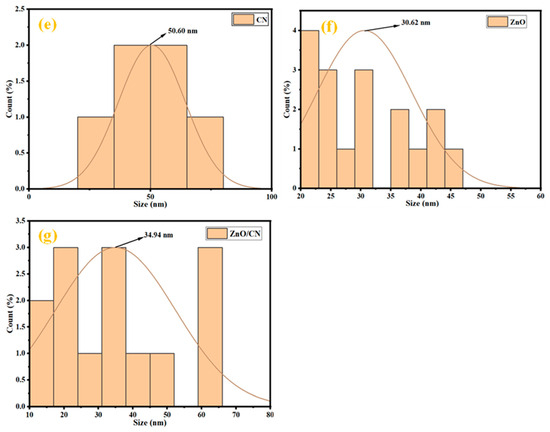
Figure 2.
TEM micrographs and particle size distribution (a,b,e) CN; (c,f) ZnO; (d,g) ZnO/CN.

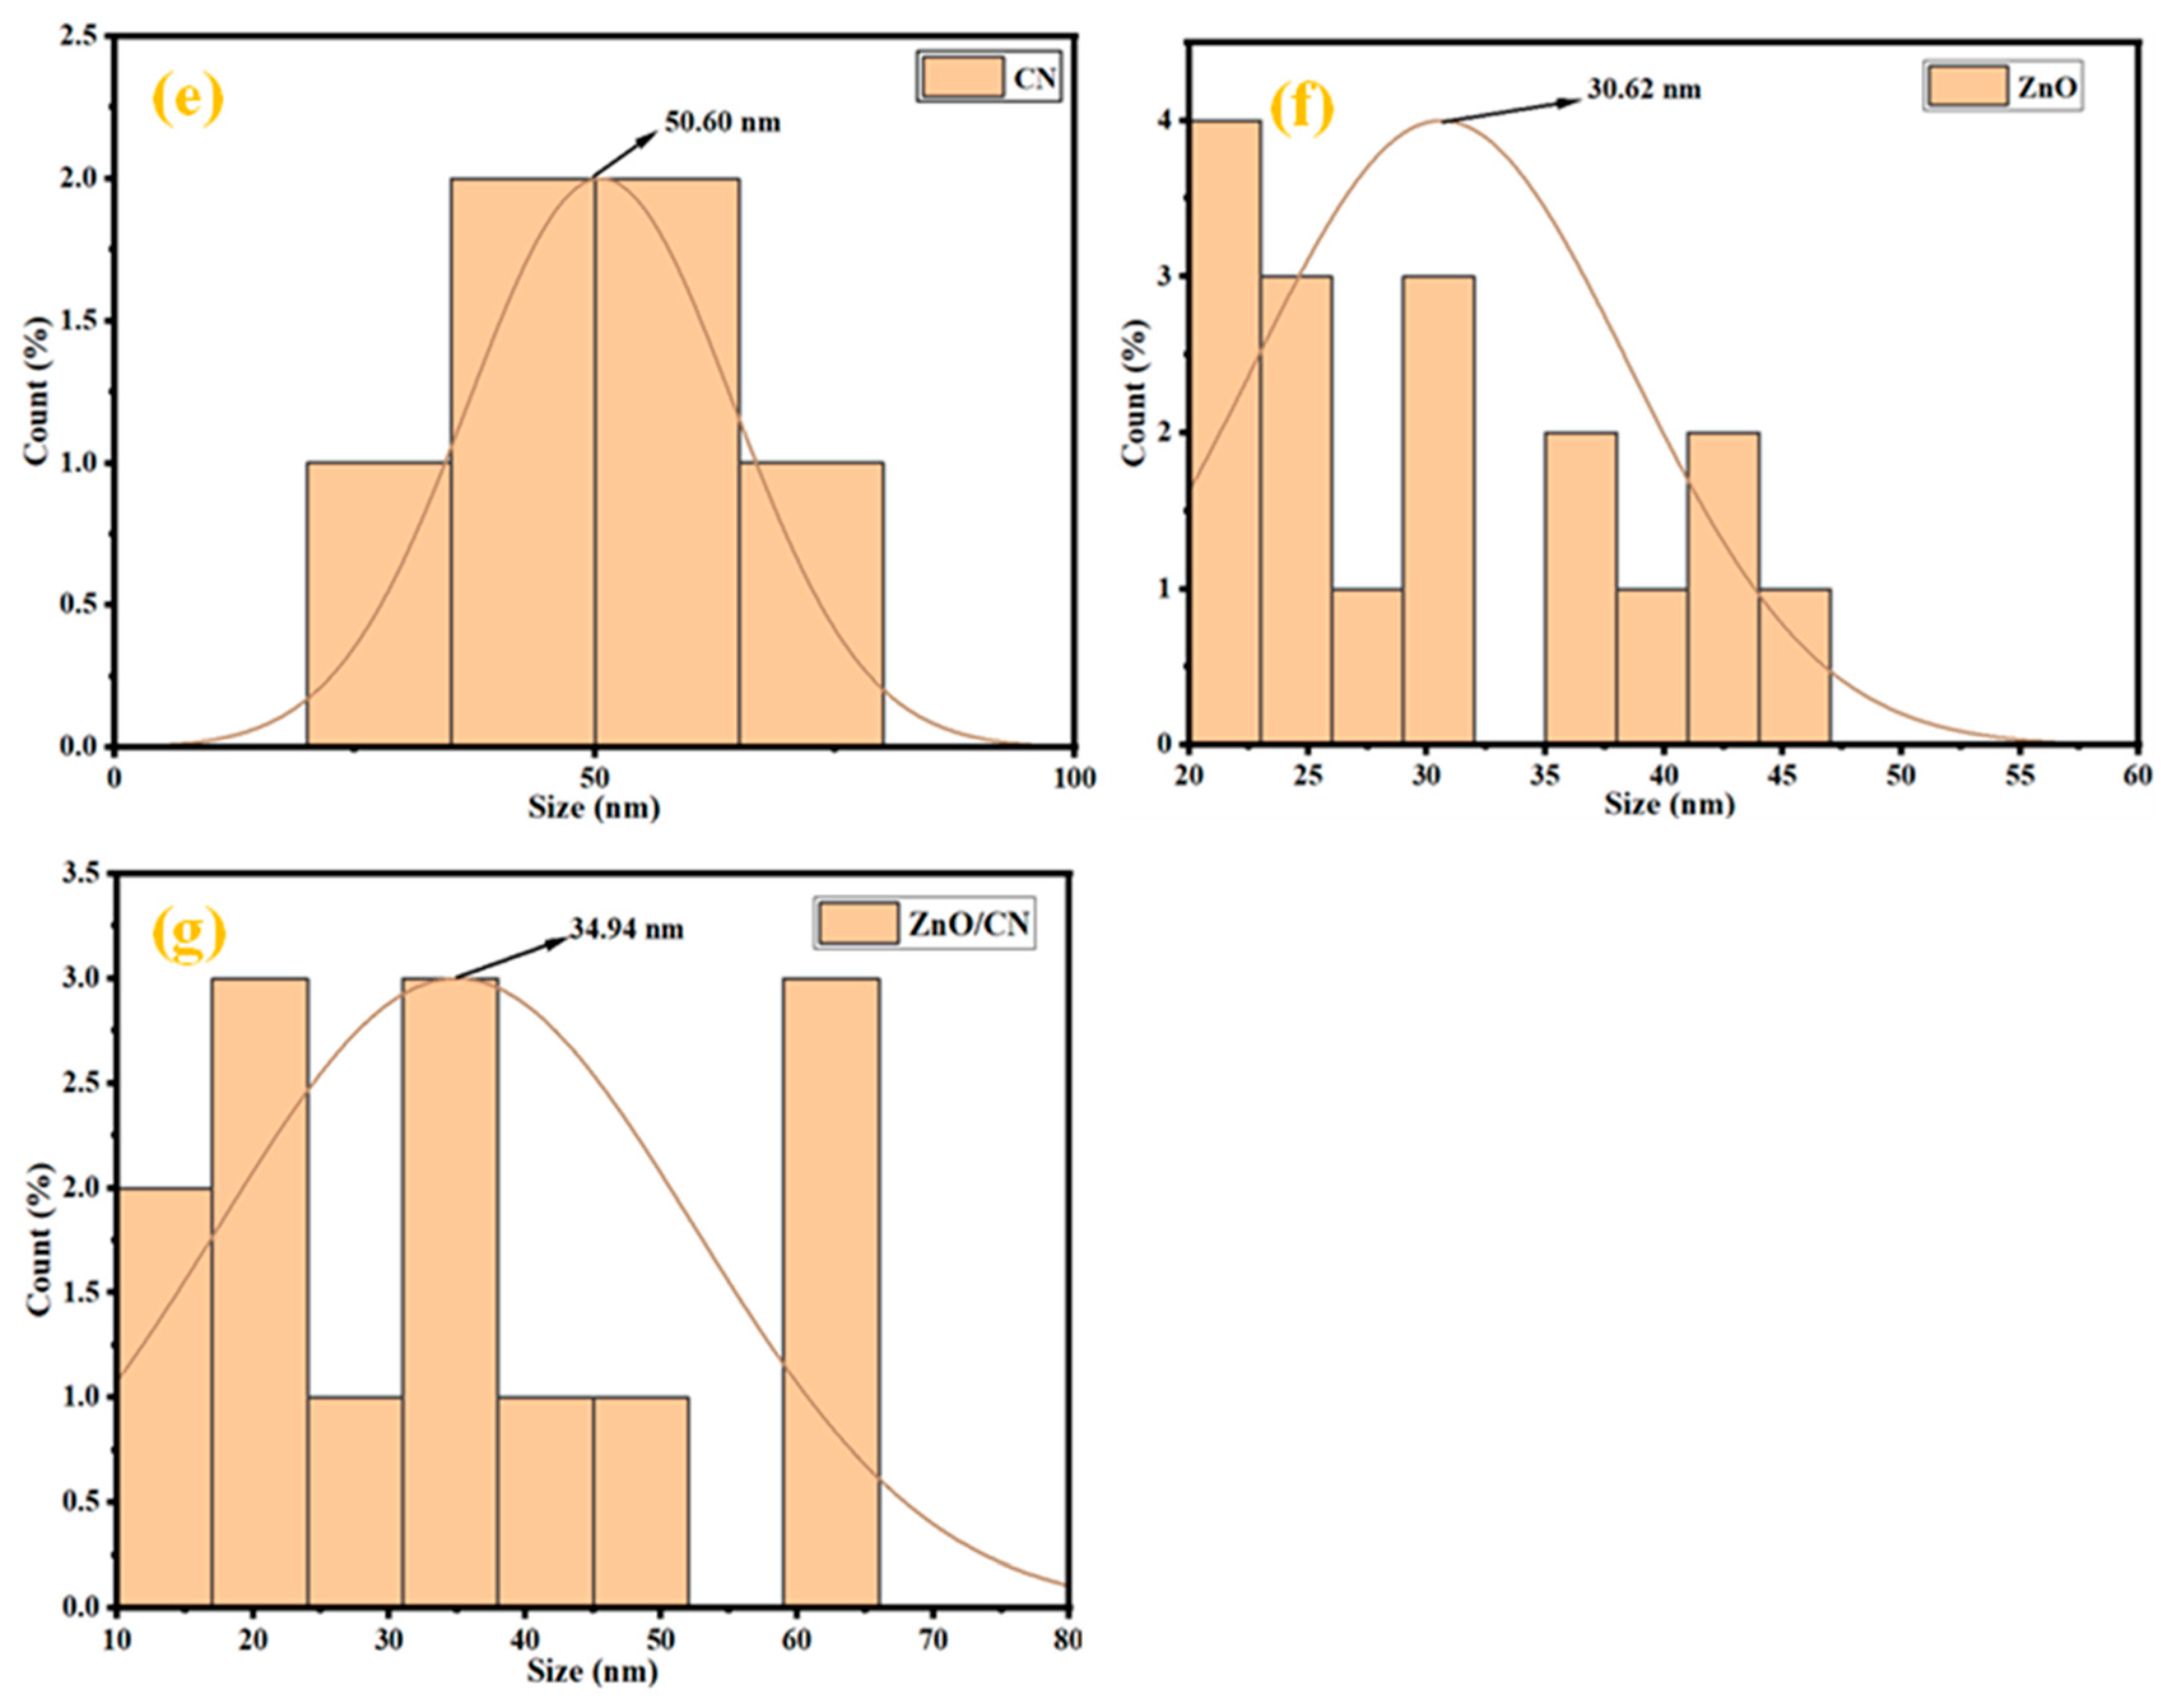
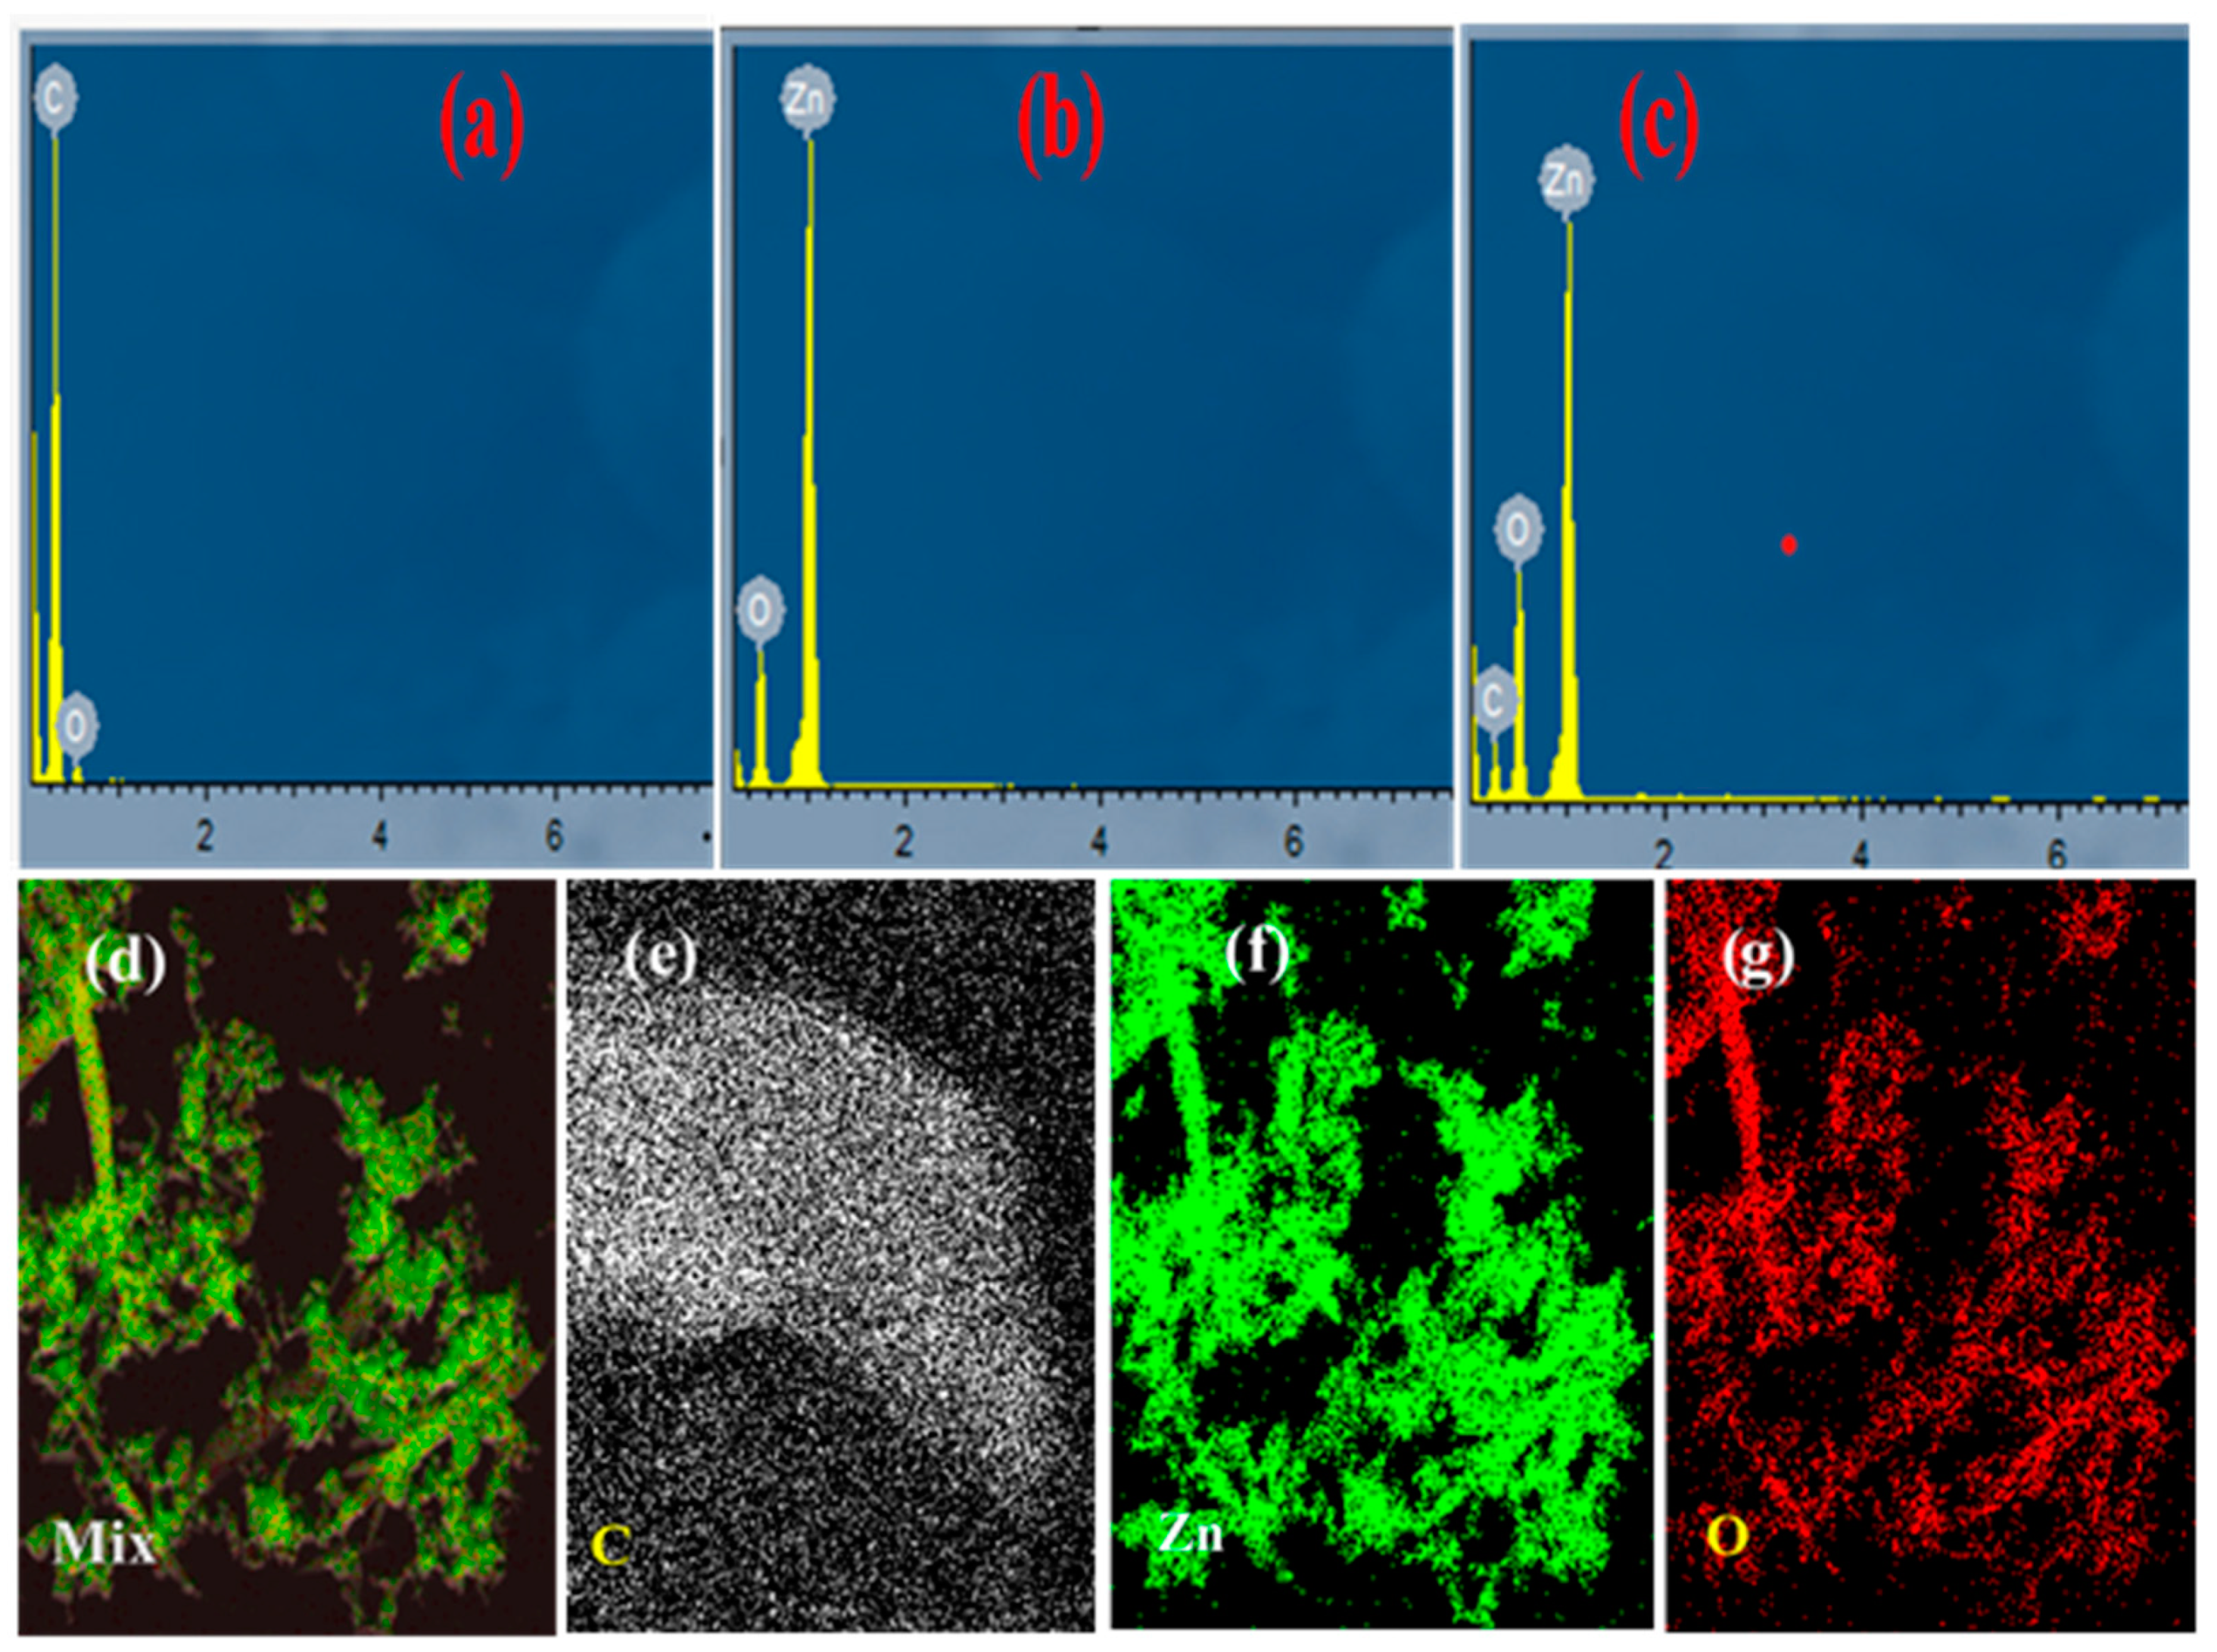
Figure 3.
EDX elemental data of (a) CN; (b) ZnO; (c) ZnO/CN; and HAADF (d–g).
Elemental analysis of samples. The elemental quantification of the synthesized nanopowders is depicted in Figure 3. According to the EDX analysis, the synthesized CN (Figure 3a) depicted high carbon content formation. Carbon (C) accounted for 98.15%, with traces of oxygen (O) at 1.85%. Figure 3b shows an oxygen and zinc nano-composition with 11.78 and 88.22 peaks, respectively. In Figure 3c, 4.46% carbon quantification is evident in successful doping and nanocomposite formation. The O2 (14.31%) and Zn (81.23%) respective composition reductions depict the successful incorporation of carbon into the lattice sites of the zinc oxide compound. No known impurities were found after a thorough search depicting the production of highly pure CN from the thermolyzed waste PET. Moreover, the high-angle angular annular dark field (HAADF) images (Figure 3d–g) depict structural features and the corresponding homogeneous distribution of respective elements within the prepared nanopowders at the atomic scale.
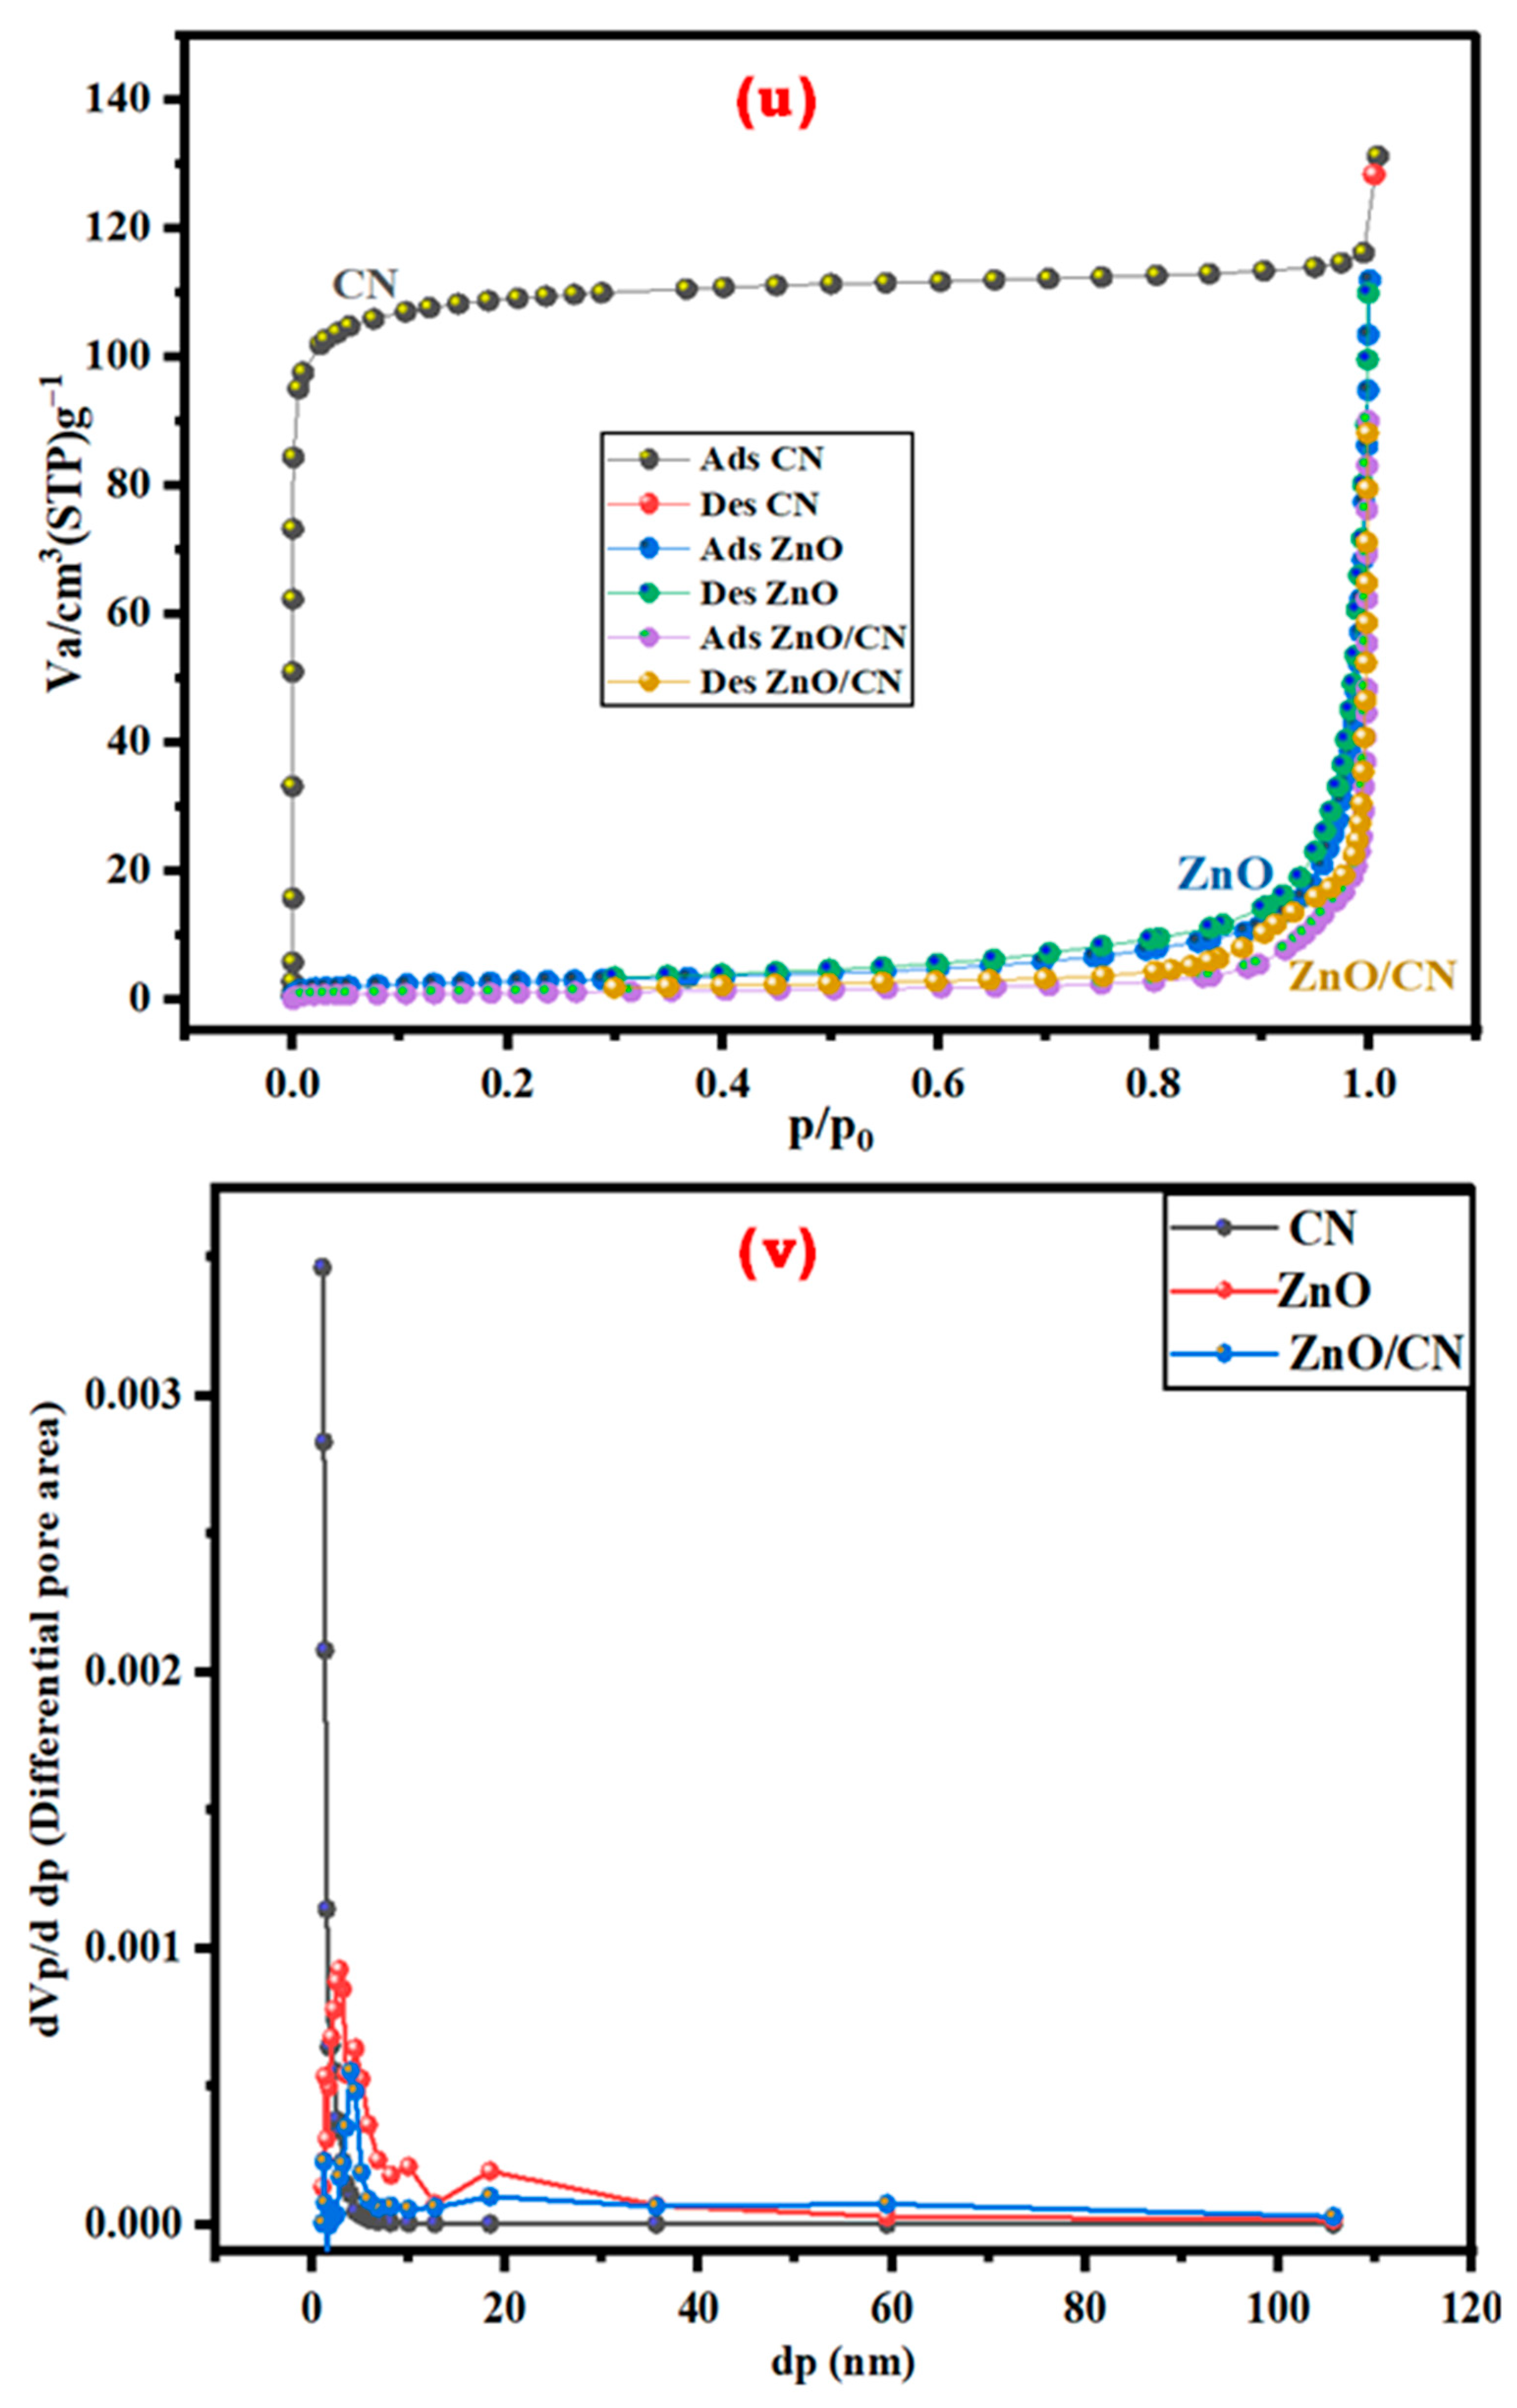
Textural properties of nanopowders: The textural, specific surface areas and porousness of the synthesized nanopowders were investigated by N2 adsorption–desorption isotherm studies. The hysteresis loops, according to Figure 4u (CN, ZnO, ZnO/CN), signify the presence of type-I and type-III isotherms, respectively, according to the International Union of Pure and Applied Chemistry (IUPAC) classified isotherms. The CN-N2 microporous surface morphological adsorption is characterized by a stable and high relative pressure depicting Langmuir/type I isotherm with an approximately 1.94 nm average pore diameter dominance [12,38]. The ZnO and ZnO/CN nanopowders denote mesoporous type-III isotherm properties with comparatively bigger adsorbate–adsorbate interaction to adsorbate–sorbent interaction, according to Table 1. The pore distribution of the doped and undoped ZnO nanopowders depicts the presence of mainly less than 40 nm pore sizes. Table 1 provides a summary of the BET surface area, mean pore diameter, and total pore volume properties of the nanopowders. The reduced BET surface area and pore volume (3.59 m2g−1 and 0.03 cm3g−1, respectively) of the ZnO/CN composite can be attributed to the CN-doping effect, which fills the pore spaces of the ZnO precursor. Figure 4v depicts pore size distributions of the prepared nanomaterials ranging from approximately 1 to 40 nm. This confirms the fairly distributed textural pore features of the nanopowders [10,55,56].
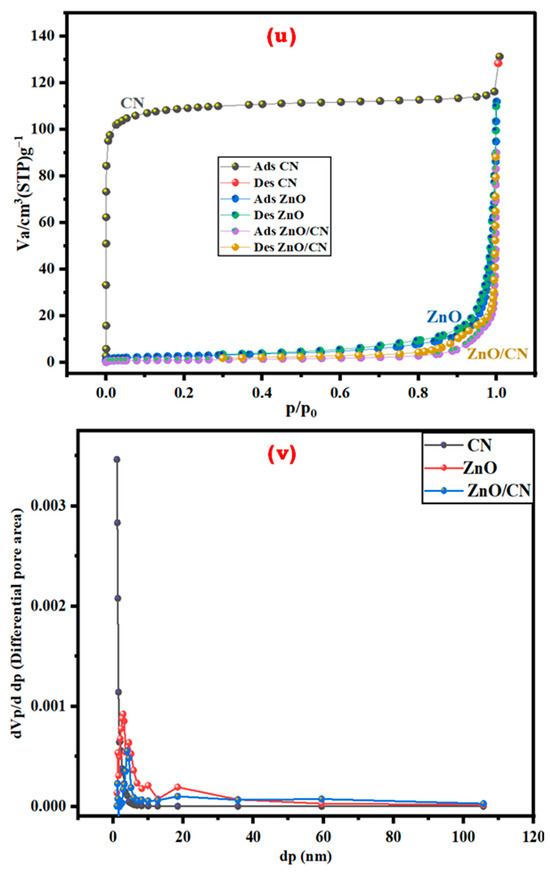
Figure 4.
N2 adsorption–desorption: (u) isotherm; (v) pore volume distribution.

Table 1.
Textural analysis of synthesized nanopowders.
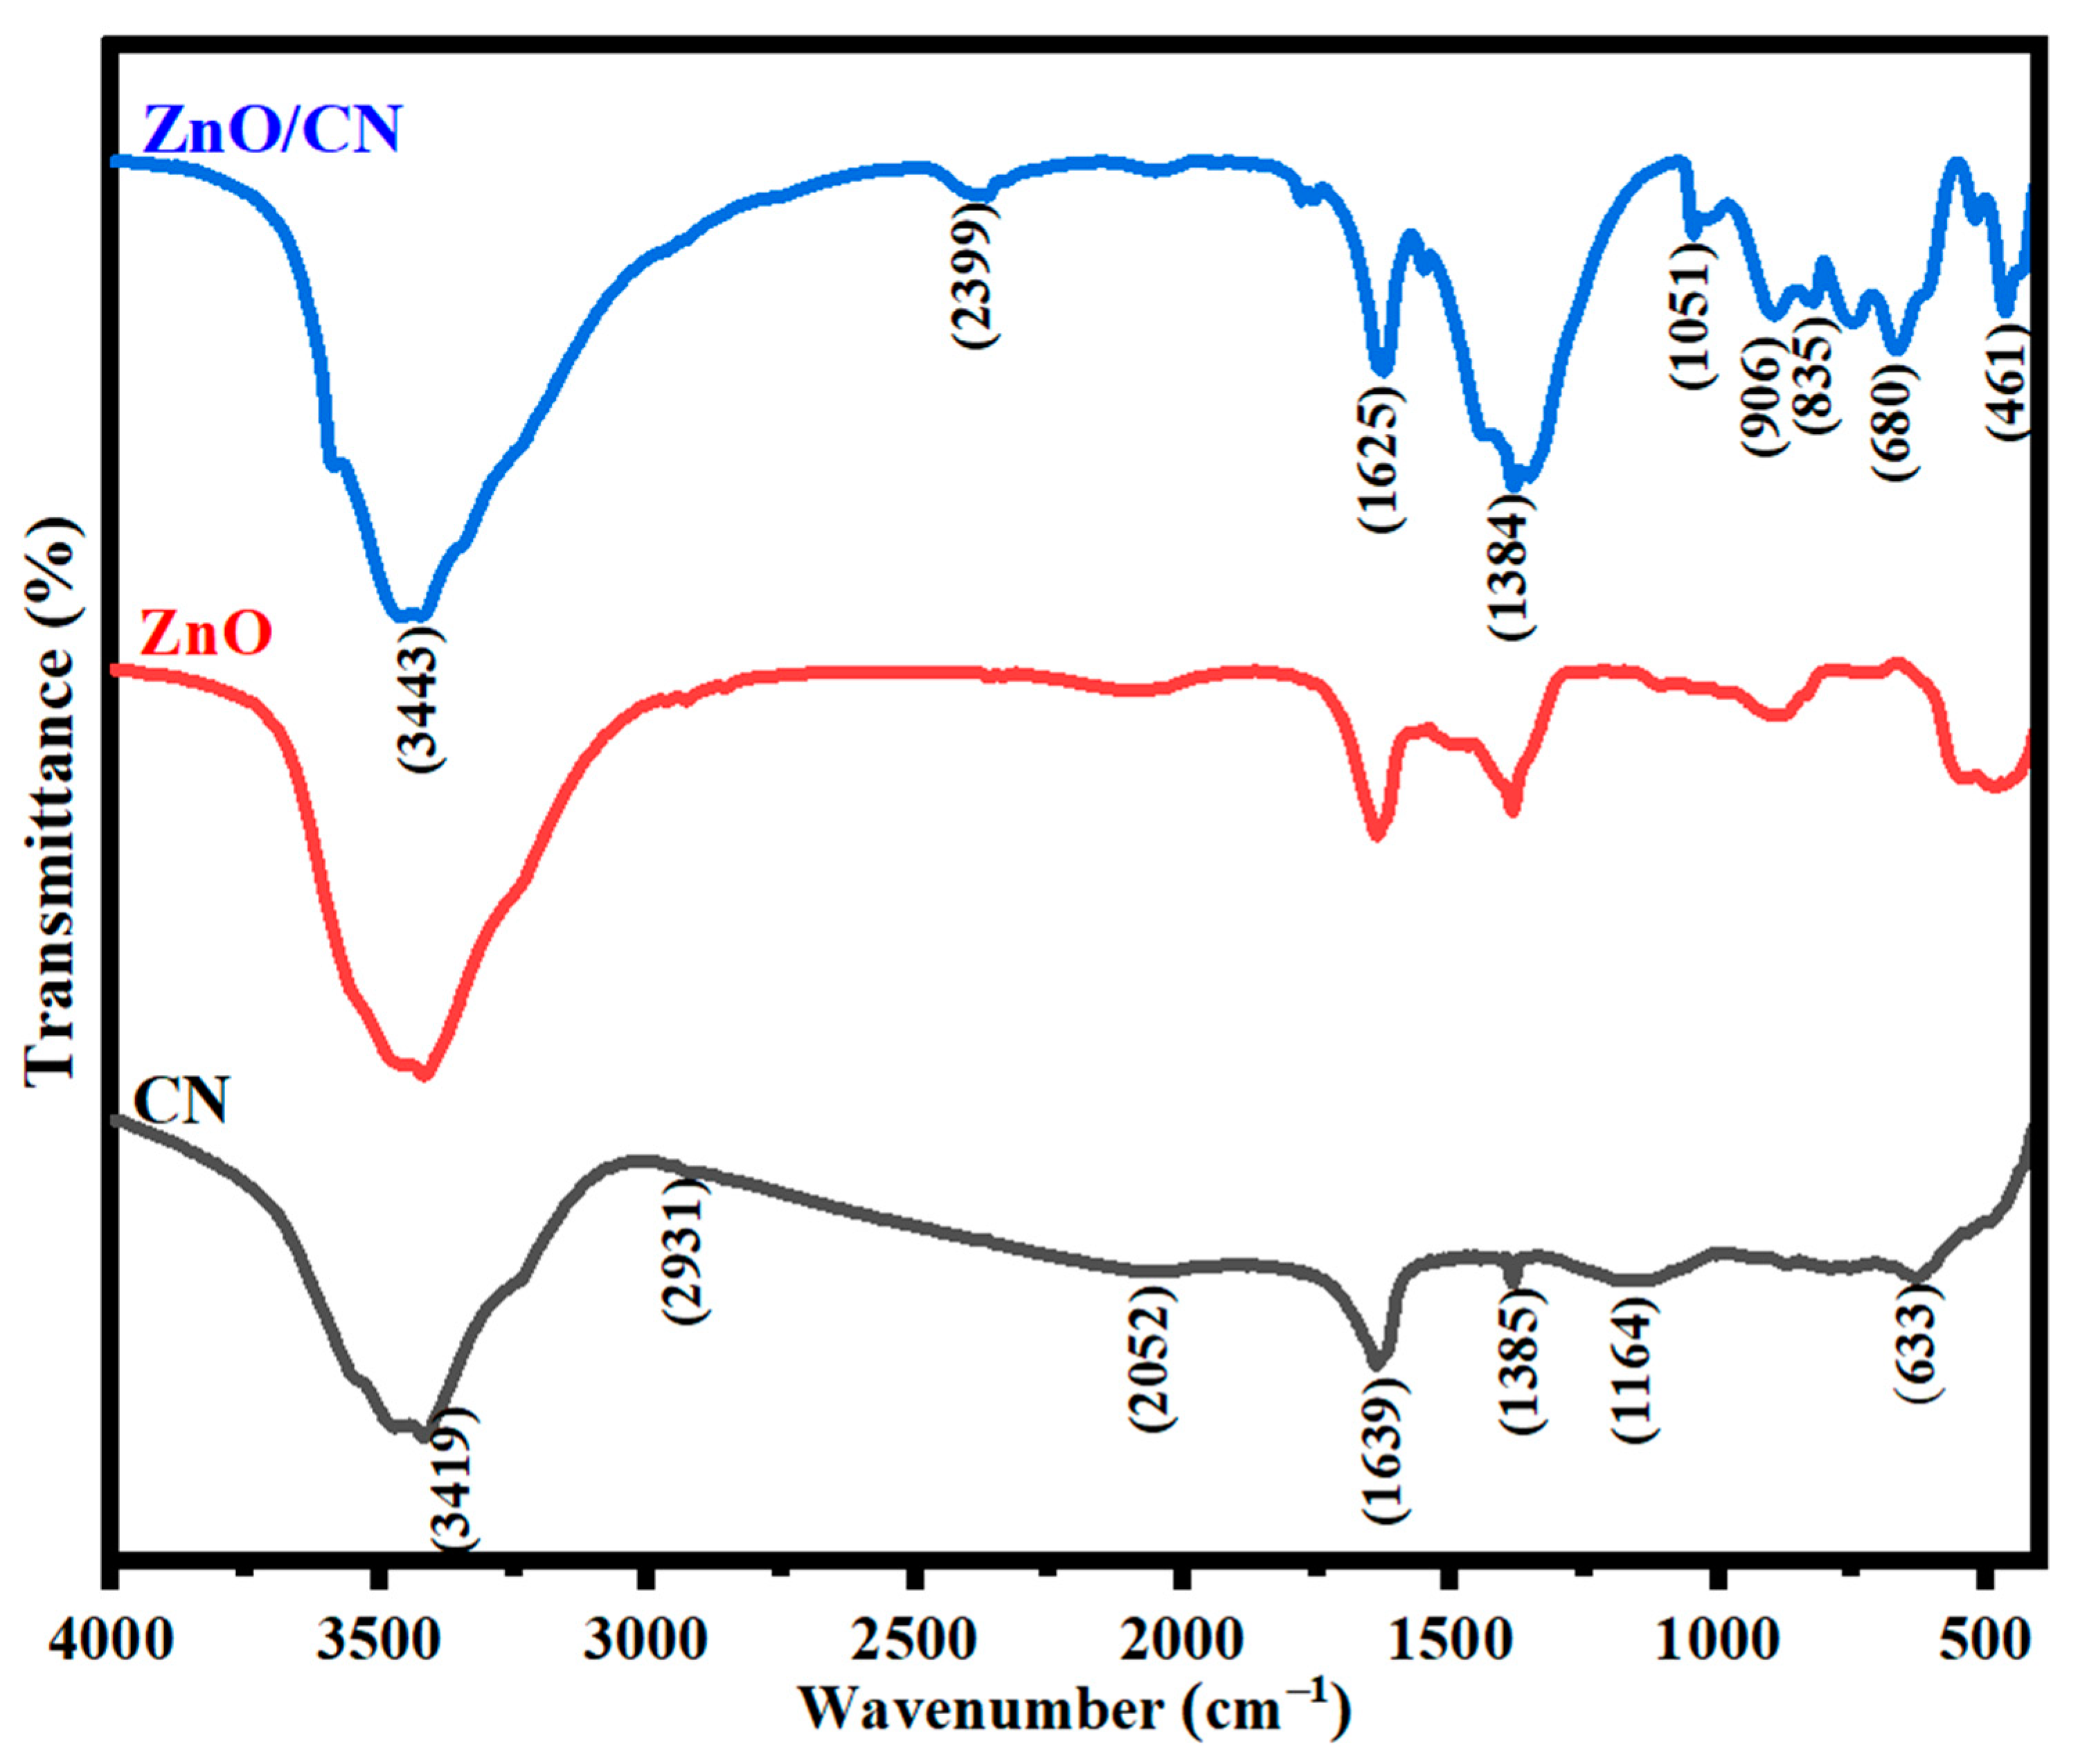
FTIR analysis. The relevant functional groups in Figure 5 indicate the surface molecular vibrations of CN. The C=C aromatic rings stretch accounts for a peak of 1639 cm−1. This is attributed to the CN’s intrinsic feature of sp2 graphitic carbon. Molecular hydrogen bonding from the polymeric compounds is what causes the stretching vibrations in the O-H group at peak 3419. Hydrogen removal during PET pyrolysis can be confirmed by the uniform and nonuniform single-bond stretching of the C–H groups. The bond stretches C–O, C=O, COOH, and C–H signify the respective peaks 1164, 1385, 2052, and 2931 cm−1 [57]. Additional spectra data in Figure 5 further show how graphene incorporation induces a dynamic plane in the ZnO nanomaterial. The peak at 3443 cm−1 illustrates O-H stretching vibrations in both undoped and doped ZnO. Moreover, the ZnO/CN 2399 cm−1 plane falls within the hydroxyl compounds group [58]. The sp2 feature of CN is demonstrated at a mid-frequency band of 1625 cm−1. The broadened plane at 1384 cm−1 has amplified attributes of the hybridized properties of graphene. It is ascribed to a primary or secondary in-plane bend or stretching vibration. The absorption band at about 1051 cm−1 plane can be inferred as the vibrational stretching of C=O coupled with C–OH bonds [58,59]. N–H bonds are observed by the out-of-plane vibrational stretching at peaks 906 and 835 cm−1, which are conspicuously seen in ZnO/CN compared to ZnO comparatively. ZnO bending vibrations corresponding to metal oxides are identified by the absorption peak 461 cm−1 [59,60]. Thus, it is believed that the grafting of graphene (CN) dopant molecules onto the synthesized ZnO nanopowders was successfully performed considering the IR spectroscopy’s output.

Figure 5.
FTIR spectra of nanopowders.
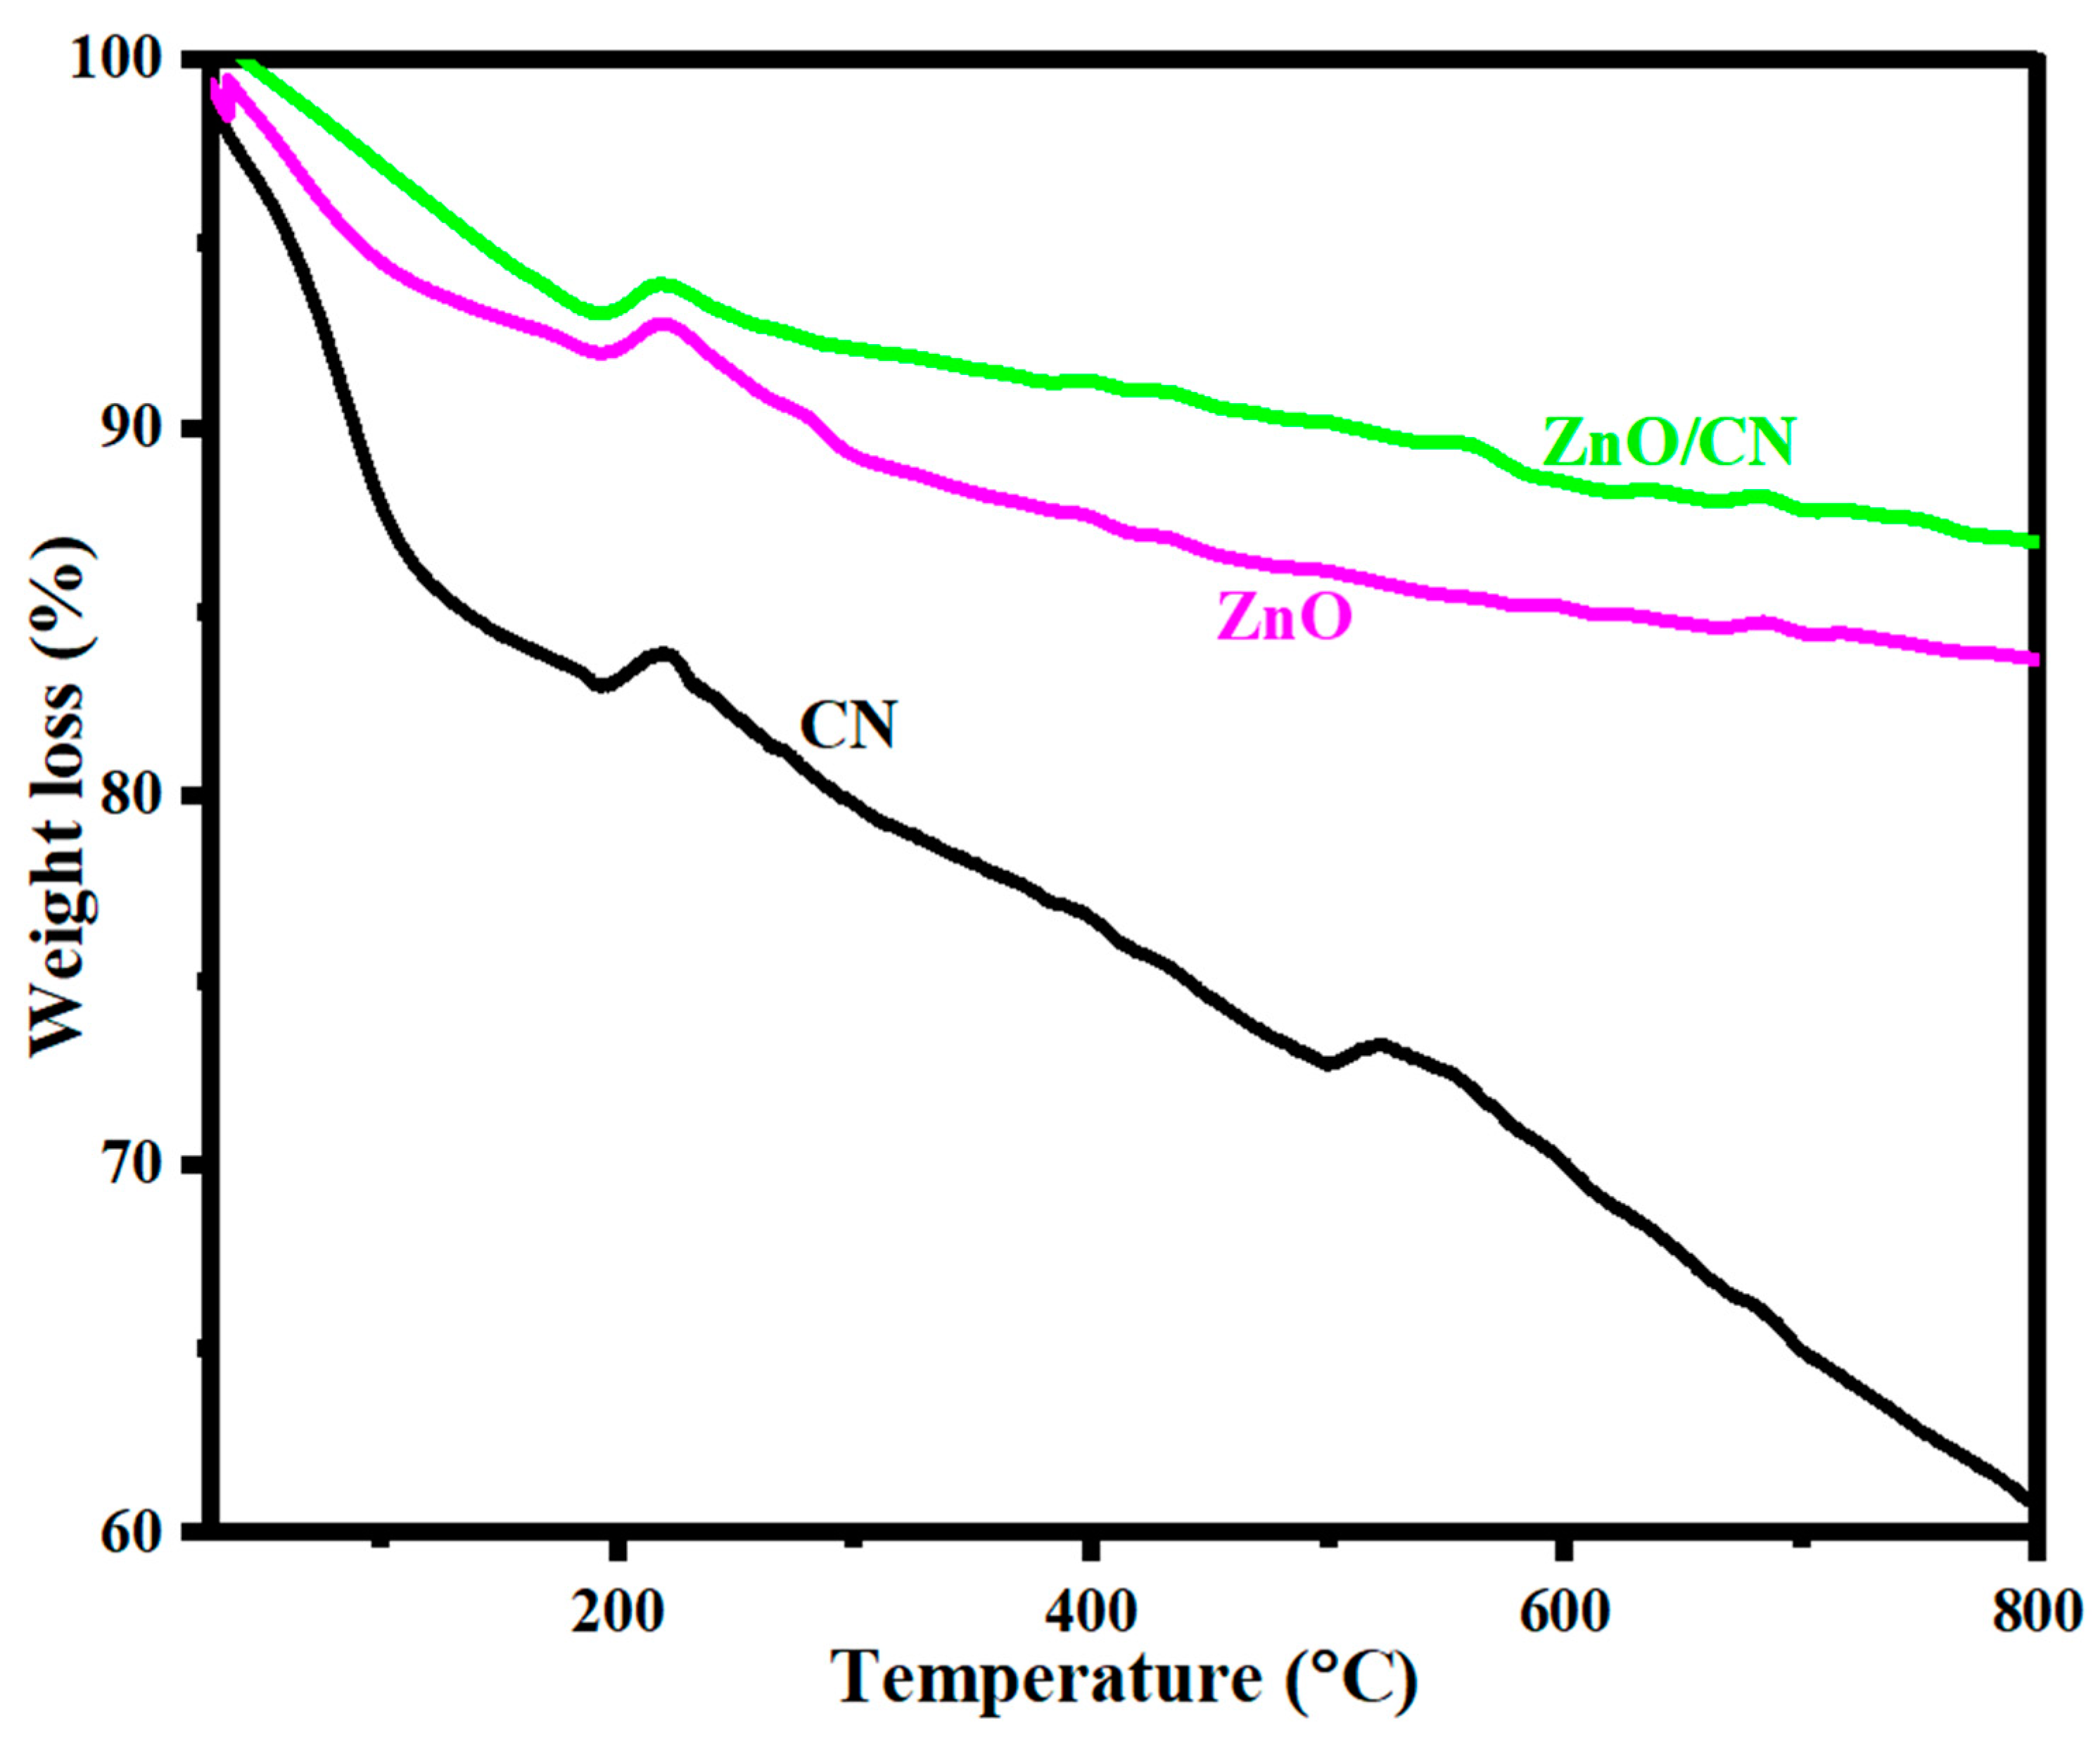
Thermogravimetric analysis. Figure 6 illustrates a TGA stability test conducted to examine the thermal stability levels of CN, ZnO, and ZnO/CN in an Ar-rich environment. The thermogram’s primary weight losses were recorded for CN at 38 °C and for ZnO and ZnO/CN at 193 °C. The estimated weight losses were 2.1%, 6.6%, and 6.9%, respectively. The phenomenon can be explained by the evaporation of moisture from the surfaces of nanoparticles [61]. Phase two losses can be attributed to the dissipation of securely bonded water molecules and the dissociation of O2 functional groups at temperatures of more than 250 °C. These losses occurred between 193 °C and 531 °C. Oxidative decomposition of carbon framework and residual O2 functionality removal occurred between 500 °C and 680 °C. Generally, the thermogram depicts relatively thermally stable ZnO/CN compared to ZnO due to CN impregnation into the lattice sites of the ZnO [62,63].

Figure 6.
TGA analysis of prepared nanopowders.
2.3. Gas Sensing Mechanism
Fabricated sensing devices often exhibit strong interaction with ambient oxygen. Generally, in the ambient environment, O2 molecules become adsorbed onto the surface of the gas sensing layer, considering the exceptionally strong electron affinity characteristics of the O2 molecules. The chemical equations governing the proposed gas sensing mechanism as described are shown in the following Equations (1)–(4) [64,65]:
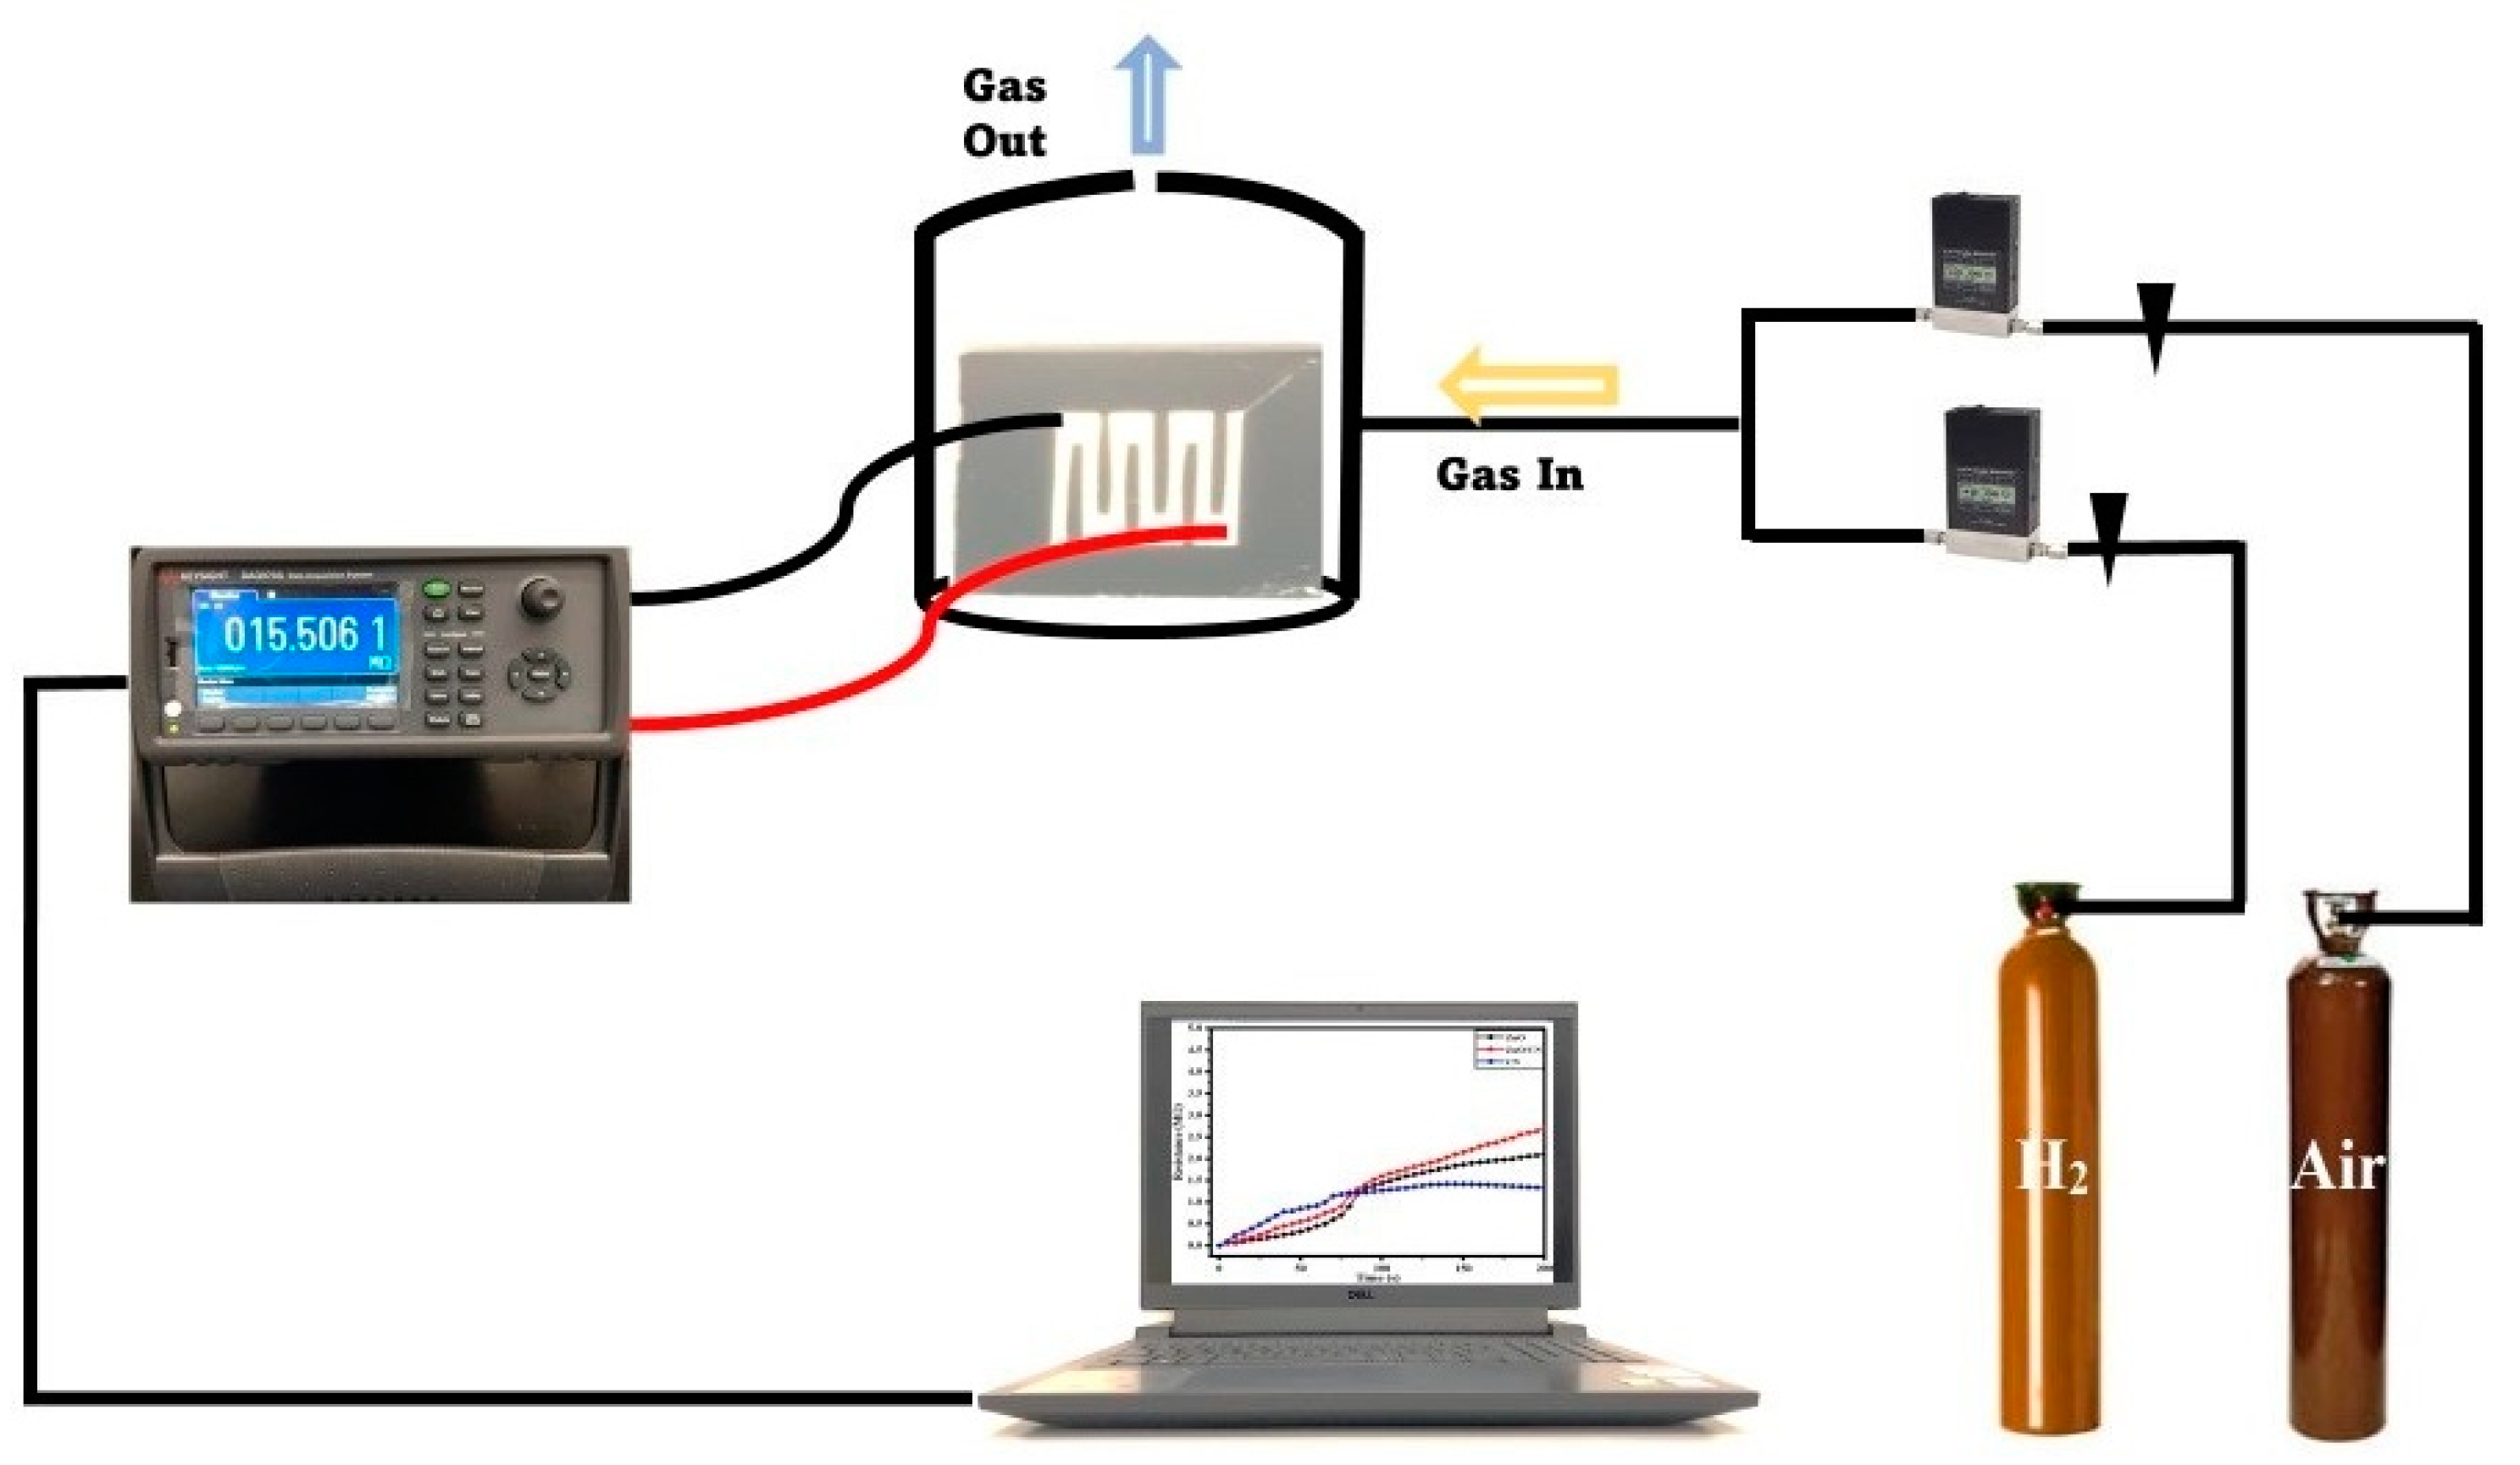
The dominance of , as depicted in Equations (1)–(3), results in the creation of a border referred to as an electron depletion layer (EDL) at the gas sensing layers’ surface. This potential border (increased width and thickness) impedes the smooth flow of electrons, considering the presence of the newly created electrical barrier (EDL). This leads to the creation of higher electrical resistance for a given gas sensor in the ambient environment. However, in the presence of a target gas (CO2, H2), the analyte gas dislodges the chemical bonds between the oxygen and electrons, creating free mobile electrons, leading to easy electron movement and a reduction in the EDL thickness for higher conductivity. This causes an improved gas response as depicted in reactions (Equations (5) and (6)) for CO2 and H2, respectively. Figure 7 shows a schematic view of the laboratory gas sensing setup.
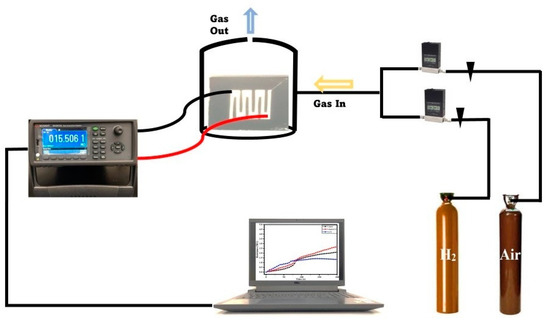
Figure 7.
Schematic diagram of gas sensing setup.
2.4. Sensitivity/Response
The relation determines the gas sensor response (S):
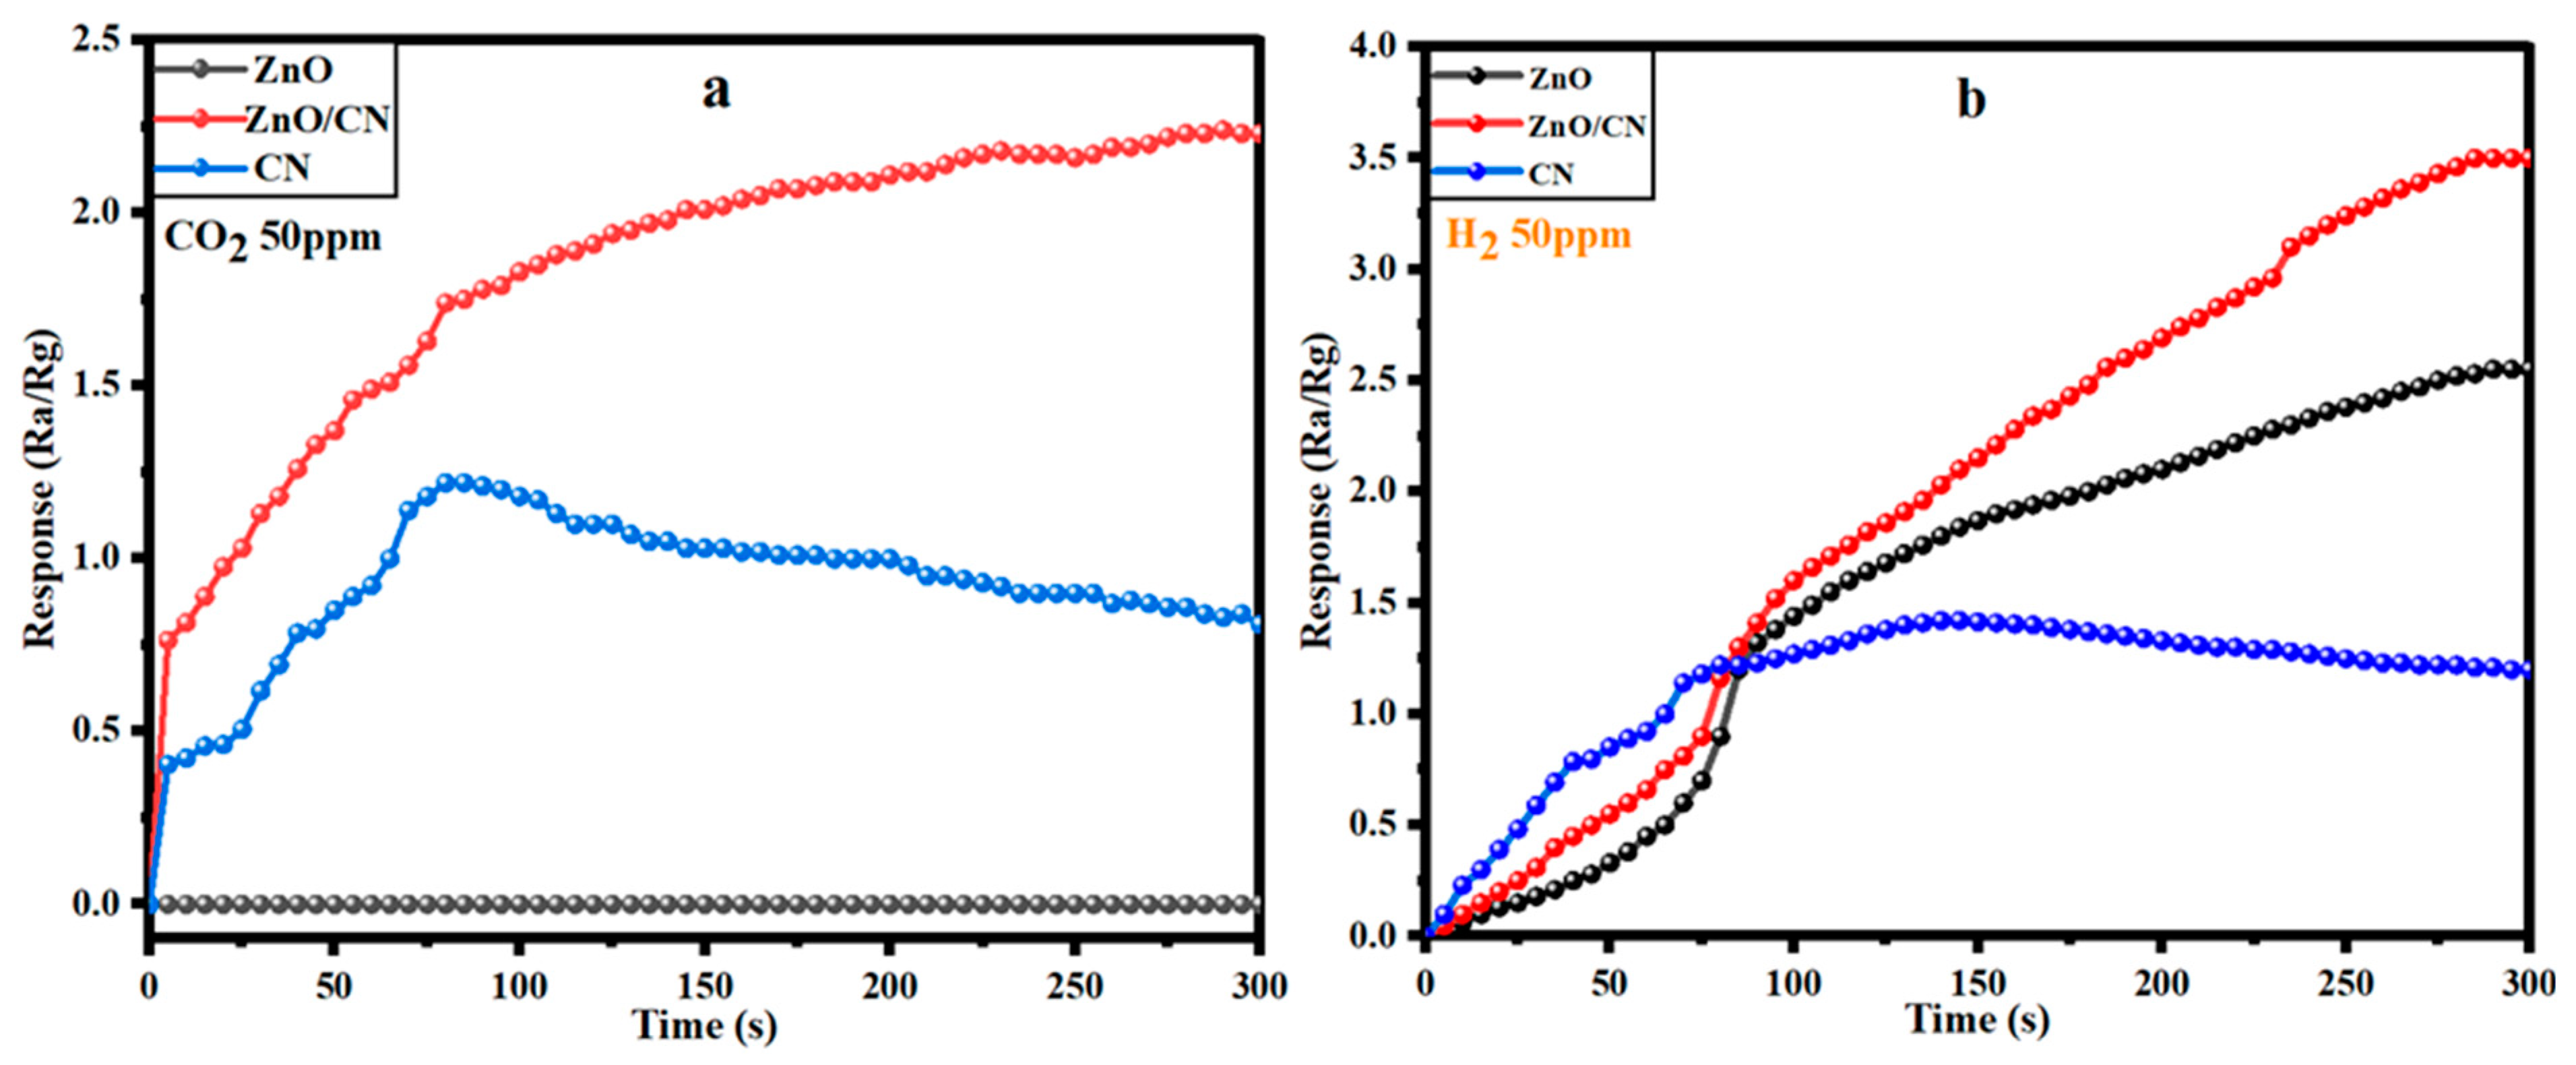
The response of CO2 gas onto a ZnO sensor device is a chemisorption activity involving an adsorption reaction of the oxygen anion species and the carbon dioxide gas. In a 50 ppm CO2-polluted gas chamber with a 0.2 L per minute flowrate and 51% relative humidity (RH), the analyte gas molecules initially react with the pre-adsorbed O2 species on the fabricated ZnO sensor device’s surface. This causes an O2 deficit, creating more free and mobile electrons in the ZnO sensing layer and the subsequent response for a given volume of CO2 in the atmosphere. However, in this study, the reaction between the adjacent O2− and CO2 pair yields surface bidentate carbonate species, which transforms to surface carboxylate upon further CO2 adsorption, as depicted in Equations (8)–(10). These formed species inhibit electron flow; hence, no response was recorded for the ZnO sensor device, accounting for a low sensitivity at 300 s. The wider band gap within the ZnO structure could contribute to its non-responsiveness (Figure 8a), as more electrons were captured upon the reaction of the n-type sensing layer with CO2 (oxidizing gas). The relatively high electron mobility and low electrical noise nature of the graphene (CN) provided extremely good electrical performance; hence, a relatively good CO2 response for the initial 80s, given the same gas flowrate and room temperature (30 °C) conditions. This may be attributable to the CO2 gas molecules behaving as a donor or acceptor on the 2D monolayer surface, hence influencing low resistance in the graphene sheet. The preceding gradual decline in conductance (Figure 8a) can be attributed to the clustering of adsorbed CO2 molecules at a saturated state, leading to high electrical resistance [66,67]. Deductively, the presence of CN in the ZnO/CN composite made extra free electrons available, created oxygen vacancies, and activated the surface for more CO2 adsorption. This resulted in high electron mobility [68,69]; hence, a recognizable 2.25% response in the ZnO/CN sensor device at 290 s and decline, as shown in Figure 8a. On the other hand, as H2 (reducing gas) is introduced in the homemade chamber under the same operating conditions, the electrons bonded to the oxygen species on the gas sensor’s surface are liberated back into the conduction band, as depicted in Equation (11). As shown in Figure 8b, the n-type semiconductor favors the reaction with H2 (reducing agent), considering the dominance of their major carriers (). The ZnO:H2 interaction yielded the release of relatively high free electrons as opposed to what was observed in the presence of CO2, giving a response of 2.6%. Nevertheless, the ZnO/CN:H2 reaction favored the release of extra mobile electrons due to the adsorptive and broader surface of the sensing layer coupled with excess active sites to react effectively with the reducing gas, which minimized resistivity. A response measurement of 3.4% was achieved, while CN also recorded a relatively good response (1.45%) at a response time of 150 s for 50 ppm H2.
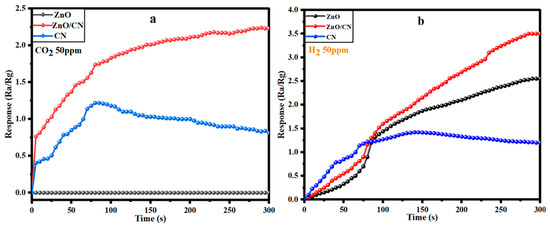
Figure 8.
Responses of fabricated gas sensor devices toward (a) CO2 and (b) H2 at 30 °C and 51% RH.
3. Materials and Methods
3.1. Materials and Reagents
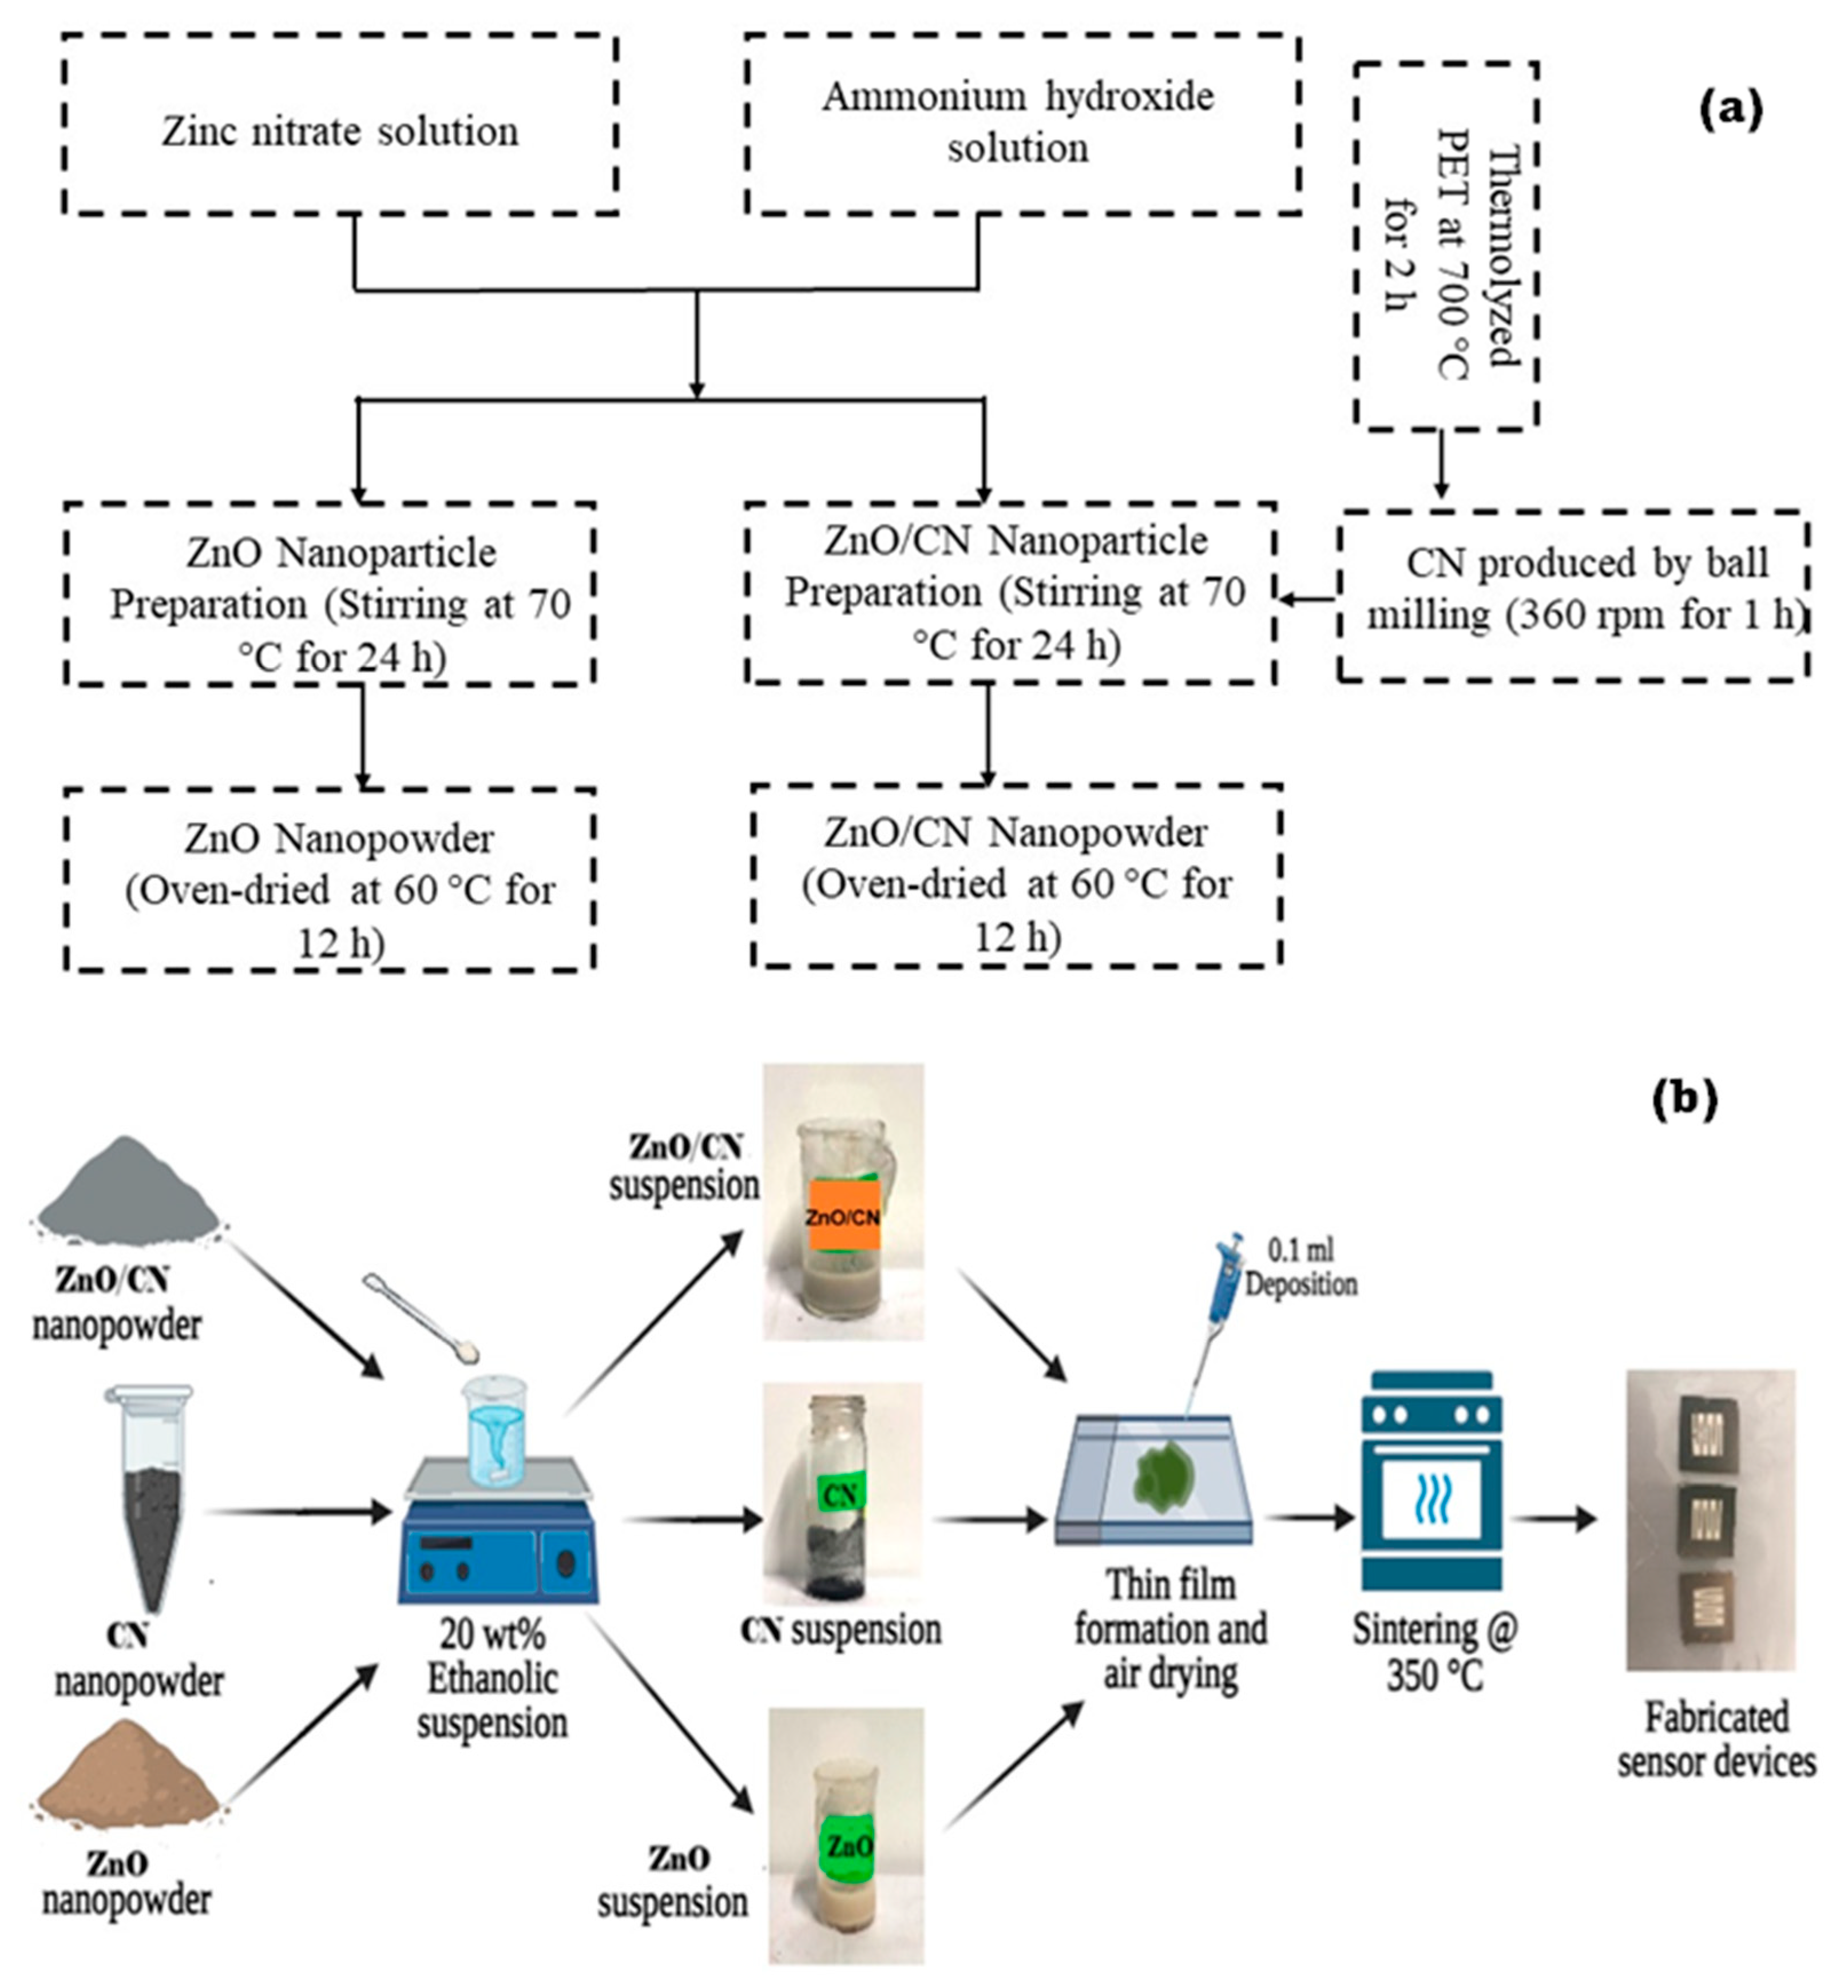
Waste plastics (PET) bottles were obtained from the Egypt-Japan University of Science and Technology, Alexandria, Egypt Cafeteria, zinc nitrate hexahydrate (Zn(NO3)2·6H2O) was purchased from Alpha Chemika, Maharashtra, India, and ammonium hydroxide (35% NH4OH) was procured from Fisher Scientific, Merelbeke, Belgium. Absolute ethanol (99.8% C2H6O) was procured from Fisher Scientific in Belgium. Acetone (99% C3H6O) was procured from Sigma-Aldrich, Saint-Quentin-Fallavier, France, and microscope glass substrate was purchased from Brand Chemicals, Port Said St., Egypt. Illustrated in Figure 9a,b is a schematic procedure leading to the synthesis of the various nanopowders and fabricating the sensor devices.

Figure 9.
Schematic illustration of (a) synthesized nanopowders by top–down and bottom–up techniques and (b) sensor device fabrication.
3.2. Synthesis of Carbon Nanomaterial (CN)/Graphene
PET waste feedstock (plastic water bottles and snack packaging) was sourced from the Egypt-Japan University of Science and Technology, Alexandria, Egypt Cafeterias. Sorting was performed to retrieve PET from polyethylene and polystyrene waste packaging. They were pre-washed, shredded, rinsed with deionized (DI) water, and air-dried. A 420 mL stainless steel 316 autoclave made airtight with 40 g of shredded plastic was placed in the muffle furnace (ASH AMF 25N, Osaka, Japan) to thermally decompose at a ramping rate of 10 °C min−1. A steady temperature of 700 °C was maintained for 2 h over an inert gas and allowed to cool. The charred product (dark) was collected, weighted, and reduced to nanosized particles using a Photon Ball Mill (Photon Scientific, XQM-0.4A, Changsha, China) for 1 h at 360 rpm and preserved in a desiccator [70,71]. The carbon nanomaterial’s yield was determined as shown in Equation (12) and characterized using XRD, BET, TEM, FTIR, TGA, and EDX.
3.3. Synthesis of ZnO and ZnO/CN Nanopowders
The sol–gel technique was employed in synthesizing doped and undoped ZnO nanopowders. Then, 0.1 M Zn(NO3)2·6H2O was formed by the dissolution of 7.44 g Zn(NO3)2·6H2O precursor in 250 mL of deionized water. Homogeneity is ensured by stirring the mixture for about 10 min. 1 M NH4OH was administered dropwise while stirring to raise the solution’s pH to 8. The obtained sol was aged at 70 °C for 24 h. The resulting ZnO was thoroughly washed with DI water, centrifuged at 6000 rpm for 0.5 h, and oven-dried at 60 °C in ambient air.
To synthesize ZnO/CN, a homogenized sol was prepared from the same precursors (Zn(NO3)2·6H2O, NH4OH, DI) as described above. A 5 wt% graphene dopant was then introduced into the sol, sonicated for 0.5 h to achieve uniform dispersion, and stirred overnight at 70 °C and 150 rpm for aging purposes. The resulting ZnO/CN was filtered, ethanol-washed, sonicated, and centrifuged at 6000 rpm for 0.5 h. The powder was thoroughly washed with DI water, centrifuged, and oven-dried at 60 °C in ambient air [52]. Below, (Equations (13)–(16)) are possible chemical reaction mechanisms resulting in the synthesized nanopowders.
3.4. Characterization and Analytical Techniques
Diverse analytical techniques and equipment were employed to perform characteristic analyses of the various synthesized nanomaterials. The crystallographic properties of the nanopowders were determined by XRD (Bruker D2 Phaser, Billerica, MA, USA) with 1.54 Å Cu-Kα beam of radiation. Functionality test was performed using an FTIR analyzer (Shimadzu 8400s, Tokyo, Japan) to determine the surface functional groups of all synthesized materials. The internal morphological structure and elemental quantification were acquired using transmission electron microscopy (TEM) coupled with EDX (JEOL, JEM-2100F, Tokyo, Japan). Thermal stability was investigated using TGA analyzer (LINSEIS STA PT Series, Haan, Germany). Microtrac MRB Belsorp Mini X (Osaka, Japan) BET analyzer was employed in measuring the sample surface area, total pore volume, pore distribution, and mean pore sizes of the synthesized nanopowders degassed overnight at 180 °C.
3.5. Sensor Device Fabrication and Gas Sensing
In fabricating the solid-state gas sensor device, a 2 × 2 cm glass substrate is obtained, washed, bath-sonicated in acetone media, air-dried, and ozone-cleaned to degrade all organic contaminants. A total of 20 wt% of ethanolic suspension with ZnO or ZnO/CN was prepared. Then, 0.1 mL of the respective suspension was attended by a vacuum spin coater, (VTC-200, Xinyang, China). The film was air-dried and sintered for 5 min at 350 °C. Deposition of platinum contact electrodes was performed on the thin film using a sputtering machine (JEOL, JEC-3000FC, Tokyo, Japan). The fabricated solid-state gas sensor devices were encased inside a homemade gas chamber with inbuilt electrical wiring, as demonstrated in related studies [52,68]. The homemade gas chamber is connected to a Keysight multimeter (DAQ970A, Bayan Lepas, Malaysia) to record the respective resistances in air and the analyte gases. The targeted gases were run through the chamber to be analyzed.
4. Conclusions
This study presents the recovery of essential carbon materials from waste plastics (polyethylene terephthalate) which, in their unrefined form, cause significant destruction to terrestrial and marine ecosystems. With a structural deficit in the band gap of metal oxide semiconducting materials such as ZnO employed in sensor fabrication, this study aimed to investigate the impact of the retrieved high-value carbon (graphene) on the sensing performance of the ZnO material. The substantial findings and research direction found were as follows:
- A pyrolytic approach adopted in the upcycling of PET into a high-carbon nanomaterial (graphene) was achieved successfully.
- The yield, crystallographic pattern, and elemental composition depicted purely high-grade synthesized graphene. Nanopowders of ZnO and ZnO/CN were synthesized using a bottom–up approach via a sol–gel preparation technique. XRD analysis confirmed the production of hexagonal wurtzite structures with carbon traces in the doped ZnO, and no impurities were found in either nanopowder.
- The CN dopant improved the surface-active sites of the ZnO/CN fabricated gas sensor device.
- Comparatively, H2 gas recorded relatively higher responses (3.4%, 2.6%, and 1.45%) for all tested gas sensing devices than CO2, given the same operating temperature, relative humidity, and flow rate. The highest recorded sensitivity for CO2 gas was 2.25% for ZnO/CN at 290 s.
Inferentially, this study underscores the propensity of CN dosage variation to impact the sensitivity of the target gas significantly. Producing CN from waste plastics promises a sustainable techno-economic approach for substituting expensive commercial dopants employed in gas sensor construction. Additionally, the nature of the gas to be detected or measured must be factored into the selection of the semiconducting material in building the sensing layer of the gas sensors. Further investigations into recovering useful resources from other waste plastic types promise a safer tomorrow for posterity while prolonging the lifespan of landfills.
Author Contributions
P.O.A.: Writing—original draft, Validation, Investigation, Formal analysis. M.N.: Methodology, Writing, Reviewing, Editing, M.E.: Methodology, Writing, Reviewing, Editing. H.S.: Conceptualization, Writing, Reviewing and Editing. All authors have read and agreed to the published version of the manuscript.
Funding
This research received no external funding.
Data Availability Statement
The authors do not have permission to share data.
Acknowledgments
Prince Oppong Amoh duly acknowledges the Japan International Cooperation Agency (JICA) through the Tokyo International Conference on African Development (TICAD7) Scholarship. Authors express their profound gratitude to Cyril Oluchukwu Ugwuoke, Mohammed Sami, Mohammed Gaber, Osama Khamis, and Mahmoud Zaghloul for their technical support.
Conflicts of Interest
Authors declare no competing interests.
References
- Thompson, R.C.; Moore, C.J.; vom Saal, F.S.; Swan, S.H. Plastics, the environment and human health: Current consensus and future trends. Philos. Trans. R. Soc. B Biol. Sci. 2009, 364, 2153–2166. [Google Scholar] [CrossRef] [PubMed]
- Kanari, N.; Shallari, S.; Allain, E. Processing of End-of-Life Materials and Industrial Wastes. Materials 2022, 15, 7662. [Google Scholar] [CrossRef] [PubMed]
- Odonkor, S.T.; Sallar, A.M. Correlates of household waste management in Ghana: Implications for public health. Heliyon 2021, 7, e08227. [Google Scholar] [CrossRef]
- Ahamed, A.; Vallam, P.; Iyer, N.S.; Veksha, A.; Bobacka, J.; Lisak, G. Life cycle assessment of plastic grocery bags and their alternatives in cities with confined waste management structure: A Singapore case study. J. Clean. Prod. 2020, 278, 123956. [Google Scholar] [CrossRef]
- Li, J.; Michalkiewicz, B.; Min, J.; Ma, C.; Chen, X.; Gong, J.; Mijowska, E.; Tang, T. Selective preparation of biomass-derived porous carbon with controllable pore sizes toward highly efficient CO2 capture. Chem. Eng. J. 2019, 360, 250–259. [Google Scholar] [CrossRef]
- Jambeck, J.R.; Geyer, R.; Wilcox, C.; Siegler, T.R.; Perryman, M.; Andrady, A.; Narayan, R.; Law, K.L. Entradas de residuos plásticos desde la tierra al océano. Ciencia 2015, 347, 768–771. Available online: http://www.sciencemag.org/cgi/doi/10.1126/science.1260879%0Ahttps://www.sciencemag.org/lookup/doi/10.1126/science.1260352 (accessed on 29 April 2024).
- Rhodes, C.J. Plastic pollution and potential solutions. Sci. Prog. 2018, 101, 207–260. [Google Scholar] [CrossRef] [PubMed]
- Ellen Macarthur Foundation; World Economic Forum; McKinsey&Co. The New Plastic Economy: Rethinking the Future of Plastics, Ellen Macarthur Found; Ellen MacArthur Foundation and Ellen MacArthur Foundation Trading Ltd.: Isle of Wight, UK, 2016; pp. 1–120. [Google Scholar]
- Sadeghi, B.; Marfavi, Y.; AliAkbari, R.; Kowsari, E.; Ajdari, F.B.; Ramakrishna, S. Studies on Recycled PET Fibers: Production and Applications: A Review. Mater. Circ. Econ. 2021, 3, 4. [Google Scholar] [CrossRef]
- Hussin, F.; Aroua, M.K.; Kassim, M.A.; Ali, U.F.M. Transforming plastic waste into porous carbon for capturing carbon dioxide: A review. Energies 2021, 14, 8421. [Google Scholar] [CrossRef]
- Guo, K.; Hussain, I.; Jie, G.; Fu, Y.; Zhang, F.; Zhu, W. Strategies for improving the photocatalytic performance of metal-organic frameworks for CO2 reduction: A review. J. Environ. Sci. 2023, 125, 290–308. [Google Scholar] [CrossRef]
- Thiounn, T.; Smith, R.C. Advances and approaches for chemical recycling of plastic waste. J. Polym. Sci. 2020, 58, 1347–1364. [Google Scholar] [CrossRef]
- Dhawan, R.; Bisht, B.M.S.; Kumar, R.; Kumari, S.; Dhawan, S. Recycling of plastic waste into tiles with reduced flammability and improved tensile strength. Process Saf. Environ. Prot. 2019, 124, 299–307. [Google Scholar] [CrossRef]
- Beghetto, V.; Gatto, V.; Samiolo, R.; Scolaro, C.; Brahimi, S.; Facchin, M.; Visco, A. Plastics today: Key challenges and EU strategies towards carbon neutrality: A review. Environ. Pollut. 2023, 334, 122102. [Google Scholar] [CrossRef] [PubMed]
- Beghetto, V.; Sole, R.; Buranello, C.; Al-Abkal, M.; Facchin, M. Recent advancements in plastic packaging recycling: A mini-review. Materials 2021, 14, 4782. [Google Scholar] [CrossRef] [PubMed]
- Nag, S.; Biswas, S. Cellulose-Based Adsorbents for Heavy Metal Removal. In Green Adsorbents to Remove Metals, Dyes and Boron from Polluted Water; Springer: Cham, Switzerland, 2021. [Google Scholar] [CrossRef]
- Pahlavan, F.; Aldagari, S.; Park, K.B.; Kim, J.S.; Fini, E.H. Bio-Carbon as a Means of Carbon Management in Roads. Adv. Sustain. Syst. 2023, 7, 2300054. [Google Scholar] [CrossRef]
- Mousavi, E.F.M.; Aldagari, S.; Crocker, M.S.; Ackerman-Biegasiewicz, L.K. Iron-rich biochar to asorb volatile organic compounds emitted from asphalt-surfaced areas. ACS Sustain. Chem. Eng. 2023, 11, 2885–2896. [Google Scholar] [CrossRef]
- Nimako, K.O.; Dwumfour, A.; Mensah, K.; Koshy, P.; Dankwah, J.R. Calcination Behaviour of Nsuta Rhodochrosite Ore in the Presence and Absence of End-of-Life High Density Polyethylene. Ghana Min. J. 2020, 20, 27–35. [Google Scholar] [CrossRef]
- Dai, L.; Zhou, N.; Lv, Y.; Cheng, Y.; Wang, Y.; Liu, Y.; Cobb, K.; Chen, P.; Lei, H.; Ruan, R. Pyrolysis technology for plastic waste recycling: A state-of-the-art review. Prog. Energy Combust. Sci. 2022, 93, 101021. [Google Scholar] [CrossRef]
- Wang, J.; Yuan, X.; Deng, S.; Zeng, X.; Yu, Z.; Li, S.; Li, K. Waste polyethylene terephthalate (PET) plastics-derived activated carbon for CO2 capture: A route to a closed carbon loop. Green Chem. 2020, 22, 6836–6845. [Google Scholar] [CrossRef]
- El Essawy, N.A.; Konsowa, A.H.; Elnouby, M.; Farag, H.A. A novel one-step synthesis for carbon-based nanomaterials from polyethylene terephthalate (PET) bottles waste. J. Air Waste Manag. Assoc. 2017, 67, 358–370. [Google Scholar] [CrossRef]
- Zhang, C.; Long, C.; Yin, S.; Song, R.G.; Zhang, B.H.; Zhang, J.W.; He, D.P.; Cheng, Q. Graphene-based anisotropic polarization meta-filter. Mater. Des. 2021, 206, 109768. [Google Scholar] [CrossRef]
- Kovtun, A.; Treossi, E.; Mirotta, N.; Scidà, A.; Liscio, A.; Christian, M.; Valorosi, F.; Boschi, A.; Young, R.J.; Galiotis, C.; et al. Benchmarking of graphene-based materials: Real commercial products versus ideal graphene. 2D Materials 2019, 6, 025006. [Google Scholar] [CrossRef]
- Papageorgiou, D.G.; Kinloch, I.A.; Young, R.J. Mechanical properties of graphene and graphene-based nanocomposites. Prog. Mater. Sci. 2017, 90, 75–127. [Google Scholar] [CrossRef]
- Verma, R.; Vinoda, K.S.; Papireddy, M.; Gowda, A.N.S. Toxic Pollutants from Plastic Waste—A Review. Procedia Environ. Sci. 2016, 35, 701–708. [Google Scholar] [CrossRef]
- Gómez-Sanabria, A.; Kiesewetter, G.; Klimont, Z.; Schoepp, W.; Haberl, H. Potential for future reductions of global GHG and air pollutants from circular waste management systems. Nat. Commun. 2022, 13, 106. [Google Scholar] [CrossRef] [PubMed]
- Konopacky, Q.M.; Barman, T.S.; Macintosh, B.A.; Marois, C. Detection of Carbon Monoxide and Water Absorption Lines in an Exoplanet Atmosphere. Science 2013, 339, 1398–1401. [Google Scholar] [CrossRef]
- Reyna-Bensusan, N.; Wilson, D.C.; Davy, P.M.; Fuller, G.W.; Fowler, G.D.; Smith, S.R. Experimental measurements of black carbon emission factors to estimate the global impact of uncontrolled burning of waste. Atmos. Environ. 2019, 213, 629–639. [Google Scholar] [CrossRef]
- Swenberg, J.A.; Moeller, B.C.; Lu, K.; Rager, J.E.; Fry, R.C.; Starr, T.B. Formaldehyde carcinogenicity research: 30 years and counting for mode of action, epidemiology, and cancer risk assessment. Toxicol. Pathol. 2013, 41, 181–189. [Google Scholar] [CrossRef] [PubMed]
- Lin, C.C.; Chiu, C.C.; Lee, P.Y.; Chen, K.J.; He, C.X.; Hsu, S.K.; Cheng, K.C. The Adverse Effects of Air Pollution on the Eye: A Review. Int. J. Environ. Res. Public Health 2022, 19, 1186. [Google Scholar] [CrossRef]
- Wei, C.C.; Lin, H.J.; Lim, Y.P.; Chen, C.S.; Chang, C.Y.; Lin, C.J.; Chen, J.J.Y.; Tien, P.T.; Lin, C.L.; Wan, L. PM2.5 and NOx exposure promote myopia: Clinical evidence and experimental proof. Environ. Pollut. 2019, 254, 113031. [Google Scholar] [CrossRef]
- Monsur, A.; Musa, M.; Gafur, A.; Talib, A.; Jamil, K. Synthesis and characterization of dip-coated ZnO–CuO composite thin film for room-temperature CO2 gas sensing. Thin Solid Films 2023, 773, 139838. [Google Scholar] [CrossRef]
- Rana, T.A.T.; Mohamed, S.; Mohamed, Z.; Ahmed, A.M. Tuning the surface morphologies of ZnO nanofilms for enhanced sensitivity and selectivity of CO2 gas sensor. Appl. Phys. A 2023, 129, 115. [Google Scholar] [CrossRef]
- Zhang, J.; Smith, K.R. Indoor air pollution: A global health concern. Br. Med. Bull. 2003, 68, 209–225. [Google Scholar] [CrossRef] [PubMed]
- El Morabet, R.; Mouak, S.; Khan, R.A.; El Ouadrhiri, A.A.; Aneflouss, M. Effects of Outdoor Air Pollution on Human Health in Kenitra, Morocco; Springer International Publishing: Cham, Switzerland, 2022. [Google Scholar] [CrossRef]
- Onkar, S.G.; Raghuwanshi, F.C.; Patil, D.R.; Krishnakumar, T. Synthesis, Characterization and Gas Sensing Study of SnO2 Thick Film Sensor towards H2S, NH3, LPG and CO2. Mater. Today Proc. 2020, 23, 190–201. Available online: www.sciencedirect.comwww.materialstoday.com/proceedings (accessed on 22 June 2023). [CrossRef]
- Li, M.; Sun, X.; Wang, Y.; Qin, C.; Cao, J.; Wang, Y. Light-driven room temperature methane gas sensor based on Ag modified flower-like ZnO microsphere. Sens. Diagn. 2023, 2, 878–886. [Google Scholar] [CrossRef]
- Thi, D.; To, H.; Young, J.; Yang, B.; Myung, N.V.; Choa, Y. Nanocrystalline ZnO quantum dot-based chemiresistive gas sensors: Improving sensing performance towards NO2 and H2 S by optimizing operating temperature. Sens. Actuators Rep. 2023, 6, 100166. [Google Scholar] [CrossRef]
- Luo, S.; Chen, R.; Wang, J.; Xiang, L. Chemical Conductometric methane gas sensors based on ZnO/Pd@ZIF-8: Effect of dual filtering of ZIF-8 to increase the selectivity. Sens. Actuators B Chem. 2023, 383, 133600. [Google Scholar] [CrossRef]
- Martínez-Esquivel, A.; Trujillo-Silva, D.J.; Cilia-López, V.G. Impact of environmental pollution on the obesogenic environment. Nutr. Rev. 2022, 80, 1787–1799. [Google Scholar] [CrossRef]
- Kaur, L. Graphene based chemiresistor sensors for the detection of toxic air pollutants: A theoretical overview. J. Indian Chem. Soc. 2023, 100, 101019. [Google Scholar] [CrossRef]
- Paul, R.; Das, B.; Ghosh, R. Novel approaches towards design of metal oxide based hetero-structures for room temperature gas sensor and its sensing mechanism: A recent progress. J. Alloys Compd. 2023, 941, 168943. [Google Scholar] [CrossRef]
- Mirzaei, A.; Ansari, H.R.; Shahbaz, M.; Kim, J.Y.; Kim, H.W.; Kim, S.S. Metal Oxide Semiconductor Nanostructure Gas Sensors with Different Morphologies. Chemosensors. 2022, 10, 289. [Google Scholar] [CrossRef]
- Degler, D. Trends and advances in the characterization of gas sensing materials based on semiconducting oxides. Sensors 2018, 18, 3544. [Google Scholar] [CrossRef]
- Staerz, A.; Berthold, C.; Russ, T.; Wicker, S.; Weimar, U.; Barsan, N. The oxidizing effect of humidity on WO3 based sensors. Sens. Actuators B Chem. 2016, 237, 54–58. [Google Scholar] [CrossRef]
- Sun, X.; Zhu, L.; Qin, C.; Cao, J.; Wang, Y. Room-temperature methane sensors based on ZnO with different exposed facets: A combined experimental and first-principle study. Surf. Interfaces 2023, 38, 102823. [Google Scholar] [CrossRef]
- Bej, D.; Chattaraj, N.; Mahapatra, R.; Mondal, M.K.; Ghosh, C. Fabrication of a CO2 Gas Sensor Based on ZnO Thin Film from the Perspective of Sensing Vehicle Tailpipe-Emitted Pollution. J. Electron. Mater. 2023, 52, 3983–3990. [Google Scholar] [CrossRef]
- AEkennia, C.; Uduagwu, D.N.; Nwaji, N.N.; Oje, O.O.; Emma-Uba, C.O.; Mgbii, S.I.; Olowo, O.J.; Nwanji, O.L. Green Synthesis of Biogenic Zinc Oxide Nanoflower as Dual Agent for Photodegradation of an Organic Dye and Tyrosinase Inhibitor. J. Inorg. Organomet. Polym. Mater. 2021, 31, 886–897. [Google Scholar] [CrossRef]
- Mohamed, H.H.; Alsanea, A.A.; Alomair, N.A.; Akhtar, S.; Bahnemann, D.W. ZnO@ porous graphite nanocomposite from waste for superior photocatalytic activity. Environ. Sci. Pollut. Res. 2019, 26, 12288–12301. [Google Scholar] [CrossRef]
- Mensah, K.; Mahmoud, H.; Fujii, M.; Shokry, H. Novel nano-ferromagnetic activated graphene adsorbent extracted from waste for dye decolonization. J. Water Process Eng. 2022, 45, 102512. [Google Scholar] [CrossRef]
- Hassan, H.S.; Kashyout, A.B.; Morsi, I.; Nasser, A.A.A.; Ali, I. Synthesis, characterization and fabrication of gas sensor devices using ZnO and ZnO:In nanomaterials. Beni-Suef Univ. J. Basic Appl. Sci. 2014, 3, 216–221. [Google Scholar] [CrossRef]
- Pol, V.G. Upcycling: Converting Waste Plastics into Paramagnetic, Conducting, Solid, Pure Carbon Microspheres. Environ. Sci. Technol. 2010, 44, 4753–4759. [Google Scholar] [CrossRef]
- Mensah, K.; Mahmoud, H.; Fujii, M.; Shokry, H. Upcycling of Polystyrene Waste Plastics to High Value Carbon by Thermal Decomposition. Key Eng. Mater. 2021, 897, 103–108. [Google Scholar] [CrossRef]
- Shokry, H.; Elkady, M.; Hamad, H. Nano activated carbon from industrial mine coal as adsorbents for removal of dye from simulated textile wastewater: Operational parameters and mechanism study. J. Mater. Res. Technol. 2019, 8, 4477–4488. [Google Scholar] [CrossRef]
- Al-Ghouti, M.A.; Da’ana, D.A. Guidelines for the use and interpretation of adsorption isotherm models: A review. J. Hazard. Mater. 2020, 393, 122383. [Google Scholar] [CrossRef]
- Amoh, P.O.; Samy, M.; Elkady, M.; Shokry, H.; Mensah, K. Surface modification of toner-based recyclable iron oxide self-doped graphite nanocomposite to enhance methylene blue and tetracycline adsorption. J. Environ. Manag. 2024, 357, 120786. [Google Scholar] [CrossRef]
- Jayarambabu, N.; Kumari, B.S.; Rao, K.V.; Prabhu, Y.T. Germination and growth characteristics of mungbean seeds (Vigna radiata L.) affected by synthesized zinc oxide nanoparticles. Int. J. Curr. Eng. Technol. 2014, 4, 2347–5161. [Google Scholar]
- Li, P.P.; Men, C.L.; Li, Z.P.; Cao, M.; An, Z.H. Study of graphene doped zinc oxide nanocomposite as transparent conducting oxide electrodes for solar cell applications. J. Shanghai Jiaotong Univ. 2014, 19, 378–384. [Google Scholar] [CrossRef]
- Bera, M.; Gupta, P.; Maji, P.K. Facile One-Pot Synthesis of Graphene Oxide by Sonication Assisted Mechanochemical Approach and Its Surface Chemistry. J. Nanosci. Nanotechnol. 2017, 18, 902–912. [Google Scholar] [CrossRef]
- Eze, E.; Omer, A.M.; Hassanin, A.H.; Eltaweil, A.S.; El-Khouly, M.E. Efficient removal of noxious methylene dye by low-cost and reusable composite beads based on cellulose acetate/banana pseudo-stem fiber. Biomass Convers. Bioeefin. 2023. [Google Scholar] [CrossRef]
- Lonkar, S.P.; Pillai, V.; Abdala, A. Solvent-free synthesis of ZnO-graphene nanocomposite with superior photocatalytic activity. Appl. Surf. Sci. 2019, 465, 1107–1113. [Google Scholar] [CrossRef]
- Lonkar, S.P.; Pillai, V.; Abdala, A.; Mittal, V. In situ formed graphene/ZnO nanostructured composites for low temperature hydrogen sulfide removal from natural gas. RSC Adv. 2016, 6, 81142–81150. [Google Scholar] [CrossRef]
- Mirzaei, A.; Janghorban, K.; Hashemi, B.; Bonyani, M.; Leonardi, S.G.; Neri, G. A novel gas sensor based on Ag/Fe2O3 core-shell nanocomposites. Ceram. Int. 2016, 42, 18974–18982. [Google Scholar] [CrossRef]
- Choi, M.S.; Ahn, J.; Kim, M.Y.; Mirzaei, A.; Choi, S.M.; Chun, D.W.; Jin, C.; Lee, K.Y. Changes in the crystal structure of SnO2 nanoparticles and improved H2S gas-sensing characteristics by Al doping. Appl. Surf. Sci. 2021, 565, 150493. [Google Scholar] [CrossRef]
- Yoon, H.J.; Jun, D.H.; Yang, J.H.; Zhou, Z.; Yang, S.S.; Cheng, M.M.C. Carbon dioxide gas sensor using a graphene sheet. Sens. Actuators B Chem. 2011, 157, 310–313. [Google Scholar] [CrossRef]
- Ghosh, R.; Aslam, M.; Kalita, H. Graphene derivatives for chemiresistive gas sensors: A review. Mater. Today Commun. 2022, 30, 103182. [Google Scholar] [CrossRef]
- Hassan, H.S.; Kashyout, A.B.; Morsi, I.; Nasser, A.A.A.; Raafat, A. Fabrication and characterization of gas sensor micro-arrays. Sens. Bio-Sens. Res. 2014, 1, 34–40. [Google Scholar] [CrossRef]
- Ahn, M.W.; Park, K.S.; Heo, J.H.; Park, J.G.; Kim, D.W.; Choi, K.J.; Lee, J.H.; Hong, S.H. Gas sensing properties of defect-controlled ZnO-nanowire gas sensor. Appl. Phys. Lett. 2008, 93, 263103. [Google Scholar] [CrossRef]
- Guo, W.; Zhao, B.; Zhou, Q.; He, Y.; Wang, Z.; Radacsi, N. Fe-Doped ZnO/Reduced Graphene Oxide Nanocomposite with Synergic Enhanced Gas Sensing Performance for the Effective Detection of Formaldehyde. ACS Omega 2019, 4, 10252–10262. [Google Scholar] [CrossRef]
- Amoh, P.O.; Elwardany, A.; Fujii, M.; Shokry, H. Room Temperature-Built Gas Sensors from Green Carbon Derivative: A Comparative Study between Pristine SnO2 and GO-SnO2 Nanocomposite. J. Nano Res. 2024, 82, 77–94. [Google Scholar] [CrossRef]
Disclaimer/Publisher’s Note: The statements, opinions and data contained in all publications are solely those of the individual author(s) and contributor(s) and not of MDPI and/or the editor(s). MDPI and/or the editor(s) disclaim responsibility for any injury to people or property resulting from any ideas, methods, instructions or products referred to in the content. |
© 2024 by the authors. Licensee MDPI, Basel, Switzerland. This article is an open access article distributed under the terms and conditions of the Creative Commons Attribution (CC BY) license (https://creativecommons.org/licenses/by/4.0/).