
Comparative Study of Adsorption of Methylene Blue and Basic Red 9 Using Rice Husks of Different Origins

 ,
,  ,
,  and
and
Abstract
: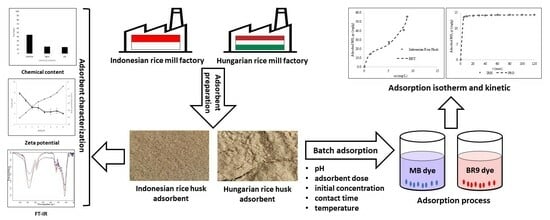
1. Introduction
2. Results and Discussion
2.1. Chemical Content Analysis
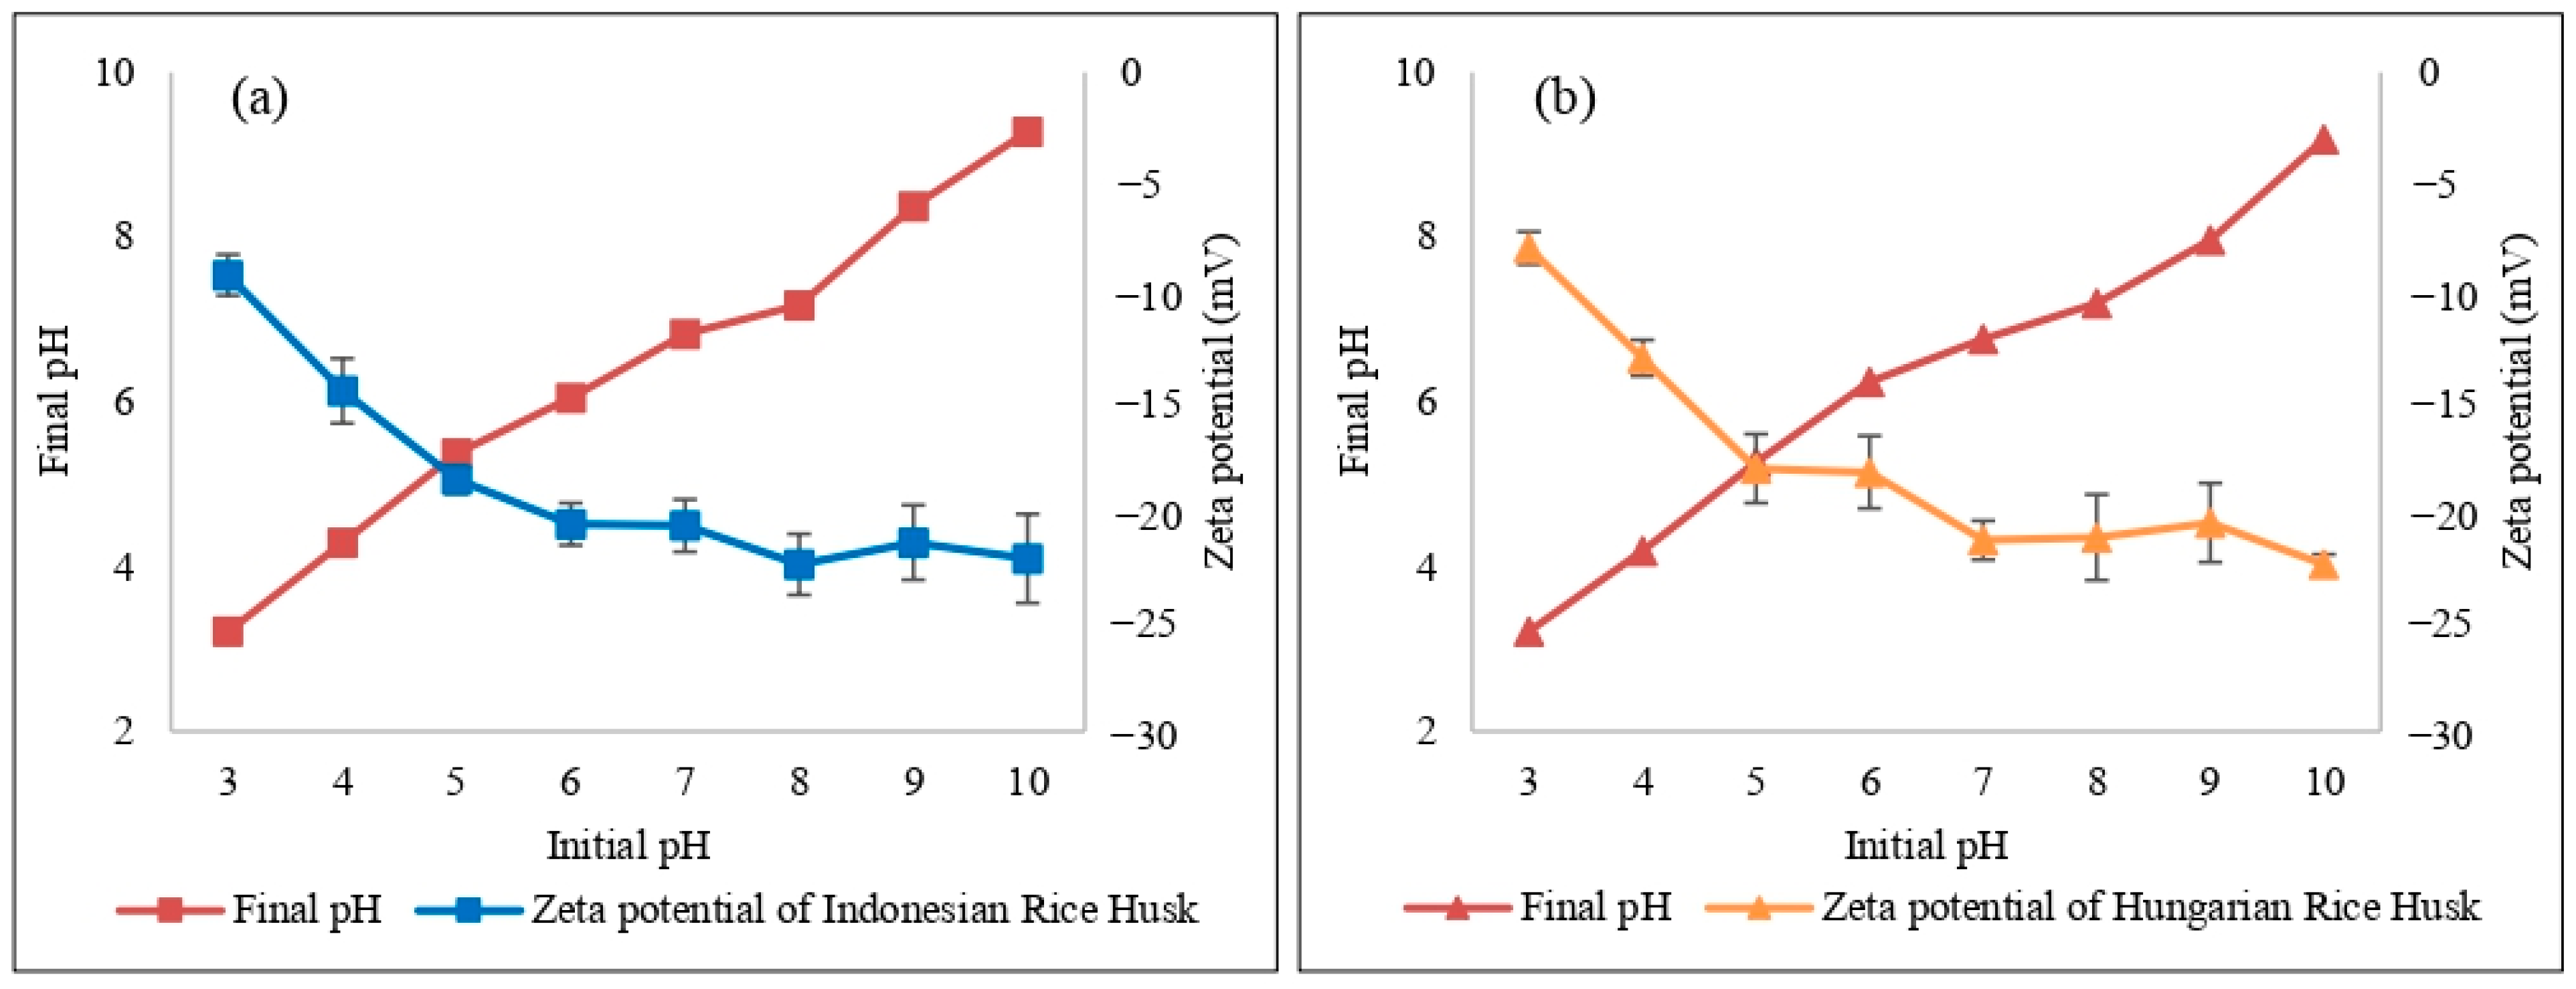
2.2. Zeta Potential Measurement
2.3. Effect of pH
2.4. Effect of Initial Dye Concentration
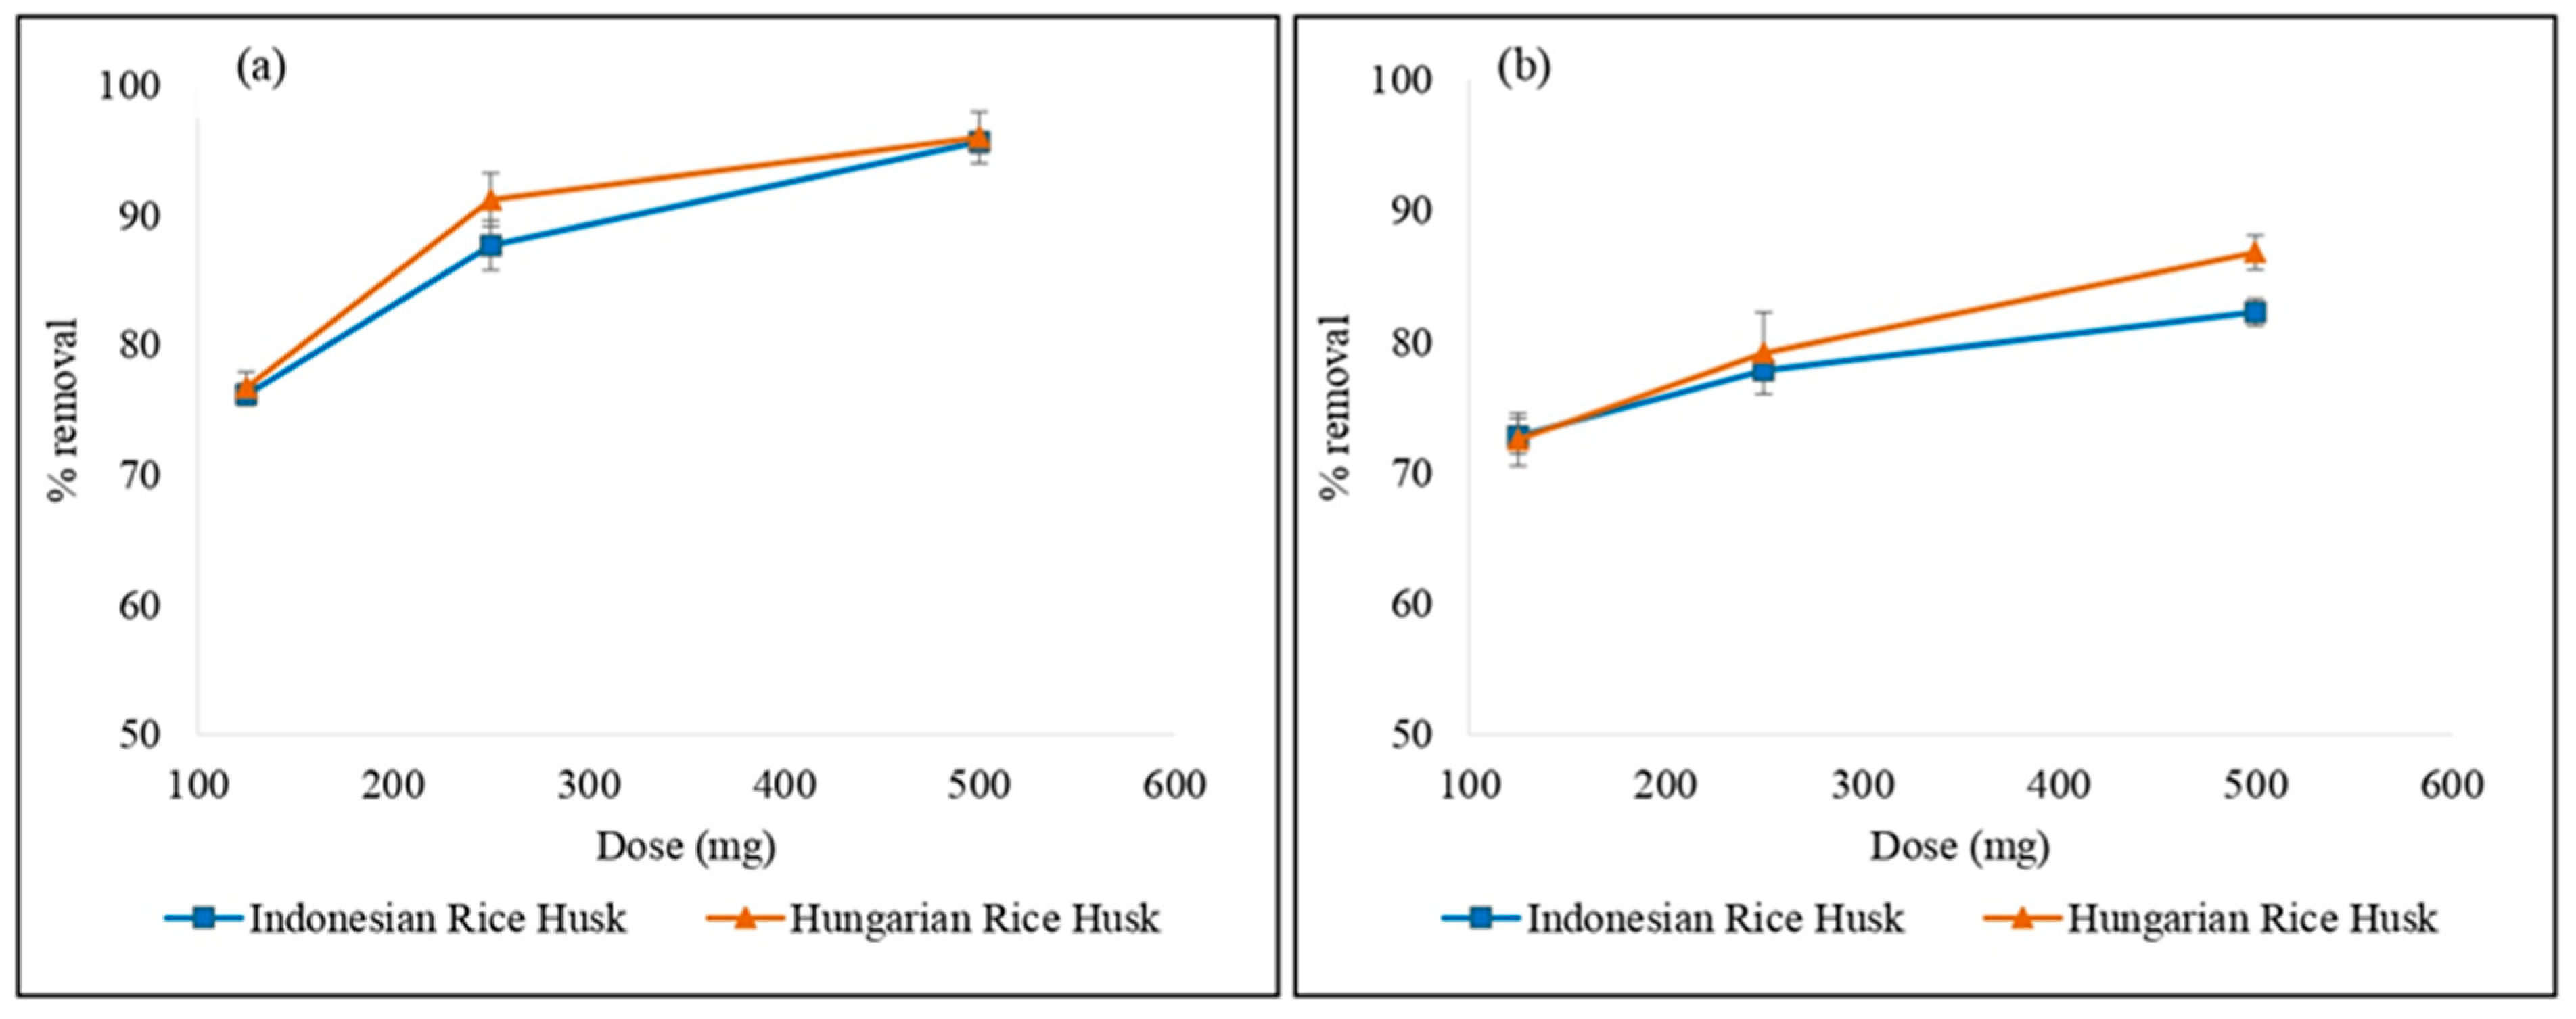
2.5. Effect of Adsorbent Dose
2.6. Effect of Contact Time
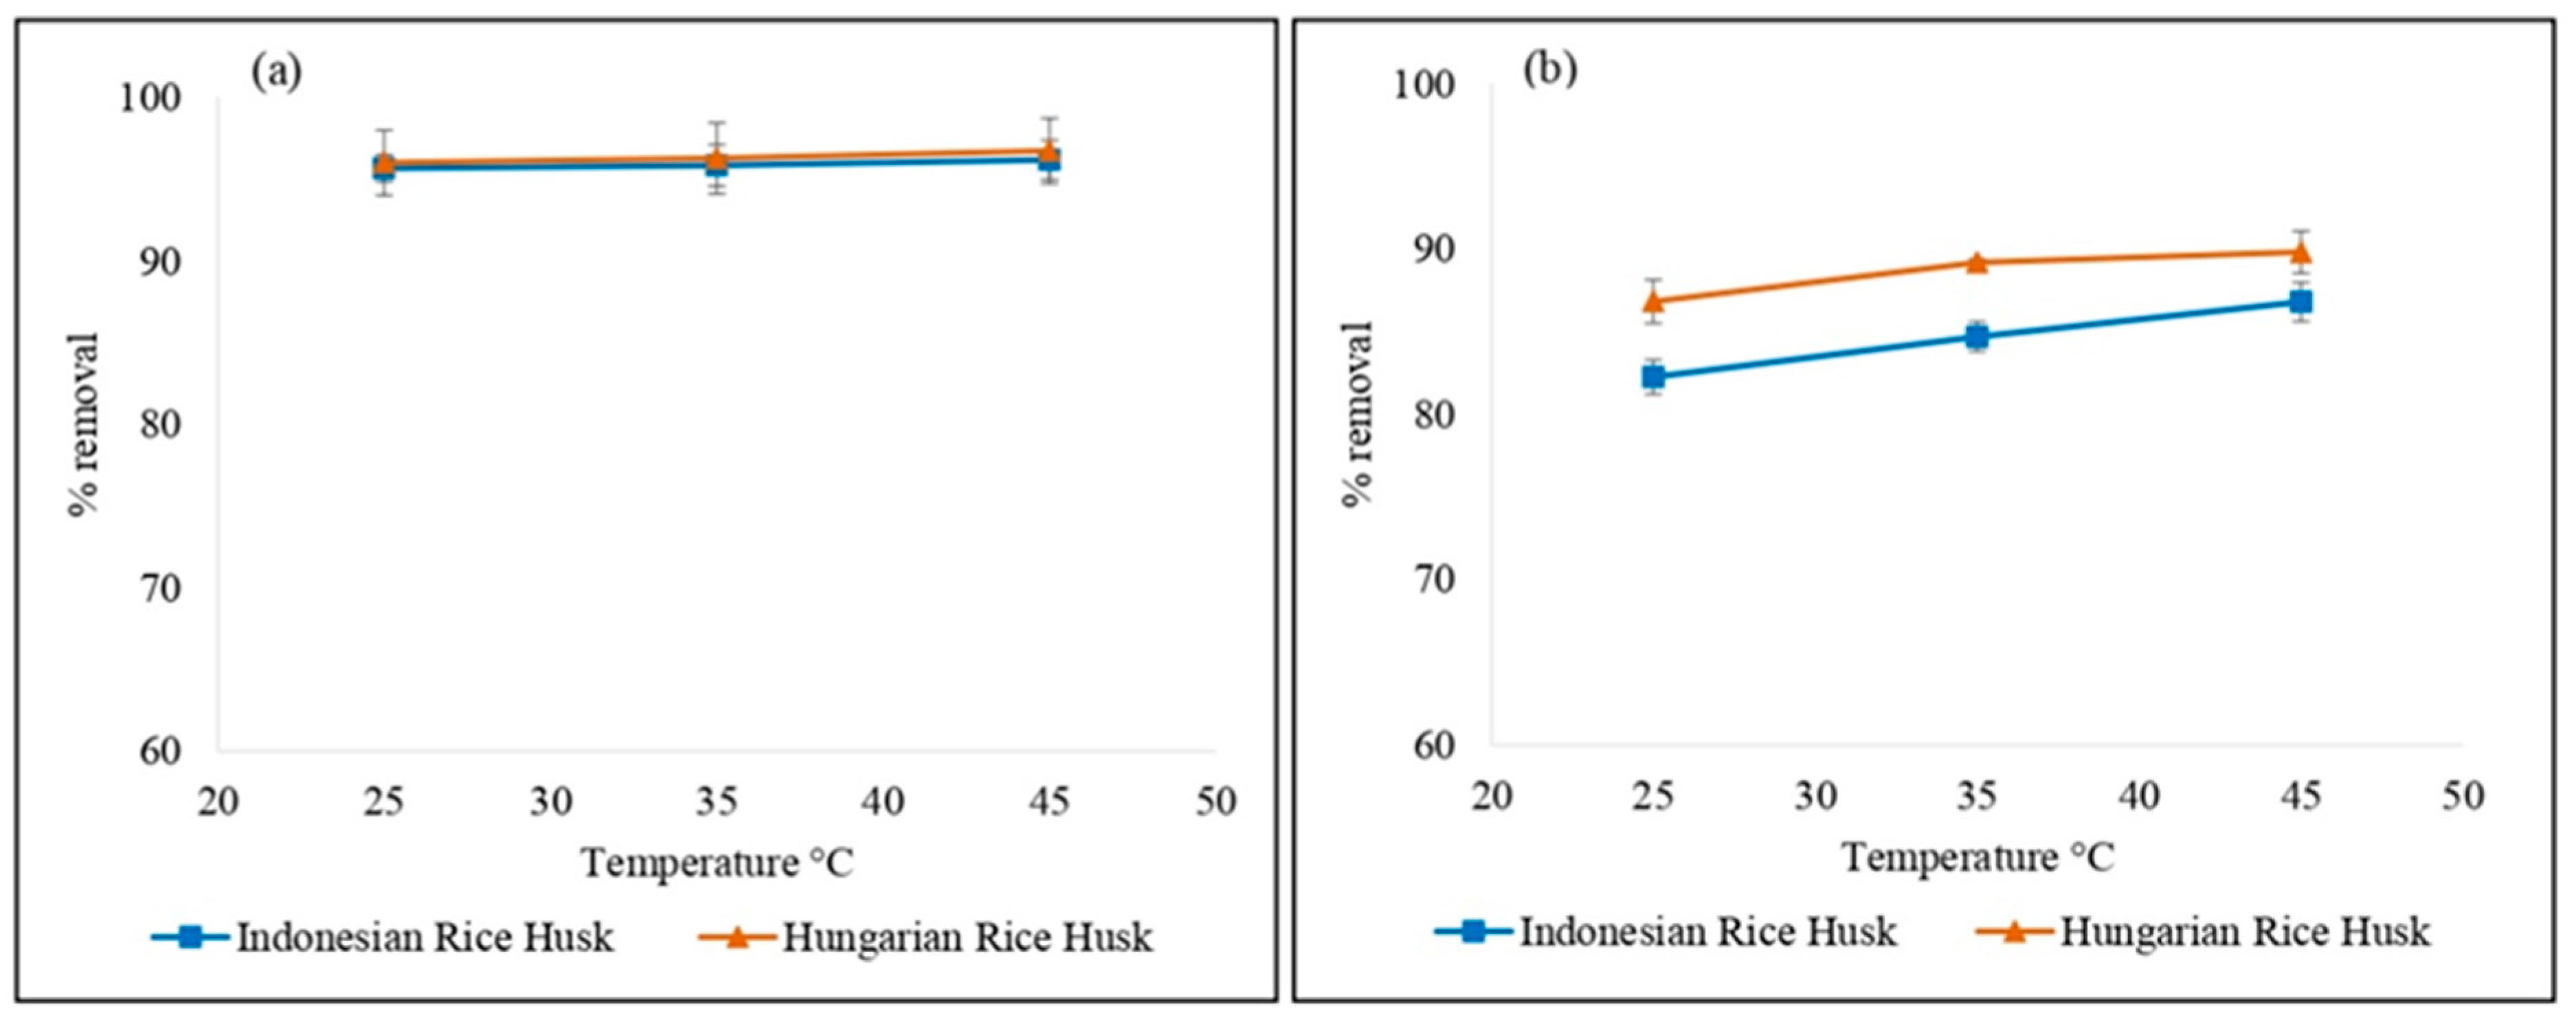
2.7. Effect of Temperature
2.8. FT-IR Analysis
2.9. Adsorption Isotherm
2.10. Adsorption Kinetics
3. Materials and Methods
3.1. Preparation of Dye Solutions
3.2. Preparation of Adsorbents
3.3. Characterization of Adsorbents
3.3.1. Chemical Content Analysis
3.3.2. Zeta Potential and Fourier Transform Infrared Spectroscopy (FT-IR) Analyses
3.4. Batch Adsorption Experiments
3.5. Isotherm and Kinetic Studies
4. Conclusions
Author Contributions
Funding
Data Availability Statement
Acknowledgments
Conflicts of Interest
References
- Bhatia, D.; Sharma, N.R.; Singh, J.; Kanwar, R.S. Biological Methods for Textile Dye Removal from Wastewater: A Review. Crit. Rev. Environ. Sci. Technol. 2017, 47, 1836–1876. [Google Scholar] [CrossRef]
- Bhatia, S.C.; Devraj, S. Pollution Control in Textile Industry; WPI Publishing: Delhi, India, 2017; ISBN 1315148587. [Google Scholar]
- Alver, E.; Metin, A.Ü.; Brouers, F. Methylene Blue Adsorption on Magnetic Alginate/Rice Husk Bio-Composite. Int. J. Biol. Macromol. 2020, 154, 104–113. [Google Scholar] [CrossRef] [PubMed]
- Mohammed, M.A.; Shitu, A.; Ibrahim, A. Removal of Methylene Blue Using Low Cost Adsorbent: A Review. Res. J. Chem. Sci. 2014, 4, 91–102. [Google Scholar]
- Phihusut, D.; Chantharat, M. Removal of Methylene Blue Using Agricultural Waste: A Case Study of Rice Husk and Rice Husk Ash from Chaipattana Rice Mill Demonstration Center. Environ. Nat. Resour. J. 2017, 15, 30. [Google Scholar] [CrossRef]
- Duman, O.; Tunç, S.; Gürkan Polat, T. Adsorptive Removal of Triarylmethane Dye (Basic Red 9) from Aqueous Solution by Sepiolite as Effective and Low-Cost Adsorbent. Microporous Mesoporous Mater. 2015, 210, 176–184. [Google Scholar] [CrossRef]
- Lellis, B.; Fávaro-Polonio, C.Z.; Pamphile, J.A.; Polonio, J.C. Effects of Textile Dyes on Health and the Environment and Bioremediation Potential of Living Organisms. Biotechnol. Res. Innov. 2019, 3, 275–290. [Google Scholar] [CrossRef]
- Sivarajasekar, N.; Baskar, R. Adsorption of Basic Red 9 on Activated Waste Gossypium Hirsutum Seeds: Process Modeling, Analysis and Optimization Using Statistical Design. J. Ind. Eng. Chem. 2014, 20, 2699–2709. [Google Scholar] [CrossRef]
- Zhou, Y.; Yao, S.; Ma, Y.; Li, G.; Huo, Q.; Liu, Y. An Anionic Single-Walled Metal-Organic Nanotube with an Armchair (3,3) Topology as an Extremely Smart Adsorbent for the Effective and Selective Adsorption of Cationic Carcinogenic Dyes. Chem. Commun. 2018, 54, 3006–3009. [Google Scholar] [CrossRef]
- Sukmana, H.; Bellahsen, N.; Pantoja, F.; Hodur, C. Adsorption and Coagulation in Wastewater Treatment—Review. Prog. Agric. Eng. Sci. 2021, 17, 49–68. [Google Scholar] [CrossRef]
- Cai, L.; Zhang, Y.; Zhou, Y.; Zhang, X.; Ji, L.; Song, W.; Zhang, H.; Liu, J. Effective Adsorption of Diesel Oil by Crab-Shell-Derived Biochar Nanomaterials. Materials 2019, 12, 236. [Google Scholar] [CrossRef]
- Ali, N.S.; Jabbar, N.M.; Alardhi, S.M.; Majdi, H.S.; Albayati, T.M. Adsorption of Methyl Violet Dye onto a Prepared Bio-Adsorbent from Date Seeds: Isotherm, Kinetics, and Thermodynamic Studies. Heliyon 2022, 8, e10276. [Google Scholar] [CrossRef] [PubMed]
- Thomas, B.; Shilpa, E.P.; Alexander, L.K. Role of Functional Groups and Morphology on the PH-Dependent Adsorption of a Cationic Dye Using Banana Peel, Orange Peel, and Neem Leaf Bio-Adsorbents. Emergent Mater. 2021, 4, 1479–1487. [Google Scholar] [CrossRef]
- Mallampati, R.; Xuanjun, L.; Adin, A.; Valiyaveettil, S. Fruit Peels as Efficient Renewable Adsorbents for Removal of Dissolved Heavy Metals and Dyes from Water. ACS Sustain. Chem. Eng. 2015, 3, 1117–1124. [Google Scholar] [CrossRef]
- Wu, J.; Zhang, T.; Chen, C.; Feng, L.; Su, X.; Zhou, L.; Chen, Y.; Xia, A.; Wang, X. Spent Substrate of Ganodorma Lucidum as a New Bio-Adsorbent for Adsorption of Three Typical Dyes. Bioresour. Technol. 2018, 266, 134–138. [Google Scholar] [CrossRef] [PubMed]
- Hossain, M.A.; Hossain, M.L. Kinetic Study of Malachite Green Adsorption on Used Black Tea Leaves from Aqueous Solution. Int. J. Adv. Res. 2014, 2, 360–374. [Google Scholar]
- Jain, S.; Jayaram, R.V. Removal of Basic Dyes from Aqueous Solution by Low-Cost Adsorbent: Wood Apple Shell (Feronia Acidissima). Desalination 2010, 250, 921–927. [Google Scholar] [CrossRef]
- Ahmaruzzaman, M.; Gupta, V.K. Rice Husk and Its Ash as Low-Cost Adsorbents in Water and Wastewater Treatment. Ind. Eng. Chem. Res. 2011, 50, 13589–13613. [Google Scholar] [CrossRef]
- Matin, A.H.; Khaloo, S.S.; Akbarzadeh, A.; Riahi, M. Comparison of Surface Functional Groups and Metal Uptake Efficiency of Rice Husk Harvested from Different Climatic Zones. Water Sci. Technol. 2012, 65, 1738–1744. [Google Scholar] [CrossRef]
- Gun, M.; Arslan, H.; Saleh, M.; Yalvac, M.; Dizge, N. Optimization of Silica Extraction from Rice Husk Using Response Surface Methodology and Adsorption of Safranin Dye. Int. J. Environ. Res. 2022, 16, 20. [Google Scholar] [CrossRef]
- Paethanom, A.; Yoshikawa, K. Influence of Pyrolysis Temperature on Rice Husk Char Characteristics and Its Tar Adsorption Capability. Energies 2012, 5, 4941–4951. [Google Scholar] [CrossRef]
- Tang, Z.; Wu, C.; Tang, W.; Ma, C.; He, Y.C. A Novel Cetyltrimethylammonium Bromide-Based Deep Eutectic Solvent Pretreatment of Rice Husk to Efficiently Enhance Its Enzymatic Hydrolysis. Bioresour. Technol. 2023, 376, 128806. [Google Scholar] [CrossRef] [PubMed]
- United States Department of Agriculture. Available online: https://apps.fas.usda.gov/psdonline/app/index.html#/app/downloads (accessed on 19 January 2022).
- Khasanah, I.N.; Astuti, K. Harvested Area and Rice Production in Indonesia 2022. Available online: https://www.bps.go.id/publication/2023/08/03/a78164ccd3ad09bdc88e70a2/luas-panen-dan-produksi-padi-di-indonesia-2022.html (accessed on 20 March 2023).
- Khasanah, I.N.; Astuti, K. Harvested Area and Rice Production in Indonesia 2021. Available online: https://www.bps.go.id/publication/2022/07/12/c52d5cebe530c363d0ea4198/luas-panen-dan-produksi-padi-di-indonesia-2021.html (accessed on 19 January 2022).
- Saha, N.; Das, L.; Das, P.; Bhowal, A.; Bhattacharjee, C. Comparative Experimental and Mathematical Analysis on Removal of Dye Using Raw Rice Husk, Rice Husk Charcoal and Activated Rice Husk Charcoal: Batch, Fixed-Bed Column, and Mathematical Modeling. Biomass Convers. Biorefinery 2021, 13, 11023–11040. [Google Scholar] [CrossRef]
- Zou, W.; Li, K.; Bai, H.; Shi, X.; Han, R. Enhanced Cationic Dyes Removal from Aqueous Solution by Oxalic Acid Modified Rice Husk. J. Chem. Eng. Data 2011, 56, 1882–1891. [Google Scholar] [CrossRef]
- TEZCAN, E.B.; CEYLAN, Z.; ACAR, F.N. Kinetics, Isotherm and Thermodynamic Studies of The Adsorption Behavior of Basic Yellow 51 Onto Rice Husk and Burned Rice Husk. J. Inst. Sci. Technol. 2019, 9, 1977–1988. [Google Scholar] [CrossRef]
- Quansah, J.O.; Hlaing, T.; Lyonga, F.N.; Kyi, P.P.; Hong, S.-H.; Lee, C.-G.; Park, S.-J. Nascent Rice Husk as an Adsorbent for Removing Cationic Dyes from Textile Wastewater. Appl. Sci. 2020, 10, 3437. [Google Scholar] [CrossRef]
- Liu, Z.; Khan, T.A.; Islam, M.A.; Tabrez, U. A Review on the Treatment of Dyes in Printing and Dyeing Wastewater by Plant Biomass Carbon. Bioresour. Technol. 2022, 354, 127168. [Google Scholar] [CrossRef]
- Aichour, A.; Zaghouane-Boudiaf, H. Single and Competitive Adsorption Studies of Two Cationic Dyes from Aqueous Mediums onto Cellulose-Based Modified Citrus Peels/Calcium Alginate Composite. Int. J. Biol. Macromol. 2020, 154, 1227–1236. [Google Scholar] [CrossRef]
- Vîrlan, C.; Ciocârlan, R.G.; Roman, T.; Gherca, D.; Cornei, N.; Pui, A. Studies on Adsorption Capacity of Cationic Dyes on Several Magnetic Nanoparticles. Acta Chem. Iasi 2013, 21, 19–30. [Google Scholar] [CrossRef]
- El-Sayed, G.O. Removal of Methylene Blue and Crystal Violet from Aqueous Solutions by Palm Kernel Fiber. Desalination 2011, 272, 225–232. [Google Scholar] [CrossRef]
- Nazari, L.; Sarathy, S.; Santoro, D.; Ho, D.; Ray, M.B.; Xu, C. (Charles) Recent Advances in Energy Recovery from Wastewater Sludge; Elsevier: Kidlington, UK, 2017; ISBN 9780081010297. [Google Scholar]
- de Jong, E.; Gosselink, R.J.A. Lignocellulose-Based Chemical Products; Elsevier: Amsterdam, The Netherlands, 2014; ISBN 9780444595614. [Google Scholar]
- Kumar, A.; Dixit, C.K. Methods for Characterization of Nanoparticles. In Advances in Nanomedicine for the Delivery of Therapeutic Nucleic Acids; Elsevier: Kidlington, UK, 2017; pp. 43–58. [Google Scholar]
- Kumar, P.S.; Pavithra, K.G.; Naushad, M. Characterization Techniques for Nanomaterials. In Nanomaterials for Solar Cell Applications; Elsevier: Amsterdam, The Netherlands, 2019; pp. 97–124. [Google Scholar]
- Yuan, J.H.; Xu, R.K.; Zhang, H. The Forms of Alkalis in the Biochar Produced from Crop Residues at Different Temperatures. Bioresour. Technol. 2011, 102, 3488–3497. [Google Scholar] [CrossRef]
- Chang, S.H.; Lin, H.T.V.; Wu, G.J.; Tsai, G.J. PH Effects on Solubility, Zeta Potential, and Correlation between Antibacterial Activity and Molecular Weight of Chitosan. Carbohydr. Polym. 2015, 134, 74–81. [Google Scholar] [CrossRef] [PubMed]
- Pathiraja, G.C.; De Silva, D.K.; Dhanapala, L.; Nanayakkara, N. Investigating the Surface Characteristics of Chemically Modified and Unmodified Rice Husk Ash; Bottom-up Approach for Adsorptive Removal of Water Contaminants. Desalin. Water Treat. 2015, 54, 547–556. [Google Scholar] [CrossRef]
- Huang, W.; Liu, Z. Biosorption of Cd(II)/Pb(II) from Aqueous Solution by Biosurfactant-Producing Bacteria: Isotherm Kinetic Characteristic and Mechanism Studies. Colloids Surf. B Biointerfaces 2013, 105, 113–119. [Google Scholar] [CrossRef] [PubMed]
- Labaran, A.N.; Zango, Z.U.; Armaya’u, U.; Garba, Z.N. Rice Husk as Biosorbent for the Adsorption of Methylene Blue. Sci. World J. 2019, 14, 66–70. [Google Scholar]
- Huang, X.Y.; Bu, H.T.; Jiang, G.B.; Zeng, M.H. Cross-Linked Succinyl Chitosan as an Adsorbent for the Removal of Methylene Blue from Aqueous Solution. Int. J. Biol. Macromol. 2011, 49, 643–651. [Google Scholar] [CrossRef]
- Hassan, H.M.A.; El-Aassar, M.R.; El-Hashemy, M.A.; Betiha, M.A.; Alzaid, M.; Alqhobisi, A.N.; Alzarea, L.A.; Alsohaimi, I.H. Sulfanilic Acid-Functionalized Magnetic GO as a Robust Adsorbent for the Efficient Adsorption of Methylene Blue from Aqueous Solution. J. Mol. Liq. 2022, 361, 119603. [Google Scholar] [CrossRef]
- Kizito, S.; Wu, S.; Kirui, W.K.; Lei, M.; Lu, Q.; Bah, H.; Dong, R. Evaluation of Slow Pyrolyzed Wood and Rice Husks Biochar for Adsorption of Ammonium Nitrogen from Piggery Manure Anaerobic Digestate Slurry. Sci. Total Environ. 2015, 505, 102–112. [Google Scholar] [CrossRef]
- Hameed, B.H.; Ahmad, A.A. Batch Adsorption of Methylene Blue from Aqueous Solution by Garlic Peel, an Agricultural Waste Biomass. J. Hazard. Mater. 2009, 164, 870–875. [Google Scholar] [CrossRef]
- Bellahsen, N.; Varga, G.; Halyag, N.; Kertész, S.; Tombácz, E.; Hodúr, C. Pomegranate Peel as a New Low-Cost Adsorbent for Ammonium Removal. Int. J. Environ. Sci. Technol. 2021, 18, 711–722. [Google Scholar] [CrossRef]
- Afroze, S.; Sen, T.K.; Ang, H.M. Adsorption Removal of Zinc (II) from Aqueous Phase by Raw and Base Modified Eucalyptus Sheathiana Bark: Kinetics, Mechanism and Equilibrium Study. Process Saf. Environ. Prot. 2016, 102, 336–352. [Google Scholar] [CrossRef]
- Ismail, Z.Z.; Hameed, B.B. Recycling of Raw Corn Cob Residues as an Agricultural Waste Material for Ammonium Removal: Kinetics, Isotherms, and Mechanisms. Int. J. Environ. Waste Manag. 2014, 13, 217–230. [Google Scholar] [CrossRef]
- Patil, M.A.; Shinde, P.J.K.; Jadhav, A.L.; Deshpande, S.R. Adsorption of Methylene Blue in Waste Water by Low Cost Adsorbent Rice Husk. Int. J. Eng. Res. Technol. 2017, 10, 246–252. [Google Scholar]
- Ariffin, N.; Abdullah, M.M.A.B.; Mohd Arif Zainol, M.R.R.; Murshed, M.F.; Hariz-Zain; Faris, M.A.; Bayuaji, R. Review on Adsorption of Heavy Metal in Wastewater by Using Geopolymer. MATEC Web Conf. 2017, 97, 01023. [Google Scholar] [CrossRef]
- Lima, É.C.; Adebayo, M.A.; Machado, F.M. Kinetic and Equilibrium Models of Adsorption. In Carbon Nanomaterials as Adsorbents for Environmental and Biological Applications; Springer International Publishing: Cham, Switzerland, 2015; pp. 33–69. [Google Scholar]
- Sulyman, M.; Namiesnik, J.; Gierak, A. Low-Cost Adsorbents Derived from Agricultural By-Products/Wastes for Enhancing Contaminant Uptakes from Wastewater: A Review. Polish J. Environ. Stud. 2017, 26, 479–510. [Google Scholar] [CrossRef]
- Gohr, M.S.; Abd-Elhamid, A.I.; El-Shanshory, A.A.; Soliman, H.M.A. Adsorption of Cationic Dyes onto Chemically Modified Activated Carbon: Kinetics and Thermodynamic Study. J. Mol. Liq. 2022, 346, 118227. [Google Scholar] [CrossRef]
- Worch, E. Adsorption Technology in Water Treatment; Walter de Gruyter GmbH & Co KG: Berlin, Germany, 2012; ISBN 9783110240221. [Google Scholar]
- Zhao, Y.H.; Geng, J.T.; Cai, J.C.; Cai, Y.F.; Cao, C.Y. Adsorption Performance of Basic Fuchsin on Alkali-Activated Diatomite. Adsorpt. Sci. Technol. 2020, 38, 151–167. [Google Scholar] [CrossRef]
- Hodúr, C.; Bellahsen, N.; Mikó, E.; Nagypál, V.; Šereš, Z.; Kertész, S. The Adsorption of Ammonium Nitrogen from Milking Parlor Wastewater Using Pomegranate Peel Powder for Sustainable Water, Resources, and Waste Management. Sustainability 2020, 12, 4880. [Google Scholar] [CrossRef]
- Genieva, S.D.; Turmanova, S.C.; Dimitrova, A.S.; Vlaev, L.T. Characterization of Rice Husks and the Products of Its Thermal Degradation in Air or Nitrogen Atmosphere. J. Therm. Anal. Calorim. 2008, 93, 387–396. [Google Scholar] [CrossRef]
- Ovchinnikov, O.V.; Evtukhova, A.V.; Kondratenko, T.S.; Smirnov, M.S.; Khokhlov, V.Y.; Erina, O.V. Manifestation of Intermolecular Interactions in FTIR Spectra of Methylene Blue Molecules. Vib. Spectrosc. 2016, 86, 181–189. [Google Scholar] [CrossRef]
- Giles, C.H.; Smith, D. A General Treatment and Classification of the Solute Adsorption Isotherm. Dep. Math. Univ. Strat. Glas. G1 Scotl. 1973, 47, 755–765. [Google Scholar]
- Ghosh, A.K.; Mukerjee, P.; Ghosh, A.K.; Mukerjee, P.; Ghosh, A.K.; Mukerjee, P. Multiple Association Equilibria in the Self-Association of Methylene Blue and Other Dyes. J. Am. Chem. Soc. 1970, 92, 6408–6412. [Google Scholar] [CrossRef]
- Li, H.; Cao, X.; Zhang, C.; Yu, Q.; Zhao, Z.; Niu, X.; Sun, X.; Liu, Y.; Ma, L.; Li, Z. Enhanced Adsorptive Removal of Anionic and Cationic Dyes from Single or Mixed Dye Solutions Using MOF PCN-222. RSC Adv. 2017, 7, 16273–16281. [Google Scholar] [CrossRef]
- Fujita, K.; Taniguchi, K.; Ohno, H. Dynamic Analysis of Aggregation of Methylene Blue with Polarized Optical Waveguide Spectroscopy. Talanta 2005, 65, 1066–1070. [Google Scholar] [CrossRef] [PubMed]
- Karimi Goftar, M.; Moradi, K.; Kor, N.M. Spectroscopic Studies on Aggregation Phenomena of Dyes. Eur. J. Exp. Biol. 2014, 4, 72–81. [Google Scholar]
- Fernández-Pérez, A.; Valdés-Solís, T.; Marbán, G. Visible Light Spectroscopic Analysis of Methylene Blue in Water; the Resonance Virtual Equilibrium Hypothesis. Dye. Pigment. 2019, 161, 448–456. [Google Scholar] [CrossRef]
- Fernandez-Perez, A.; Marban, G. Visible Light Spectroscopic Analysis of Methylene Blue in Water; What Comes after Dimer? ACS Omega 2020, 5, 29801–29815. [Google Scholar] [CrossRef]
- Morgounova, E.; Shao, Q.; Hackel, B.J.; Thomas, D.D.; Ashkenazi, S. Photoacoustic Lifetime Contrast between Methylene Blue Monomers and Self-Quenched Dimers as a Model for Dual-Labeled Activatable Probes. J. Biomed. Opt. 2013, 18, 056004. [Google Scholar] [CrossRef]
- Pathrose, B.; Nampoori, V.P.N.; Radhakrishnan, P.; Mujeeb, A. Measurement of Absolute Fluorescence Quantum Yield of Basic Fuchsin Solution Using a Dual-Beam Thermal Lens Technique. J. Fluoresc. 2014, 24, 895–898. [Google Scholar] [CrossRef]
- Harkins, W.D.; Jura, G. Surfaces of Solids. XI. Determination of Decrease (Pi) of Free Surface Energy of a Solid by Adsorbed Film. J. Am. Chem. Soc. 1944, 66, 1356–1362. [Google Scholar]
- Hadi, M.; Samarghandi, M.R.; McKay, G. Equilibrium Two-Parameter Isotherms of Acid Dyes Sorption by Activated Carbons: Study of Residual Errors. Chem. Eng. J. 2010, 160, 408–416. [Google Scholar] [CrossRef]
- Foo, K.Y.; Hameed, B.H. Insights into the Modeling of Adsorption Isotherm Systems. Chem. Eng. J. 2010, 156, 2–10. [Google Scholar] [CrossRef]
- Al-Ghouti, M.A.; Da’ana, D.A. Guidelines for the Use and Interpretation of Adsorption Isotherm Models: A Review. J. Hazard. Mater. 2020, 393, 122383. [Google Scholar] [CrossRef] [PubMed]
- Ebadi, A.; Soltan Mohammadzadeh, J.S.; Khudiev, A. What Is the Correct Form of BET Isotherm for Modeling Liquid Phase Adsorption? Adsorption 2009, 15, 65–73. [Google Scholar] [CrossRef]
- Vargas, V.H.; Paveglio, R.R.; Pauletto, P.d.S.; Salau, N.P.G.; Dotto, L.G. Sisal Fiber as an Alternative and Cost-Effective Adsorbent for the Removal of Methylene Blue and Reactive Black 5 Dyes from Aqueous Solutions. Chem. Eng. Commun. 2020, 207, 523–536. [Google Scholar] [CrossRef]
- Côrtes, L.N.; Druzian, S.P.; Streit, A.F.M.; Godinho, M.; Perondi, D.; Collazzo, G.C.; Oliveira, M.L.S.; Cadaval, T.R.S.; Dotto, G.L. Biochars from Animal Wastes as Alternative Materials to Treat Colored Effluents Containing Basic Red 9. J. Environ. Chem. Eng. 2019, 7, 103446. [Google Scholar] [CrossRef]
- Sharma, P.; Kaur, R.; Baskar, C.; Chung, W.-J. Removal of Methylene Blue from Aqueous Waste Using Rice Husk and Rice Husk Ash. Desalination 2010, 259, 249–257. [Google Scholar] [CrossRef]
- Razak, N.H.; Hazmi, F.A.; Tahrim, A.A. Comparative Adsorption Studies by Using Low Cost Adsorbents of Rice Husk and Rice Husk Ash on Methylene Blue Dye Removal. J. Eng. Technol. 2013, 4, 40–48. [Google Scholar]
- Suresh Kumar, P.; Korving, L.; Keesman, K.J.; van Loosdrecht, M.C.M.; Witkamp, G.J. Effect of Pore Size Distribution and Particle Size of Porous Metal Oxides on Phosphate Adsorption Capacity and Kinetics. Chem. Eng. J. 2019, 358, 160–169. [Google Scholar] [CrossRef]
- Kazembeigi, F.; Arezoomand, H.R.S.; Faraji, H.; Mazloomi, S.; Mohammadi, F.; Moghadam, F.M.; Khoshneyat, R.; Nikonahad, A.; Nourmoradi, H. Removal of Methylene Blue from Aqueous Solutions Using Raw and Modified Rice Husk. Veliger 2014, 53, 1–7. [Google Scholar] [CrossRef]
- Franco, D.S.P.; Tanabe, E.H.; Bertuol, D.A.; Dos Reis, G.S.; Lima, É.C.; Dotto, G.L. Alternative Treatments to Improve the Potential of Rice Husk as Adsorbent for Methylene Blue. Water Sci. Technol. 2017, 75, 296–305. [Google Scholar] [CrossRef]
- Chandrasekhar, S.; Satyanarayana, K.G.; Pramada, P.N.; Raghavan, P.; Gupta, T.N. Processing, Properties and Applications of Reactive Silica from Rice Husk—An Overview. J. Mater. Sci. 2003, 38, 3159–3168. [Google Scholar] [CrossRef]
- Kong, J.; Huang, L.; Yue, Q.; Gao, B. Preparation of Activated Carbon Derived from Leather Waste by H3PO4 Activation and Its Application for Basic Fuchsin Adsorption. Desalin. Water Treat. 2014, 52, 2440–2449. [Google Scholar] [CrossRef]
- Kizilkaya, B. Usage of Biogenic Apatite (Fish Bones) on Removal of Basic Fuchsin Dye from Aqueous Solution. J. Dispers. Sci. Technol. 2012, 33, 1596–1602. [Google Scholar] [CrossRef]
- Oyelude, E.O.; Frimpong, F.; Dawson, D. Studies on the Removal of Basic Fuchsin Dye from Aqueous Solution by HCl Treated Malted Sorghum Mash. J. Mater. Environ. Sci. 2015, 6, 1126–1136. [Google Scholar]
- Al-Gheethi, A.A.S.; Mohamed, R.M.S.R.; Noman, E.A.; Kassim, A.H.M. Prospects of Fresh Market Wastes Management in Developing Countries; Al-Gheethi, A.A.S., Radin Mohamed, R.M.S., Noman, E.A., Mohd Kassim, A.H., Eds.; Water Science and Technology Library; Springer International Publishing: Cham, Switzerland, 2020; Volume 92, ISBN 978-3-030-42640-8. [Google Scholar]
- Li, C.; He, Y.; Zhou, L.; Xu, T.; Hu, J.; Peng, C.; Liu, H. Fast Adsorption of Methylene Blue, Basic Fuchsin, and Malachite Green by a Novel Sulfonic-Grafted Triptycene-Based Porous Organic Polymer. RSC Adv. 2018, 8, 41986–41993. [Google Scholar] [CrossRef]
- El-Azazy, M.; El-Shafie, A.S.; Ashraf, A.; Issa, A.A. Eco-Structured Biosorptive Removal of Basic Fuchsin Using Pistachio Nutshells: A Definitive Screening Design-Based Approach. Appl. Sci. 2019, 9, 24855. [Google Scholar] [CrossRef]
- Bessashia, W.; Berredjem, Y.; Hattab, Z.; Bououdina, M. Removal of Basic Fuchsin from Water by Using Mussel Powdered Eggshell Membrane as Novel Bioadsorbent: Equilibrium, Kinetics, and Thermodynamic Studies. Environ. Res. 2020, 186, 109484. [Google Scholar] [CrossRef]
- Naji, S.I.; Jasim, K.K. Adsorption Study of Basic Fuchsin Dye on the Astragalus Root Surface in Al-Muthanna Province. Syst. Rev. Pharm. 2021, 12, 850–857. [Google Scholar]
- Anastopoulos, I.; Karamesouti, M.; Mitropoulos, A.C.; Kyzas, G.Z. A Review for Coffee Adsorbents. J. Mol. Liq. 2017, 229, 555–565. [Google Scholar] [CrossRef]
- Lagergren, S. Zur Theorie Der Sogenannten Adsorption Gelöster Stoffe (Theory of Adsorption Substances from Solution). K. Sven. Vetenskapsakademiens Handl. 1898, 24, 1–39. [Google Scholar]
- Ho, Y.S.; McKay, G. Pseudo-Second Order Model for Sorption Processes. Process Biochem. 1999, 34, 451–465. [Google Scholar] [CrossRef]
- Liu, S.; Ge, H.; Cheng, S.; Zou, Y. Green Synthesis of Magnetic 3D Bio-Adsorbent by Corn Straw Core and Chitosan for Methylene Blue Removal. Environ. Technol. 2020, 41, 2109–2121. [Google Scholar] [CrossRef] [PubMed]
- Qiu, H.; Lv, L.; Pan, B.C.; Zhang, Q.J.; Zhang, W.M.; Zhang, Q.X. Critical Review in Adsorption Kinetic Models. J. Zhejiang Univ. Sci. A 2009, 10, 716–724. [Google Scholar] [CrossRef]
- Guo, H.; Bi, C.; Zeng, C.; Ma, W.; Yan, L.; Li, K.; Wei, K. Camellia Oleifera Seed Shell Carbon as an Efficient Renewable Bio-Adsorbent for the Adsorption Removal of Hexavalent Chromium and Methylene Blue from Aqueous Solution. J. Mol. Liq. 2018, 249, 629–636. [Google Scholar] [CrossRef]
- Olivito, F.; Algieri, V.; Jiritano, A.; Tallarida, M.A.; Tursi, A.; Costanzo, P.; Maiuolo, L.; De Nino, A. Cellulose Citrate: A Convenient and Reusable Bio-Adsorbent for Effective Removal of Methylene Blue Dye from Artificially Contaminated Water. RSC Adv. 2021, 11, 34309–34318. [Google Scholar] [CrossRef]
- Yu, J.X.; Wang, L.Y.; Chi, R.A.; Zhang, Y.F.; Xu, Z.G.; Guo, J. Removal of Cationic Dyes: Basic Magenta and Methylene Blue from Aqueous Solution by Adsorption on Modified Loofah. Res. Chem. Intermed. 2013, 39, 3775–3790. [Google Scholar] [CrossRef]
- Hubbe, M.A.; Azizian, S.; Douven, S. Implications of Apparent Pseudo-Second-Order Adsorption Kinetics onto Cellulosic Materials: Review. BioResources 2019, 14, 7582–7626. [Google Scholar] [CrossRef]
- Liu, F.; Kollippara Venkata Sai, K.C.; Zhang, W. Conversion of Spiky Sweetgum Tree (Liquidambar Styraciflua) Seeds as into Bio-Adsorbent: Static and Dynamic Adsorption Assessment. J. Hazard. Mater. Adv. 2021, 1, 100001. [Google Scholar] [CrossRef]
- Mahyati; Patong, A.R.; Djide, M.N.; Taba, D.P. Biodegradation of Lignin From Corn Cob By Using A Mixture of Phanerochaete Chrysosporium, Lentinus Edodes And Pleurotus Ostreatus. Int. J. Sci. Technol. 2013, 2, 3–7. [Google Scholar]


| Absorption Peak (cm−1) | ||||||
|---|---|---|---|---|---|---|
| IRH | HRH | IRH + MB | HRH + MB | IRH + BR9 | HRH + BR9 | Assignment |
| 3427 | 3411 | 3407 | 3444 | 3399 | 3382 | O–H and N–H |
| 2929 | 2925 | 2925 | 2933 | 2921 | 2933 | C-H, –CH3 or –CH2 |
| 1736 | 1735 | - | - | - | - | C=O |
| 1646 | 1654 | - | - | - | - | O–H |
| - | - | 1605 | 1605 | 1593 | 1519 | C=N and C=O |
| - | - | 1335 | 1331 | - | - | C–N |
| - | - | - | - | 1164 | 1168 | C–N |
| 1102 | 1099 | - | - | - | - | Si–O–Si |
| 804 | 800 | - | - | - | - | Si–O |
| Isotherm Model | Parameter | IRH | HRH | ||
|---|---|---|---|---|---|
| MB | BR9 | MB | BR9 | ||
| Harkins–Jura | A | 26.38 | 10.32 | 39.37 | 12.85 |
| B | 1.20 | 1.18 | 1.30 | 1.18 | |
| R2 | 0.960 | 0.974 | 0.970 | 0.963 | |
| χ2 | 0.28 | 0.18 | 0.20 | 0.25 | |
| BET | Qm (mg/g) | 15.02 | 7.27 | 24.50 | 8.32 |
| KL | 0.08 | 0.07 | 0.07 | 0.07 | |
| KS | 4.78 | 983.02 | 1.10 | 114.40 | |
| R2 | 0.979 | 0.995 | 0.981 | 0.989 | |
| χ2 | 0.14 | 0.04 | 0.13 | 0.08 | |
| No | Origins | Adsorption Capacity (mg/g) | Particle Size | pH | References |
|---|---|---|---|---|---|
| 1 | India | 1347.7 | 400–841 µm | 7 | [76] |
| 2 | China | 19.7 | 0.425–0.850 mm | 7 | [27] |
| 3 | Malaysia | 1.6 | NA | 5.8 | [77] |
| 4 | Iran | 24.7 | <250 µm | 10 | [79] |
| 5 | Brazil | 52.2 | 5 mm | 11 | [80] |
| 6 | Thailand | 21.9 | <400 µm | 5.7–6.2 | [5] |
| 7 | Nigeria | 13.5 | NA | 10 | [42] |
| 8 | Korea | 25.4 | 0.075–1.16 mm | 7 | [29] |
| 9 | Indonesia | 15.0 | <250 µm | 10 | This study |
| 10 | Hungary | 24.5 | <250 µm | 10 | This study |
| No | Adsorbent | Adsorption Capacity (mg/g) | pH | References |
|---|---|---|---|---|
| 1 | Fish Bones | 14.8 | 7 | [83] |
| 2 | Activated Gossypium Hirsutum Seeds | 67.1 | 8 | [8] |
| 3 | Leather Activated Carbon | 139.3 | 8 | [82] |
| 4 | Malted Sorghum Mash | 58.5 | 4–9 | [84] |
| 5 | Triptycene-Based Porous Polymer | 586.2 | 2–9 | [85] |
| 6 | Multi-Walled Carbon Nanotubes | 55.5 | 8 | [86] |
| 7 | Pistachio Nut Shells | 118.2 | 12 | [87] |
| 8 | Alkali-Activated Diatomite | 9.8 | 9 | [56] |
| 9 | Eggshell Membrane | 48.0 | 6 | [88] |
| 10 | Astragalus Root | 20.2 | 10 | [89] |
| 11 | Indonesian Rice Husk | 7.2 | 7 | This study |
| 12 | Hungarian Rice Husk | 8.3 | 7 | This study |
| Kinetic Model | Parameter | IRH | HRH | ||
|---|---|---|---|---|---|
| MB | BR9 | MB | BR9 | ||
| Pseudo-first order | qe (mg/g) | 14.19 | 11.83 | 14.20 | 12.38 |
| k1 | 0.61 | 0.43 | 0.54 | 0.41 | |
| R2 | 0.637 | 0.474 | 0.666 | 0.736 | |
| χ2 | 0.001 | 0.01 | 0.003 | 0.01 | |
| Pseudo-second order | qe (mg/g) | 14.32 | 12.13 | 14.38 | 12.71 |
| k2 | 0.23 | 0.1 | 0.16 | 0.08 | |
| R2 | 0.945 | 0.825 | 0.956 | 0.921 | |
| χ2 | 0.0002 | 0.005 | 0.0004 | 0.004 | |
Disclaimer/Publisher’s Note: The statements, opinions and data contained in all publications are solely those of the individual author(s) and contributor(s) and not of MDPI and/or the editor(s). MDPI and/or the editor(s) disclaim responsibility for any injury to people or property resulting from any ideas, methods, instructions or products referred to in the content. |
© 2023 by the authors. Licensee MDPI, Basel, Switzerland. This article is an open access article distributed under the terms and conditions of the Creative Commons Attribution (CC BY) license (https://creativecommons.org/licenses/by/4.0/).
Share and Cite
Sukmana, H.; Tombácz, E.; Ballai, G.; Kozma, G.; Kónya, Z.; Hodúr, C. Comparative Study of Adsorption of Methylene Blue and Basic Red 9 Using Rice Husks of Different Origins. Recycling 2023, 8, 74. https://doi.org/10.3390/recycling8050074
Sukmana H, Tombácz E, Ballai G, Kozma G, Kónya Z, Hodúr C. Comparative Study of Adsorption of Methylene Blue and Basic Red 9 Using Rice Husks of Different Origins. Recycling. 2023; 8(5):74. https://doi.org/10.3390/recycling8050074
Chicago/Turabian StyleSukmana, Hadid, Etelka Tombácz, Gergő Ballai, Gábor Kozma, Zoltán Kónya, and Cecilia Hodúr. 2023. "Comparative Study of Adsorption of Methylene Blue and Basic Red 9 Using Rice Husks of Different Origins" Recycling 8, no. 5: 74. https://doi.org/10.3390/recycling8050074
APA StyleSukmana, H., Tombácz, E., Ballai, G., Kozma, G., Kónya, Z., & Hodúr, C. (2023). Comparative Study of Adsorption of Methylene Blue and Basic Red 9 Using Rice Husks of Different Origins. Recycling, 8(5), 74. https://doi.org/10.3390/recycling8050074