Abstract
Ferronickel slag is a by-product of nickel smelting that provides an abundant silica source. Based on data, every ton of nickel production is equal to eight tons of ferronickel slag production, increasing without any recycling process. It is essential to create an end-to-end process for nickel production and its by-products because this would be a problem in the future and is relevant for many industrialized countries. This study describes a strategy to process ferronickel slag to produce silica. A pyrometallurgy–hydrometallurgy process and ferronickel slag were used to increase the silica content. The process was conducted through alkali fusion; the ferronickel slag was mixed with sodium carbonate at a temperature of 1000 °C for an hour and continued via leaching, precipitation, and cleaning processes. The leaching process was conducted with four concentrations (4 M, 6 M, 8 M, and 10 M) of sodium hydroxide and three different leaching durations (2 h, 4 h, and 6 h). Using hydrochloric acid (HCl) at pH 2 and deionized (DI) water cleaning, the precipitation process was adopted to synthesize a silica powder with the lowest agglomeration and enhance its purity. Characterization was carried out using X-ray Diffraction (XRD), Scanning Electron Microscopy–Energy-Dispersive Emission (SEM-EDS), X-ray Fluorescence (XRF), and Inductively Coupled Plasma–Optical Emission Spectroscopy (ICP-OES). This study highlighted silica characteristics that indicate high recovery by 85% through alkali fusion, HCl leaching, precipitation, and deionized water cleaning.
1. Introduction
The discovery of the beneficial applications and characteristics of silica is attractive given its ability to reinforce mechanical strength [1], its bio-applications [2,3,4], and its potential for energy storage [5], bioremediation [6], construction materials [7,8,9], renewable energy materials [10], and electricity insulation [11]. The recent development of silica characteristics in industries shows that the particles range from microns to the nanoscale have better properties and improved quality. However, it requires a high-cost process, and the high energy required is a major concern for silica production. In terms of primary conditions, a method for silica production was first reported by the hydrolysis of tetraethyl orthosilicate (TEOS) [12]. Unfortunately, this led to limited commercial use since it requires a high-cost precursor. Further development has shown that sodium silicate solution (SSS) is another low-cost precursor that can be used to synthesize silica particles. Silica particles are precipitated from sodium silica solutions by using acids such as hydrochloric acid (HCl) [13,14] and nitric acid (HNO3) [15] as precipitation agents.
According to the Ministry of Energy and Mineral Resources of Indonesia, the nickel industry produces molten nickel and ferronickel slag during smelting and, on average, accounts for 2.4 million tons of ferronickel [16]. The production of each ton of ferronickel generates 8 tons of slag [17]. This means that the ferronickel slag output in 2019 was approximately 19.2 million tons as a by-product. Indonesia and many other countries face a critical challenge in mitigating the environmental issues caused by ferronickel slag and increasing its quality for value-added materials. Ferronickel slag mainly contains silica (SiO2) and other metallic impurities [17].
The main objective of this paper is to explore how to optimize and synthesize silica extraction from ferronickel slag and how to maximize the cleaning efficiency during water leaching. Although many researchers are working on the synthesis of silica, very few researchers have reported optimized silica extraction from ferronickel slag as a low-cost raw material and the enhancement of its cleaning efficiency to achieve high purity. Direct leaching using NaOH solution to obtain ferronickel slag resulted in approximately 30% silica extraction [17]. This might be caused by the complex phases of ferronickel slag, which must be decomposed beforehand. For a low-cost synthesis precursor of silica, the extraction process was conducted through alkali fusion, which includes the use of ferronickel slag along with sodium carbonate (Na2CO3) at a high temperature; this was studied to produce a water-soluble sodium silicate phase [18,19] that subsequently can be separated by a water leaching process. Alkali roasting followed by water leaching was carried out to extract a pregnant silicon solution [20]. Although sodium silicate was formed, magnesium silicate, however, also existed [18,19]. This could decrease the recovery of silicate from ferronickel slag. Therefore, alkali roasting by Na2CO3 addition followed by sodium hydroxide leaching was conducted in this study, instead of a water leaching process, to increase the silica extraction from ferronickel slag through the dissolution of the remaining silicate compound in the alkali-roasted product. Moreover, a cleaning process was conducted to produce high-purity silica.
2. Results and Discussion
2.1. Characterization of Roasted Product
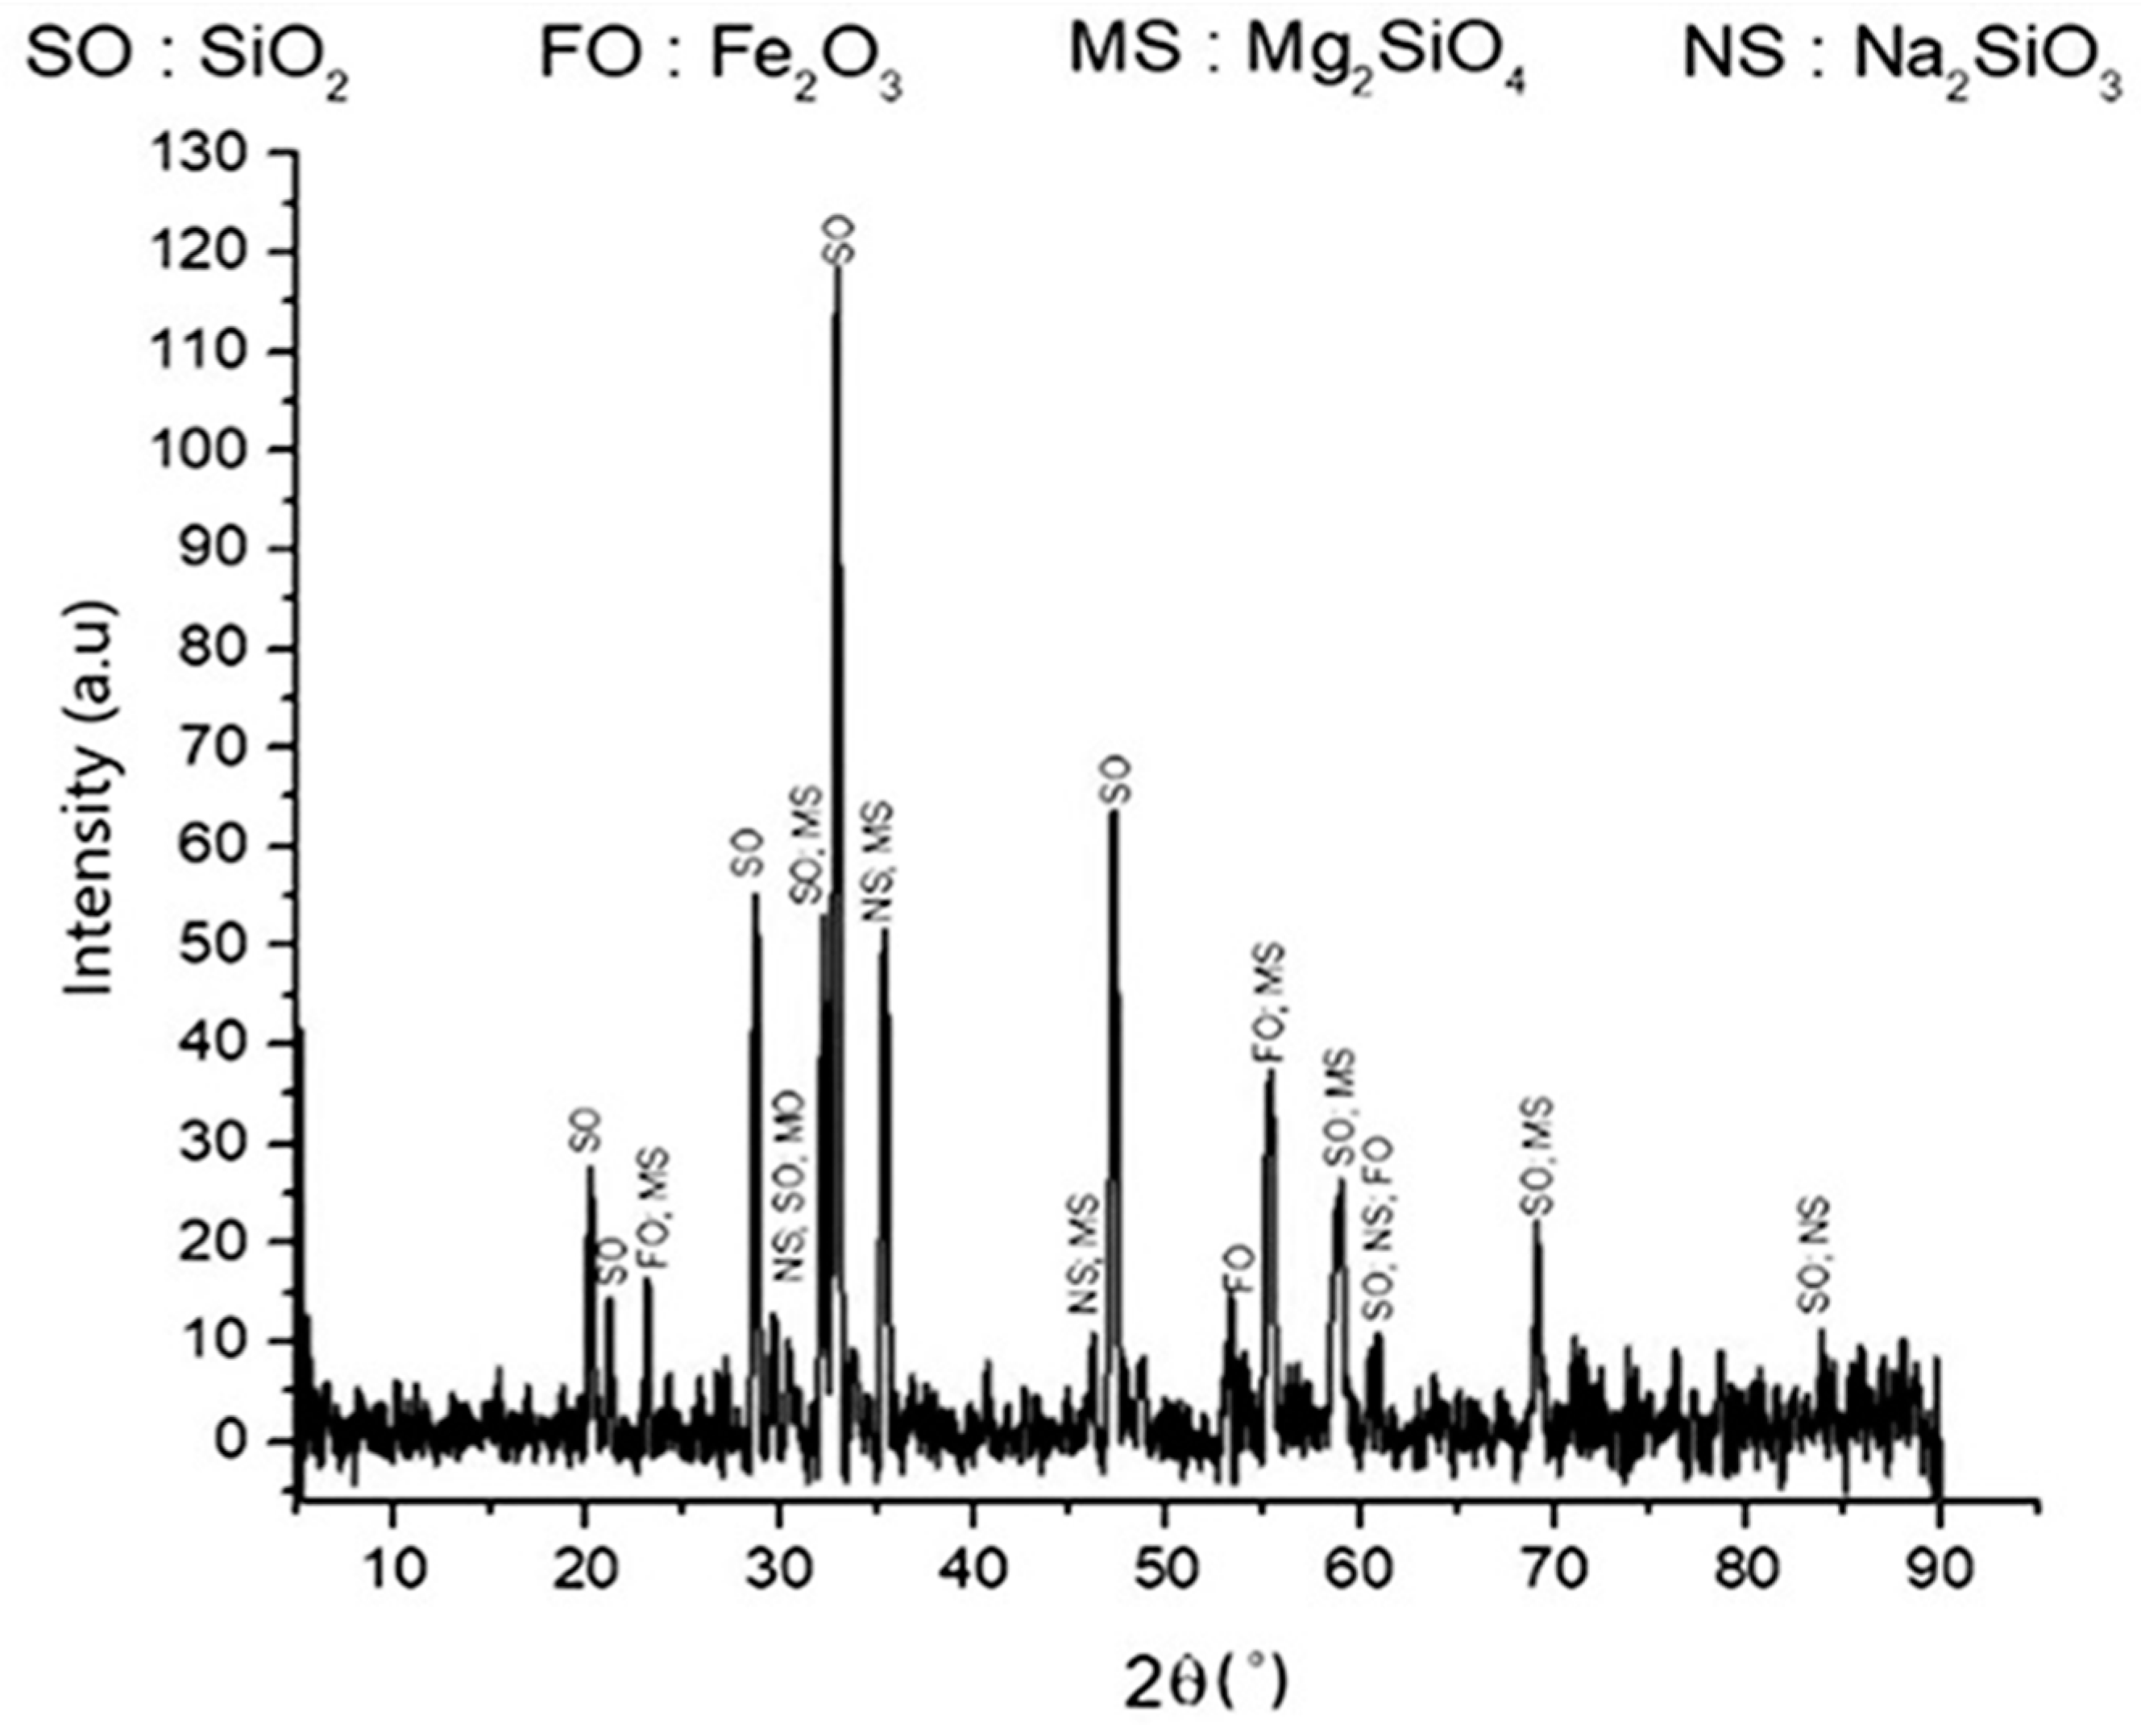
Figure 1 shows the XRD patterns of the roasted product. The crystalline peaks of quartz (SiO2), sodium silicate (Na2SiO3), forsterite (Mg2SiO4), and hematite (Fe2O3) can be seen in the roasted product, which shows the effect of Na2CO3 addition. This result is supported by a previous study [21]. A slight qualitative change from the initial slag to the roasted product in some compounds was observed, such as for fayalite, hematite, and silica. In the roasted product, fayalite was no longer detected, and it was indicated that fayalite did not change into other compounds. However, forsterite and quartz remained, which showed that the decomposition process could not transform the overall silicate phases into sodium silicate.
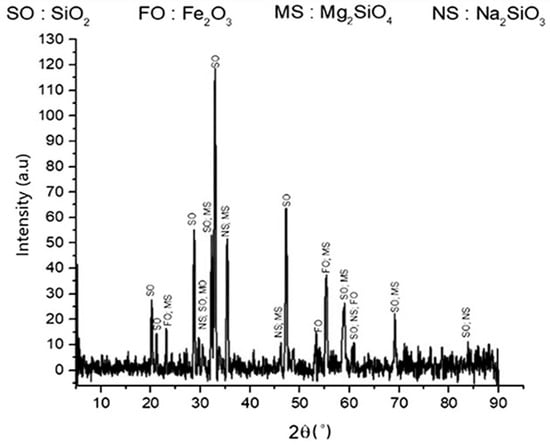
Figure 1.
XRD pattern of roasted product. The roasted product consisted of silica, hematite, forsterite, and sodium silicate.
A. B. Prasetyo et al., 2019, reported that sodium silicate is obtained by the following reactions [18]:
Mg2SiO4(s) +Na2CO3 → 2MgO + Na2SiO3 + CO2(g),
SiO2(s) + Na2CO3(s) → Na2SiO3(s) + CO2(g),
Na2CO3(s) → Na2O(s) + CO2(g),
Na2O(s) + SiO2(s) → Na2SiO3(s),
Fe2SiO4(s) + Na2CO3(s) → Fe2O3(s) + Na2SiO3(s) + CO(g).
Table 1 shows the chemical composition of the roasted product. Mostly, compounds experienced a decline in content, with the exception of the Na2O content, which dramatically increased—this is reasonable as Na2CO3 was added to the ferronickel slag for the roasting process. Moreover, reactions (1)–(3) represent the release of CO2 and reaction (4) reflects the discharge of CO in the formation of sodium silicate; thus, a decline in the content of the compounds occurred. The roasted product was then leached to produce a pregnant silicon leached solution.

Table 1.
Chemical composition of roasted slag, measured by XRF.
2.2. Leaching Process
The leaching process was conducted on the roasted product by using NaOH solution as a leaching agent for various leaching times (2, 4, and 6 h) and with different concentrations of NaOH solution (4, 6, 8, and 10 M). The utilization of NaOH solution instead of water as a leaching agent was intended to increase the silicon dissolution of the roasted product, since silica and forsterite were not decomposed into water-soluble sodium silicate overall. Reactions (6) and (7) illustrate the reaction and dissolution that might have occurred during the leaching process. Si(OH)4 was formed along with Na2O, which was subsequently expected to react with the remaining SiO2 and Mg2SiO4 to form a sodium silicate solution (SSS).
Na2SiO3(s) + 4NaOH(aq) → Si(OH)4(aq) + 3Na2O(aq),
SiO2(s) + Na2O(aq) → Na2SiO3(aq),
Mg2SiO4(s) + Na2O(aq) → Na2SiO3(aq) + 2MgO(s).
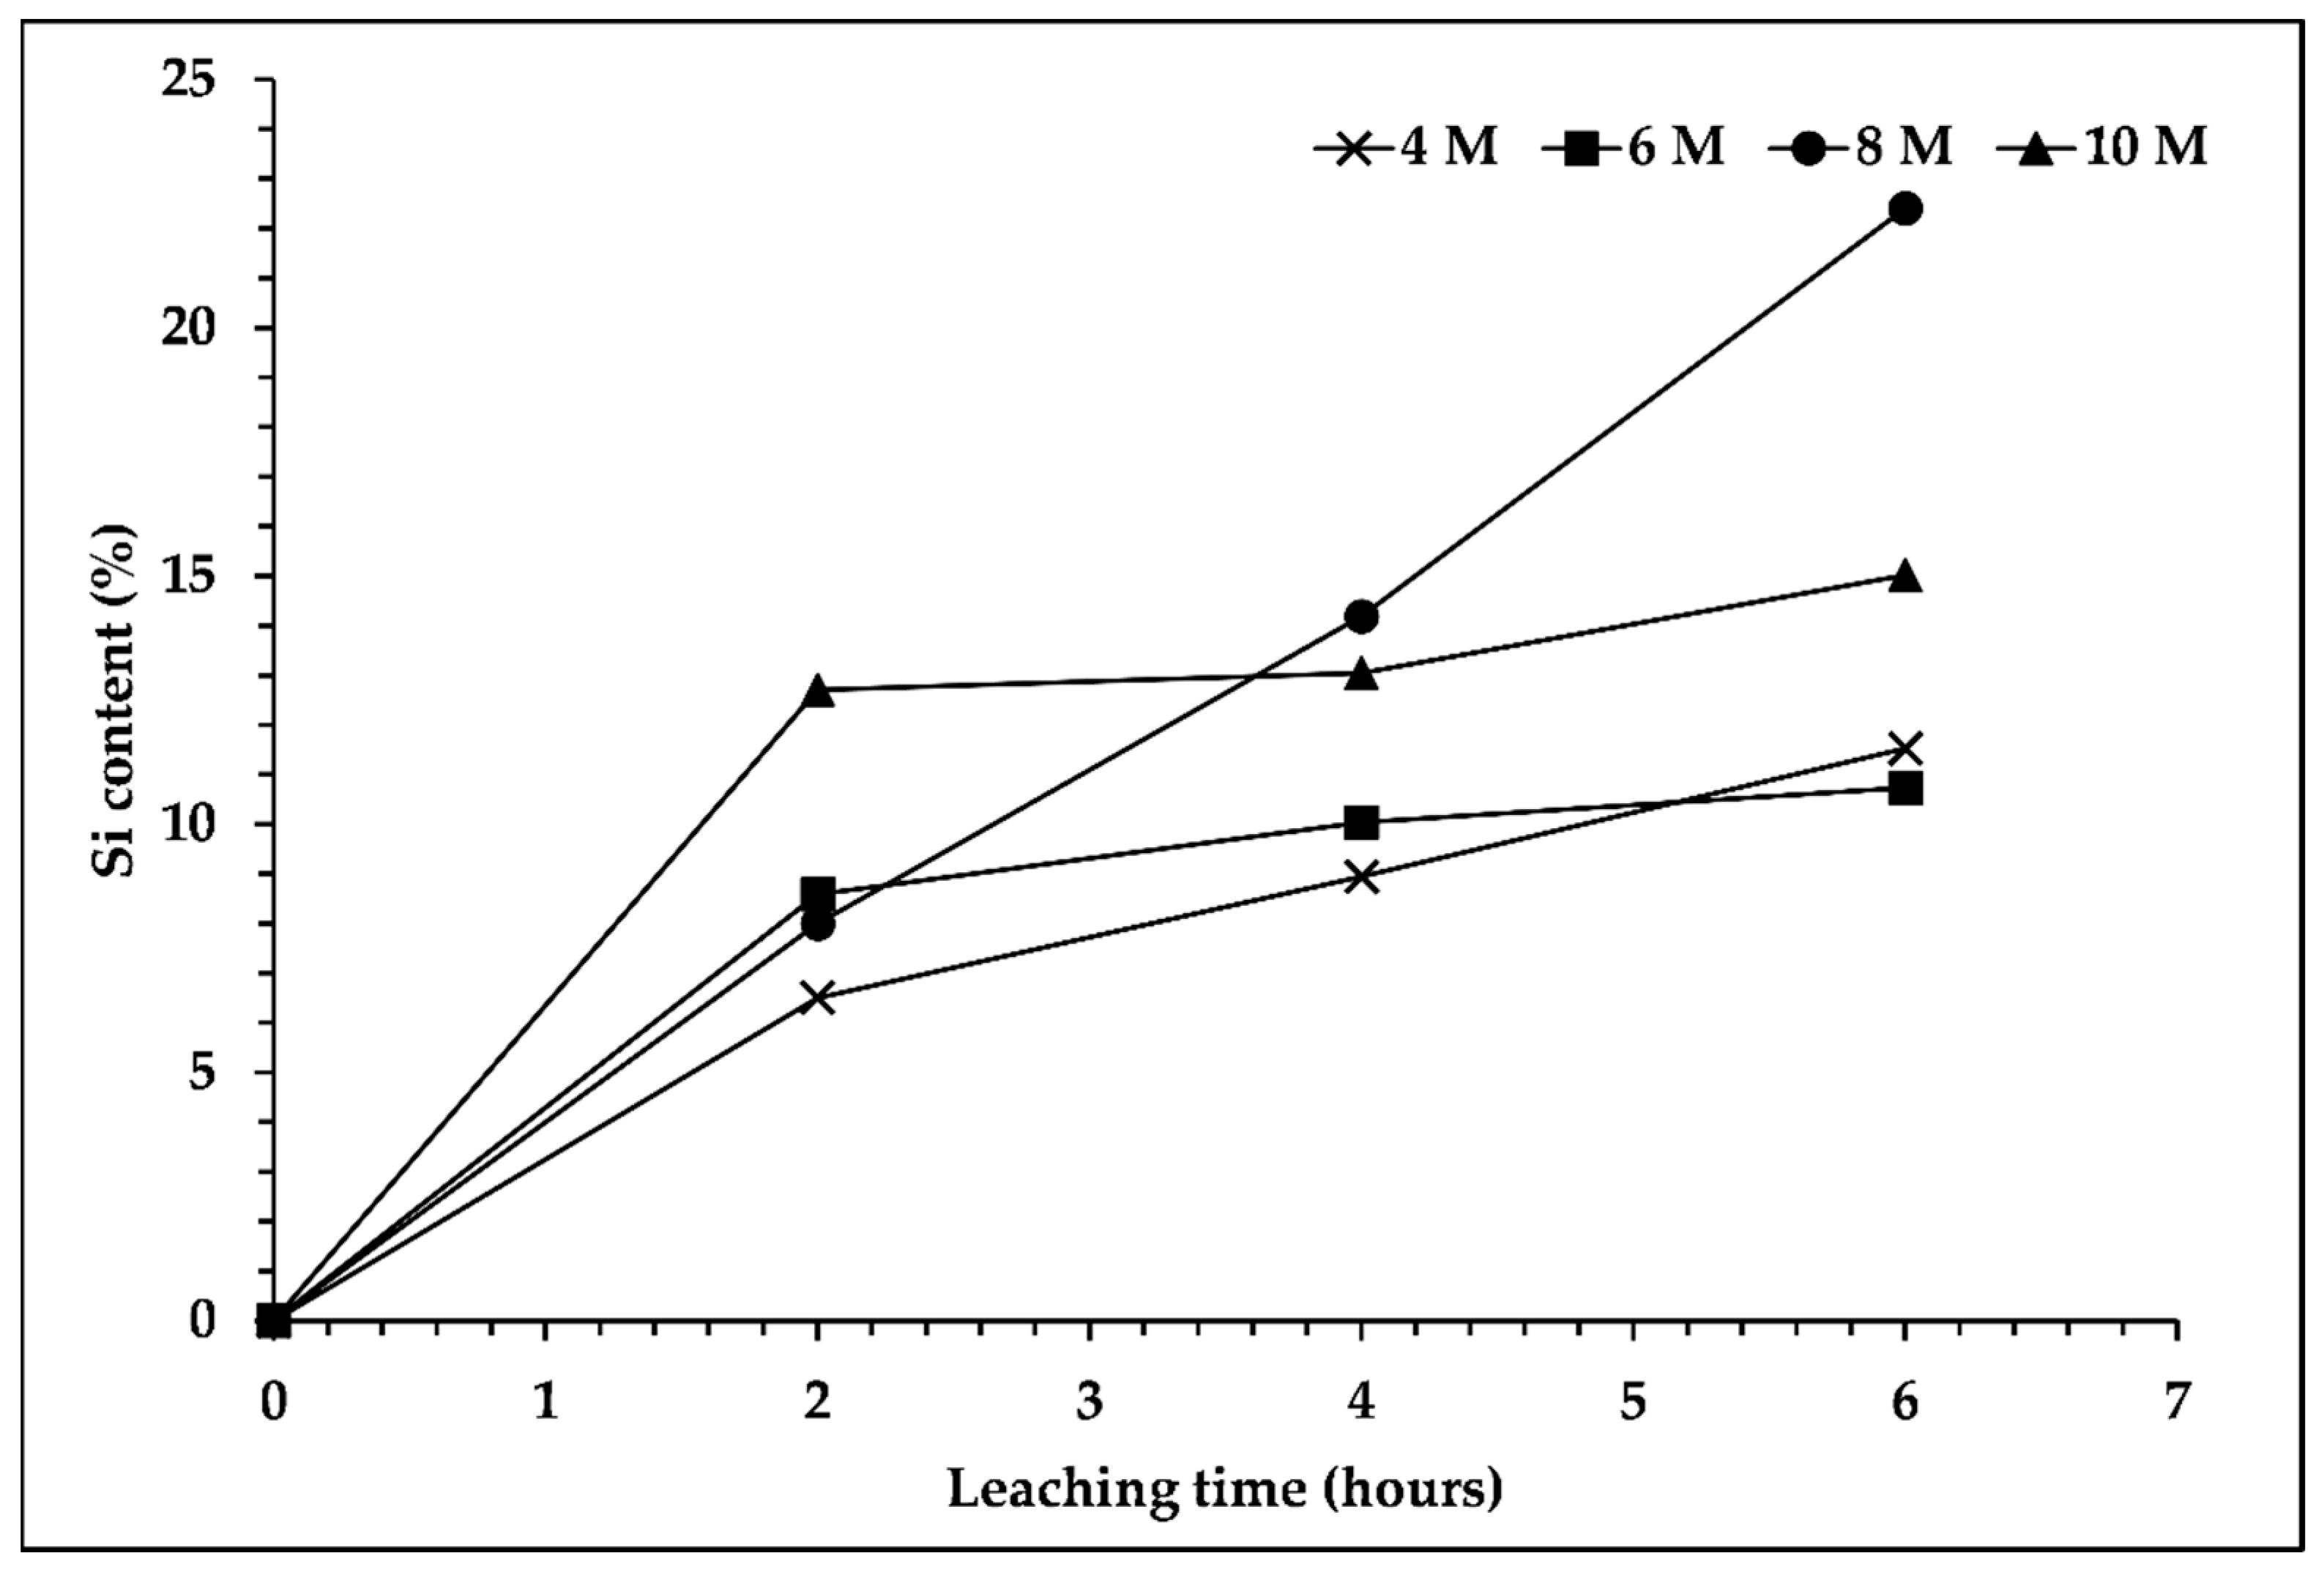
In order to determine the silicon content in the leaching filtrate, analysis via ICP-OES was conducted. Figure 2 shows that the silicon content increased with the longer duration of the leaching process, especially for the filtrate that used 8 M of NaOH solution, which reached the highest silicon content, 22.40%, for a leaching duration of 6 h. However, the other concentrations of NaOH solution displayed different trends. The silicon content was increased significantly in the first 2 h and remained stable with a longer duration of the leaching process. Moreover, the high Na2O content in the roasted slag used as a raw material for the leaching process, which accounted for one third of the SiO2 content, was boosted by the Na content from the NaOH solution. Therefore, it influenced the elemental composition; the Na content was high and suppressed the Si content in the leaching filtrate. In addition, previous studies [17,22] reported that increasing silicon dissolution was observed upon increasing the concentration of NaOH solution up to a definite concentration, and decreasing silicon dissolution was observed with a higher concentration of NaOH solution.
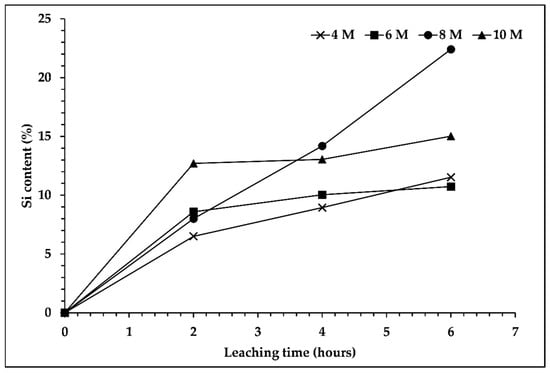
Figure 2.
Effect of sodium hydroxide concentration and leaching time on silicon content in the leaching filtrate. Leaching process was performed at temperature of 95 °C, s/L ratio 1/10, and 300 rpm.
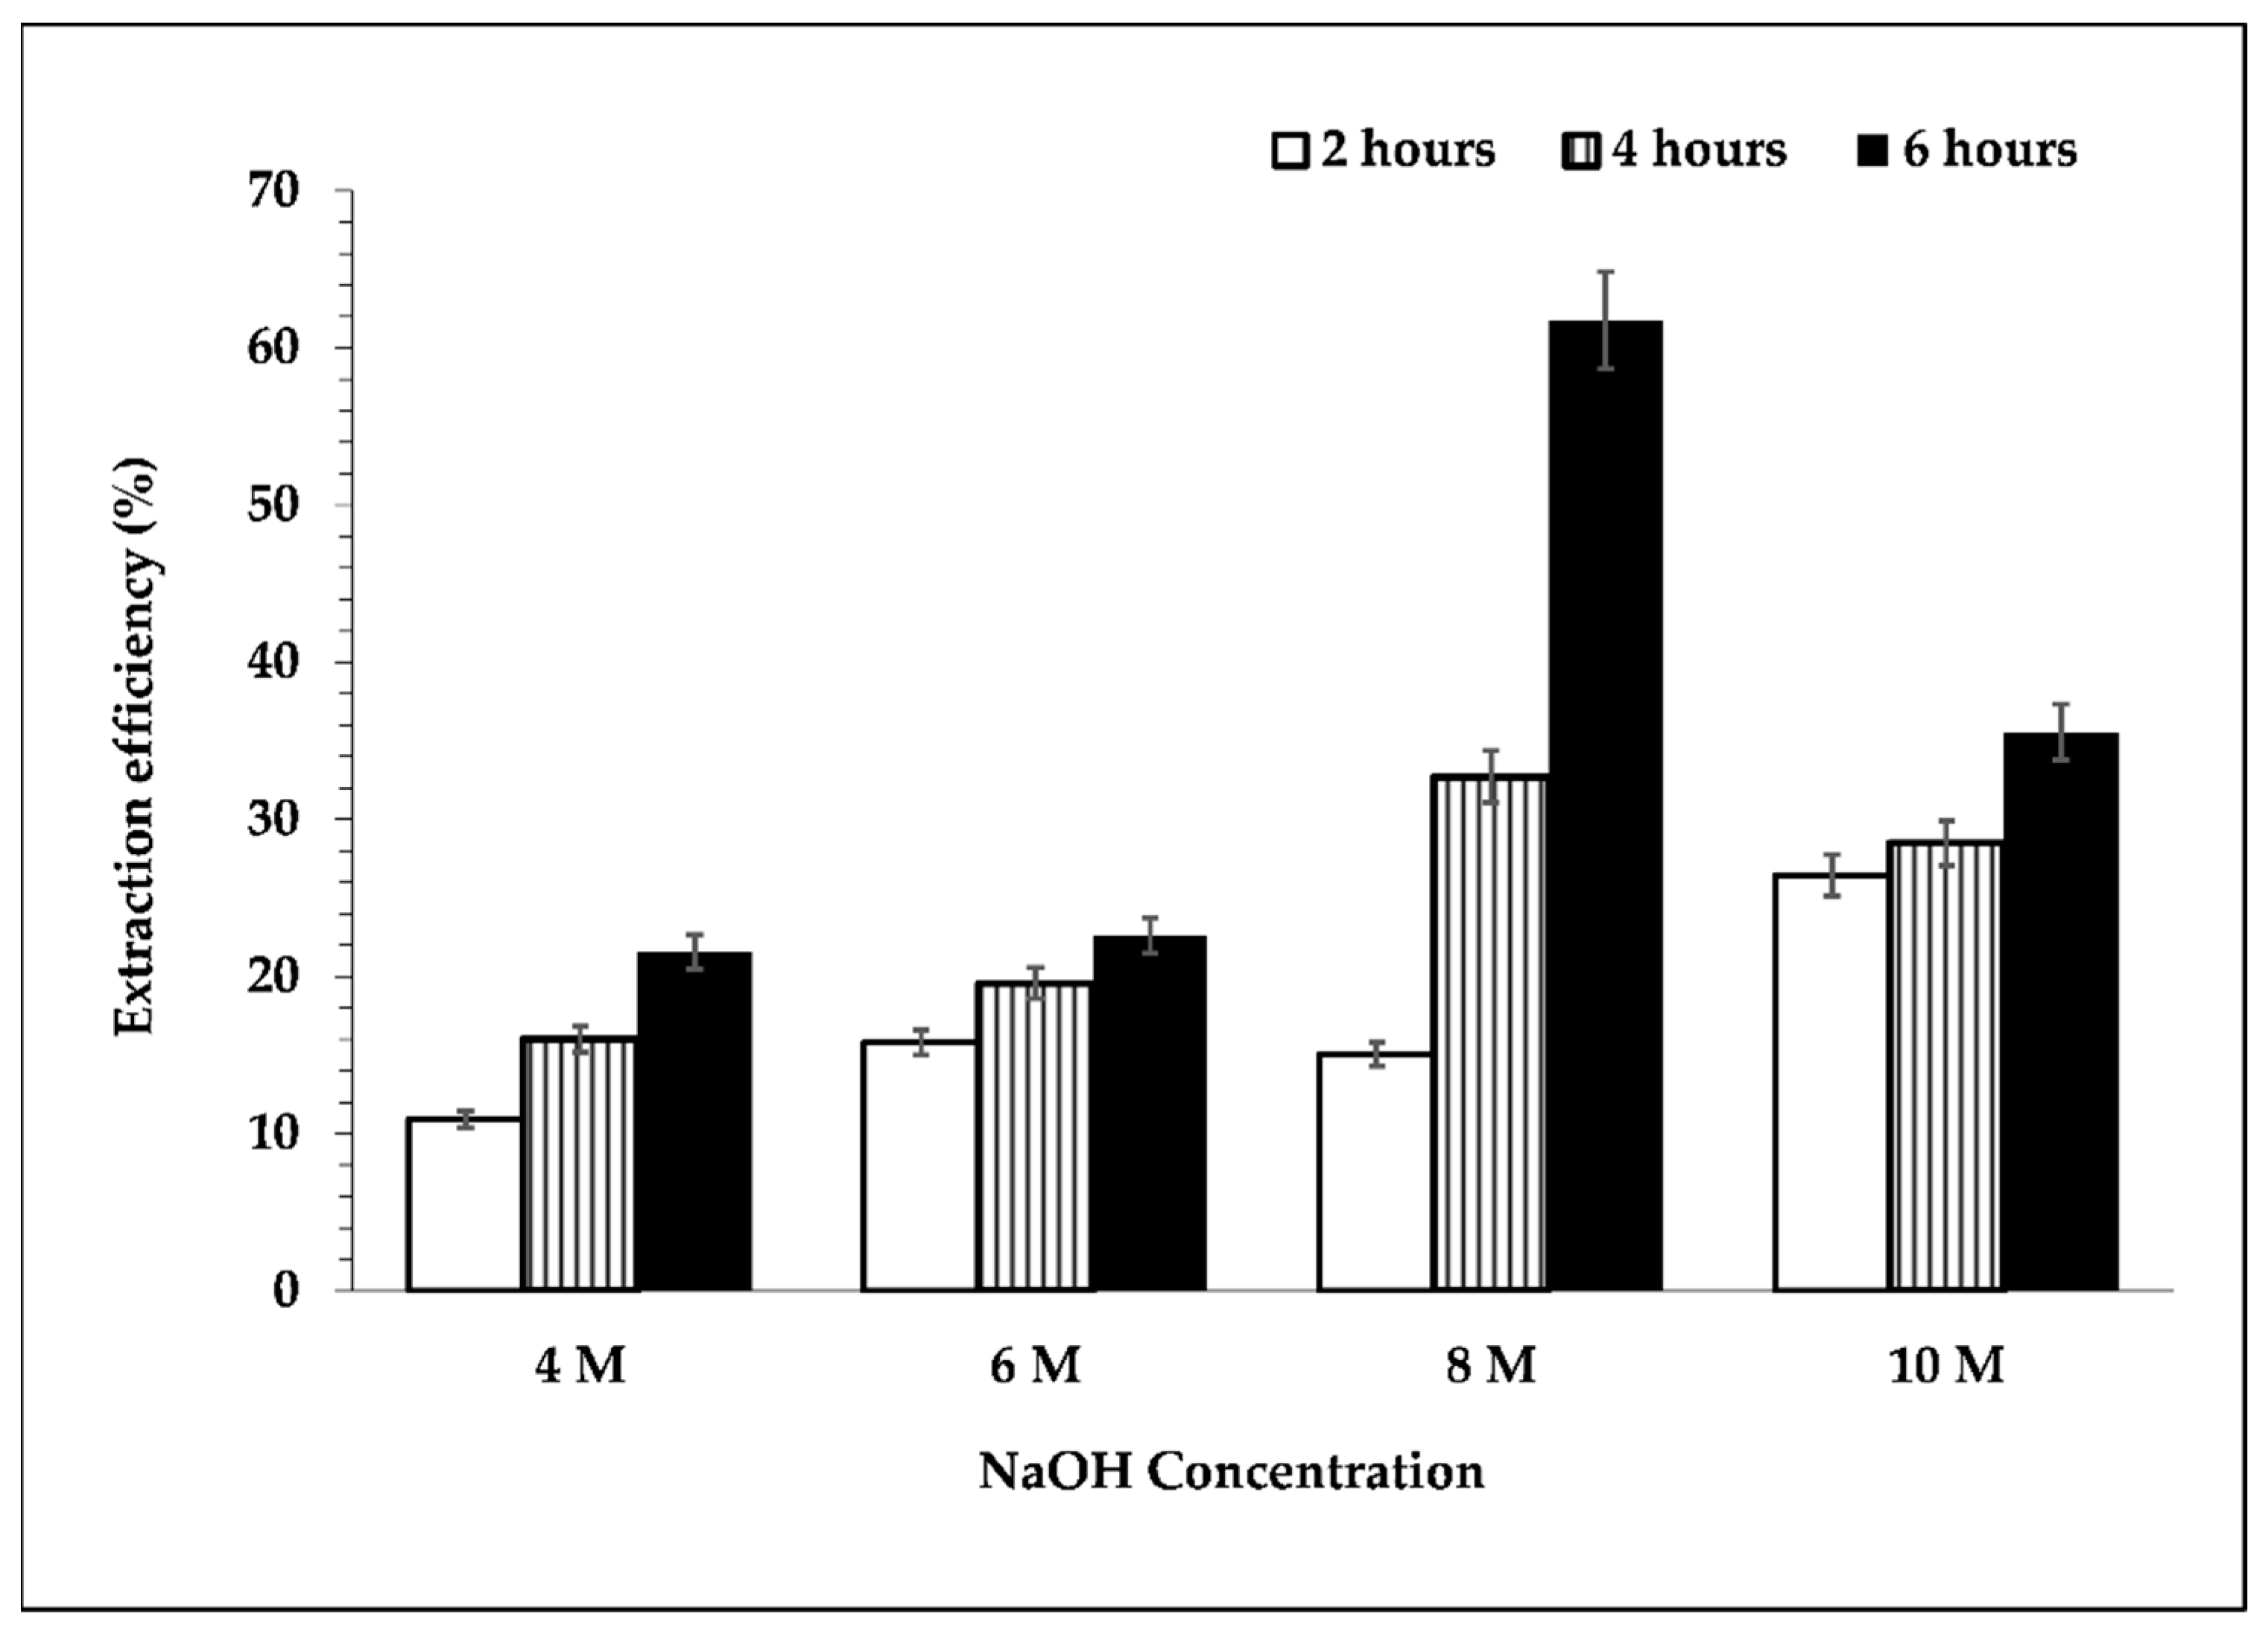
Figure 3 shows the extraction efficiency of silicon. It can be inferred that the extraction efficiency of silicon increased upon increasing the concentration of NaOH solution up to 8 M. Increasing the concentration of NaOH further caused the extraction efficiency of silicon to decrease. This result is reflected in Figure 2. Based on a previous study [23], the dissolution of silica that occurred in the alkaline condition could cause glass layer formation, which might hinder further silica dissolution. Moreover, the higher viscosity of the 10 M NaOH solution used for leaching, along with a longer heating duration, might increase the viscosity of the mixture; therefore, mass transfer was slower, and this condition could support glass layer formation as well. Therefore, the extraction efficiency decreased with the utilization of 8 M NaOH solution as a leaching agent.
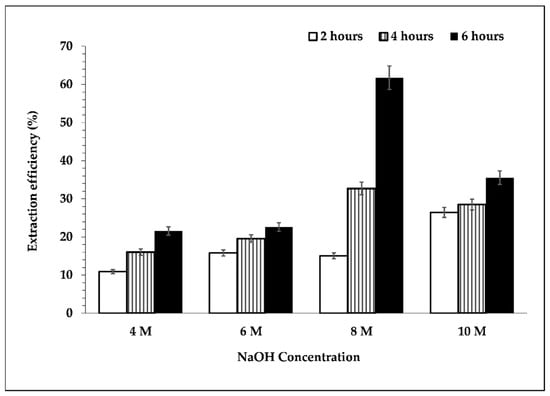
Figure 3.
Effect of NaOH concentration and leaching time on the extraction efficiency of silicon. Leaching process was performed at temperature of 95 °C, s/L ratio 1/10, and 300 rpm.
For these reasons, variation in the s/L and stirring speed during the leaching process are required to address the glass layer formation, which could hinder further dissolution. A higher s/L ratio and stirring speed during leaching were reported to enhance silicon dissolution in the leaching process [24].
2.3. Precipitation Process
In the previous study, sodium silicate was used to produce silica via acid leaching with HCl [13]. In the present study, precipitated silica was produced by the precipitation process of the filtrate that contained Si(OH)4 and SSS with 1:4 HCl solution from pH 14 to pH 2. The effect of an acidic pH on the synthesized silica from a sodium silicate solution was studied previously to produce high-purity and nanoparticle silica [8]. Reactions occurring in the precipitation process are described in Equations (9) and (10). When the filtrate is treated with HCl, sodium chloride would be produced as impurities, along with precipitated silica as the dominant component to be enriched. Moreover, Si(OH)4 was also condensed to form precipitated silica.
Si(OH)4 + HCl → SiO2 + HCl + 2H2O,
Na2SiO3 + 2HCl → SiO2 + 2 NaCl + H2O.
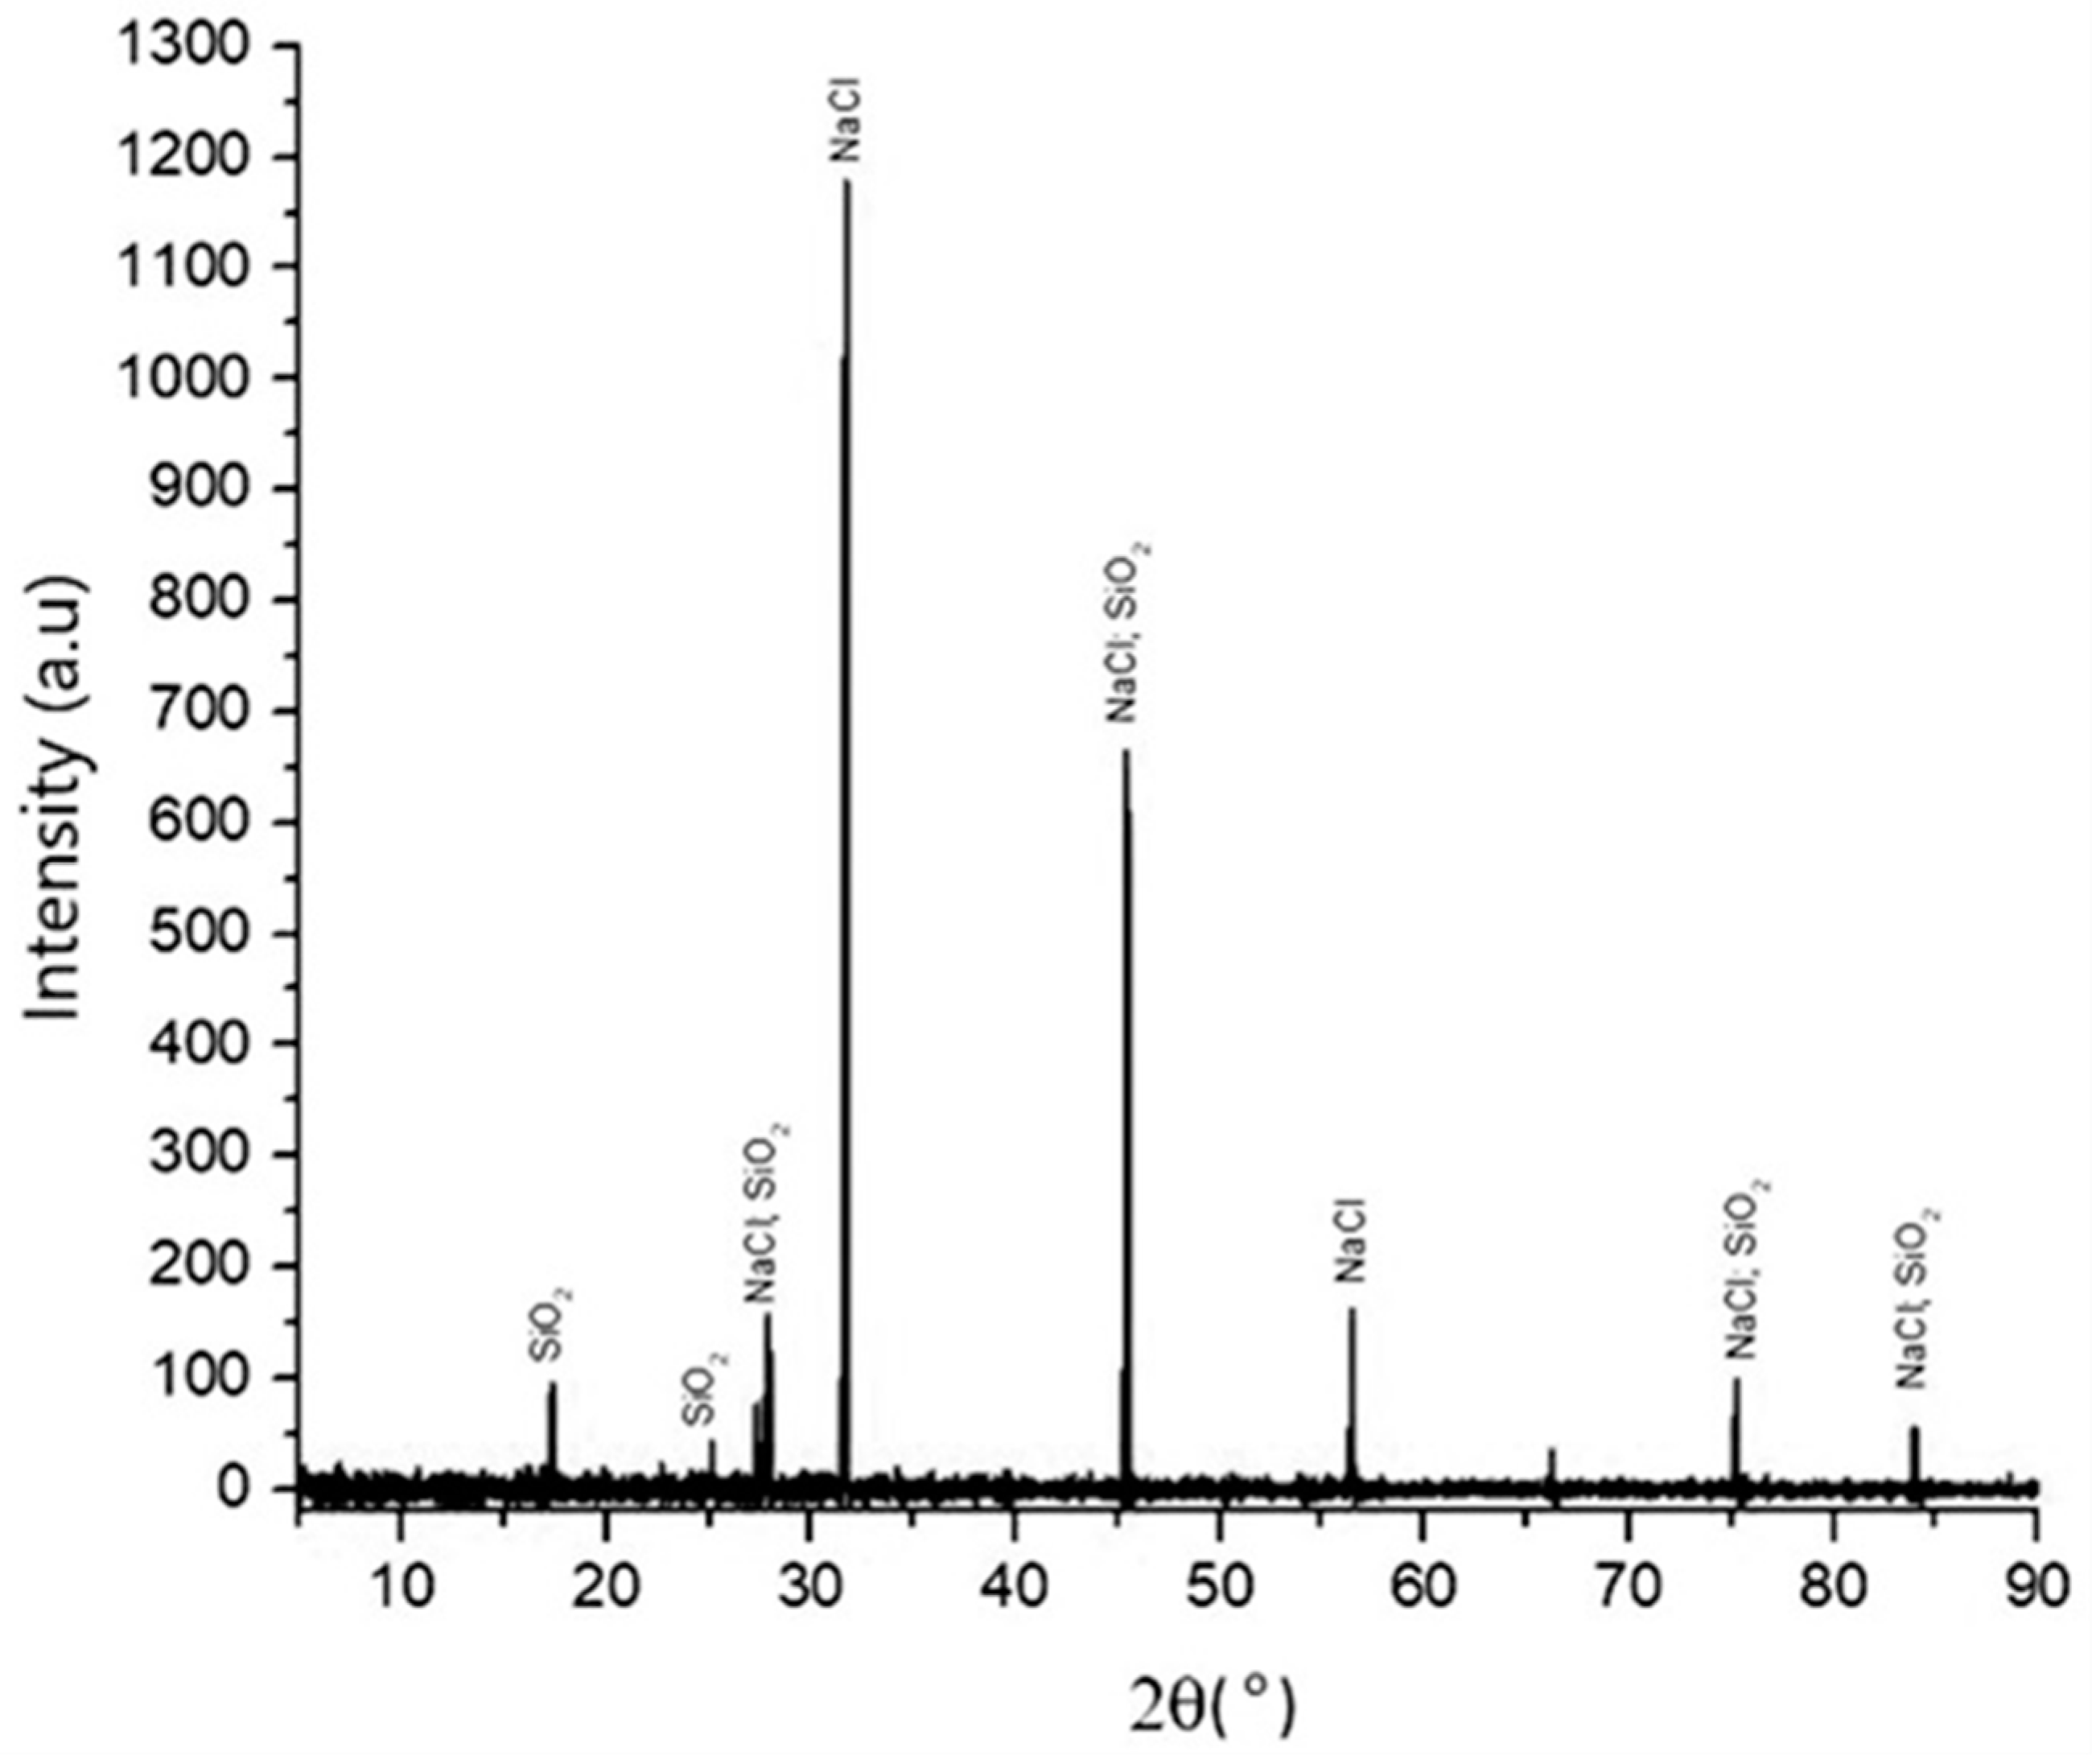
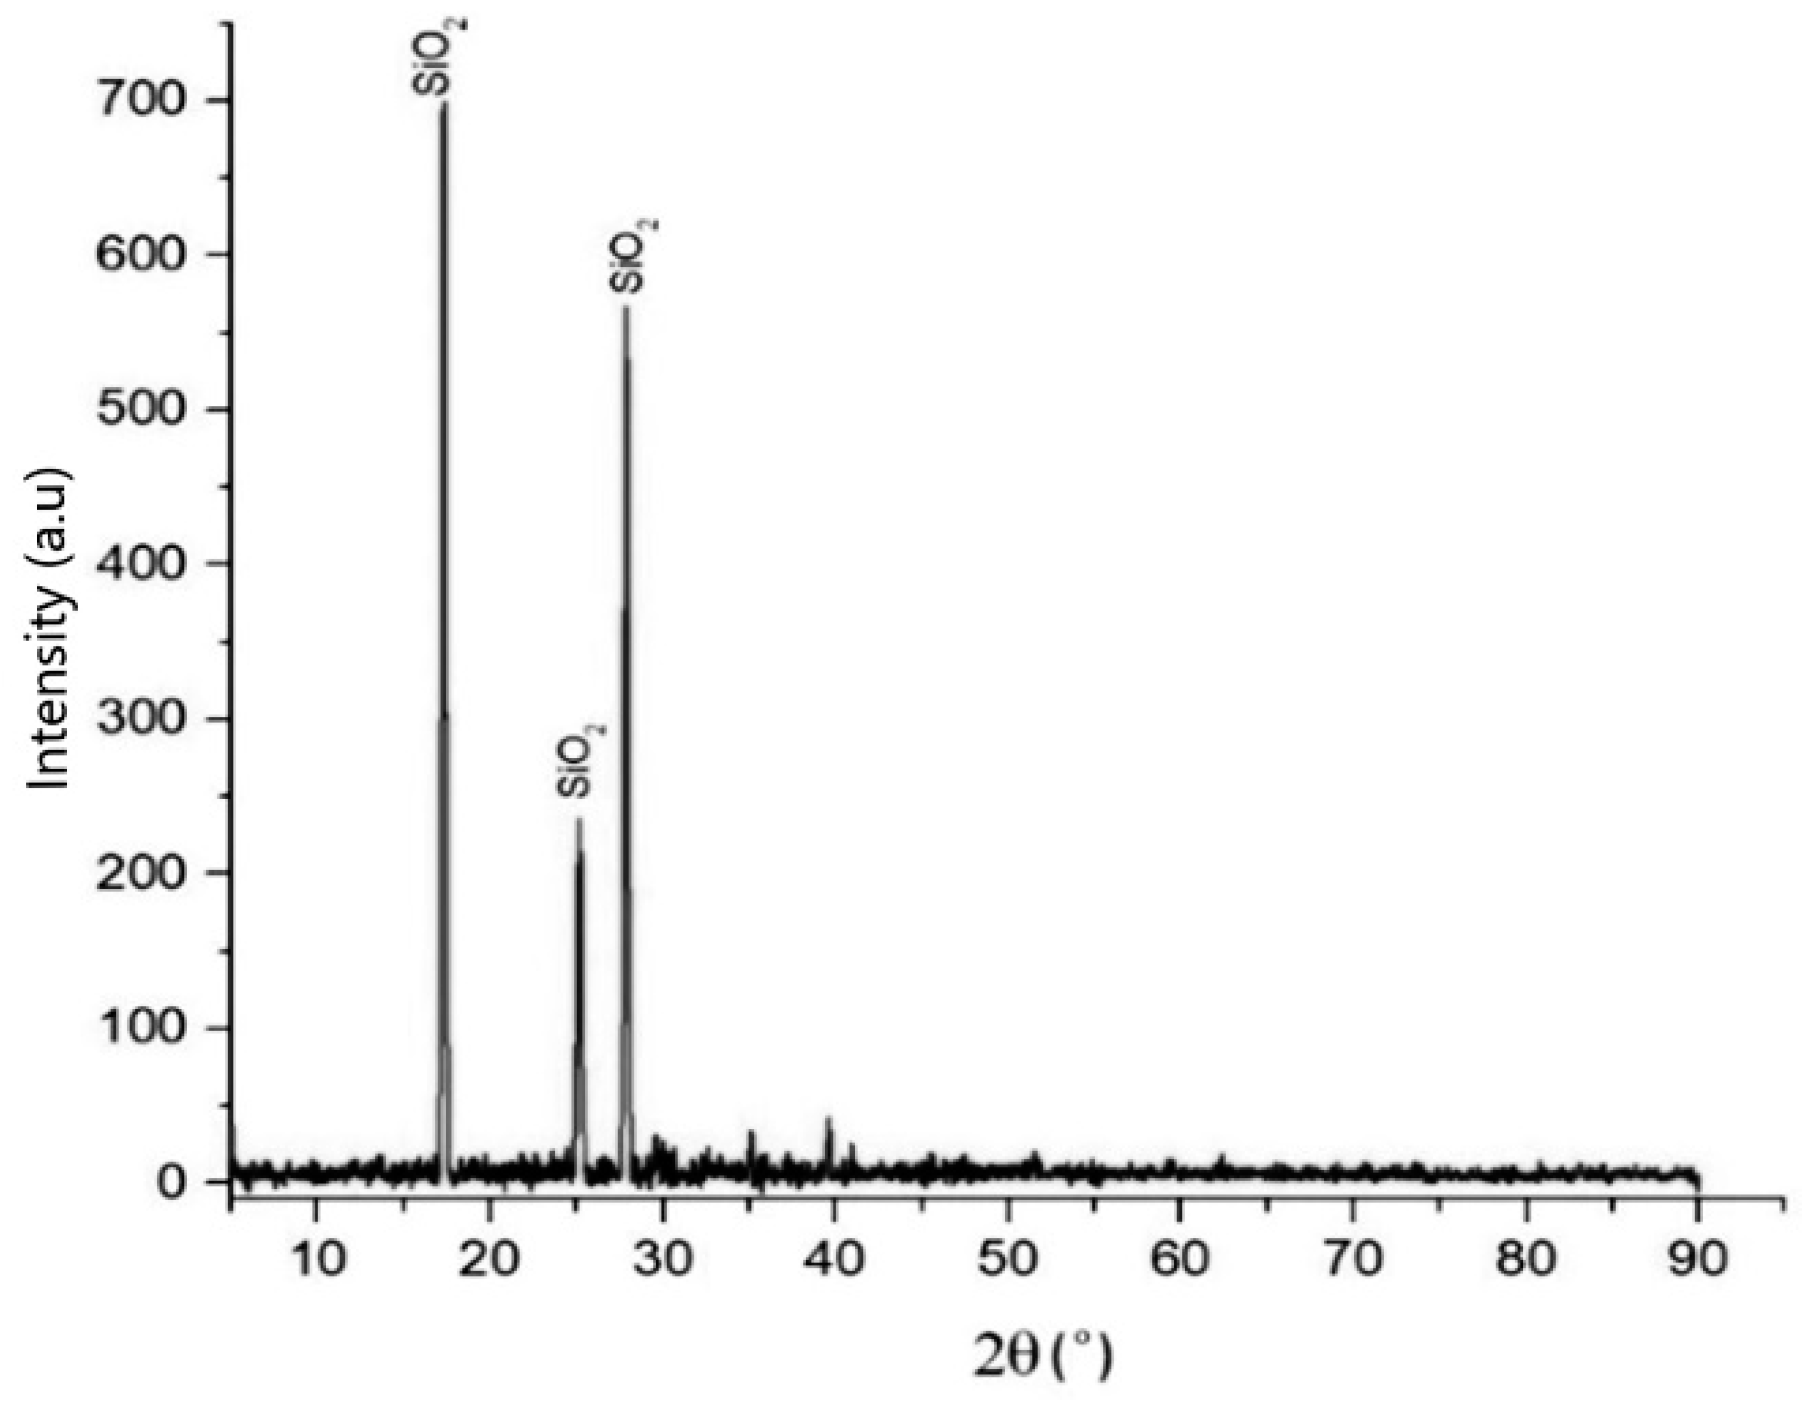
Figure 4 shows the XRD patterns of precipitated silica produced from the filtrate after the precipitation process with 1:4 HCl solution at pH 2. The XRD data show that the process is effective and efficient to produce silica particles, as its phases correspond to the above reaction. The pattern corresponds to the characteristic crystalline nature of silica. The dominant components were silicon, oxygen, sodium, and chloride, from whose compositions they can be identified as SiO2 and NaCl compounds. The phases of silica that appeared in XRD were directly related to the compound analysis of silica in the XRF analysis, as shown in Table 2, and the elemental silicon analysis of the EDS data that is depicted in Table 3.
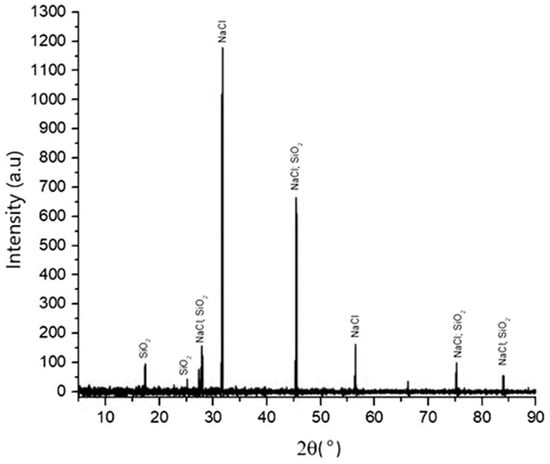
Figure 4.
XRD pattern of silica that was synthesized with HCl at pH 2, temperature of 90 °C, 300 rpm, and with 1:4 HCl solution.

Table 2.
Composition of silica produced by HCl precipitation at pH 2. It was measured with XRF.

Table 3.
EDS element composition on the surface of precipitated silica.
The presence of SiO2 and NaCl compounds was confirmed by the XRF results. The purity of SiO2 was relatively low, at 58.82 wt%, and it had a high impurity content of 24.57 wt% chloride compounds.
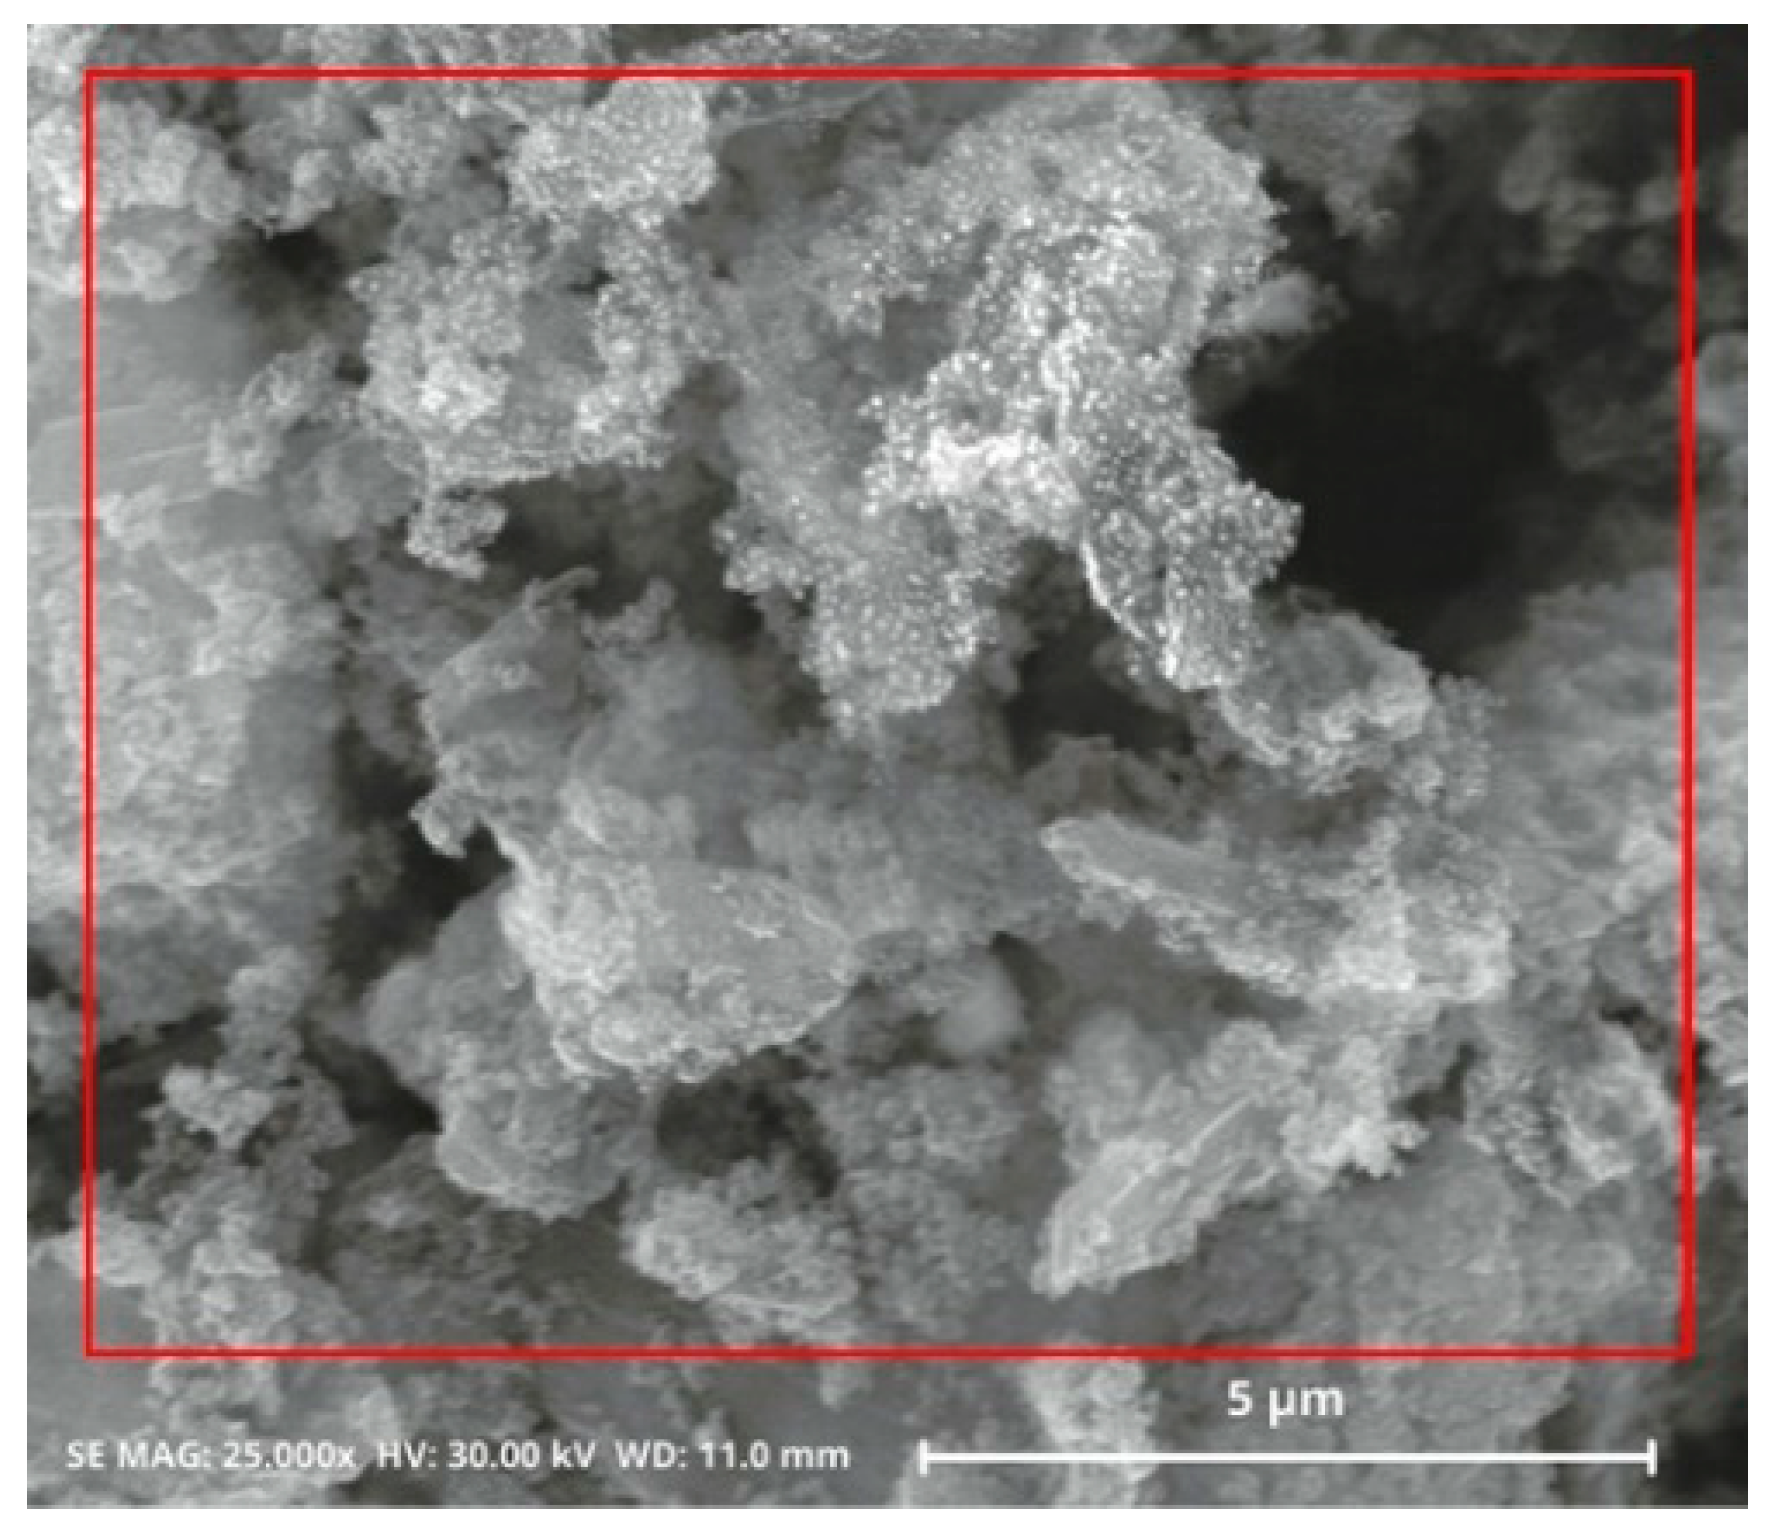
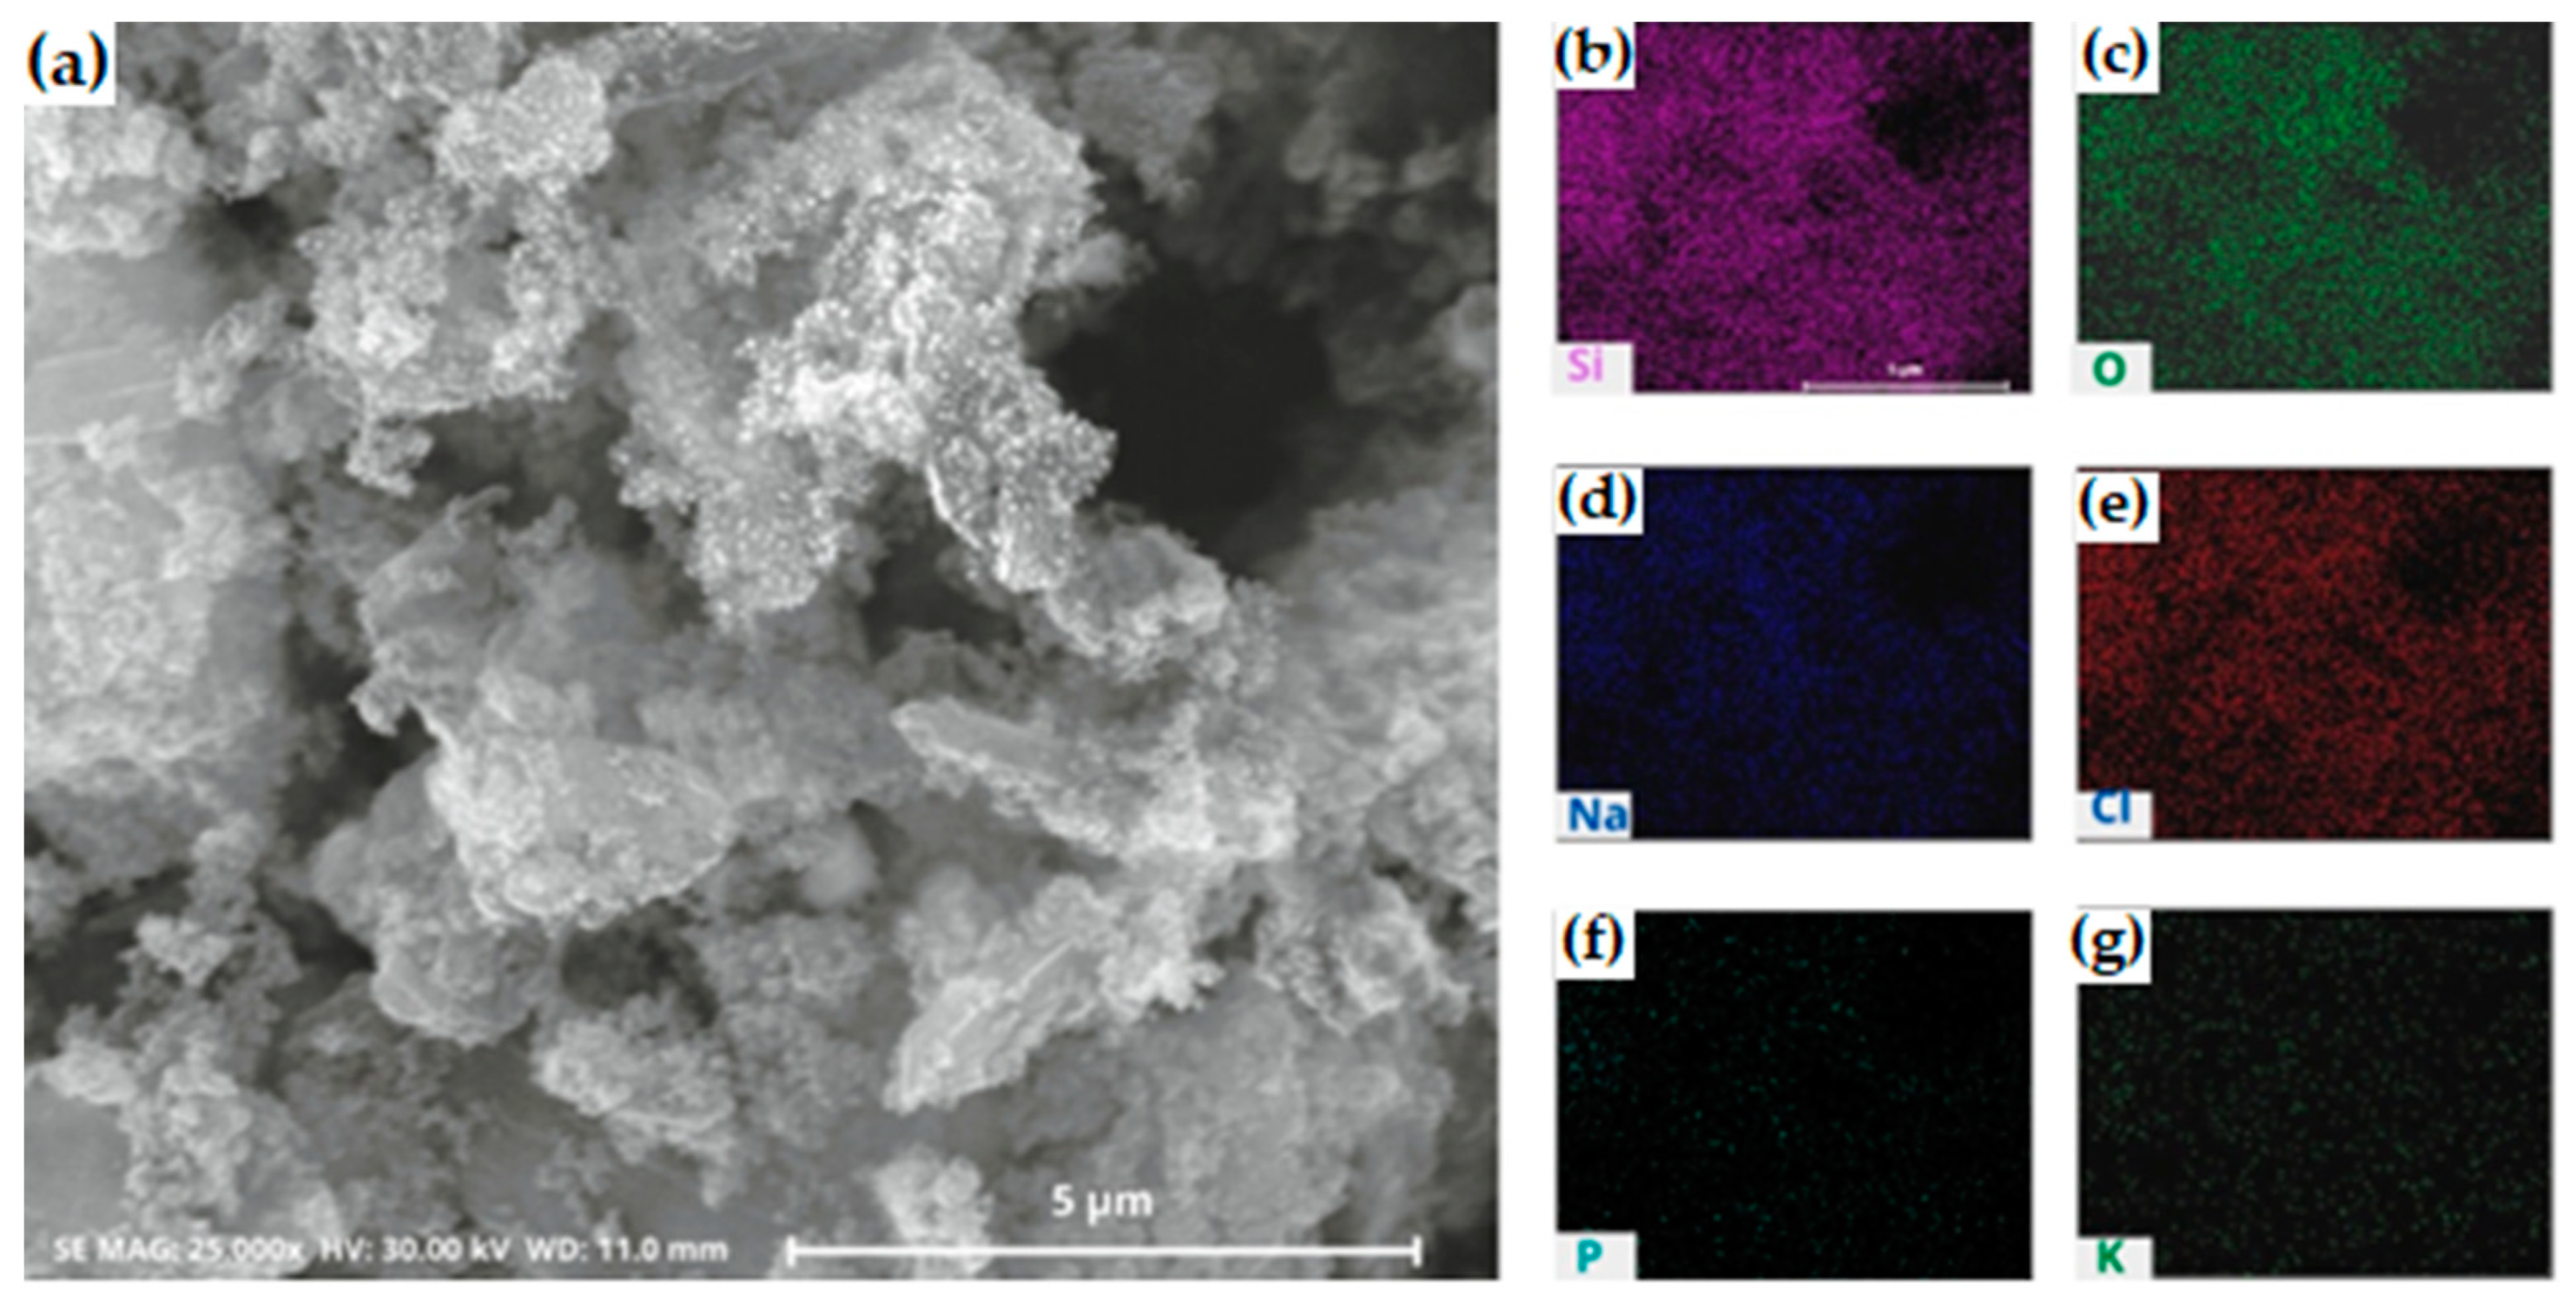
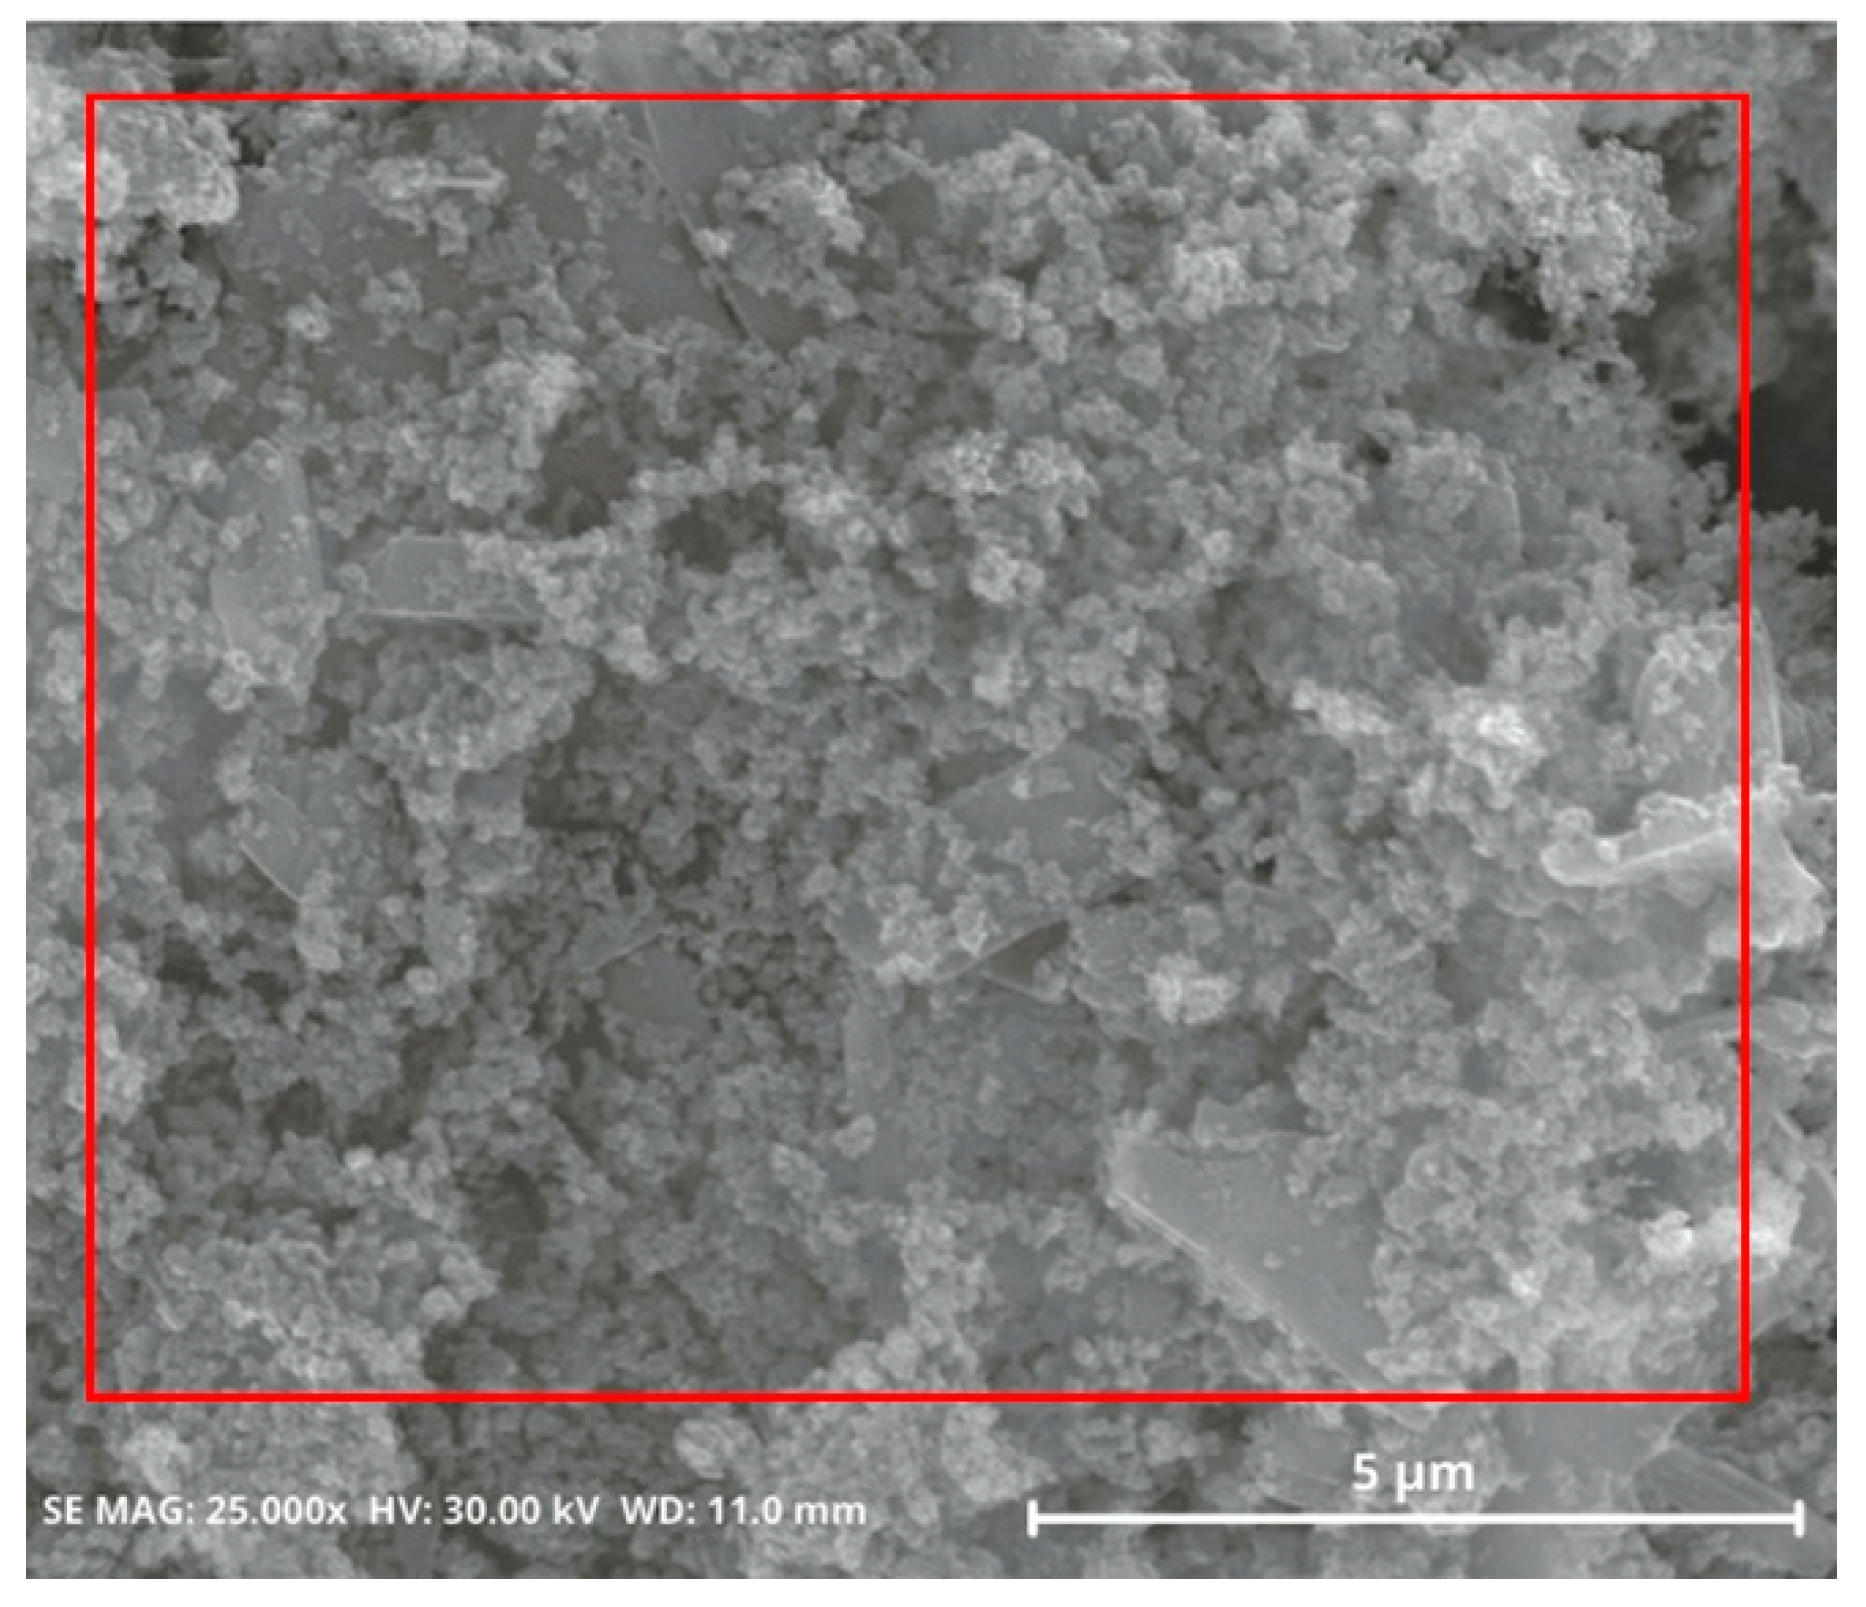
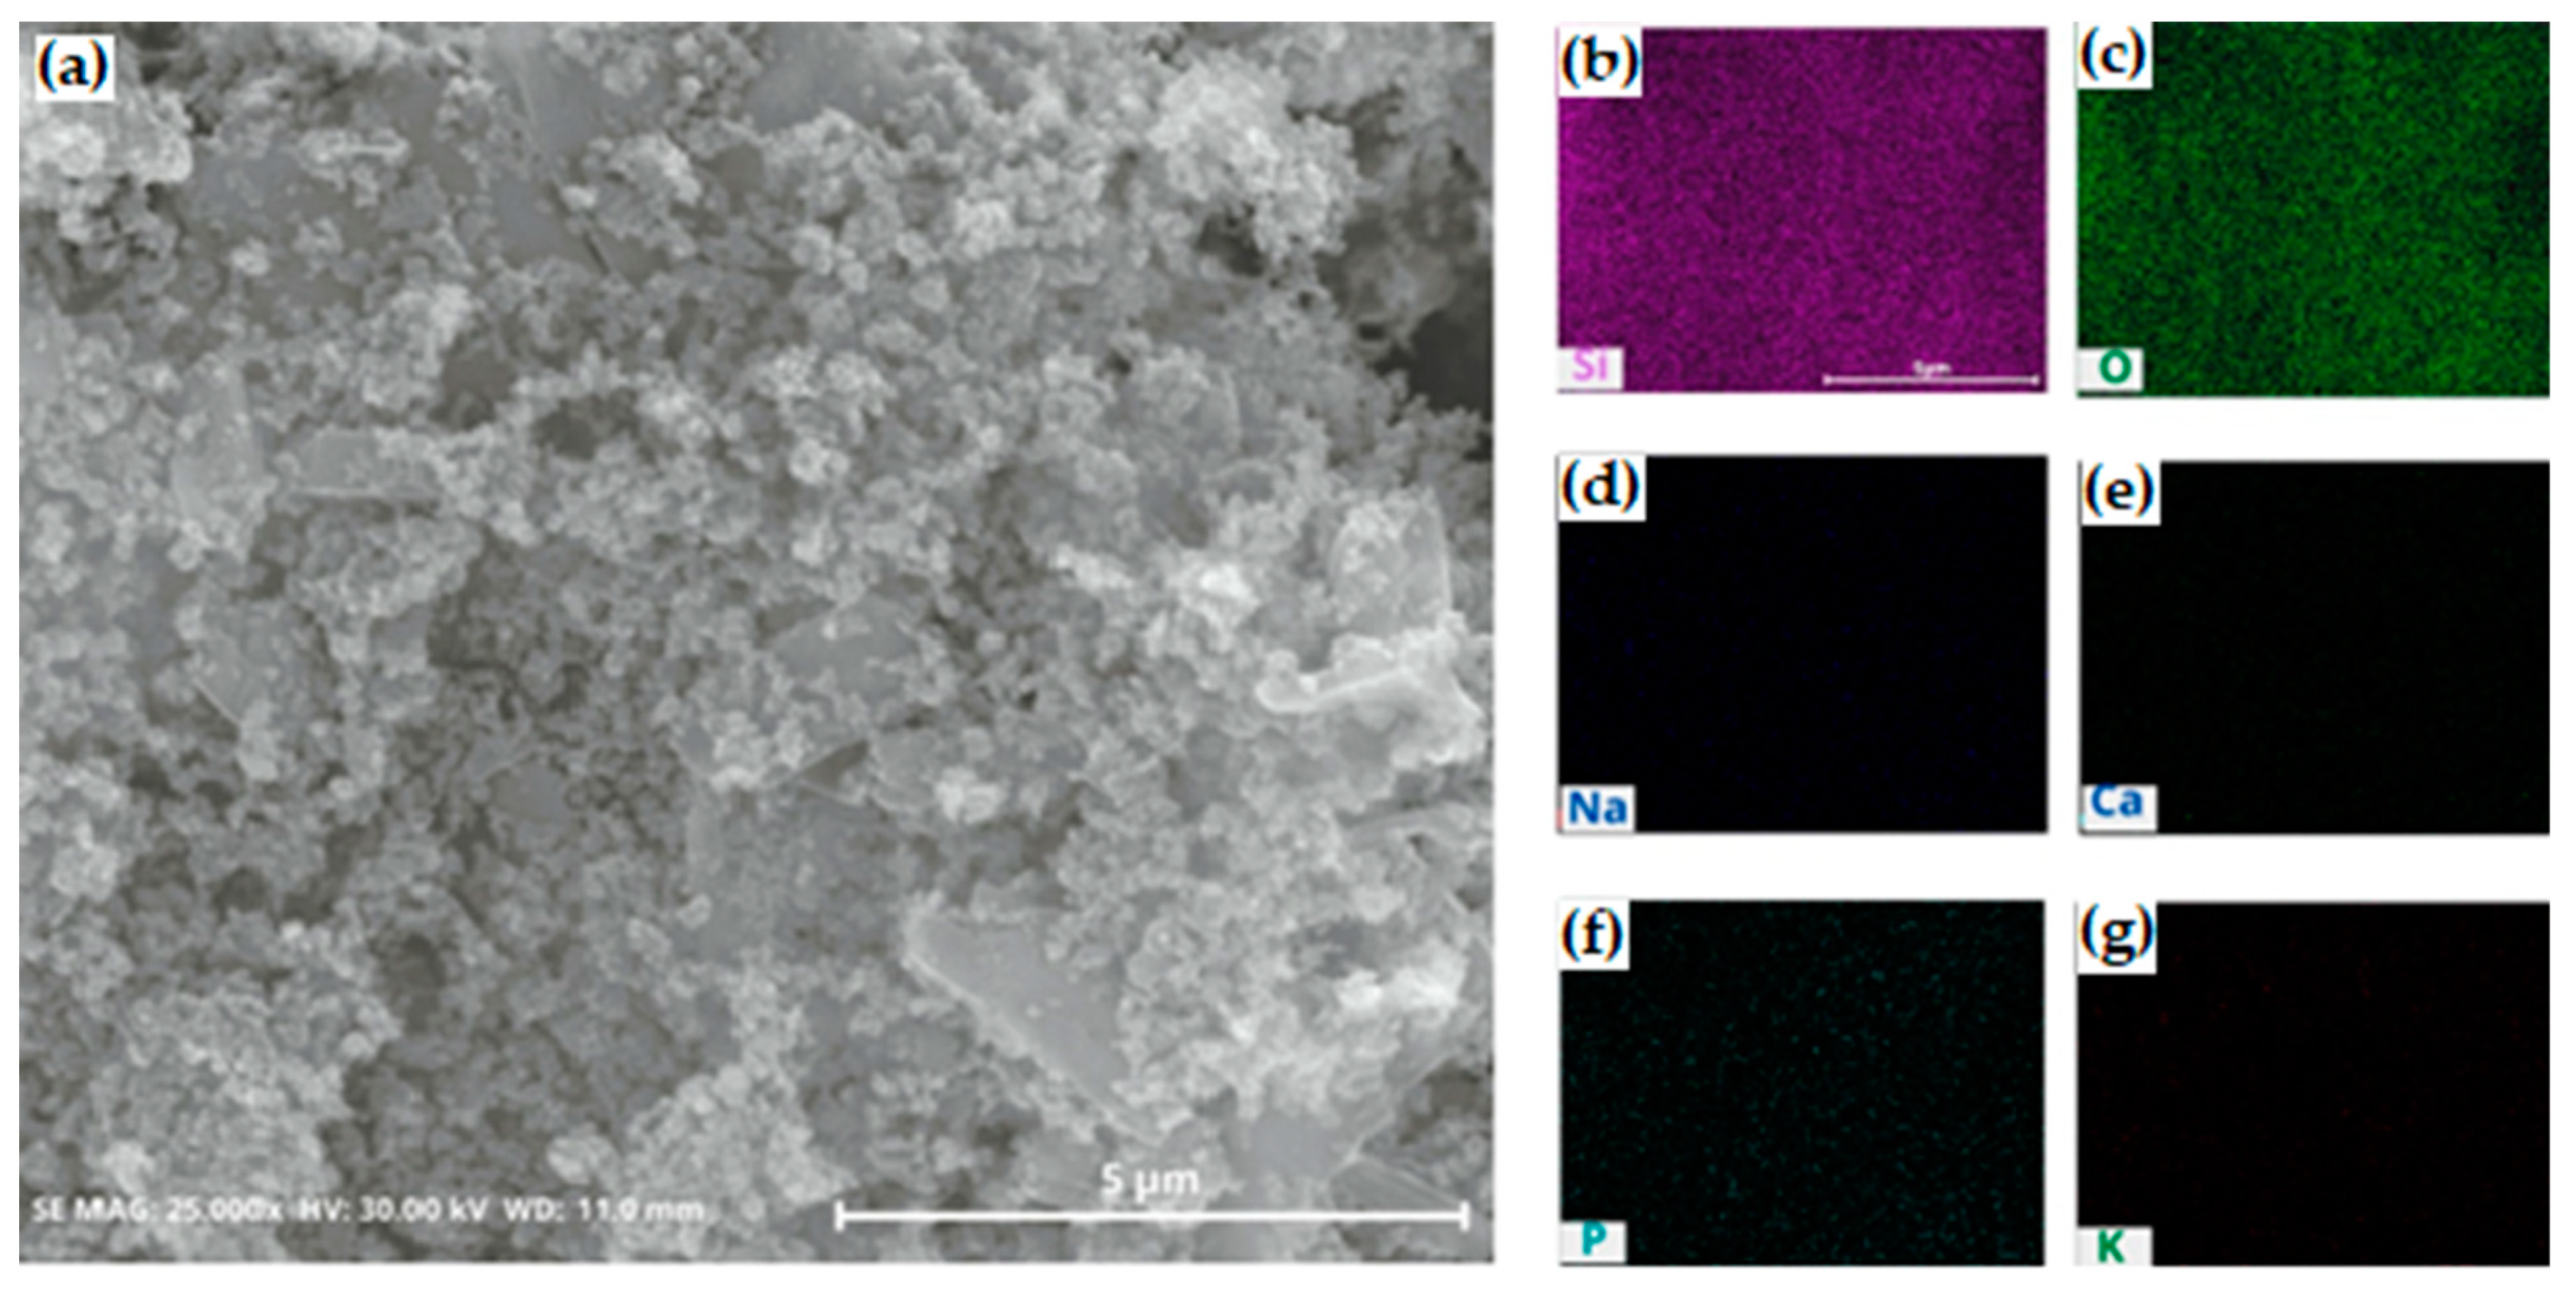
Figure 5 shows that the morphology of precipitated silica tends to display fine particles with fast agglomeration. In a previous study, the agglomeration rate and morphology of precipitated silica were affected by the pH conditions during silica synthesis. The high-pH condition results in fast agglomeration of the silica precursor, whereas a low-pH condition induces slow agglomeration [25]. In this study, the precipitation process was conducted at a low pH, pH 2. The reaction induced slow agglomeration. The impurities had sufficient time to escape between the silica particles and then appeared at the surface. It could be seen that impurities were largely detected in the SEM-EDS mapping images; see Figure 6. Under this condition, high cleaning efficiency can be achieved afterwards.
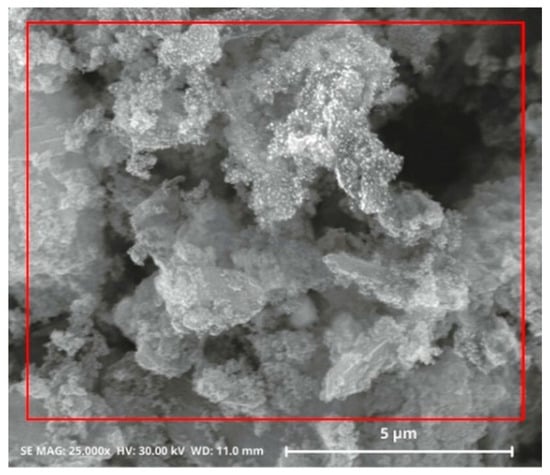
Figure 5.
SEM images of precipitated silica, synthesized from precipitation with HCl at pH 2, producing non-uniform particle size and fast agglomeration.
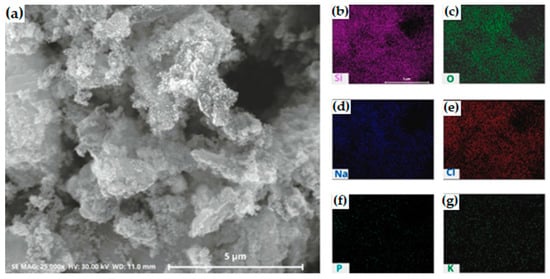
Figure 6.
(a) SEM and (b–g) EDS mapping images of silica after precipitation process with HCl. The silica was synthesized at pH 2 (b) silicon; (c) oxygen; (d) sodium; (e) chloride; (f) phosphor; (g) potassium.
The distribution of silica appeared as a less bright purple color (Figure 6b), while chloride presented a reddening color (Figure 6e) in one major area. This is in good agreement with the XRF and XRD analysis of precipitated silica.
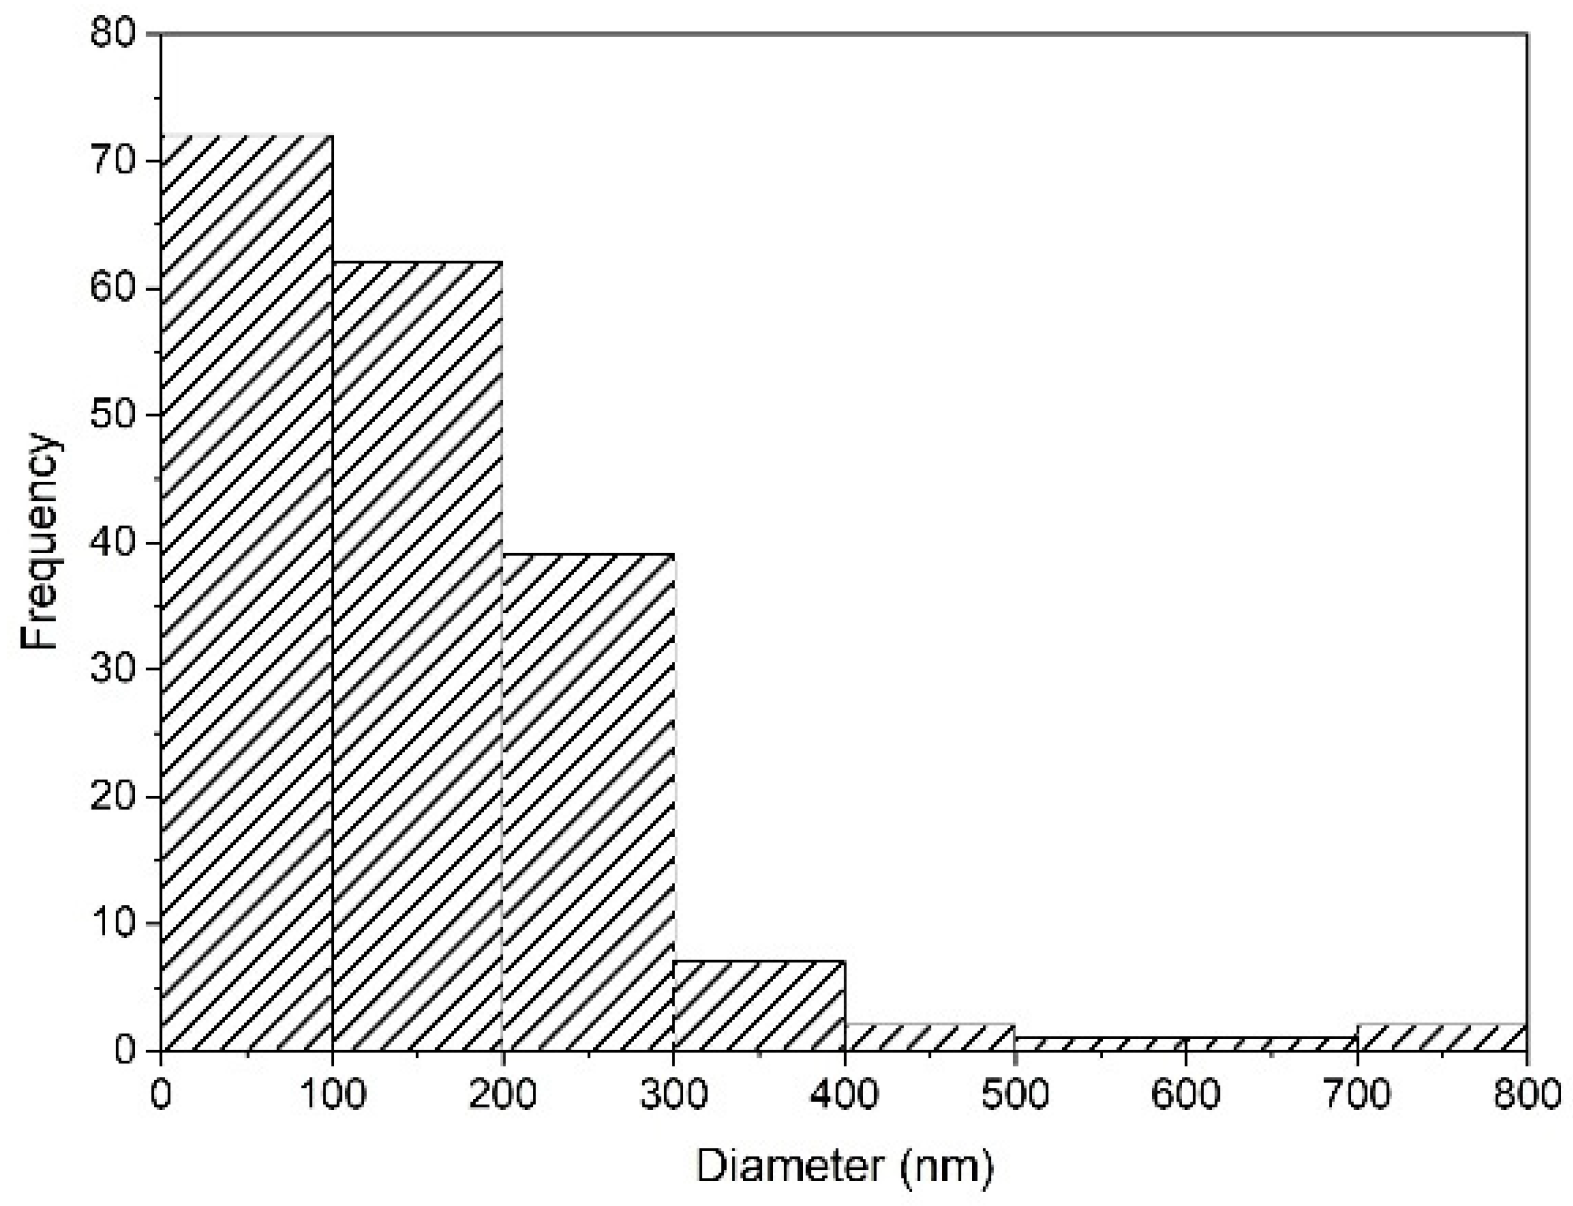
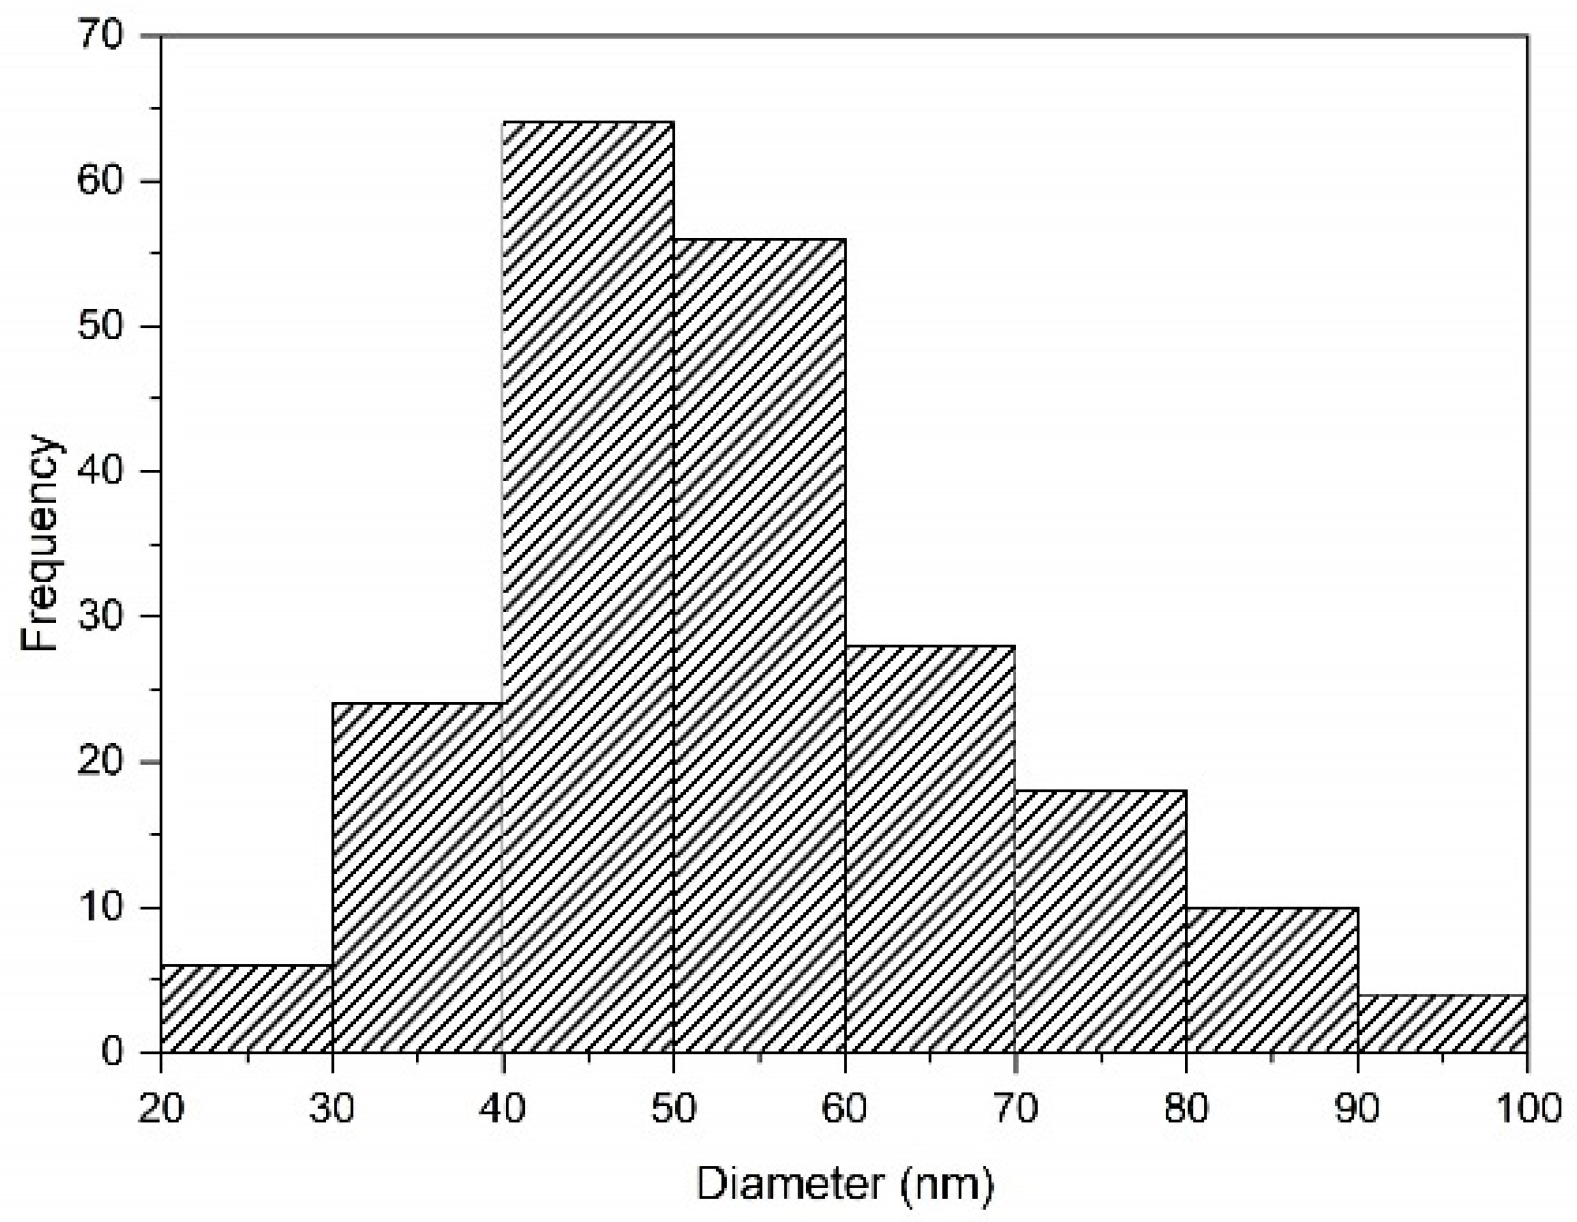
Nanoparticles and microparticles of precipitated silica were produced with a size range of 58.3–730.6 nm. The particle distribution analysis is shown in Figure 7. When the pH values were neutral (pH 7) during the investigation, the silica precursor was in the gel state, with fast agglomeration. It was then changed to the solid state, and then became a powder during the drying process.
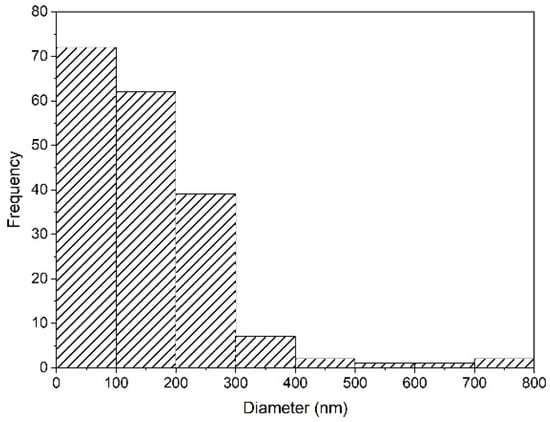
Figure 7.
Particle size distribution of silica synthesized after precipitation with HCl at pH 2 in SEM-EDS using ImageJ.
2.4. Purification Process
SEM and EDS analysis indicated that silica, NaCl, and the impurities remained after the precipitation was completed. It was expected that the impurities could be removed, and the purity of silica could be significantly increased. The cleaning process with DI water showed promising results, as demonstrated by the XRD analysis in Figure 8.
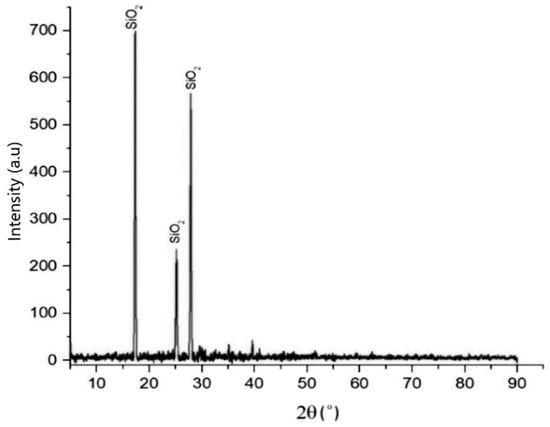
Figure 8.
XRD pattern of purified silica after cleaning with deionized water at 60 °C, 300 rpm, s/L ratio 1:4, for 3 h.
The dominant impurity that resulted from the precipitation process, NaCl, was not detected in this product. To precisely determine the composition of the main components and impurities, elemental composition analysis was performed via EDS; see Table 4. When examining a specific region, as in Figure 9, the composition was found to include silicon at 41.74 wt% and oxygen at 52.51 wt%.

Table 4.
EDS elemental composition of purified silica after cleaning with DI water at 60 °C for 3 h.
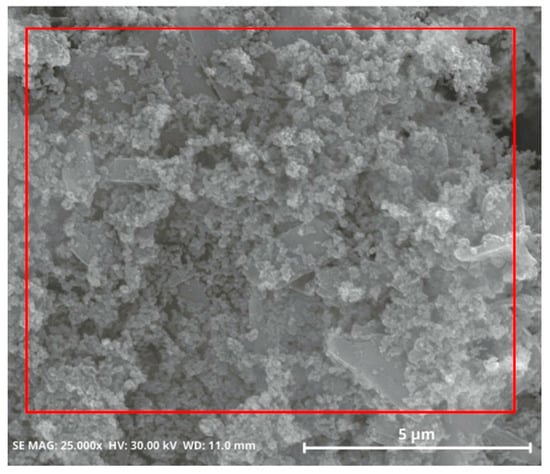
Figure 9.
SEM images of purified silica powder, which was removed with DI water at 60 °C for 3 h.
The dominant impurities were sodium and chloride, which were mostly removed, and this was confirmed by the EDS and XRF results (Table 5). Under similar treatments of synthesis silica, this study was compared to a previous study examining the effect of pH conditions on particle size. The size of the aggregates was 161 nm for pH 7 [8]. On the other hand, the size of particles at pH 2 was 26.3–95.8 nm (Figure 10).

Table 5.
Composition of purified silica after cleaning with deionized water. It was measured using XRF.
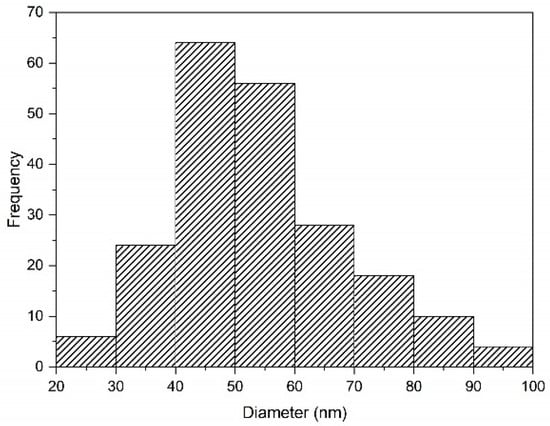
Figure 10.
Distribution of purified silica particles, which were removed with DI water at 60 °C for 3 h. Analyzed using ImageJ.
The size of the silica particles was small at low-pH conditions. Silica particles synthesized after adding HCl were agglomerated but well dispersed. The size of these agglomerated particles was reduced after cleaning with DI water. DI water played a significant role in controlling the particle size of silica during purification. During purification, the NaCl present on the surface of the particles was dissolved in the DI water. This result was supported by a previous study that generated smaller particles after cleaning with DI water.
To investigate the locations of impurities and wash away the impurities efficiently after the purification process, the morphology of silica was analyzed using SEM equipped with an EDS system. Specifically, most impurities were not detected on the surface region of the SEM-EDS images (Figure 11). The purification with DI water eliminated the residual impurities and improved the purity of the samples.
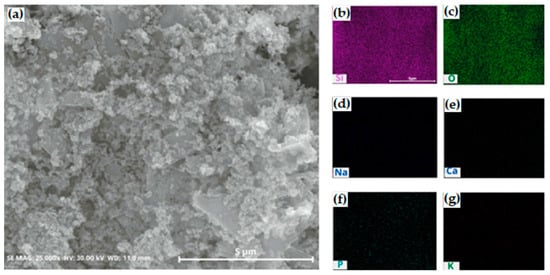
Figure 11.
(a) SEM and (b–g) EDS mapping images of silica after cleaning with deionized water. The purified silica was cleaned at 60 °C, 300 rpm, for 3 h. (b) silicon; (c) oxygen; (d) sodium; (e) calcium; (f) phosphor; (g) potassium.
The silica synthesized at a low pH consisted of spherical aggregates that could escape from the interparticle spaces of silica aggregates to the surface. Thus, the impurities were easily cleaned out and we achieved high cleaning efficiency. This result indicated that higher purity was achieved.
Table 5 shows the composition change after the synthesis process with HCl and the purification process with DI water, demonstrating that the purification process of precipitated silica with DI water dramatically increased the purity of the silica.
After purification, the change in composition in silica was from 58 wt% to 85 wt%. The resultant cleaning efficiency was 85 wt%.
3. Materials and Methods
3.1. Materials
In the present study, ferronickel slag from Southeast Sulawesi, Indonesia, was used as a raw material. Chemical composition analysis was performed by XRF (PANalytical, Almelo, The Netherlands), as shown in Table 6. Silica dominates the chemical composition at slightly under two fifths, followed by MgO and Fe2O3 at almost a quarter and less than a fifth, respectively. Moreover, a very small amount, less than 5%, is identified for each of the remaining compounds.

Table 6.
The chemical composition of ferronickel slag by XRF.
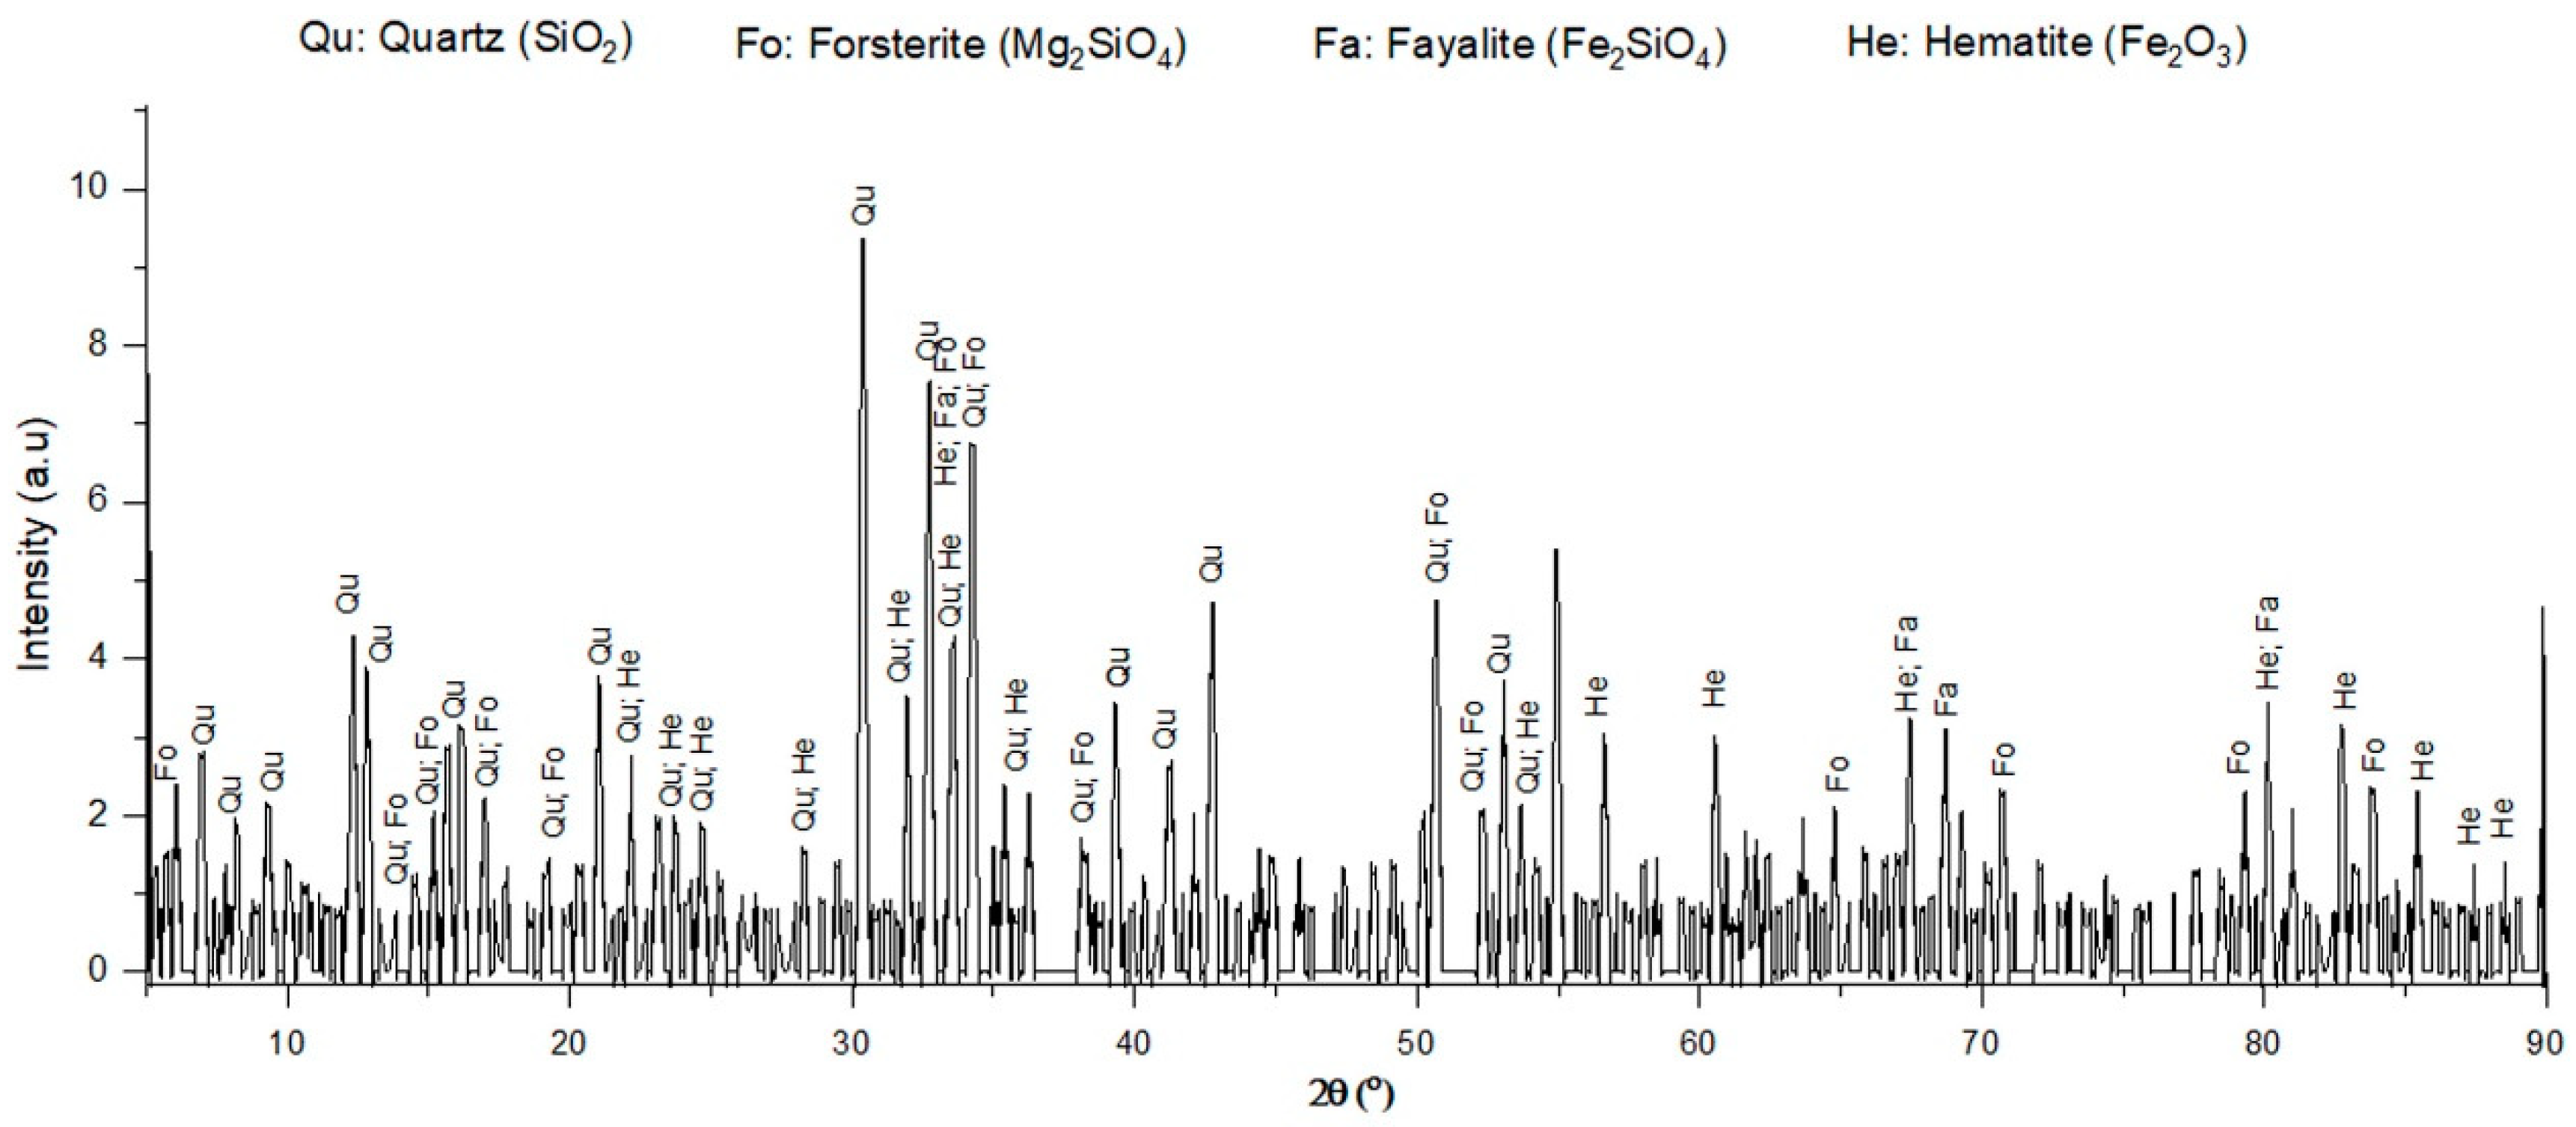
X-ray diffraction (PANalytical, The Netherlands) was used to observe the main phases of ferronickel slag, either crystalline or amorphous. As shown in Figure 12, there were four main compounds, quartz (SiO2), fayalite (Fe2SiO4), forsterite (Mg2SiO4), and hematite (Fe2O3), which was similar to the result of a previous study [6]. The results showed that ferronickel slag was in a crystalline state. Compared to XRF, Table 6 shows the elements that were the constituents of the compound considered in the XRD result, such as Fe, Mg, Si, and O. These elements indicate the presence of hematite (Fe2O3), silica (SiO2), forsterite (Mg2SiO4), and fayalite (Fe2SiO4).
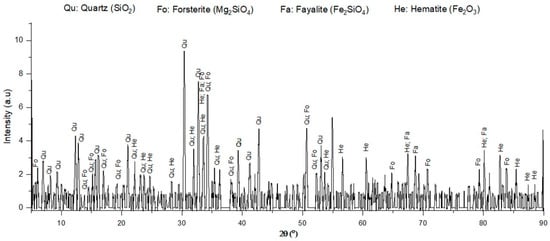
Figure 12.
XRD patterns of ferronickel slag.
Chemical analysis-grade materials, including Na2CO3, NaOH, and HCl, from Merck (Darmstadt, Germany), were used in this study, along with distilled water and DI water, which were needed for the dilution and cleaning process, respectively.
3.2. Methods
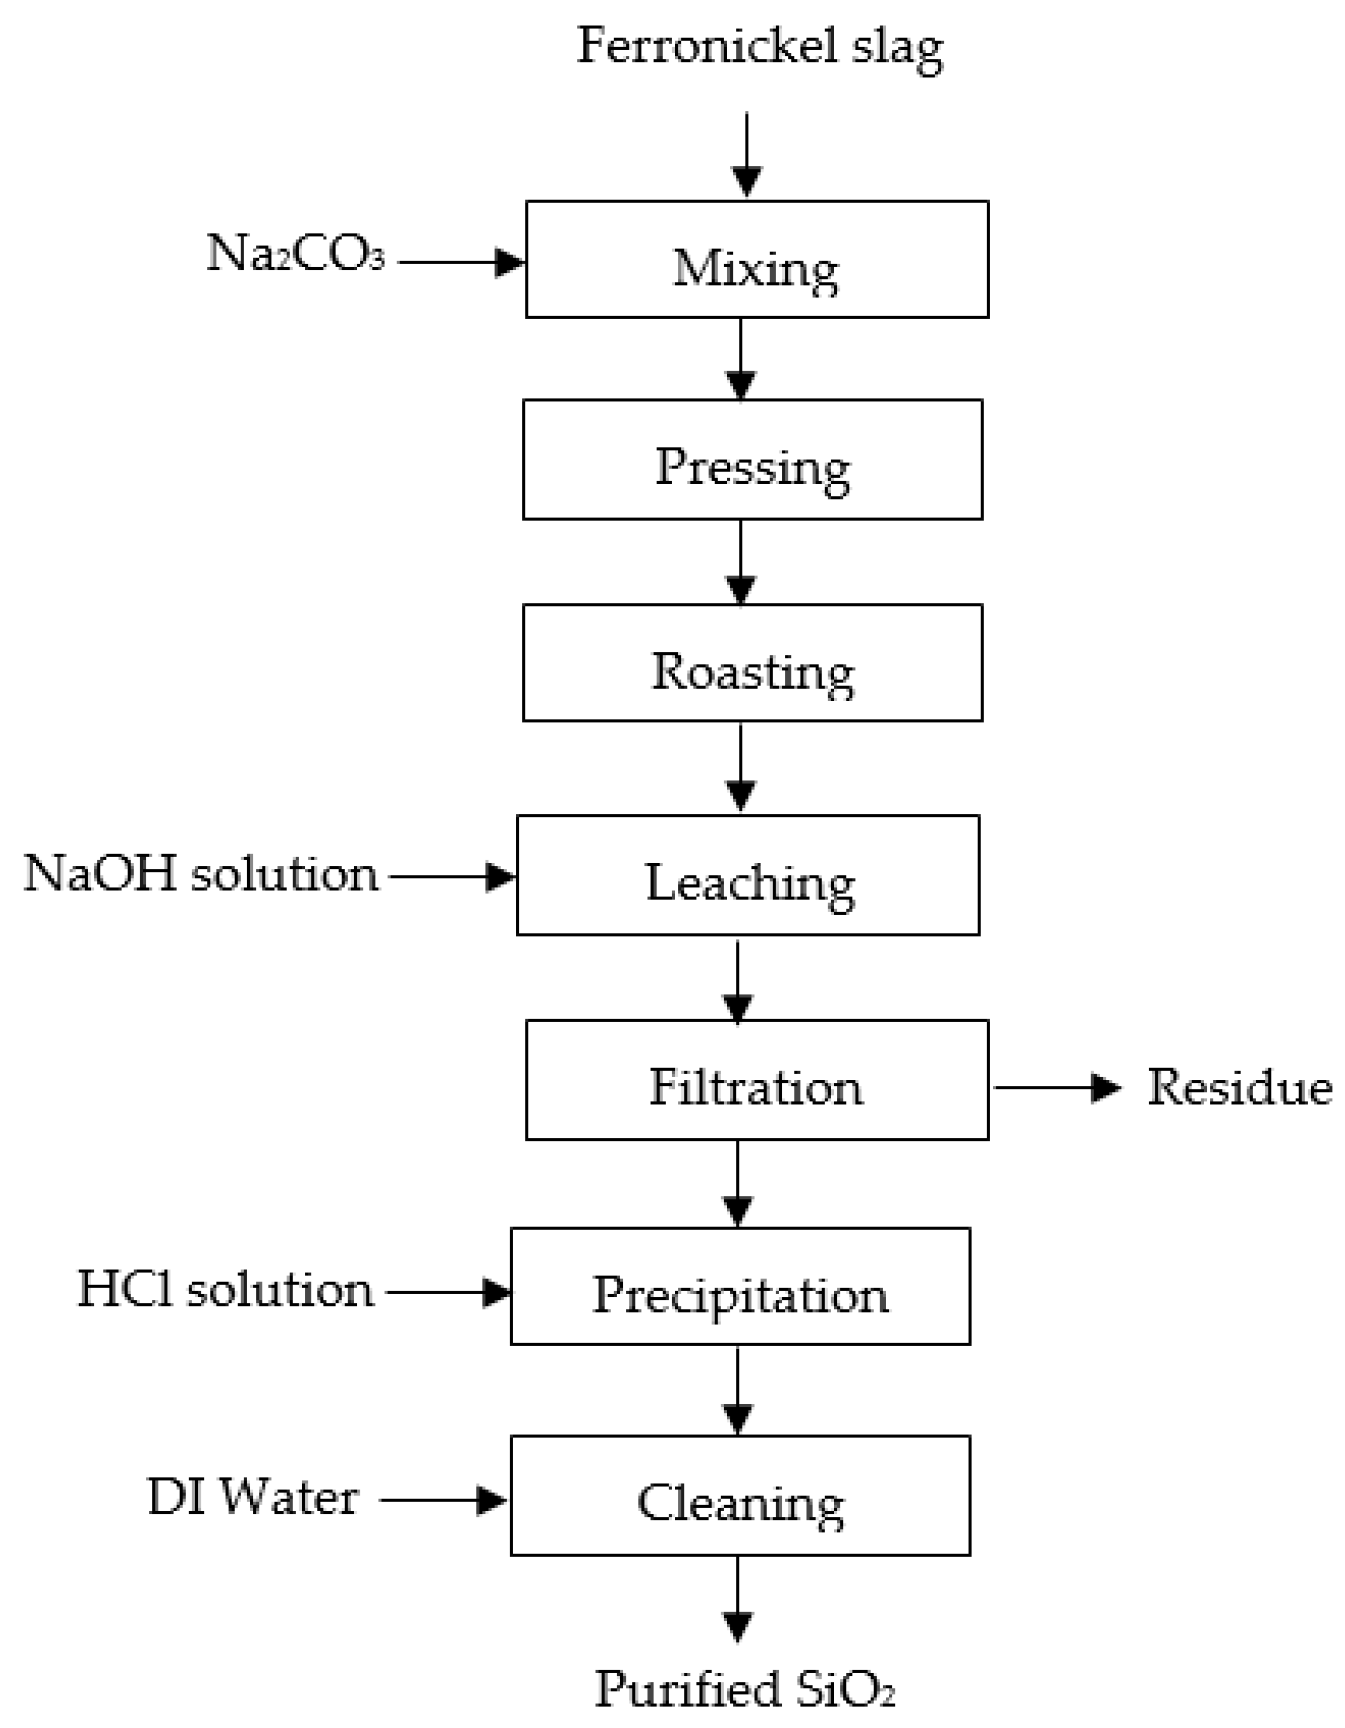
A flowchart of the pyro-hydrometallurgy route to recover silica from ferronickel slag is shown in Figure 13. There are four main steps, roasting, leaching, precipitation, and purification, which can be described as follows: (1) The roasting process was performed at 1000 °C for an hour, in inert conditions, using an alumina crucible. Previously, ferronickel slag and Na2CO3 were weighed in a 80:20 (wt%) ratio, respectively. The weighed materials were mixed with a disc mill and pressed with a hydraulic pressing machine to obtain the samples in briquette form, with a diameter of 2 cm, and then the roasting process was performed. Roasted briquettes were milled to obtain fine particles; (2) The leaching process was conducted on the fine particles of the roasted product in various concentrations of NaOH (4, 6, 8, and 10 M), at various leaching times (2, 4 and 6 h), at a leaching temperature of 95 °C, stirring speed of 300 rpm, and a solid/liquid (s/L) weight ratio of 1/10. The roasted product was added to the NaOH solution when these conditions were reached. Under alkaline conditions, leaching at a high temperature could increase sodium silicate dissolution [23,26]. Then, filtration was performed to separate the residue and the filtrate; (3) The precipitation process was conducted on the filtrate to produce silica at 90 °C and a stirring speed of 300 rpm by adding 1:4 hydrochloric acid solution gradually up to pH 2. Then, a 1:4 hydrochloric acid solution was obtained by mixing hydrochloric acid and distilled water with a volumetric ratio of 1:4, respectively. Precipitated silica was collected and dried at 45 °C for 24 h to obtain silica powder; (4) The precipitated silica was purified by cleaning with deionized water for 3 h at 60 °C. A double-stage cleaning method was conducted to minimize the impurities before the drying process was performed at 45 °C for 24 h to produce high-purity silica.
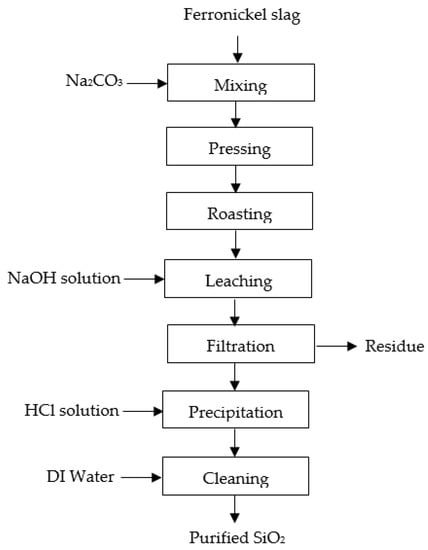
Figure 13.
The flowchart of pyro-hydrometallurgy route to recover silica from Indonesian ferronickel slag.
3.3. Characterization
XRF analysis (PANalytical, The Netherlands) was carried out to determine the chemical composition of the raw ferronickel slag, roasted slag, precipitated silica, and purified silica. Moreover, SEM-EDS with EDAX was also performed to characterize the morphology and perform the mapping and semi-quantitative analysis of precipitated silica and purified silica. The distribution of the particle size from SEM images was then analyzed using ImageJ. Phases transformation from each process was analyzed by XRD using a Panalytical Epsilon 1 device, using a Cu anode and wavelength of 1.5406 Å. The silicon content in the leaching filtrate was characterized using the ICP-OES 725 from Agilent and subsequently used for extraction efficiency calculation, as follows:
where Ci and Csi are the initial silicon content in the roasted product and the silicon content in the leaching filtrate, respectively, while Mi and Msi are the initial mass of the roasted product used for the leaching process and the mass extracted in the leaching filtrate, respectively.
4. Conclusions
Pyro-hydrometallurgy methods were conducted to recover silica from Indonesian ferronickel slag. A sodium silicate phase formed during the roasting process of the ferronickel slag with Na2CO3 addition. Decomposition occurred mostly for SiO2 and Fe2SiO4.
The extraction efficiency was affected by the concentration and duration of leaching. At the same time, the use of a high concentration of NaOH and a longer period of leaching produced high silicon extraction in the pregnant solution. It was discovered that the highest extraction efficiency of silicon in the filtrate after the leaching process could be reached at an NaOH concentration of 8 M and leaching time of 6 h, with an extraction efficiency of 61.75%.
The precipitation of the filtrate using HCl resulted in precipitated silica and NaCl as impurities. The purity of the precipitated silica can be dramatically increased via a purification process using DI water, which could enhance the dissolution and separation of NaCl from the precipitated silica and also reduce its particle size.
Eventually, in this study, silica with high purity was obtained using pyro-hydrometallurgy methods from ferronickel slag at the amount and particle size of 85.41% and 26.3–95.8 nm, respectively. In the future, the optimization of the roasting process, including the composition of mixtures and process conditions, should be carried out to maximize the sodium silicate formation. Moreover, variation in the s/L ratio and stirring speed during the leaching process can be used to tackle the glass layer formation that could hinder further dissolution, and heat treatment may be an option to enhance the purity of silica, since it can eliminate phosphor and chloride substances.
Author Contributions
R.M.U.: validation, writing original draft preparation, writing review and editing; N.: investigation, visualization, software analysis; R.R.: methodology, funding acquisition; W.M.: data analysis, supervision, writing review; A.B.P.: investigation, editing; J.W.S.: conceptualization, methodology; A.M.: project administration. All authors have read and agreed to the published version of the manuscript.
Funding
This research and the APC were funded by PDUPT–Kementerian Pendidikan, Kebudayaan, Riset dan Teknologi Tahun Anggaran 2022, SK No. 8/E1/KP.PTNBH/2021 and No: NKB-857/UN2.RST/HKP.05.00/2022.
Data Availability Statement
The data presented in this study are available on request from the corresponding author.
Acknowledgments
The authors gratefully acknowledge the funding from “PDUPT–Kementerian Pendidikan, Kebudayaan, Riset dan Teknologi Tahun Anggaran 2022, SK No. 8/E1/KP.PTNBH/2021 and No: NKB-857/UN2.RST/HKP.05.00/2022.
Conflicts of Interest
The authors declare no conflict of interest.
Abbreviations
| Ci | initial silicon concentration in the roasted product |
| Csi | silicon dissolved in the leachate |
| DI | deionized |
| Mi | initial mass for leaching process |
| Msi | dissolved roasted product mass in the leachate |
| ICP-OES | Inductively Coupled Plasma–Optical Emission Spectroscopy |
| SEM-EDS | Scanning Electron Microscopy–Energy-Dispersive Emission |
| s/L ratio | solid/liquid ratio |
| SSS | sodium silicate solution |
| XRD | X-ray Diffraction |
| XRF | X-ray Fluorescence |
References
- Rosso, P.; Ye, L.; Friedrich, K.; Sprenger, S. A toughened epoxy resin by silica nanoparticle reinforcement. J. Appl. Polym. Sci. 2006, 100, 1849–1855. [Google Scholar] [CrossRef]
- Lin, Y.-S.; Hurley, K.R.; Haynes, C.L. Critical considerations in the biomedical use of mesoporous silica nanoparticles. J. Phys. Chem. Lett. 2012, 3, 364–374. [Google Scholar] [CrossRef]
- Liu, B.; Li, C.; Cheng, Z.; Hou, Z.; Huang, S.; Lin, J. Functional nanomaterials for near-infrared-triggered cancer therapy. Biomater. Sci. 2016, 4, 890–909. [Google Scholar] [CrossRef]
- Wang, Y.; Zhao, Q.; Han, N.; Bai, L.; Li, J.; Liu, J.; Che, E.; Hu, L.; Zhang, Q.; Jiang, T.; et al. Mesoporous silica nanoparticles in drug delivery and biomedical applications. Nanomed. Nanotechnol. Biol. Med. 2015, 11, 313–327. [Google Scholar] [CrossRef]
- Jung, D.S.; Ryou, M.H.; Sung, Y.J.; Park, S.B.; Choi, J.W. Recycling rice husks for high-capacity lithium battery anodes. Proc. Natl. Acad. Sci. USA 2013, 110, 12229–12234. [Google Scholar] [CrossRef]
- Shen, Y. Rice husk silica-derived nanomaterials for battery applications: A literature review. J. Agric. Food Chem. 2017, 65, 995–1004. [Google Scholar] [CrossRef]
- Van Tuan, N.; Ye, G.; Breugel, K.V.; Copuroglu, O. Hydration and microstructure of ultra high performance concrete incorporating rice husk ash. Cem. Concr. Res. 2011, 41, 1104–1111. [Google Scholar] [CrossRef]
- Martirena, F.; Monzó, J. Vegetable ashes as supplementary cementitious materials. Cem. Concr. Res. 2018, 114, 57–64. [Google Scholar] [CrossRef]
- Kang, S.-H.; Kwon, Y.H.; Hong, S.G.; Chun, S.; Moon, J. Hydrated lime activation on byproducts for eco-friendly production of structural mortars. J. Clean. Prod. 2019, 231, 1389–1398. [Google Scholar] [CrossRef]
- Bhattacharyya, S.C. Viability of off-grid electricity supply using rice husk: A case study from South Asia. Biomass Bioenergy 2014, 68, 44–54. [Google Scholar] [CrossRef]
- Yuliarto, B.; Zhou, H.; Yamada, T.; Honma, I.; Katsumura, Y.; Ichihara, M. Effect of tin addition on mesoporous silica thin film and its application for surface photovoltage NO2 gas sensor. Anal. Chem. 2004, 76, 6719–6726. [Google Scholar] [CrossRef]
- Singh, L.P.; Bhattacharyya, S.K.; Kumar, R.; Mishra, G.; Sharma, U.; Singh, G.; Ahalawat, S. Sol-Gel processing of silica nanoparticles and their applications. Adv. Colloid Interface Sci. 2014, 214, 17–37. [Google Scholar] [CrossRef]
- Choi, J.S.; An, S.J. The effect of pH on synthesis of nano-silica using water glass. Korean J. Mater. Res. 2015, 25, 209–213. [Google Scholar] [CrossRef]
- Mayangsari, W.; Prasetyo, A.B.; Febriana, E.; Januar, I.; Subagja, R.; Firdiyono, F.; Soedarsono, J.W. The Effect of Roasting Prior to The Leaching Process of Alkalinized Ferronickel Slag Followed by Precipitation Process. Metalurgi 2021, 36, 43–50. [Google Scholar] [CrossRef]
- Gu, B.; Ko, D.; Ahn, S.; Hyun, D.C.; Lee, H.K.; Kim, J. Synthesis of high purity silica from low cost water glass via sol–gel process and soxhlet extraction. J. Sol-Gel Sci. Technol. 2017, 82, 675–681. [Google Scholar] [CrossRef]
- Indonesian Ministry of Industry. Slag Nikel & Baja Bakal Dikeluarkan dari Kategori B3. 2020. Available online: https://kemenperin.go.id/artikel/21406/Slag-Nikel-&-Baja-Bakal-Dikeluarkan-dari-Kategori-B3 (accessed on 25 August 2021).
- Mufakhir, F.; Mubarok, M.; Ichlas, Z. Leaching of silicon from ferronickel (FeNi) smelting slag with sodium hydroxide solution at atmospheric pressure. IOP Conf. Ser. Mater. Sci. Eng. 2018, 285, 012003. [Google Scholar] [CrossRef]
- Prasetyo, A.B.; Maksum, A.; Soedarsono, J.W.; Firdiyono, F. Thermal characteristics of ferronickel slag on roasting process with addition of sodium carbonate (Na2CO3). IOP Conf. Ser. Mater. Sci. Eng. 2019, 541, 012037. [Google Scholar] [CrossRef]
- Mayangsari, W.; Avifah, I.N.; Prasetyo, A.B.; Febriana, E.; Maksum, A.; Ulum, R.M.; Firdiyono, F.; Subagja, R.; Soedarson, J.W. Decomposition of Ferronickel Slag Through Alkali Fusion in the Roasting Process. Eastern-Eur. J. Enterp. Technol. 2021, 2, 110. [Google Scholar] [CrossRef]
- Fang, D.; Xue, J.; Xuan, L. Recycling SiO2 and Al2O3 from the laterite nickel slag in molten sodium hydroxides. In TMS Annual Meeting & Exhibition; Springer: Cham, Switzerland, 2018. [Google Scholar]
- Alfariz, M.D.; Mayangsari, W.; Prasetyo, A.B.; Maksum, A.; Prasetyo, T.; Ulum, R.M.; Soedarsono, J.W. Effect of sodium carbonate (Na2CO3) additives and palm kernel shell charcoal to increase nickel and iron content from ferronickel slag using the pyrometallurgical method. AIP Conf. Proc. 2020, 2255, 040034. [Google Scholar]
- Maragkos, I.; Giannopoulou, I.P.; Panias, D. Synthesis of ferronickel slag-based geopolymers. Miner. Eng. 2009, 22, 196–203. [Google Scholar] [CrossRef]
- Alam, Q.; Hendrix, Y.; Thijs, L.; Lazaro, A.; Schollbach, K.; Brouwers, H.J.H. Brouwers, Novel low temperature synthesis of sodium silicate and ordered mesoporous silica from incineration bottom ash. J. Clean. Prod. 2019, 211, 874. [Google Scholar] [CrossRef]
- Xiao, Q.; Chen, Y.; Gao, Y.; Xu, H.; Zhang, Y. Leaching of silica from vanadium-bearing steel slag in sodium hydroxide solution. Hydrometallurgy 2010, 104, 216–221. [Google Scholar] [CrossRef]
- Rao, R.N.; Talluri, M.K. An overview of recent applications of inductively coupled plasma-mass spectrometry (ICP-MS) in determination of inorganic impurities in drugs and pharmaceuticals. J. Pharm. Biomed. Anal. 2007, 43, 1–13. [Google Scholar]
- Torres-Carrasco, M.; Palomo, A.; Puertas, F. Sodium silicate solutions from dissolution of glass wastes. Statistical Analysis. Mater. Construcción 2014, 64, e014. [Google Scholar] [CrossRef]
Disclaimer/Publisher’s Note: The statements, opinions and data contained in all publications are solely those of the individual author(s) and contributor(s) and not of MDPI and/or the editor(s). MDPI and/or the editor(s) disclaim responsibility for any injury to people or property resulting from any ideas, methods, instructions or products referred to in the content. |
© 2023 by the authors. Licensee MDPI, Basel, Switzerland. This article is an open access article distributed under the terms and conditions of the Creative Commons Attribution (CC BY) license (https://creativecommons.org/licenses/by/4.0/).

