Hydrocyclone Separation of Hydrogen Decrepitated NdFeB †

 ,
,
Abstract
:1. Introduction
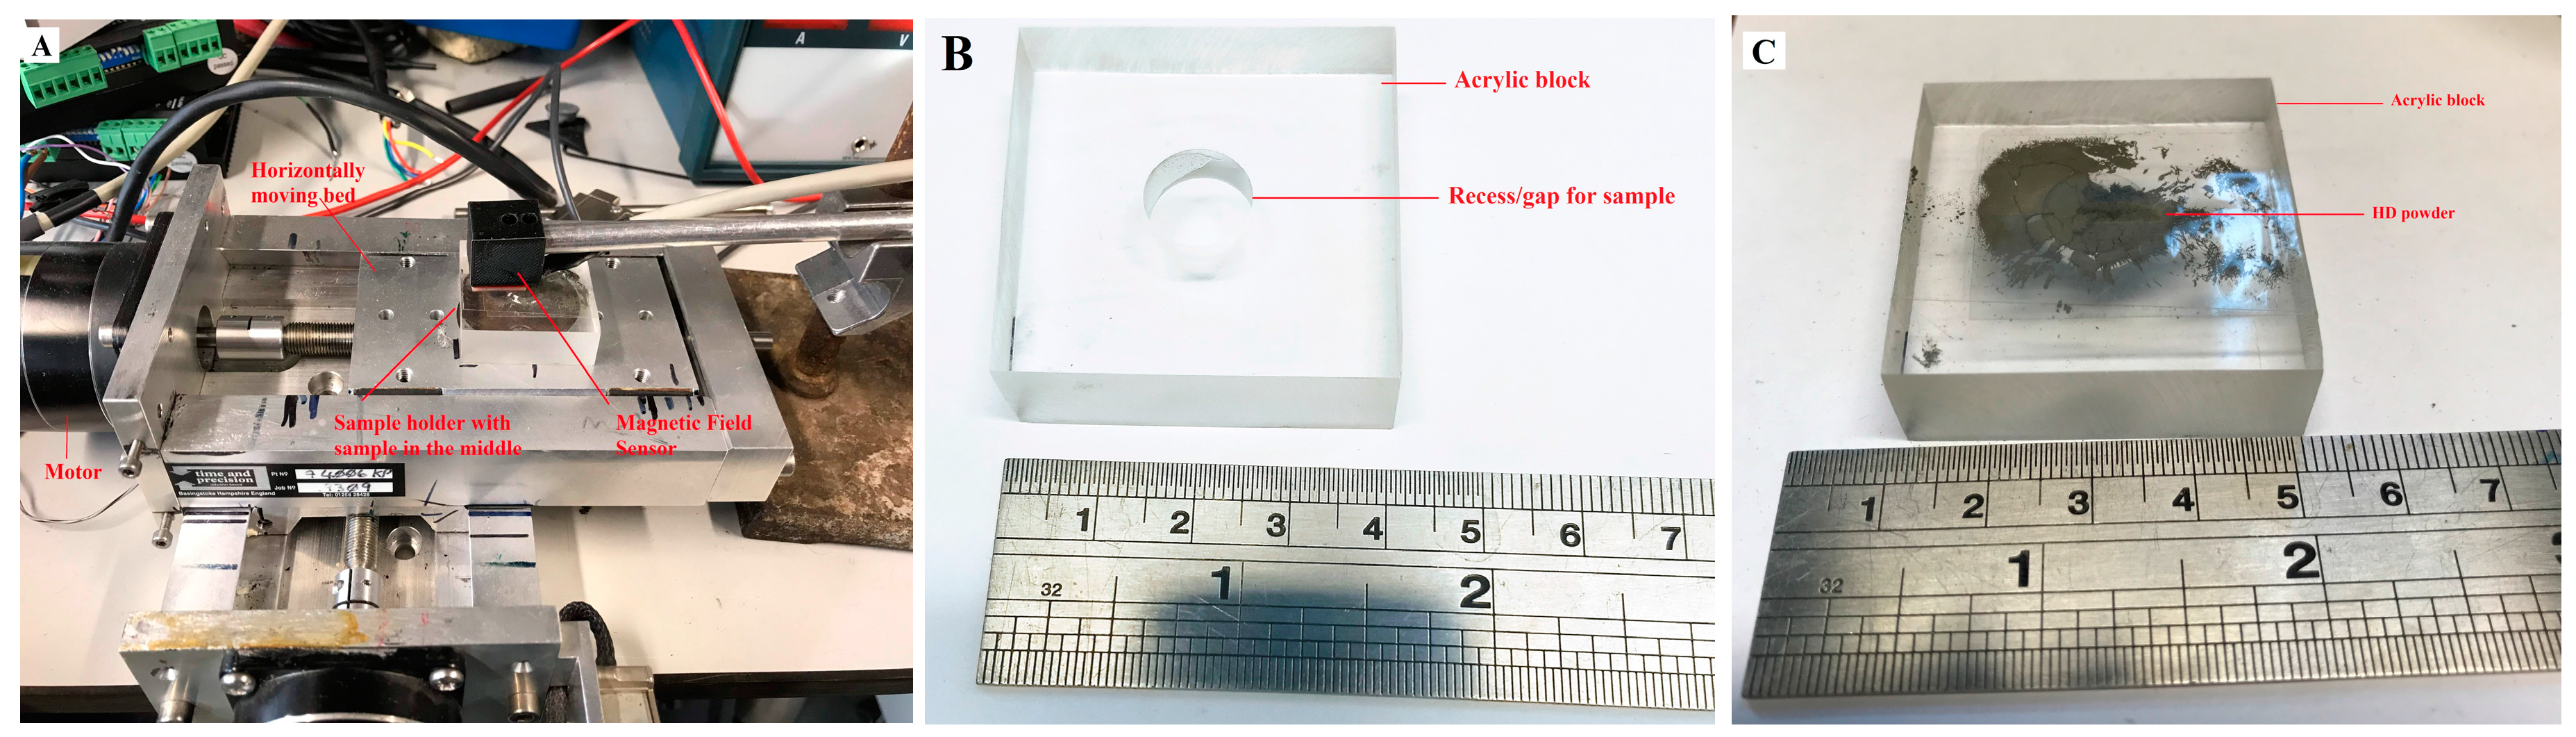
2. Experimental
2.1. Material
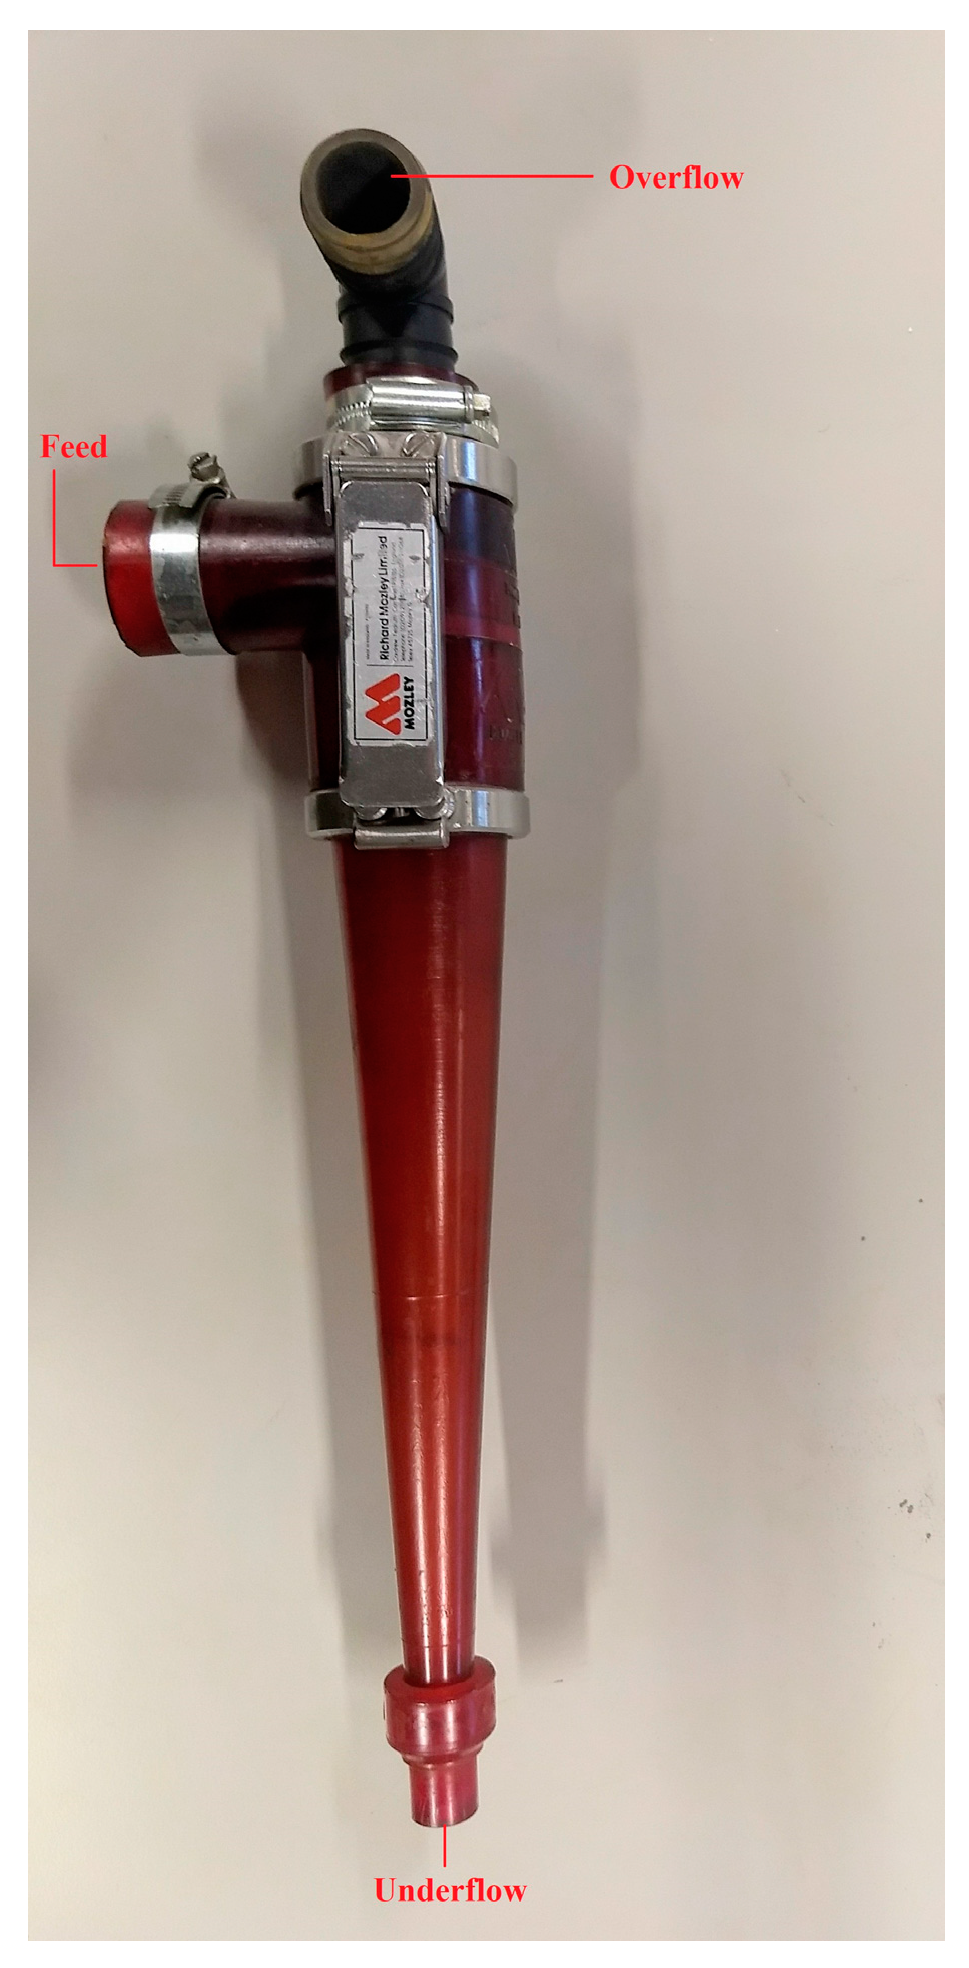
2.2. Working Principle of Hydrocyclones
2.3. Methods
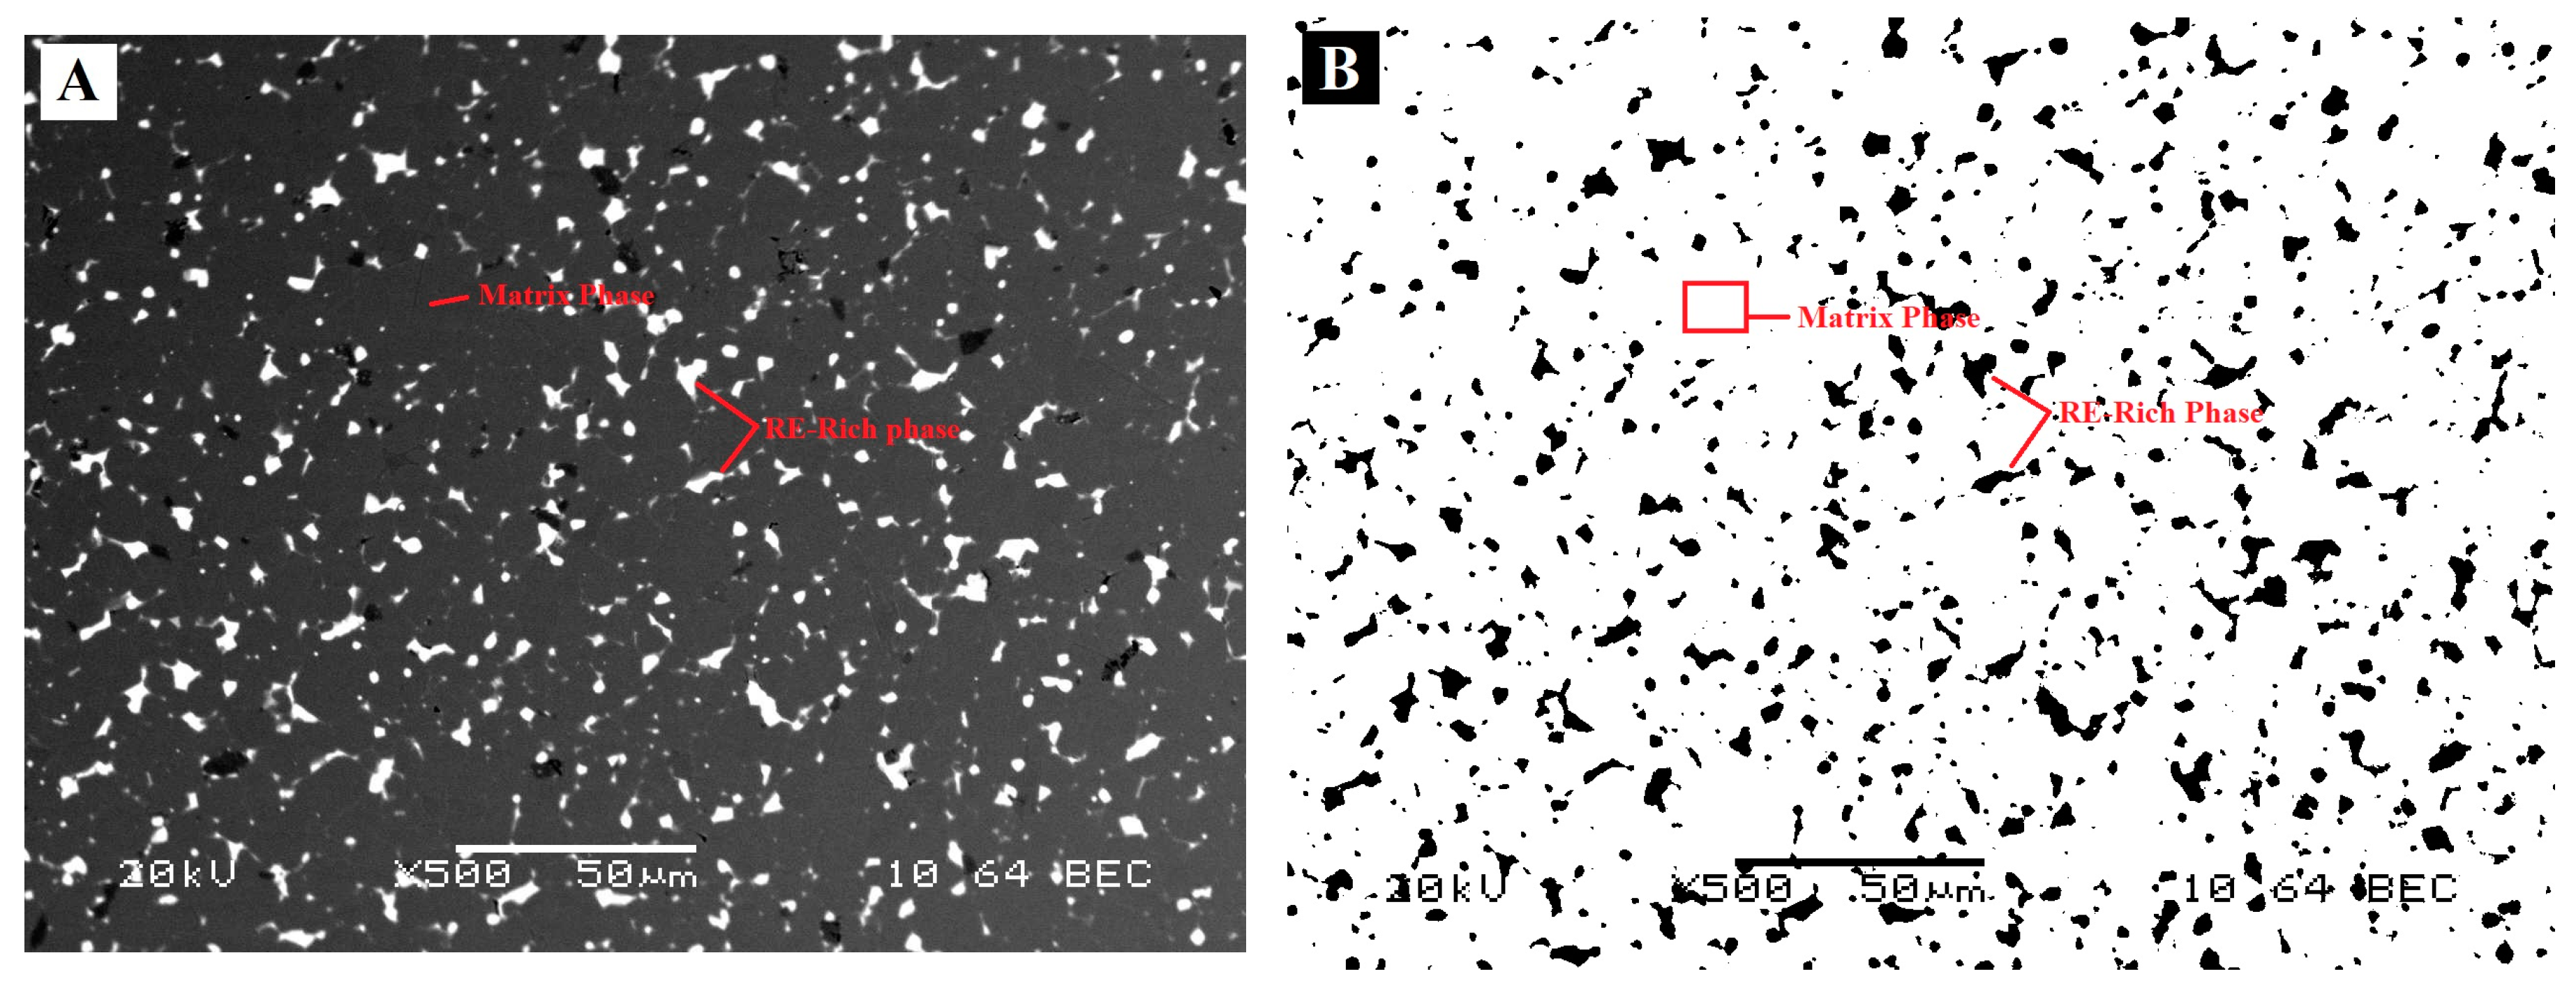
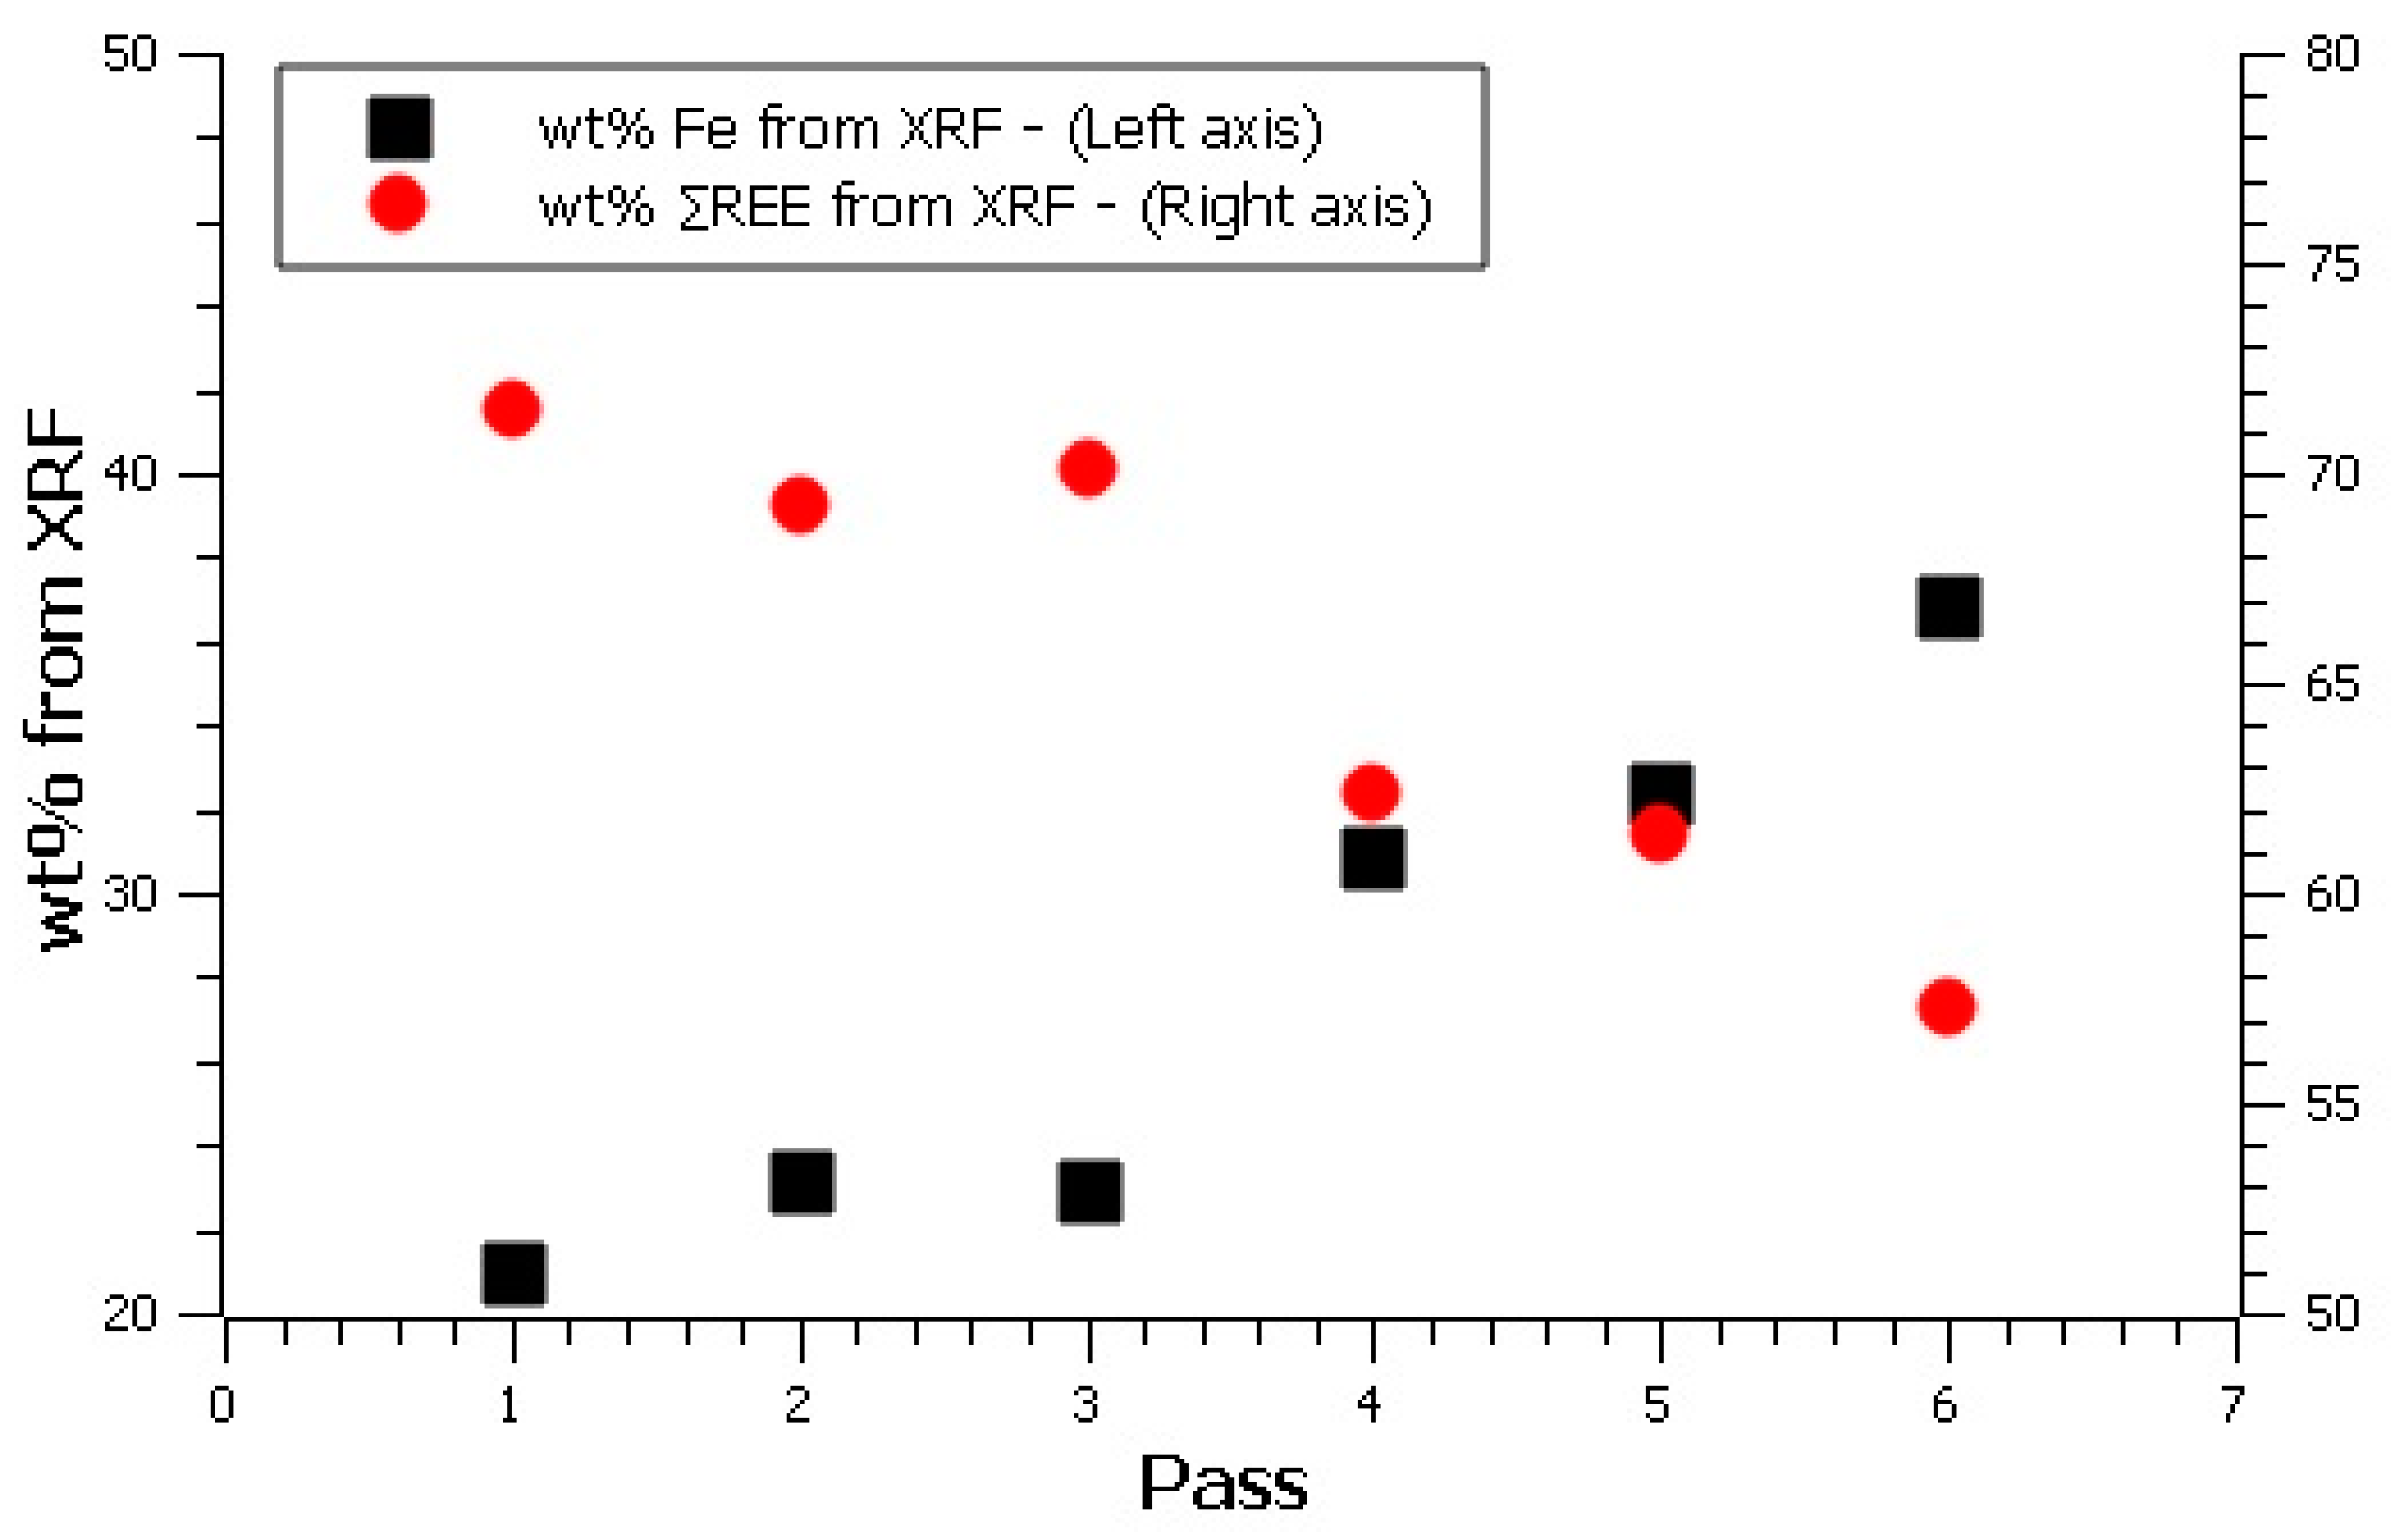
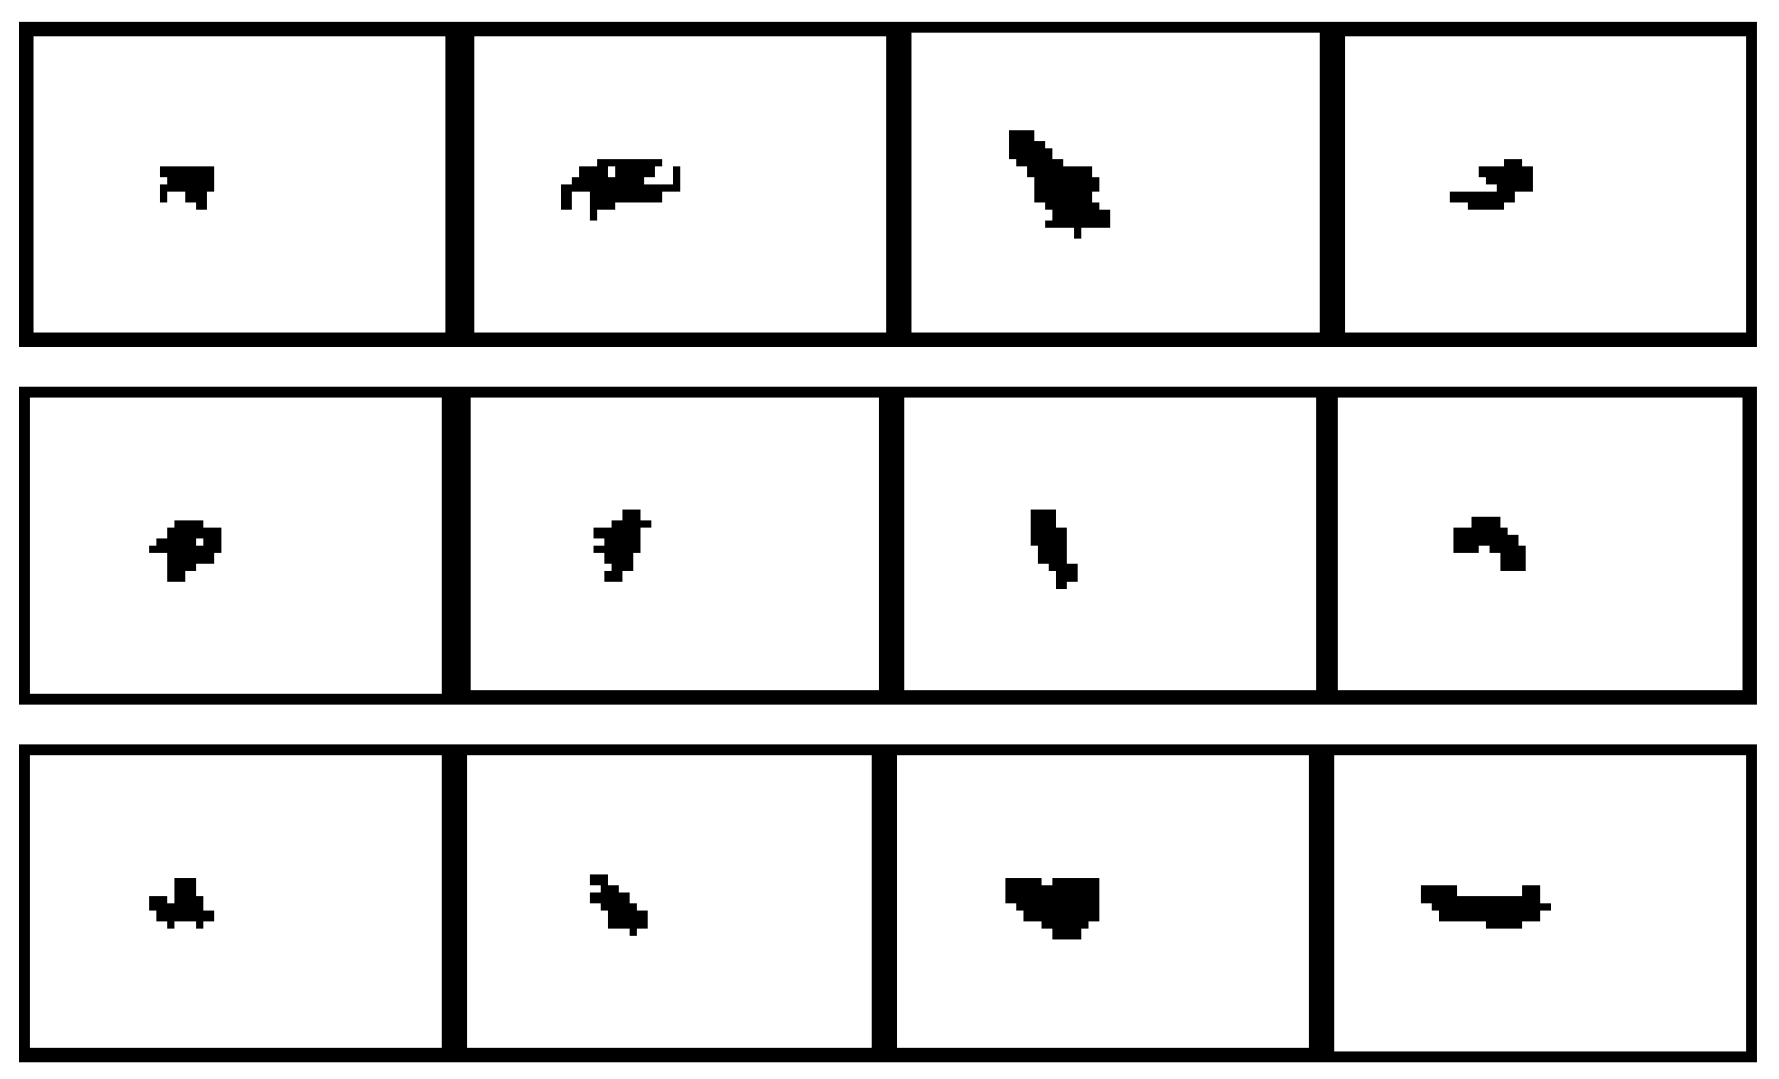
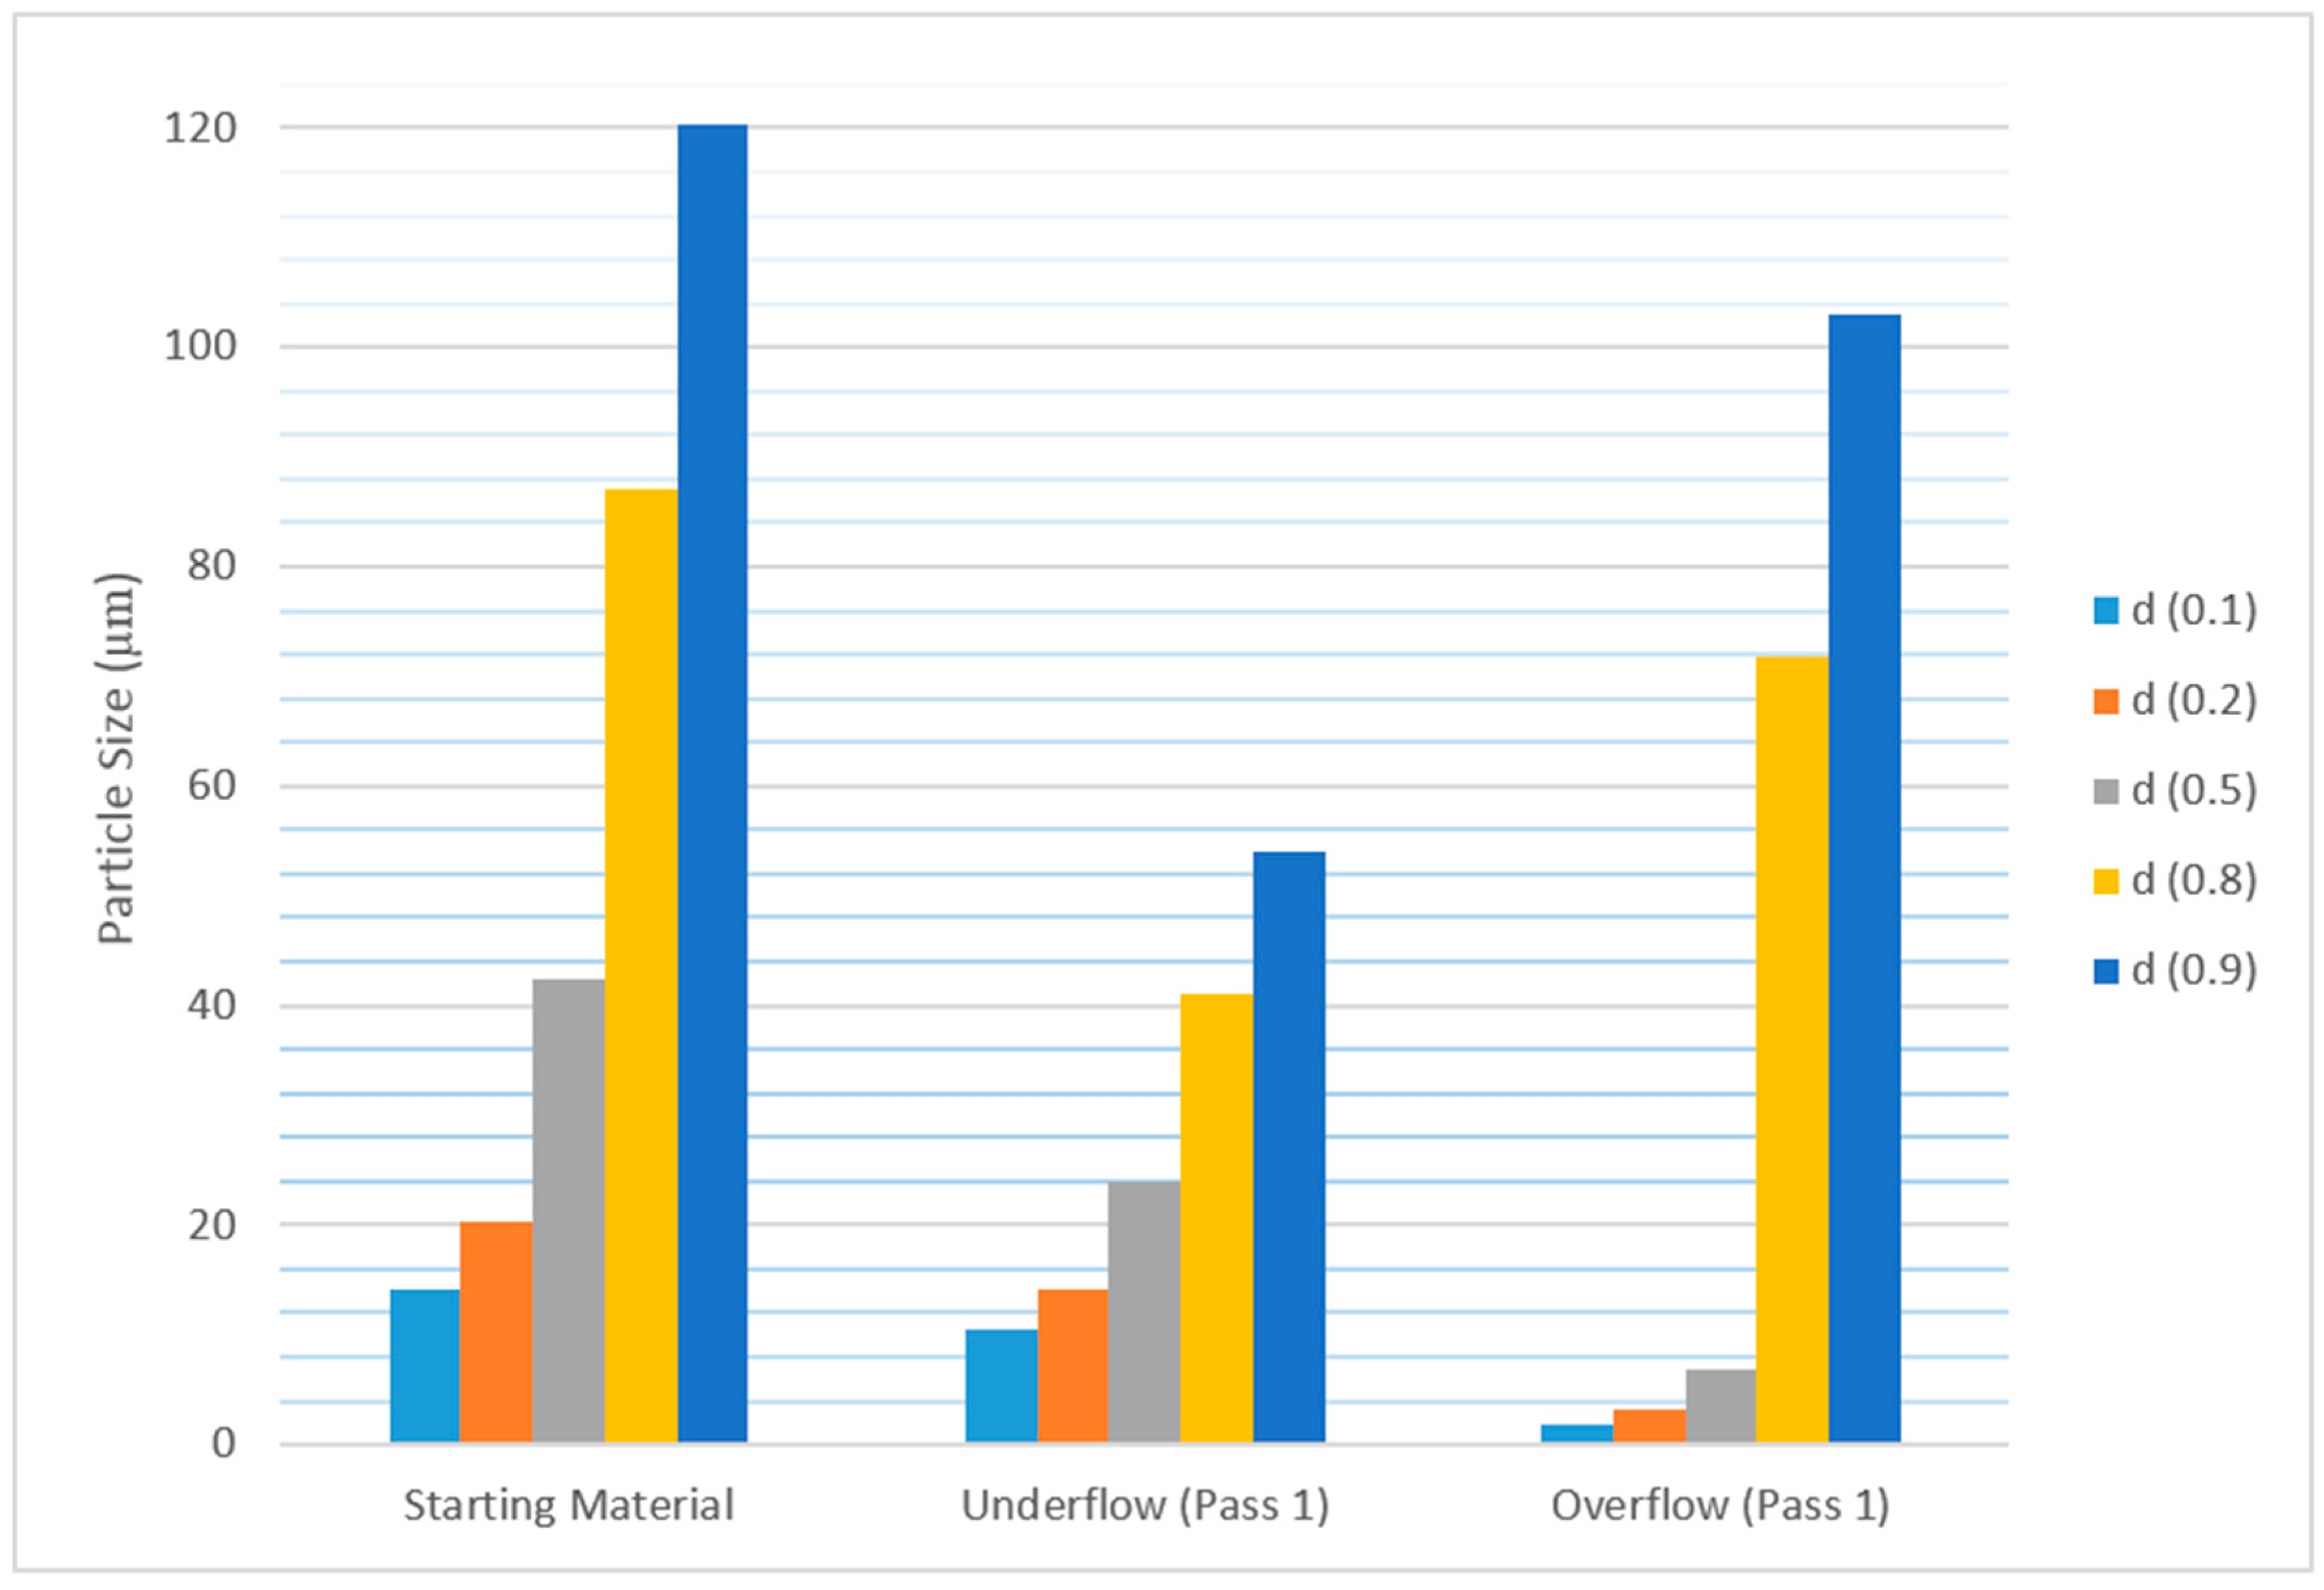
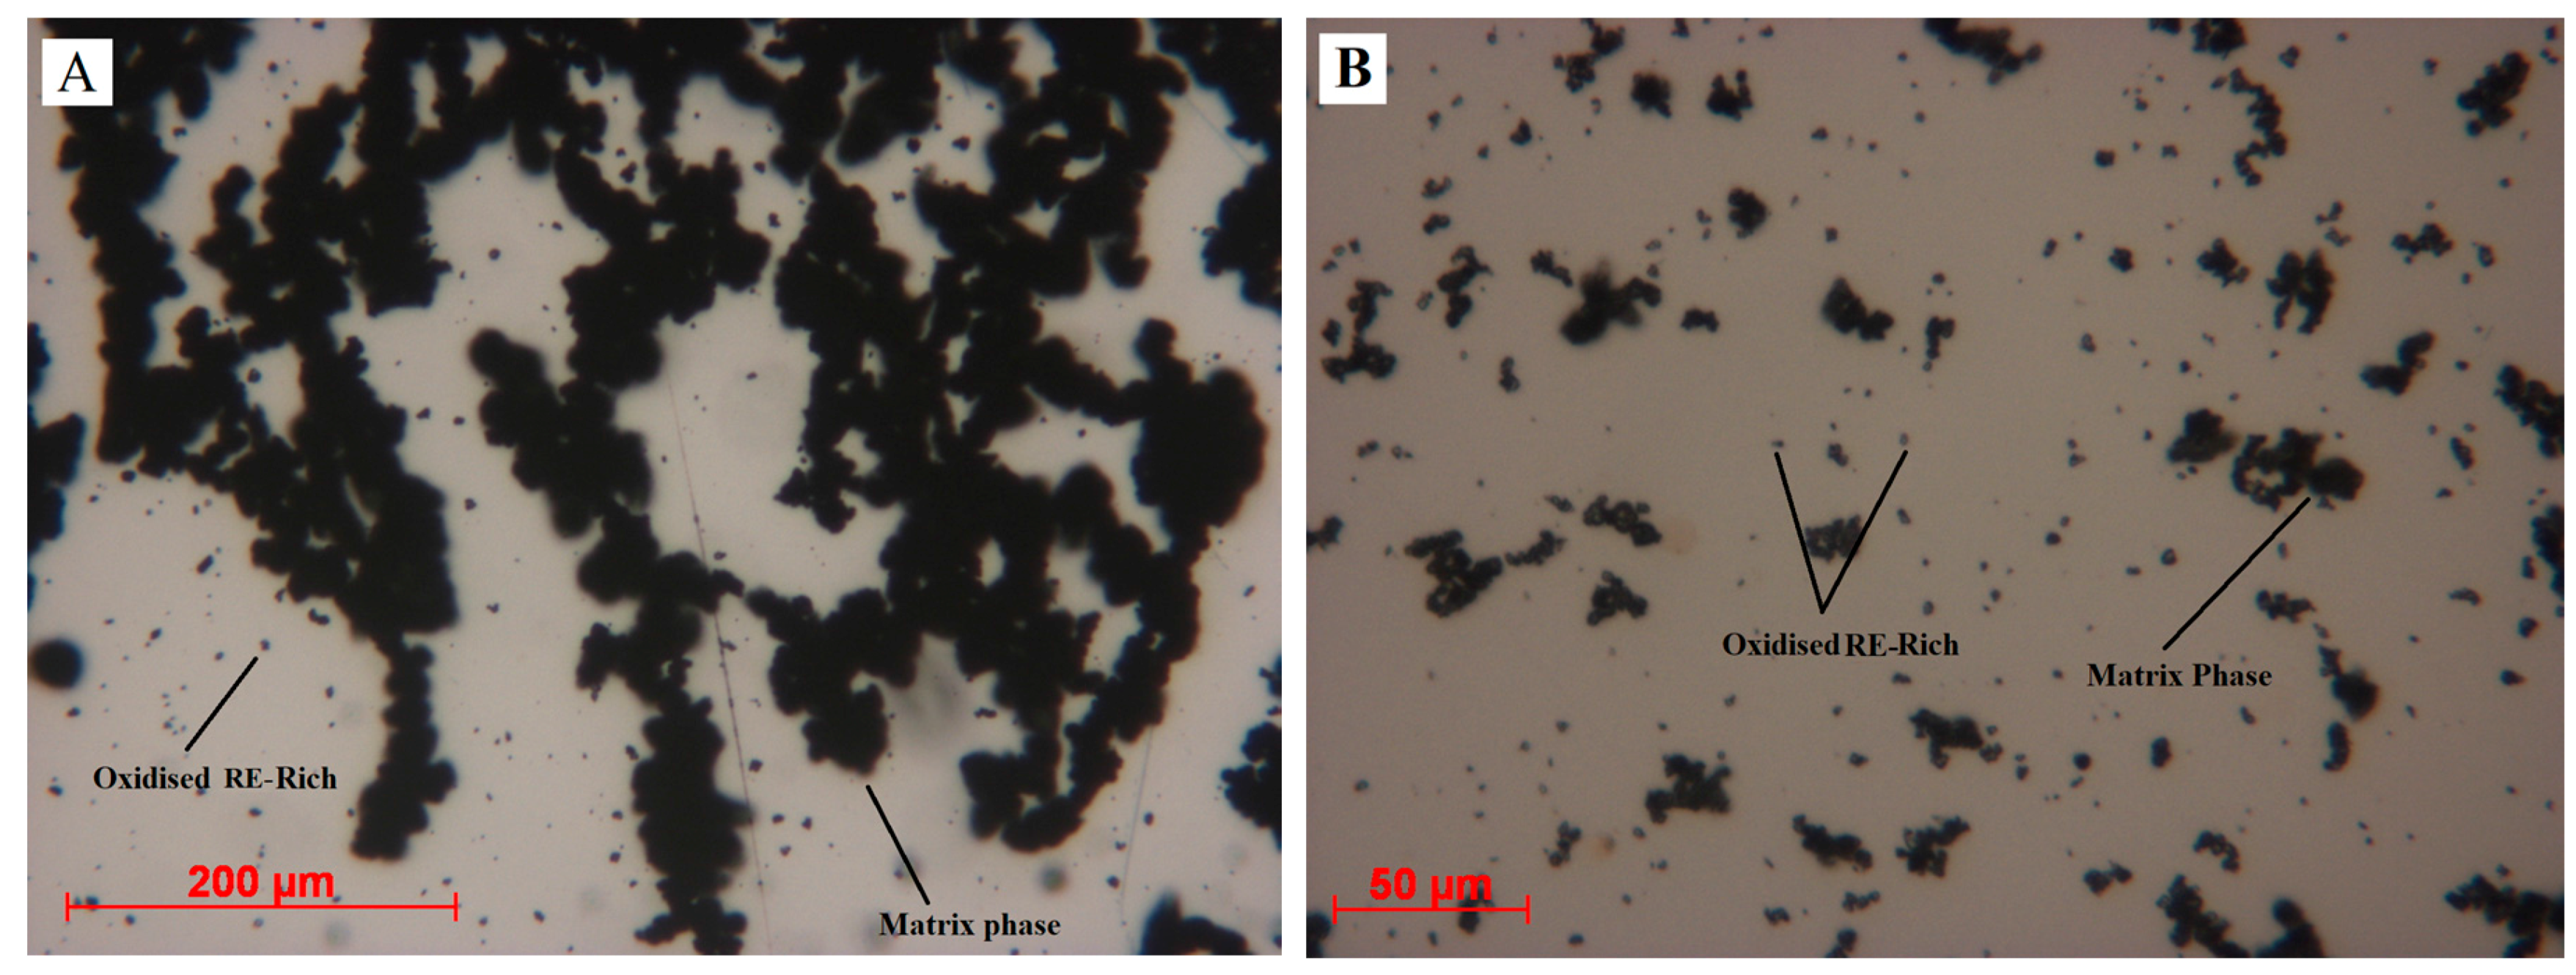
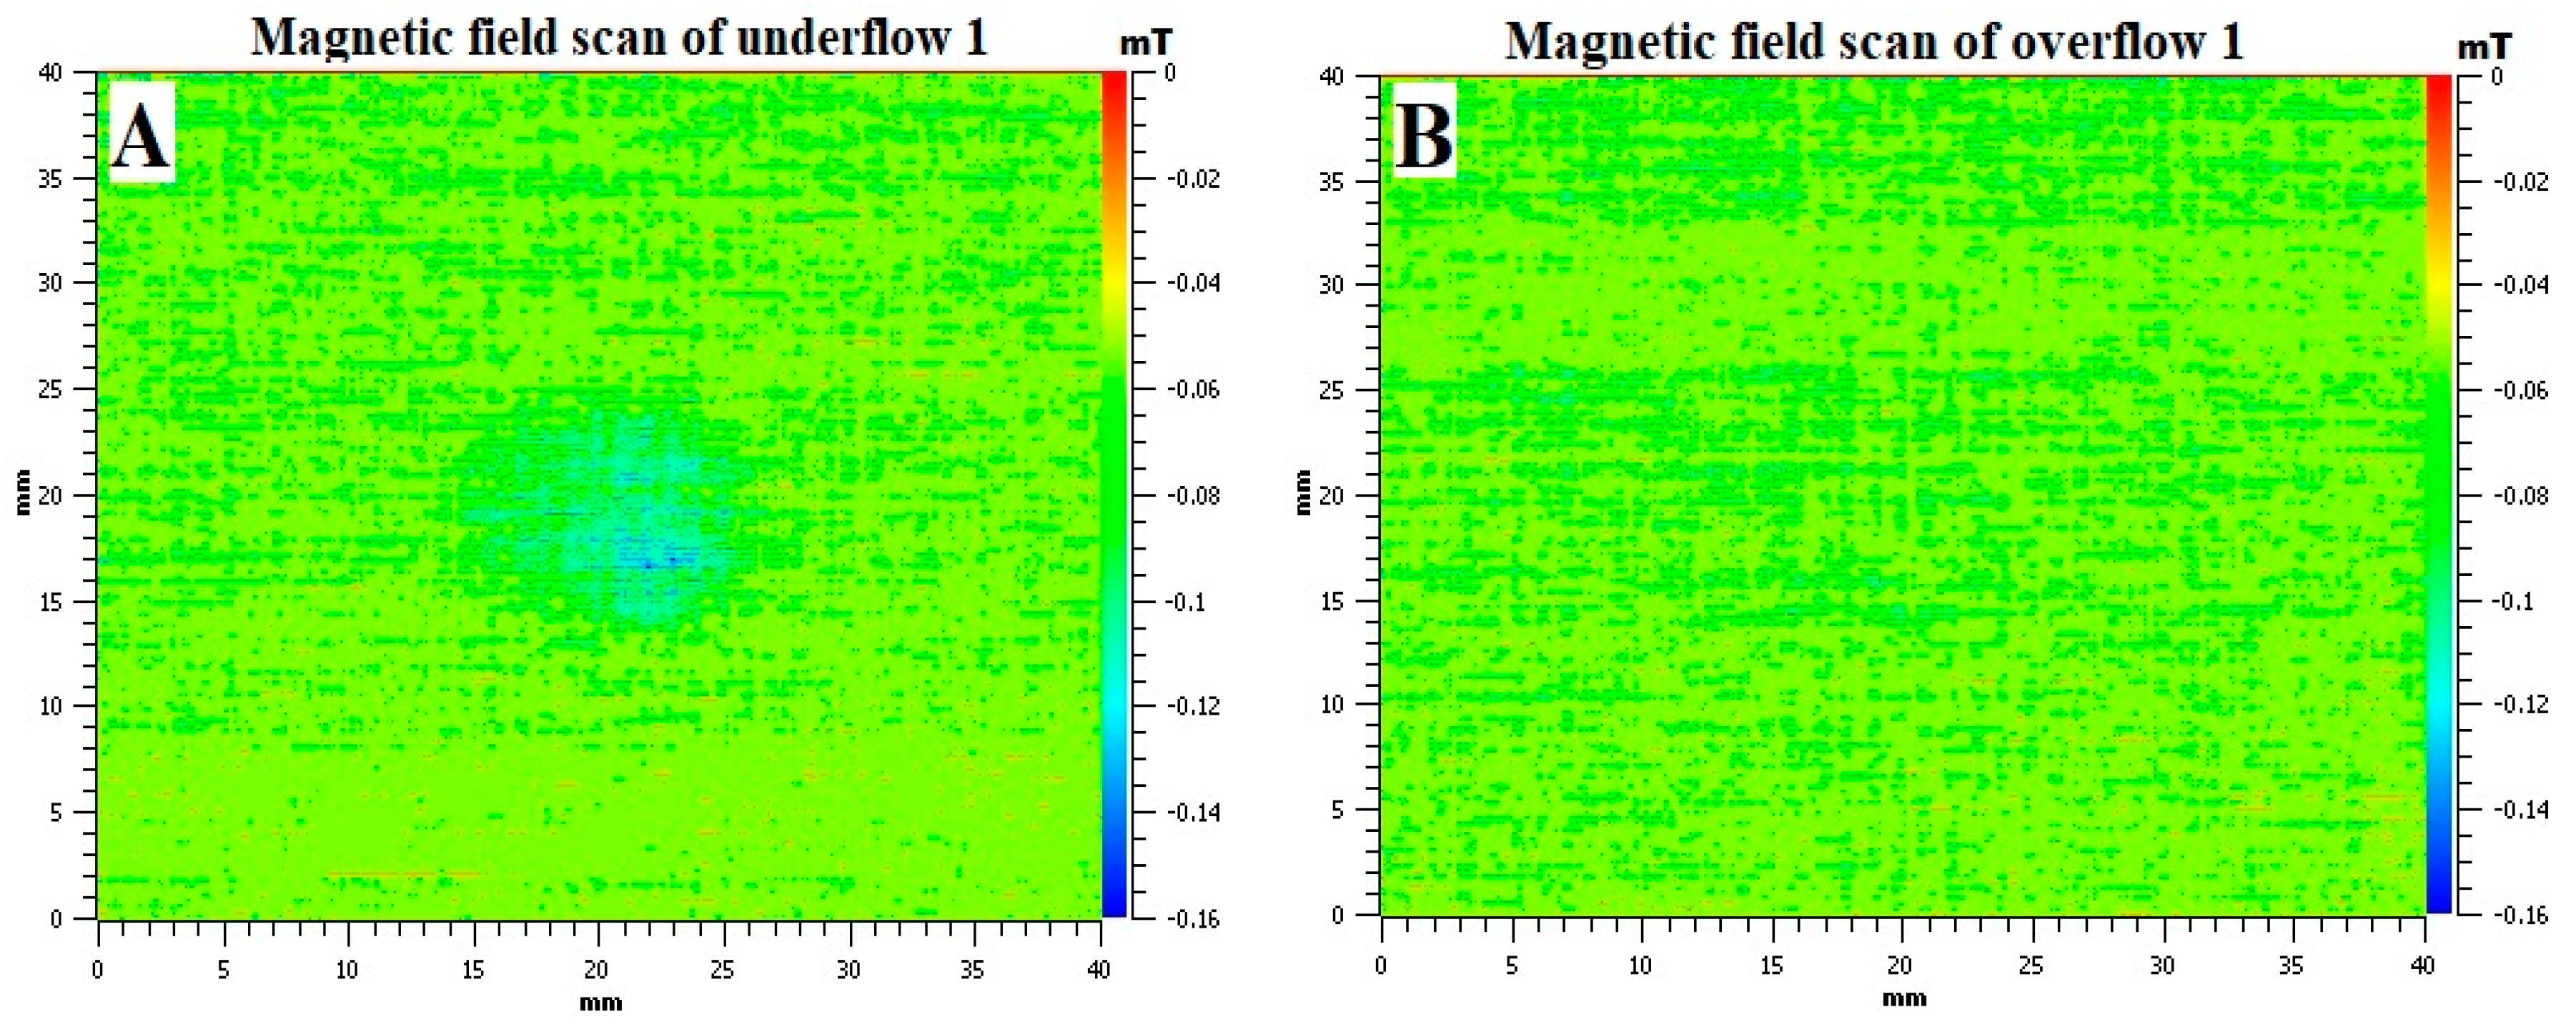
3. Results and Discussion
4. Conclusions
Acknowledgments
Author Contributions
Conflicts of Interest
References
- Jiles, D. Introduction to Magnetism and Magnetic Materials; CRC Press: Boca Raton, FL, USA, 2015; ISBN 9781482238877. [Google Scholar]
- Yang, Y.; Walton, A.; Sheridan, R.; Güth, K.; Gauß, R.; Gutfleisch, O.; Buchert, M.; Steenari, B.; van Gerven, T.; Jones, P.T.; et al. REE Recovery from End-of-Life NdFeB Permanent Magnet Scrap: A Critical Review. J. Sustain. Metall. 2017, 3, 122–149. [Google Scholar] [CrossRef]
- European Commission. List of Critical Raw Materials for the EU; European Commission: Brussels, Belgium, 2017. [Google Scholar]
- European Commission. Report on Critical Raw Materials for the EU; European Commission: Brussels, Belgium, 2014. [Google Scholar]
- Alonso, E.; Sherman, A.M.; Wallington, T.J.; Everson, M.P.; Field, F.R.; Roth, R.; Kirchain, R.E. Evaluating Rare Earth Element Availability: A Case with Revolutionary Demand from Clean Technologies. Environ. Sci. Technol. 2012, 46, 3406–3414. [Google Scholar] [CrossRef] [PubMed]
- Walton, A.; Yi, H.; Rowson, N.A.; Speight, J.D.; Mann, V.S.J.; Sheridan, R.S.; Bradshaw, A.; Harris, I.R.; Williams, A.J. The use of hydrogen to separate and recycle neodymium-iron-boron-type magnets from electronic waste. J. Clean. Prod. 2015, 104, 236–241. [Google Scholar] [CrossRef]
- Gutfleisch, O.; Güth, K.; Woodcock, T.G.; Schultz, L. Recycling Used Nd-Fe-B Sintered Magnets via a Hydrogen-Based Route to Produce Anisotropic, Resin Bonded Magnets. Adv. Energy Mater. 2013, 3, 151–155. [Google Scholar] [CrossRef]
- Herraiz, E.D.M.; Bradshaw, A.; Sheridan, R.S.; Mann, V.S.J.; Harris, I.R.; Walton, A. Recycling of rare earth magnets by hydrocyclone separation and re-sintering. In Proceedings of the 24th International Workshop on Rare Earth Permanent Magnet and Their Applications, Darmstadt, Germany, 28 August–1 September 2016. [Google Scholar]
- Scholz, U.D.; Kronert, W.E.; Nagel, H. A contribution to the mechanism of the hydrogenation of NdFeB alloys and the use of hydrogenated alloy for permanent magnet production. In Proceedings of the 9th International Workshop on Rare-earth Magnets and their Applications, Bad-Soden, Germany, 31 August–3 September 1987. [Google Scholar]
- Harris, I.R.; McGuiness, P.J. Hydrogen: Its use in the processing of NdFeB-type magnets. J. Less-Common Metals 1991, 174, 1273–1284. [Google Scholar] [CrossRef]
- Zakotnik, M.; Harris, I.R.; Williams, A.J. Multiple recycling of NdFeB-type sintered magnets. J. Alloys Compd. 2009, 469, 314–321. [Google Scholar] [CrossRef]
- Rivoirard, S.; Noudem, J.G.; de Rango, P.; Fruchart, D.; Liesert, S.; Sobeyroux, J.L. Proceedings of the 16th International Workshop on Rare Earth Magnets and Their Applications, Sendai, Japan, 10–14 September 2000; Japan Institute of Metals: Sendai, Japan, 2000; p. 355. [Google Scholar]
- Freeman, R.J.; Rowson, N.A.; Veasey, T.J.; Harris, I.R. The development of a magnetic hydrocyclone for processing finely ground magnetite. IEEE Trans. Magn. 1994, 30, 4665–4667. [Google Scholar] [CrossRef]
- Wills, B.A. Mineral Processing Technology, 5th ed.; Pergamon Press: Oxford, UK, 1992; ISBN 978-0080418858. [Google Scholar]
- Svarovsky, L. Solid-Liquid Separation; Butterworth Heinemann: Oxford, UK, 2000; pp. 191–243. ISBN 0750645687. [Google Scholar]
- Dobbins, M.; Dunn, P.; Sherrell, I. Recent advances in magnetic separator designs and applications. In Proceedings of the 7th International Heavy Minerals Conference: What Next, Drakensberg, South Africa, 20–23 September 2009. [Google Scholar]
- Habibian, M.; Pazoukib, M.; Ghanaiea, H.; Abbaspour-Sanib, K. Application of hydrocyclone for removal of yeasts from alcohol fermentations broth. Chem. Eng. J. 2008, 138, 30–34. [Google Scholar] [CrossRef]
- Takahashi, G. Sample preparation for X-ray fluorescence analysis III. Pressed Loose Powder Methods. Rigaku J. 2015, 31, 29. [Google Scholar]
- Fredericci, C.; de Campos, M.F.; Braga, A.P.V.; Nazarre, D.J.; Martin, R.V.; Landgraf, F.J.G.; Périgo, E.A. Nd-enriched particles prepared from NdFeB magnets: A potential separation route. J. Alloys Compd. 2014, 615, 410–414. [Google Scholar] [CrossRef]


| Hydrocyclone Passes | Feed (g) | Underflow (g) | Overflow (g) | Overflow/Reject (%) | Underflow/Yield (%) |
|---|---|---|---|---|---|
| Pass 1 | 1000.00 | 987.07 | 12.93 | 1.29 | 98.71 |
| Pass 2 | 793.67 | 779.93 | 13.74 | 1.73 | 98.27 |
| Pass 3 | 653.32 | 642.76 | 10.57 | 1.62 | 98.38 |
| Pass 4 | 563.27 | 549.45 | 13.82 | 2.45 | 97.55 |
| Pass 5 | 486.06 | 474.39 | 11.67 | 2.40 | 97.60 |
| Pass 6 | 428.64 | 418.30 | 10.34 | 2.41 | 97.59 |
| Mesh Size (µm) | Starting Material | Under-Flow 1 | Under-Flow 2 | Under-Flow 3 | Under-Flow 4 | Under-Flow 5 | Under-Flow 6 |
|---|---|---|---|---|---|---|---|
| 125 | 19.53 | 0.60 | 1.89 | 15.51 | 0.16 | 46.78 | - |
| 90 | 2.86 | 0.38 | 16.32 | 10.58 | 0.10 | 0.38 | 0.61 |
| 63 | 3.39 | 0.85 | 69.80 | 39.61 | 67.72 | 9.15 | 24.24 |
| 45 | 12.12 | 9.54 | 8.02 | 13.53 | 16.33 | 22.93 | 59.49 |
| 38 | 7.69 | 56.74 | 2.55 | 17.39 | 14.07 | 13.03 | 14.65 |
| −38 | 54.41 | 31.88 | 1.42 | 3.38 | 1.62 | 7.73 | 1.01 |
| Mesh Size (µm) | Over-Flow 1 | Over-Flow 2 | Over-Flow 3 | Over-Flow 4 | Over-Flow 5 | Over-Flow 6 |
|---|---|---|---|---|---|---|
| 125 | - | - | 2.17 | 13.64 | 0.75 | 0.23 |
| 90 | - | - | 25.14 | 70.03 | 63.03 | 0.75 |
| 63 | - | - | 50.90 | 15.28 | 33.98 | 95.87 |
| 45 | 20.42 | 2.38 | 12.86 | 1.04 | 2.23 | 2.89 |
| 38 | 68.42 | 13.21 | 7.24 | - | - | 0.26 |
| −38 | 11.16 | 84.40 | 1.69 | - | - | - |
| Samples | Fe | Nd | Dy | ∑REE | Oxygen |
|---|---|---|---|---|---|
| Starting Material | 60.92 | 35.04 | 1.21 | 36.25 | 1.1 |
| Underflow 1 | 60.62 | 35.56 | 1.21 | 36.77 | 1.9 |
| Underflow 2 | 60.21 | 33.60 | 1.18 | 34.78 | 2.1 |
| Underflow 3 | 61.18 | 34.64 | 1.18 | 35.82 | 1.9 |
| Underflow 4 | 61.25 | 34.76 | 1.24 | 36.00 | 2.0 |
| Underflow 5 | 61.32 | 34.74 | 1.21 | 35.95 | 2.1 |
| Underflow 6 | 61.94 | 34.40 | 1.16 | 35.56 | 1.9 |
| Samples | Fe | Nd | Dy | ∑REE | Oxygen |
|---|---|---|---|---|---|
| Starting Material | 60.92 | 35.04 | 1.21 | 36.25 | 1.1 |
| Overflow 1 | 20.94 | 70.33 | 1.24 | 71.57 | 15.7 |
| Overflow 2 | 23.20 | 68.01 | 1.20 | 69.21 | 15.9 |
| Overflow 3 | 22.90 | 68.88 | 1.30 | 70.1 | 18.1 |
| Overflow 4 | 30.91 | 61.06 | 1.34 | 62.40 | 15.6 |
| Overflow 5 | 32.44 | 60.18 | 1.25 | 61.43 | 20.4 |
| Overflow 6 | 36.86 | 56.01 | 1.24 | 57.25 | 17.4 |
© 2017 by the authors. Licensee MDPI, Basel, Switzerland. This article is an open access article distributed under the terms and conditions of the Creative Commons Attribution (CC BY) license (http://creativecommons.org/licenses/by/4.0/).
Share and Cite
Awais, M.; Coelho, F.; Degri, M.; Herraiz, E.; Walton, A.; Rowson, N. Hydrocyclone Separation of Hydrogen Decrepitated NdFeB. Recycling 2017, 2, 22. https://doi.org/10.3390/recycling2040022
Awais M, Coelho F, Degri M, Herraiz E, Walton A, Rowson N. Hydrocyclone Separation of Hydrogen Decrepitated NdFeB. Recycling. 2017; 2(4):22. https://doi.org/10.3390/recycling2040022
Chicago/Turabian StyleAwais, Muhammad, Fernando Coelho, Malik Degri, Enrique Herraiz, Allan Walton, and Neil Rowson. 2017. "Hydrocyclone Separation of Hydrogen Decrepitated NdFeB" Recycling 2, no. 4: 22. https://doi.org/10.3390/recycling2040022
APA StyleAwais, M., Coelho, F., Degri, M., Herraiz, E., Walton, A., & Rowson, N. (2017). Hydrocyclone Separation of Hydrogen Decrepitated NdFeB. Recycling, 2(4), 22. https://doi.org/10.3390/recycling2040022