3.2. Results of Scenario 1
This section highlights the results of Scenario 1, which examines risk in the economic feasibility analysis of the business model under the assumption that all organic matter must be purchased. This perspective reflects the standpoint of an investor not directly engaged in poultry production. The reference case applies the average values of each independent variable, providing the basis for the results. Accordingly,
Table 2 and
Table 3 present the main costs considered in the composition of CAPEX and OPEX, respectively.
Table 2 also applies to the reference case for the second scenario. In
Table 3, the cost of video surveillance does not appear because its value is negligible compared to the other items considered. Furthermore, the OPEX composition presented reflects only the first year of analysis, and these values vary in subsequent years.
Continuing the analysis,
Table 4 illustrates the cash flow of the reference case. Based on this evaluation, the results reported in
Table 5 summarize the economic indicators derived from the reference case. The calculation of the MIRR applies the same rate as the MARR for both the financing rate and the reinvestment rate.
The reference case indicates project feasibility, as the NPV remains positive. The MIRR confirms strong investment performance, while the discounted payback period demonstrates a favorable recovery horizon. However, the reference case represents only one of many possible outcomes.
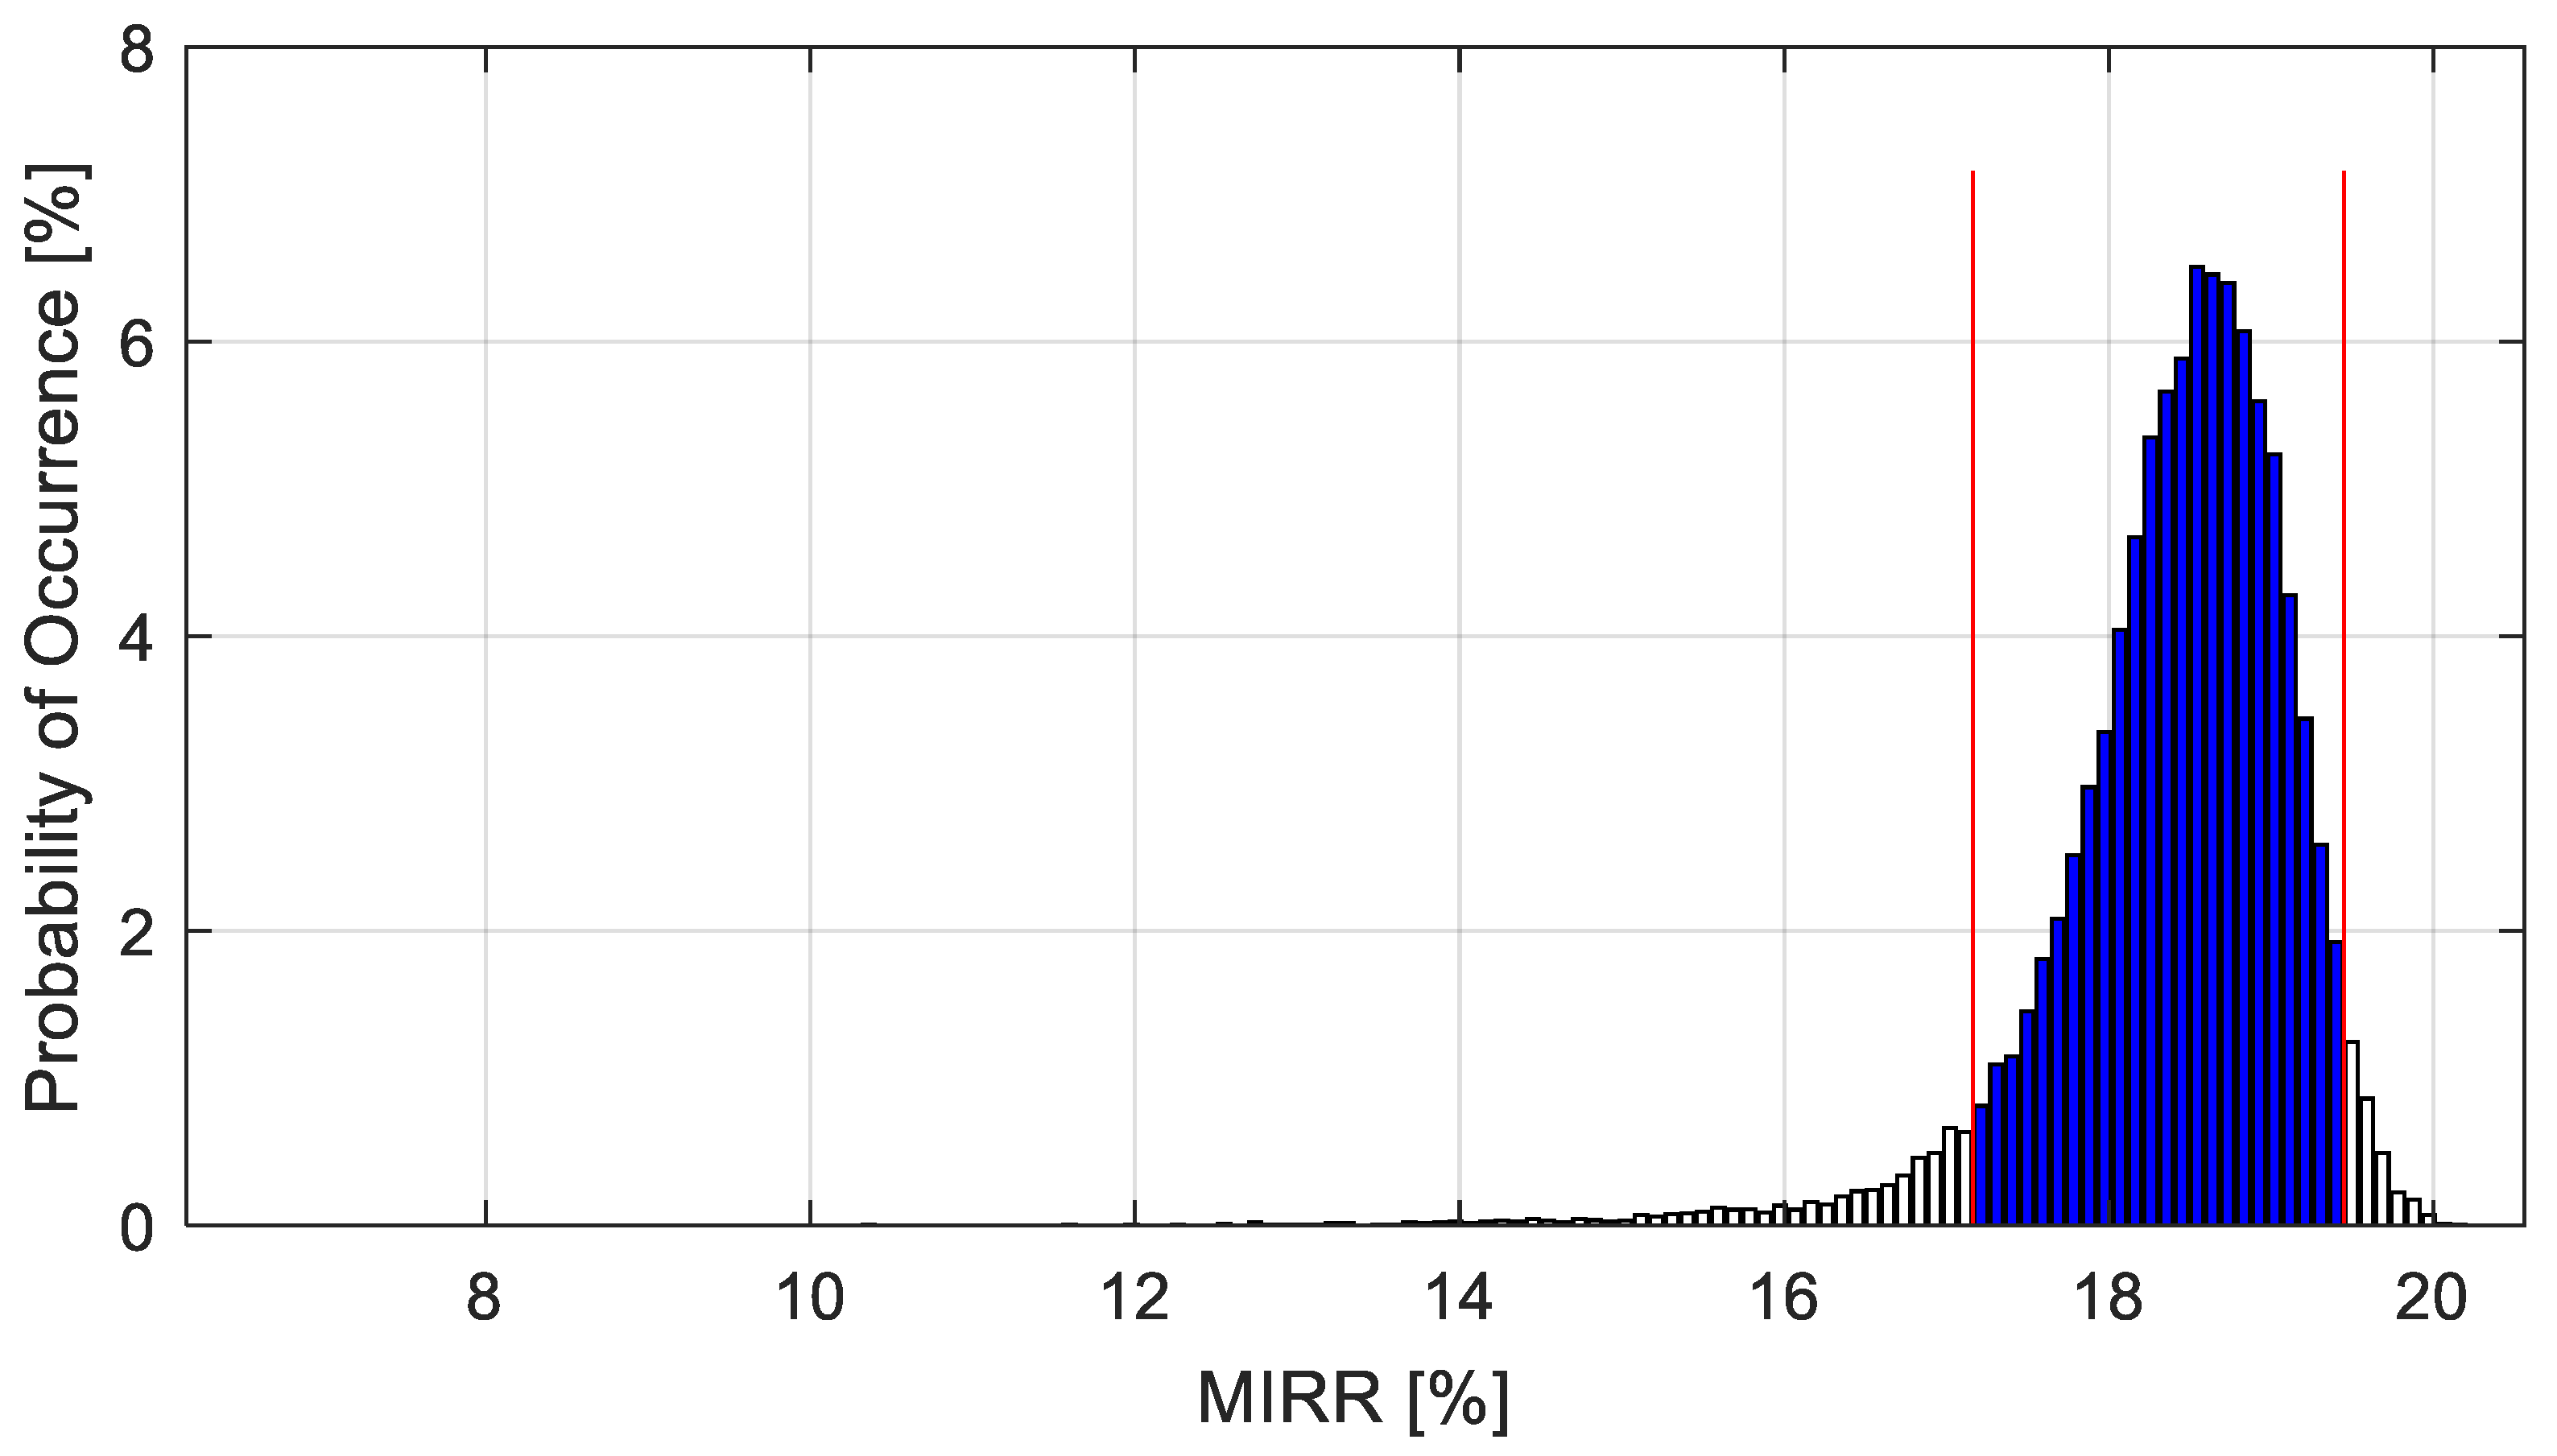
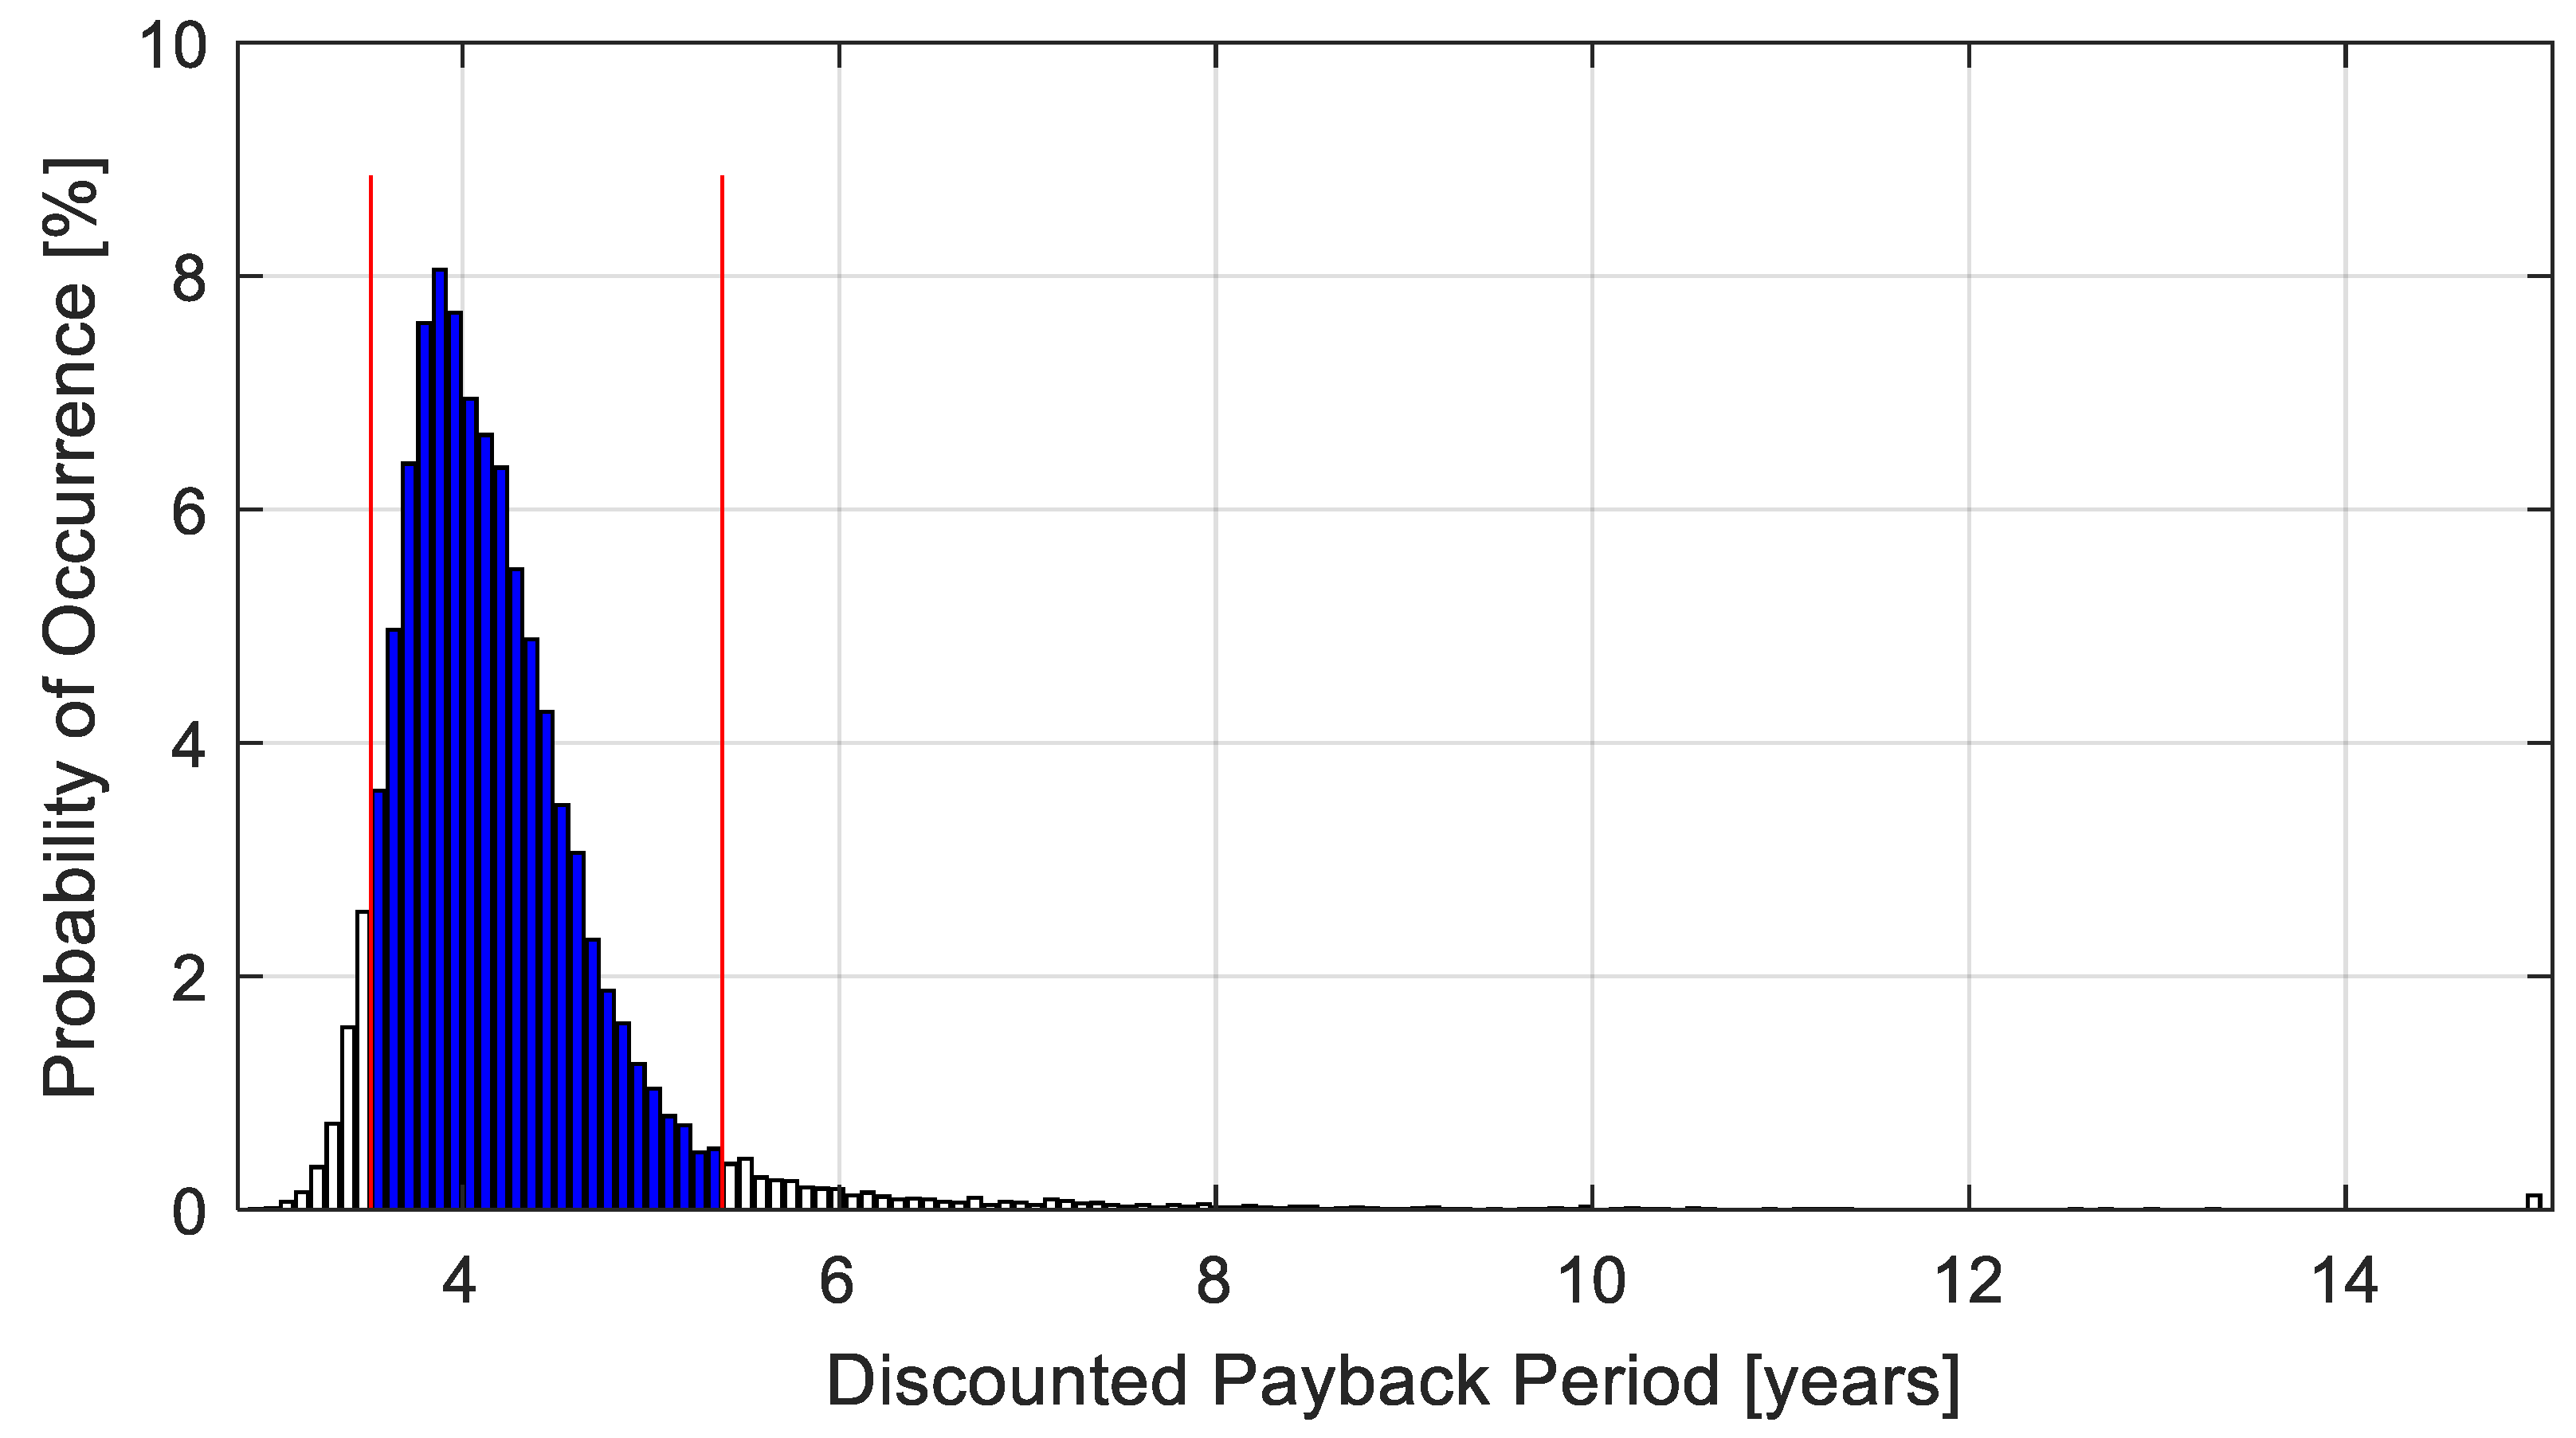
The risk analysis applies an iterative process with 32,500 simulations, and the results are summarized in three probability distribution graphs. These graphs consolidate the likelihood of outcomes across different combinations of risk variable values.
Figure 2,
Figure 3 and
Figure 4 illustrate the probability distributions for NPV, MIRR, and discounted payback period, respectively, generated through Monte Carlo simulation of Scenario 1. This approach provides a comprehensive macro-level perspective by accounting for a broad range of potential outcomes.
The analysis emphasizes MIRR rather than IRR because MIRR incorporates the reinvestment rate of cash flows. This distinction proves essential when future cash flows cannot realistically be reinvested at the same rate as the IRR. In most cases, IRR produces values nearly double the MARR, which sets unrealistic expectations for reinvestment and limits its practical relevance.
The highlighted markings in
Figure 2,
Figure 3 and
Figure 4 indicate the 90% confidence interval derived from the probability distribution analysis. Two red markers define the lower and upper limits of this interval, while the histogram bars filled in blue represent the cases that fall within the confidence range. This means that there is a 90% probability that the outcome lies between the values identified by the red markers.
Table 6 consolidates the minimum and maximum thresholds of the three economic indicators evaluated, thereby providing a comprehensive overview of the confidence bounds associated with the Monte Carlo simulation results.
The risk analysis confirms that the biogas-fired thermoelectric plant project, under the assumption of purchased organic matter, demonstrates economic feasibility. This conclusion holds because the economic indicators present a 90% probability of remaining within the confidence thresholds reported in
Table 6. For example, for the NPV, there is a 90% probability that its value lies between 4.48 million USD and 7.96 million USD, a 5% probability that it is below 4.48 million USD, and a 5% probability that it exceeds 7.96 million USD. In other words, the NPV remains positive within the considered confidence interval, indicating the feasibility of the proposed project. Similar interpretations apply to the MIRR.
Despite this high confidence level, understanding the probability of project infeasibility remains essential. The Monte Carlo iterations reveal that in 0.12% of cases, the NPV falls below zero and the MIRR remains lower than the MARR.
3.3. Results of Scenario 2
Scenario 2 excludes the cost of purchasing organic material, simulating the perspective of a poultry farm owner who seeks sustainable waste disposal while generating profit. The analytical framework applied to Scenario 2 follows the same structure as Scenario 1. The CAPEX composition remains unchanged from the first scenario, as presented in
Table 2, while the OPEX composition differs and follows the structure detailed in
Table 7.
The cash flow of the reference case, presented in
Table 8, applies the mean values of each independent variable. Based on this reference case,
Table 9 summarizes the resulting economic indicators. The calculation of the MIRR adopts the same rate used for the MARR as both the financing and reinvestment rates.
The project again demonstrates economic feasibility, with an even stronger potential than in Scenario 1. The NPV remains positive, which alone indicates economic viability. Both the IRR and the MIRR exceed the MARR, while the shorter Discounted Payback Period further strengthens the case for investment. However, this isolated outcome does not provide sufficient insight into the risks associated with the project.
Figure 5,
Figure 6 and
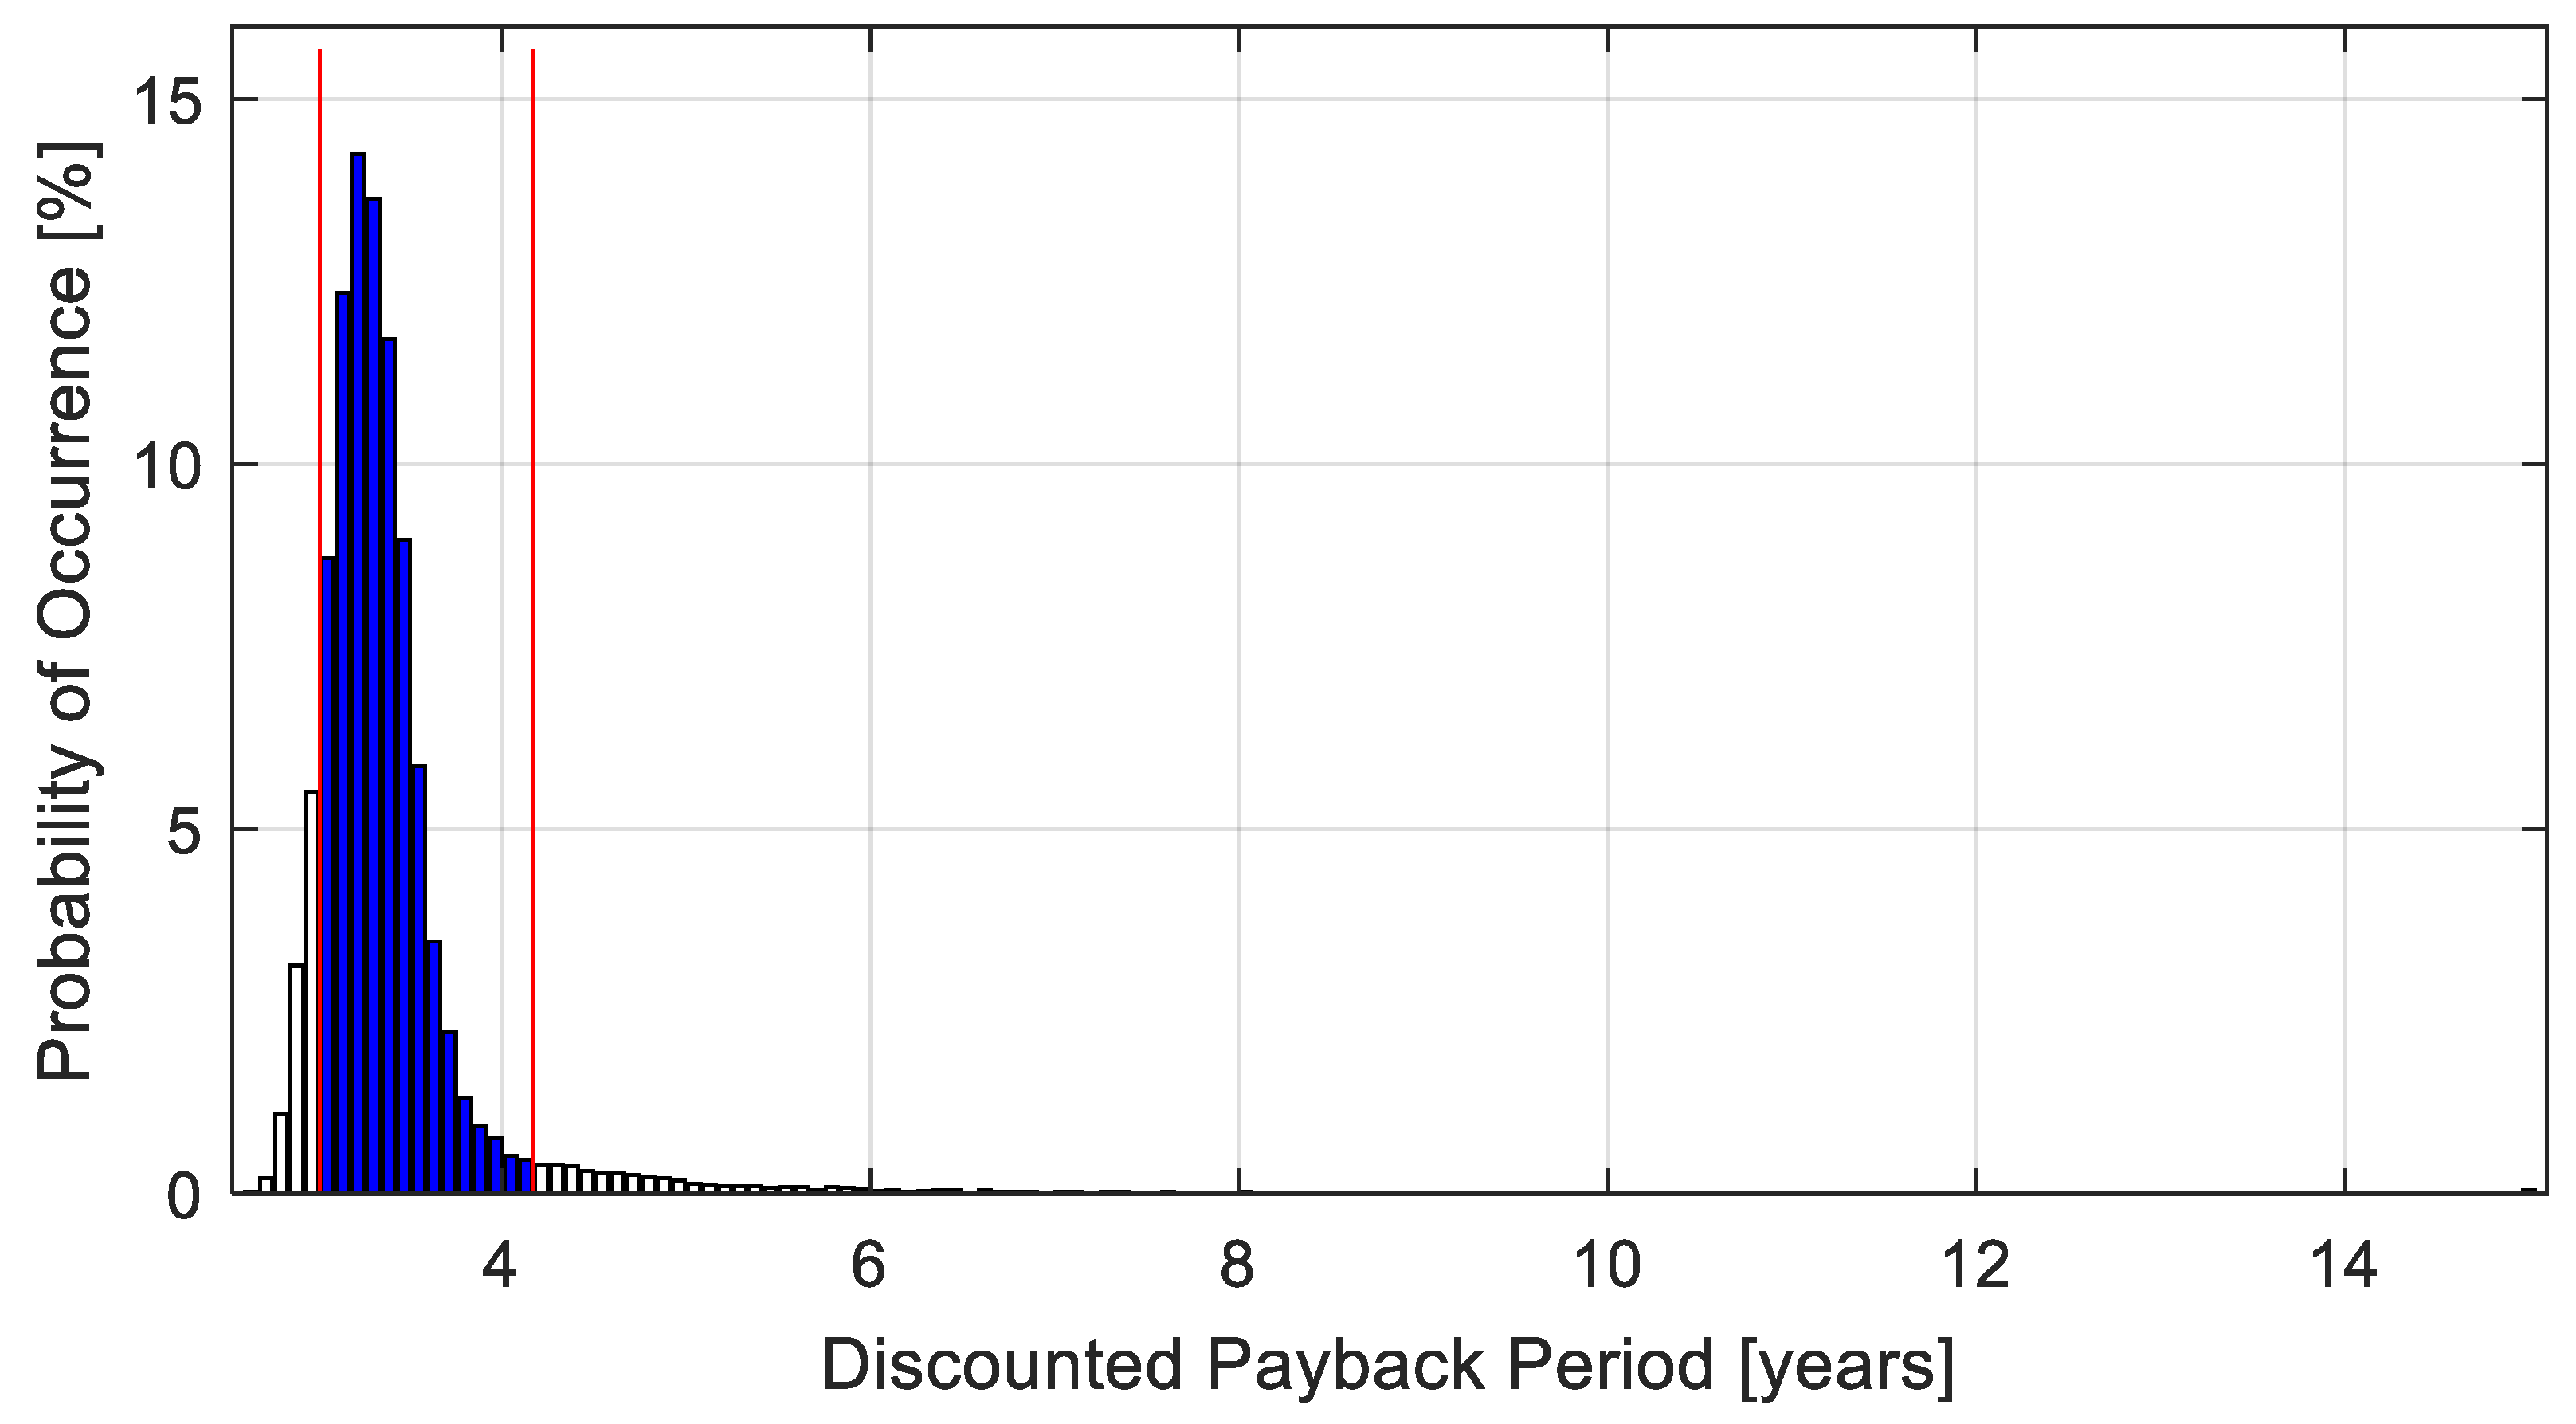
Figure 7 present the probability distribution graphs of NPV, MIRR, and Discounted Payback Period, respectively, based on the Monte Carlo simulation for Scenario 2. The analysis highlights the MIRR once again, as it better reflects feasible reinvestment assumptions and provides a more realistic measure of investment performance under this configuration.
Figure 5,
Figure 6 and
Figure 7 include red markers that define the range of possible results with a 90% confidence level.
Table 10 consolidates the threshold values for each economic indicator analyzed.
Analysis of
Table 10 indicates that, despite inherent risks, the biogas-fired power plant project without the purchase of organic material remains both economically viable and secure as an investment. The economic indicators show a 90% probability of falling within the defined confidence interval thresholds, reinforcing the robustness of the project.
Based on the iterative results for this scenario, only 0.05% of the simulated cases presented a negative NPV combined with a MIRR below the MARR. These findings provide further evidence of the project’s economic feasibility and strengthen its investment attractiveness.
3.4. Assessment of Economic Performance and Feasibility
The results presented in this section demonstrate the technological maturity of poultry waste-to-energy systems when evaluated through an integrated economic and risk-based framework. By combining Monte Carlo simulation with conventional financial metrics, this study contributes to advancing the analytical tools used for assessing distributed biogas generation projects, providing a more robust and replicable foundation for decision-making. Based on the results presented, several observations can be highlighted.
First, examining the revenue columns in
Table 4 and
Table 8 reveals a peculiar behavior: returns decline over the first six years and then increase in the subsequent years. This effect results from the gradual application of the TUSD-Fio B tariff component on credit compensation, as established by Brazilian legislation [
7,
8]. The minimum point occurs in 2029, when the full application of the TUSD-Fio B component begins.
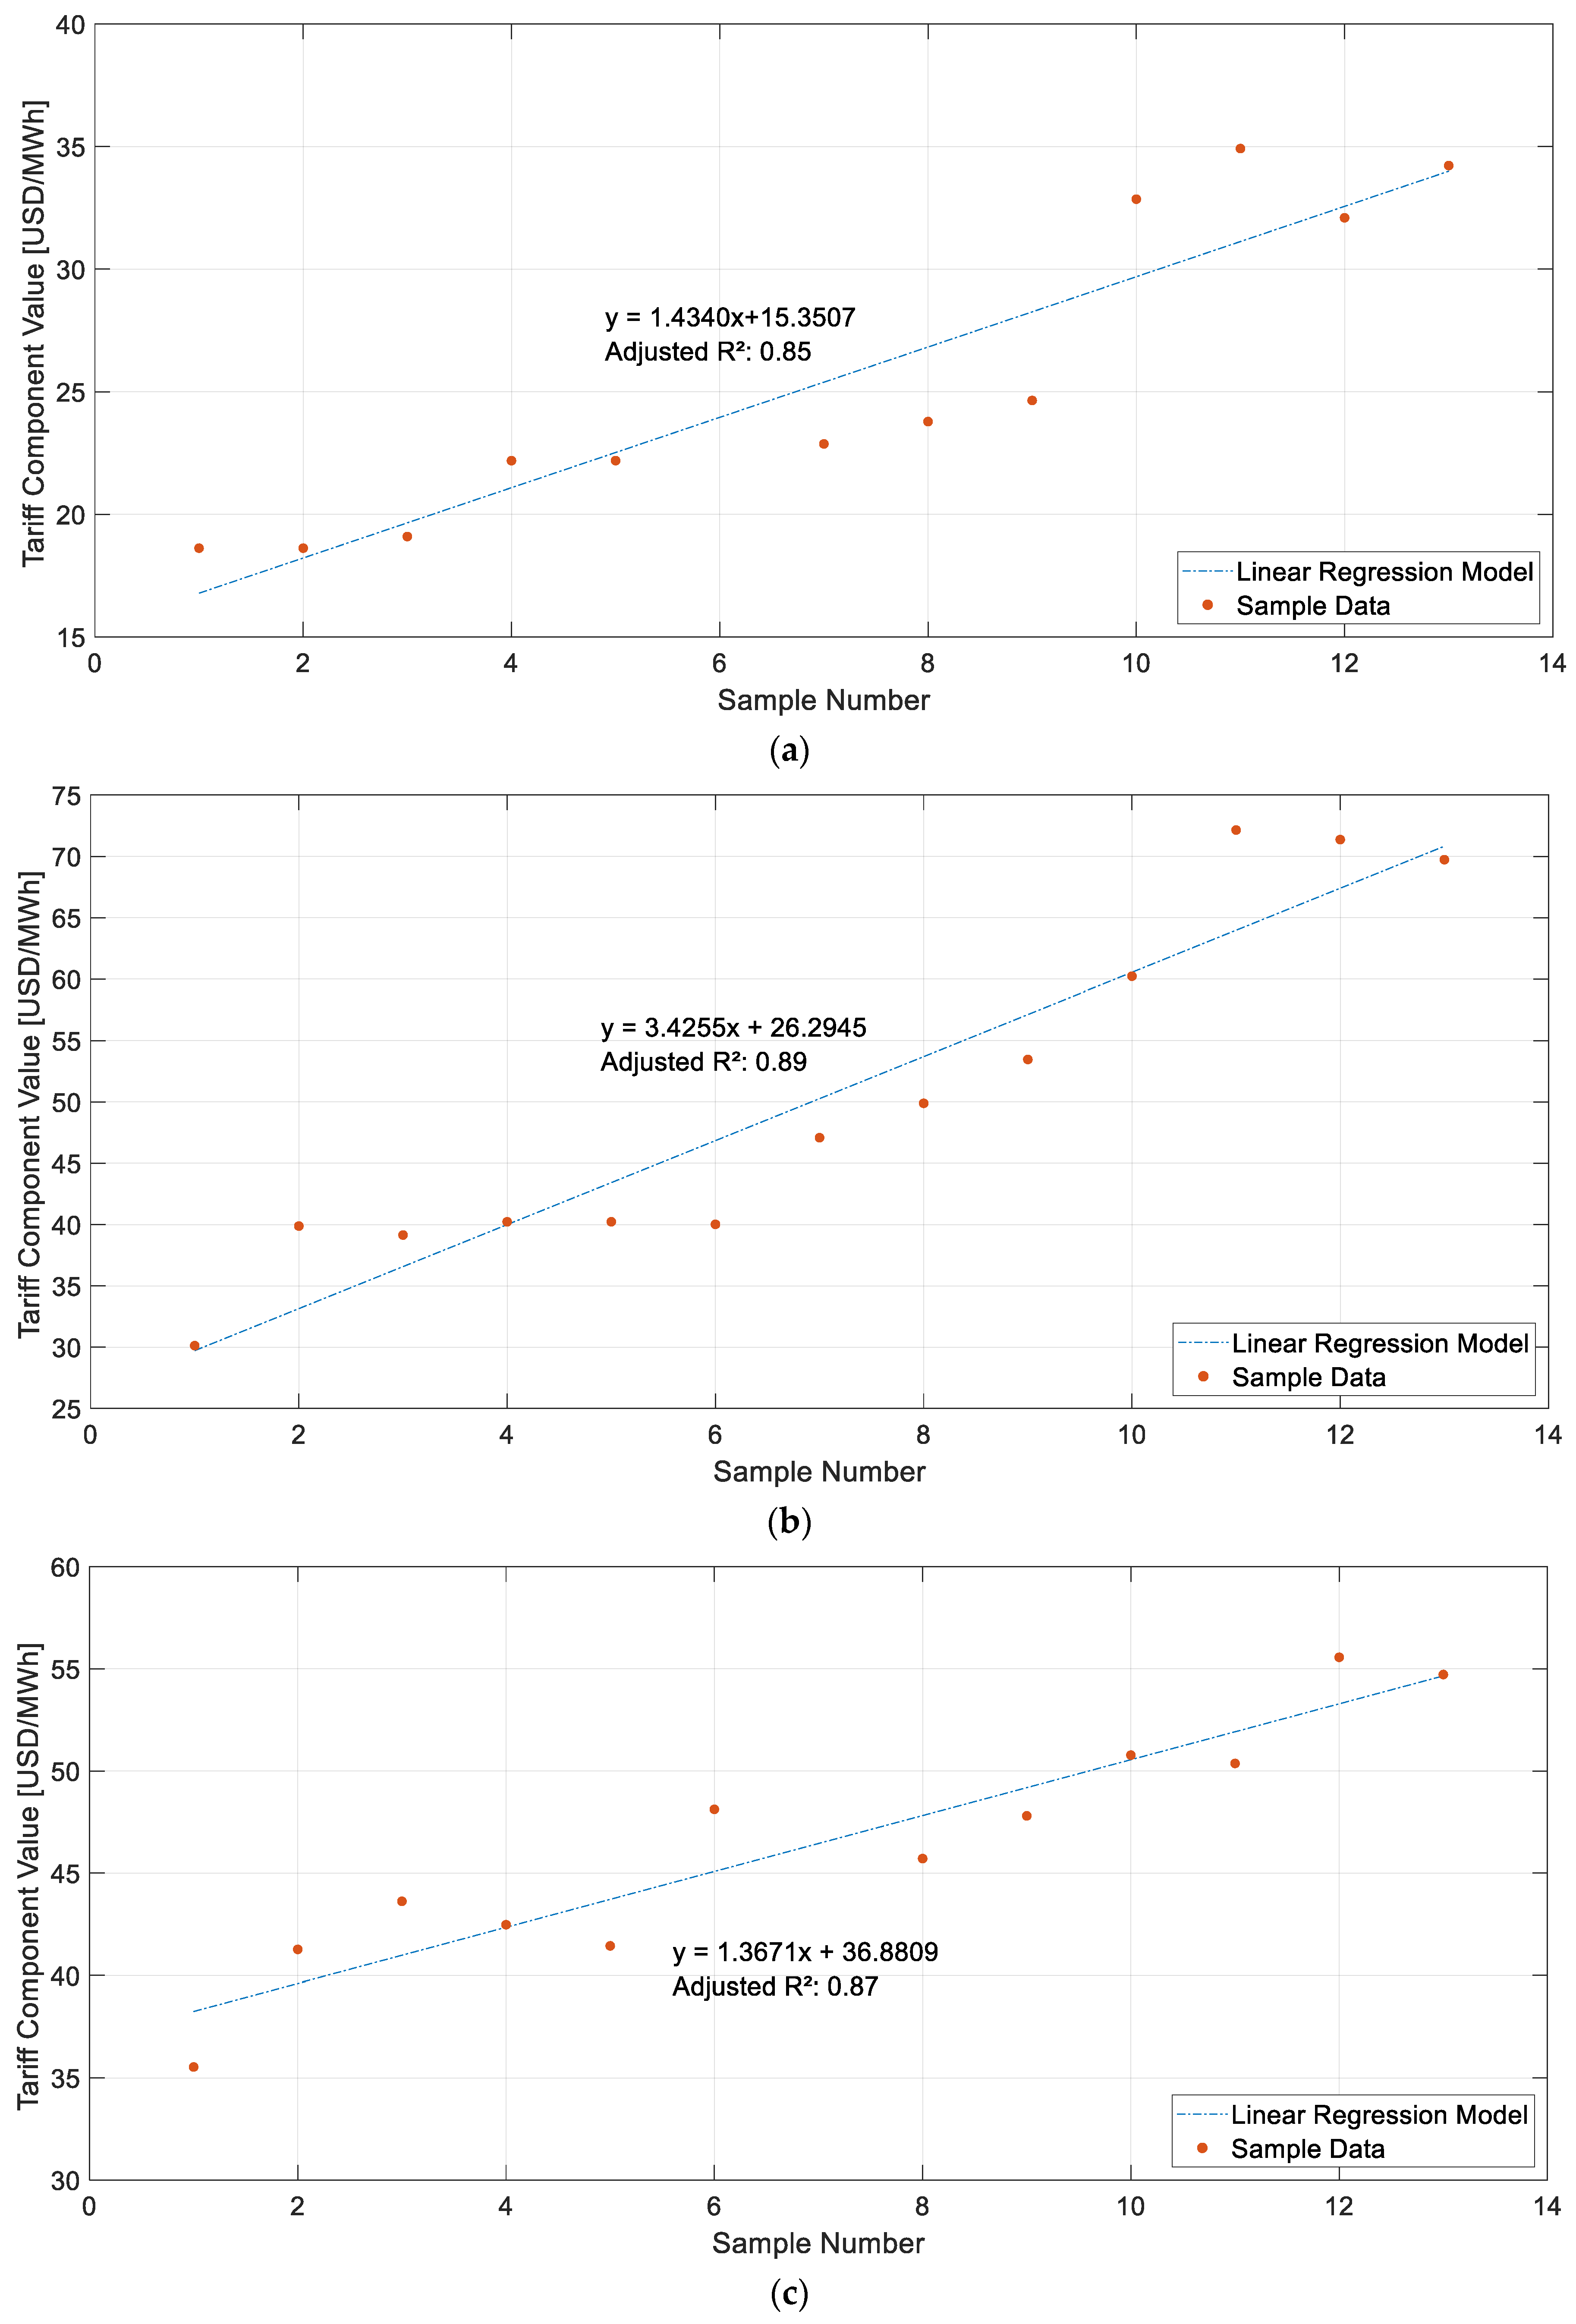
The average growth rate of the TUSD tariff component surpasses that of TUSD-Fio B. As a result, from 2029 onward, TUSD-based compensation increases, which enhances profitability in the business model and explains the upward trend in economic returns from that year forward. However, both tariff components are subject to risk, and depending on the extent of such risk, outcomes may occur in which TUSD-Fio B outweighs TUSD, leading to persistent reductions in annual revenues.
Beyond this tariff-related effect on business revenues, Scenario 2 exhibits a higher probability of economic feasibility. This outcome was expected, given that the reference case recorded a 65.3% reduction in base OPEX costs, which significantly mitigated its impact on cash flow. Another way to confirm the advantages of Scenario 2 appears in
Table 11, which consolidates the main results of the risk analysis for economic feasibility.
Analysis of the data in
Table 11 indicates a low risk of economic infeasibility for both projects. This outcome results from reserving 20% of the total expected generation capacity to address potential shortages in organic material availability for biogas production. With this safeguard in place, the business model can stabilize revenue and ensure operational continuity even under supply constraints.
For the reference case, this reserve margin can either remain unused or be allocated as needed to offset or fully mitigate the shortage, depending on the total electricity generation achieved. This strategy strengthens the resilience of the project and further enhances the reliability of the investment.
Figure 8 presents the correlations between the key risk variables and the three economic indicators used in the evaluation. In Scenario 1, the total cost of poultry manure, plant operation and maintenance costs, and the value of the TUSD tariff in the first year emerge as the main variables influencing both the NPV and the MIRR. For the Discounted Payback Period, the availability of poultry manure and the tariff components TUSD and TE represent the most relevant risk variables affecting the investment recovery horizon. The correlations of TUSD and TE shown in
Figure 8 correspond to the values applied in the first year of the economic study (2024).
In Scenario 2, the total cost of poultry manure no longer represents the main factor influencing NPV and MIRR, since this cost is excluded from the analysis. Under this configuration, the availability of poultry manure and machinery rental become the two most relevant drivers across all economic indicators. A third variable also emerges: plant operation and maintenance costs for NPV and MIRR, and the TUSD tariff for the Discounted Payback Period.
Comparing the leading risk variables across scenarios reveals clear trends. In Scenario 1, the total cost of poultry manure exerts the strongest influence on both NPV and MIRR, as it represents the largest share of OPEX and directly impacts periodic cash outflows. For the Discounted Payback Period, the availability of poultry manure is the dominant factor. This occurs because fluctuations in availability affect both the total cost of manure and OPEX-related expenses, as well as cash inflows. When availability falls below the 20% safety margin, annual revenues of the consortium decrease, mainly due to penalties incorporated into the business model.
In Scenario 2, the availability of poultry manure remains the most critical factor for the Discounted Payback Period and becomes the leading driver for NPV and MIRR as well. Excluding the purchase cost of organic matter reduces the long-term weight of OPEX on cash flow. Consequently, the total volume of feedstock—which is directly linked to electricity generation, the number of clients served, and annual revenues—emerges as the single most influential parameter across all three indicators. Other risk variables show comparatively lower influence on economic results. Among tariff components, TUSD-Fio B demonstrates the least impact because it only affects cash flow during the first six years. Finally, OPEX inflation exerts greater influence in Scenario 1, where higher OPEX levels amplify its effect over time.
In the Brazilian context of biogas systems, previous studies using different organic substrates provide valuable benchmarks for comparison. For example, in [
26], the authors demonstrated the economic feasibility of small-scale biogas microgeneration from food waste, reporting payback periods of approximately four years when combining low-cost digesters with internal combustion engines. Similarly, the study in [
27] evaluated food-waste-based cogeneration at a wholesale market and found a return on investment of 433% and a payback period of only 1.01 years, with an electricity generation cost of around USD 0.10/kWh. These examples indicate that biogas-based systems can achieve highly competitive economic performance, reinforcing the robustness of the economic feasibility demonstrated in the present study.
Beyond the economic results, the proposed model also delivers notable environmental and social benefits. Environmentally, the conversion of poultry manure into biogas mitigates the uncontrolled decomposition of organic waste, reducing methane emissions and the release of other greenhouse gases into the atmosphere. This aligns with the waste management hierarchy by transforming a pollutant residue into a renewable energy source while simultaneously contributing to local decarbonization goals. The substitution of fossil-fuel-based electricity with biogas-based generation also enhances the life-cycle performance of the energy mix, lowering the overall carbon footprint of distributed generation systems.
From a life-cycle perspective, the system promotes circularity by reintroducing residues into productive chains. Although a full life-cycle assessment (LCA) was not performed in this study, the operational configuration of the consortium already embodies key sustainability principles, including waste recovery, emission reduction, and the generation of co-products such as digestate, which can be reused as organic fertilizer. These characteristics indicate a positive life-cycle performance that could be quantified in future research.
In terms of social impact, the project encourages local job creation in plant operation, maintenance, and logistics, while promoting the inclusion of small and medium poultry producers through cooperative participation models. Moreover, the reduction in waste-related environmental risks contributes to healthier rural environments and the improvement of living conditions in the surrounding communities. Together, these outcomes reinforce the potential of poultry waste-to-energy systems as catalysts for sustainable rural development.


