Article

Enhanced Waste Sorting Technology by Integrating Hyperspectral and RGB Imaging

by
Georgios Alexakis
1,
Marina Pellegrino
2,
Laura Rodriguez-Turienzo
2,* and
Michail Maniadakis
1
1
Foundation for Research and Technology Hellas, Νikolaou Plastira 100, Vassilika Vouton, GR-70013 Heraklion, Crete, Greece
2
IRIS Technology Solutions, Ctra. d’Esplugues, 39-41, 08940 Cornellà de Llobregat, Barcelona, Spain
*
Author to whom correspondence should be addressed.
Recycling 2025, 10(5), 179; https://doi.org/10.3390/recycling10050179
Submission received: 11 July 2025 / Revised: 8 September 2025 / Accepted: 11 September 2025 / Published: 22 September 2025

Abstract

Identifying the material composition of objects is crucial for many recycling sector applications. Traditionally, object classification relies either on hyperspectral imaging (HSI), which analyses the chemometric properties of objects to infer material types, or on RGB imaging, which captures an object’s visual appearance and compares it to a reference sample. While both approaches have their strengths, each also suffers from limitations, particularly in challenging scenarios such as robotic municipal waste sorting, where objects are often heavily deformed or contaminated with various forms of dirt, complicating material recognition. This work presents a novel method for material-based object classification that jointly exploits HSI and RGB imaging. The proposed approach aims to mitigate the weaknesses of each technique while amplifying their respective advantages. It involves the real-time alignment of HSI and RGB data streams to ensure reliable result correlation, alongside a machine learning framework that learns to exploit the strengths and compensate for the weaknesses of each modality across different material types. Experimental validation on a municipal waste sorting facility demonstrates that the combined HSI–RGB approach significantly outperforms the individual methods, achieving robust and accurate classification even in highly challenging conditions.

1. Introduction

The transition toward a circular economy is essential for achieving sustainable resource management through the reduction of waste generation and the promotion of material reuse or recycling. Given the constantly increasing volume of post-consumer waste, one of the principal challenges faced by modern societies is the effective sorting of municipal solid waste, which still remains largely dependent on manual processes, often resulting in operational inefficiencies and increased contamination rates. Improving waste sorting efficiency and recovered material purity is essential not only for economic viability but also for environmental sustainability. Recent developments in automation technologies—including robotics, computer vision, and machine learning—offer significant opportunities to enhance the efficiency and precision of waste sorting in material recovery facilities [1,2].
Beyond municipal solid waste, material recovery facilities routinely handle heterogeneous packaging waste and waste electrical and electronic equipment (WEEE). These streams combine multilayer structures, composites and surface contaminants that complicate automated separation and tend to reduce product-grade purity and recovery yields. Plant-level assessments report strong performance for well-defined items such as beverage bottles, while mixed fractions remain more challenging due to mis-sorts and residual contamination. These constraints motivate sensing and decision-level fusion strategies that improve material discrimination across diverse waste types, including visually similar polymers and multi-material packaging [3,4].
Multiple sensors are used for waste identification: inductive, capacitive, image-based, sound-based, and weight-based sensors. Visible-image-based sensors are the most commonly used in the literature [1]. A key emerging technology for sorting recyclable waste regards the analysis of materials in the infrared spectrum. In particular, Hyperspectral Imaging (HSI) can be used for waste classification due to its non-destructive nature, high spectral resolution and ability to capture detailed chemical information about waste materials. It is highly effective in identifying material types, as well as detecting contaminants within complex waste streams. Several applications [5,6,7] indicate the potential of HSI as a valuable tool for waste sorting applications. HSI systems typically operate in a push-broom setup, and the generated high dimensional datasets often require advanced chemometrics. Partial least squares discriminant analysis (PLSDA) supports the spectral data processing due to its dimensionality reduction capabilities while using meaningful spectral features [8,9]. For high-throughput and waste classification applications, to augment model robustness, object-based classification performance metrics can be employed in parallel with pixel-based classification performance assessment [7]. Despite its advantages, HSI waste classification also presents some limitations, such as the great intrinsic variability of domestic waste stream and the challenging aspect of distinguishing individual objects without advanced image processing, especially when items are adjacent or overlapping, due to the intrinsic characteristics of pixel-based analysis.
At the same time, the rapid advancement of deep neural networks (DNNs) over the past decade has significantly enhanced the ability to classify waste using data from the visible spectrum [10,11,12]. By collecting large-scale datasets depicting waste in real-world processing environments, it has been possible to retrain and practically fine-tune advanced models specifically for the challenges of the waste management domain [13,14]. As a result, many industrial applications now use RGB cameras operating in the visible spectrum in conjunction with DNN-based models to monitor waste streams and enable automated, vision-based sorting of recyclable materials [15,16], which has also been applied in many industrial setups [17,18,19,20,21]. Even though DNNs accomplish reliable waste classification in the visible spectrum, issues related to significant changes in shape, packaging nature, contamination, or colour, as well as visually indistinguishable objects made from different materials, may occasionally compromise classification performance in unconstrained environments.
Recent studies have suggested the combined use of computer vision techniques originally developed for RGB imaging to enhance HSI monitoring [22]. For example, similar deep learning models were used for processing HSI and RGB images to improve tea leaf categorisation [23]. Additionally, synthetic HSI data were developed using a generative adversarial network-based method to generate realistic spectral features for improved classification, applied in multiple application domains [24].
Other approaches consider the combined use of both HSI and RGB imaging to overcome the challenges posed by each individual imaging technique. While HSI adds detailed spectral information, RGB captures finer contextual and spatial details. Combining the characteristics of the individual technologies, morphological features extracted by RGB images can be combined with reflectance values for automated and advanced fruit grading [25]. In particular, separate features are extracted from HSI and RGB images using domain-specific mechanisms and subsequently combined via a multilayer perceptron (MLP) for classification. Additionally, fused HSI and RGB images were constructed to develop a method for identifying soybean kernel damage [26]. This work involves identifying a small number of information-rich spectral bands which are then combined with RGB images to improve classification accuracy. Both studies mentioned above examine objects that are stationary (not moving) under fully controlled laboratory conditions.
The current work presents a novel methodology for integrating HSI and RGB imaging in industrial waste sorting systems, specifically targeting the sorting of continuous waste streams. In contrast to previous works, the proposed framework is based on the development of two registered but independently optimised modules: one for HSI-based material analysis, and another for RGB-based visual classification. Each module is tailored to fully leverage the unique strengths of its respective modality—HSI’s ability to capture detailed spectral signatures for material discrimination at pixel level, and RGB’s low-cost, appearance-based object recognition and classification. In a subsequent stage, the outputs of the two modules are combined to form a unified classification system that mitigates the limitations of each individual approach, thereby enhancing overall accuracy and robustness. This involves the homography-based registration of the two image types, which allows us to use object areas identified in the RGB domain to perform object-level classification in the HSI domain. Finally, an SVM classifier integrates the results from both the HSI and RGB domains to achieve high-accuracy classification of waste objects. The proposed approach is summarised in Figure 1. To the best of our knowledge, this is the first study to combine HSI and RGB imaging technologies for real-world waste sorting applications. To demonstrate the benefits of the proposed combined sensing approach, the performance of HSI-alone and RGB-alone modalities is compared with that of a combined HSI+RGB classification system.
The remainder of the paper is organised as follows: Section 2 presents the experimental setup and evaluation procedures used to assess the performance of each configuration—HSI alone, RGB alone, and the integrated HIS–RGB model—assessing their performance under real-world conditions. Section 3 draws conclusions from the study and discusses promising directions for future research in the field of hybrid sensing for automated waste sorting, within our newly implemented state-of-the-art experimental setup. Finally, Section 4 outlines the methodology adopted in this study, beginning with a summary of the key characteristics and design principles of the individual HSI and RGB modules. It then describes in detail the proposed integration approach, which enables joint decision making by integrating the outputs of the two sensing modalities, resulting in a highly accurate final classification.

2. Results

2.1. HSI-Based Waste Classification

Hyperspectral data from waste samples were acquired using the industrial Visum HSI™ Hyperspectral Imaging System (IRIS Technology Solution S.L., Barcelona, Spain), which utilises a line-scanner (see Section 4 for details). Data collection considered six different types of waste objects, namely polyethylene terephthalate (PET), polypropylene (PP), polyethylene (PE), polystyrene (PS), paper-based packages, and aluminium (ALU) packages. Then, the classification model described in Section 4 was applied, and classification performance parameters per pixel were calculated, as listed in Table 1.
A higher precision score was observed for the ALU class (0.990), followed by PS (0.960) and PAPER (0.950), indicating the model’s capability to correctly assign these materials to the true class. The lowest precision value was found for the PET class (0.740), suggesting a higher rate of false positives in this class. In terms of sensitivity, PET class exhibited the highest value (0.987), reflecting the model’s strong ability to identify true PET samples. However, the lower precision value led to a more modest F1-score of 0.846. Classes like PS and PAPER achieved the highest F1-scores of 0.970 and 0.964, respectively, combining both high precision and sensitivity values. Specificity values were generally high across all classes (>0.95), with the ALU class reaching the highest specificity value (0.998), confirming the model’s robustness in correctly identifying true negatives. Correspondingly, the ALU class also recorded the lowest FPR (0.002), while PET showed the highest FPR (0.050), which may explain the lower precision for this class. FNRs were notably low overall, with PET again demonstrating the lowest value (0.013), while PE exhibited the highest FNR (0.214), suggesting more frequent missed detections in this class.
In relation to the lower precision value observed for PET (0.740), this result is consistent with the heterogeneity of post-consumer PET items. Combinations with other plastics, such as PE, and/or the presence of paper labels, are commonly present within PET-class waste objects. This could alter surface spectral signal and lead to spectral overlap during pixel-wise classification. As shown in Section 4.3, the fused system mitigates part of this behaviour by cross-checking PET-like spectral cues against RGB instance masks and appearance features.
Despite the majority of chemometric-based classification relying solely on the accuracy values, the inclusion of precision and sensitivity in the performance assessment gives a more comprehensive view of the performance of the developed classification model, especially in the case of different devices involved in the classification activities [27].
For the second step of HSI classification performance, Table 2 presents the object-based validation results.
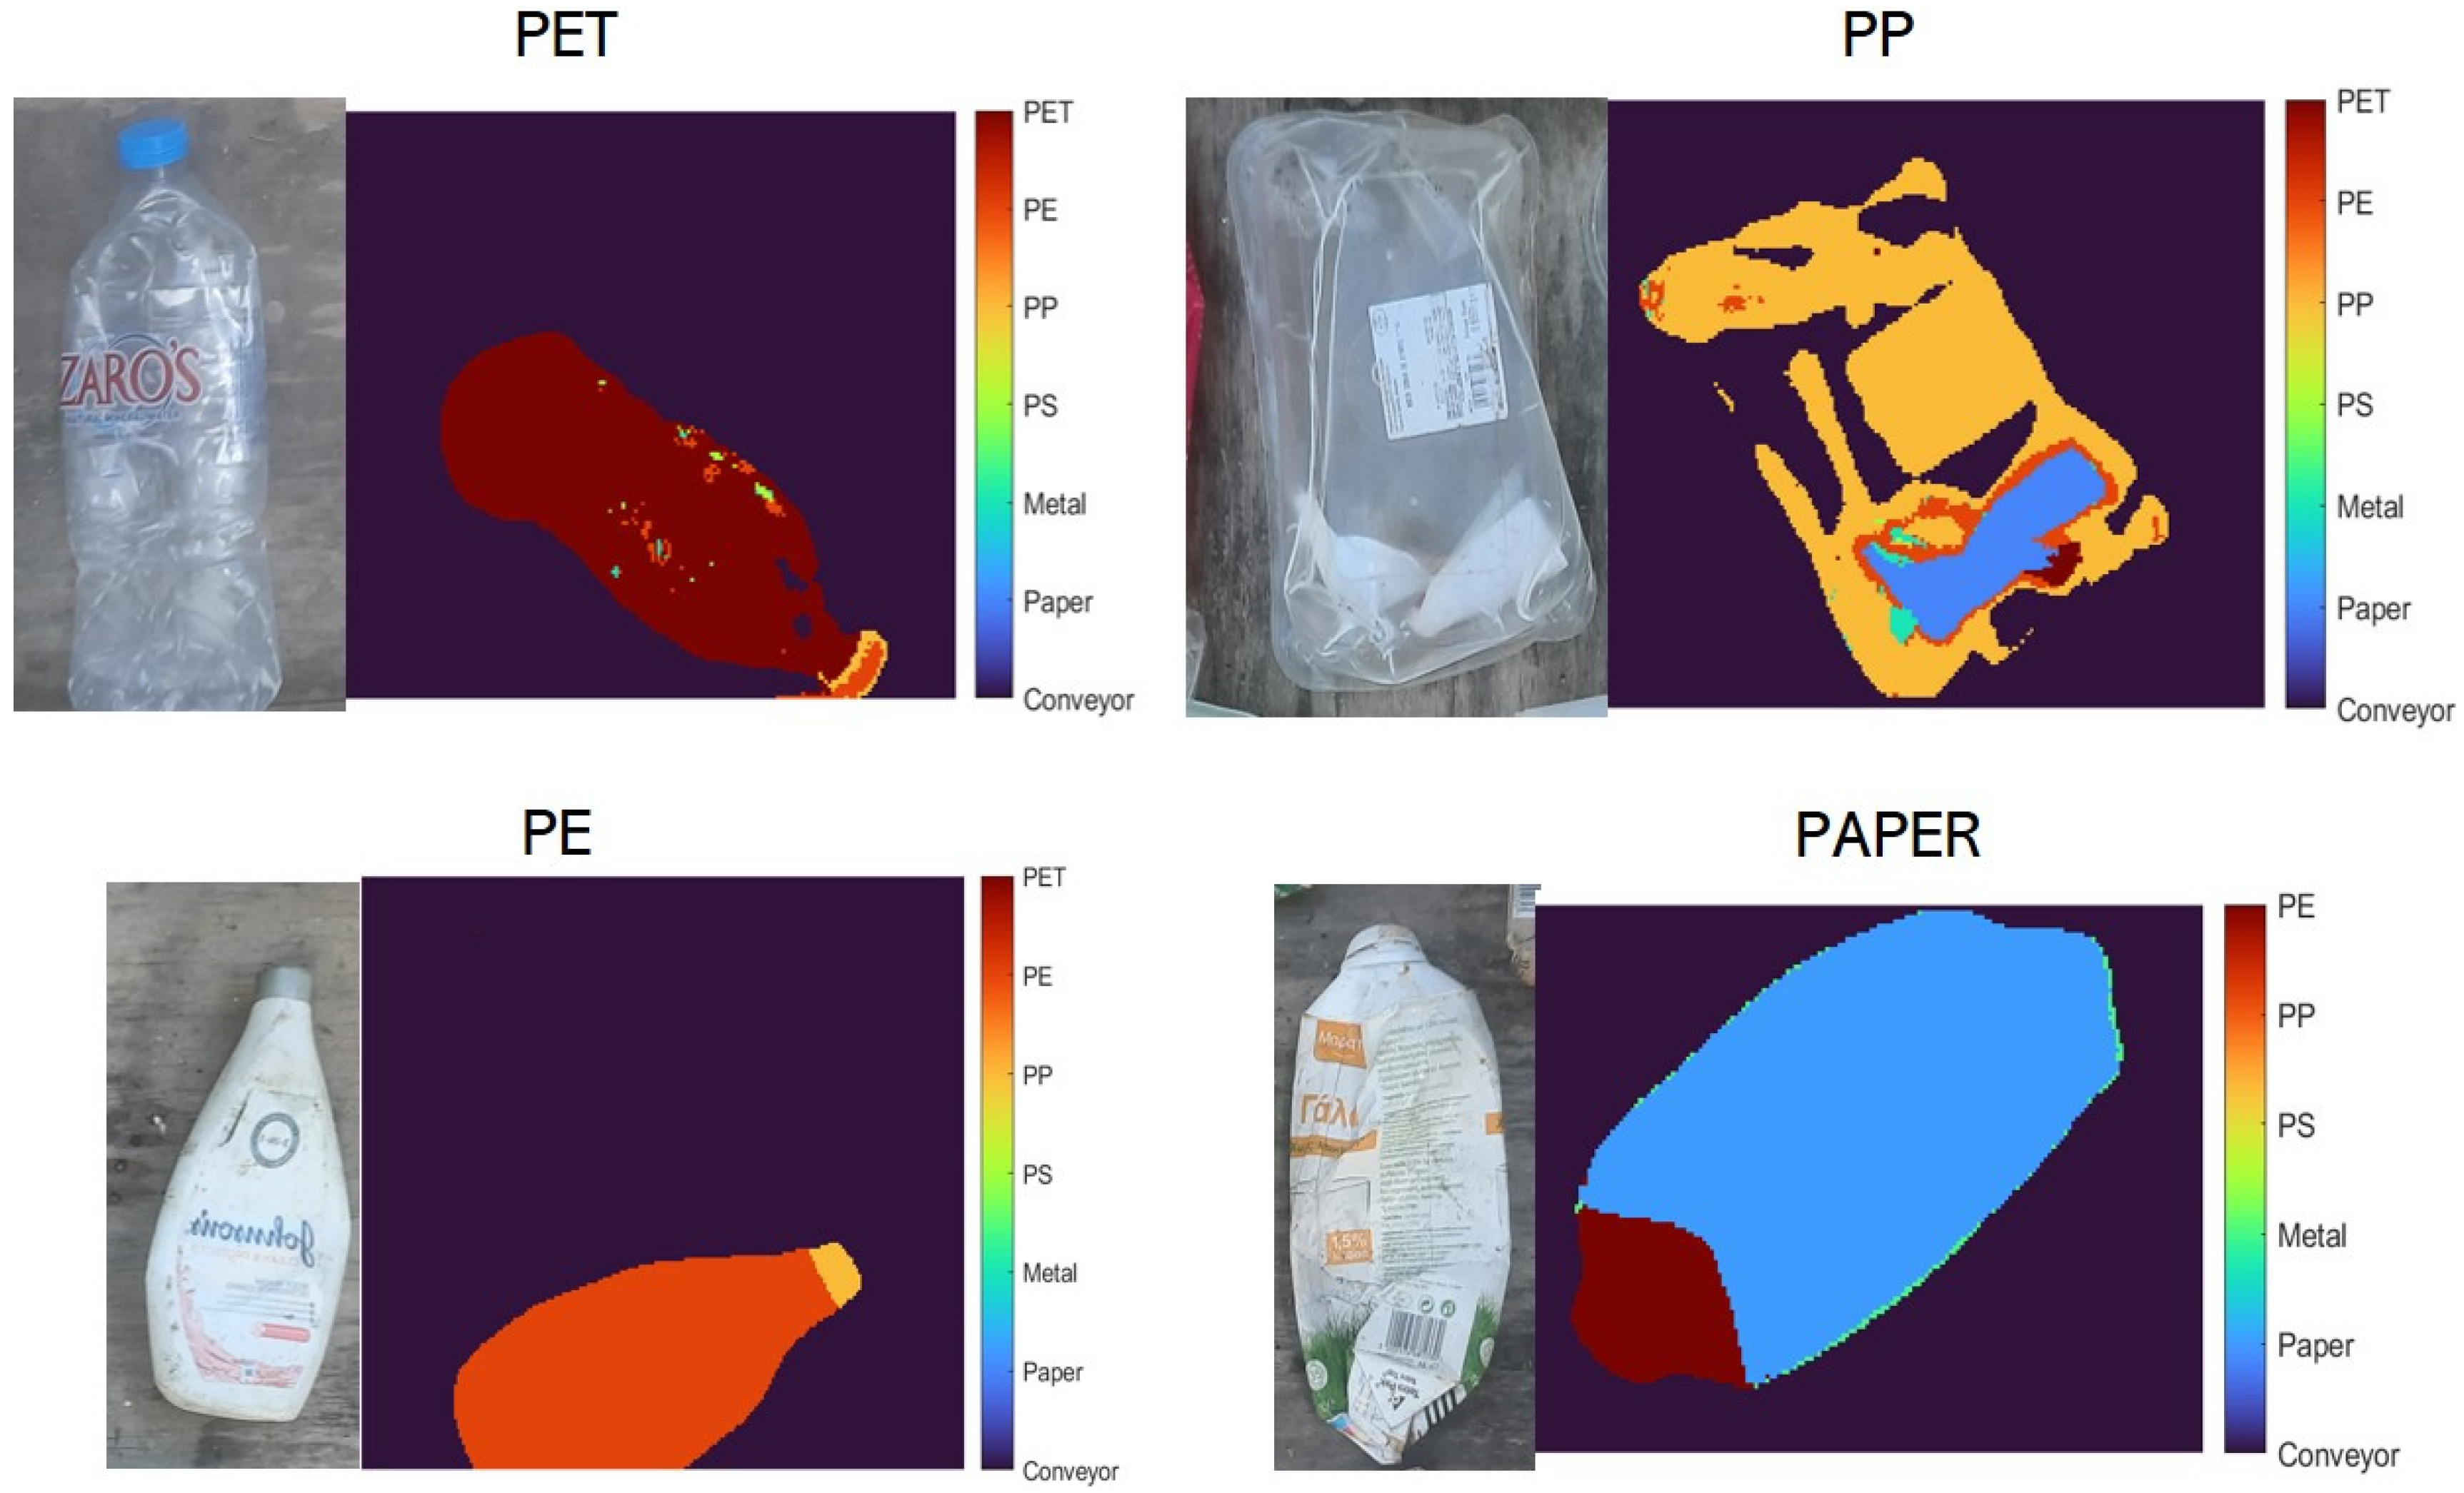
All samples across all material classes were correctly classified at both the >50% and >70% pixel thresholds—giving the same results—suggesting a consistent model performance in classifying the dominant material in each object. For this reason, the results at the >50% and >70% thresholds have been merged in the same column to avoid redundance. However, at the >90% threshold, performance ratings decreased. ALU and PS classes maintained high classification accuracy (6/6 and 2/2, respectively); meanwhile, PET and PE samples had the lowest performance at this stricter threshold (1/5 and 4/8, respectively), likely due to the higher spectral variability and presence of mixed materials in these samples. Figure 2 shows four different validation samples and the classification output indicating how different materials in the same objects are predicted.
A similar object-based approach, related to hyperspectral image analysis, was implemented by [28]. In their study, both confusion matrix-related metrics and object-based metrics were used, presenting comparable results with our study while having a slight difference in the materials and parameters considered for model development. In another example [29], both classification statistics were implemented along with the number of correctly classified objects (in this case supported by a software for validation), with differences in the type of material implemented for the sorting application (plasterboard waste).
It is usual for domestic waste material to present a heterogeneous composition, either due to its multicomponent design (e.g., caps, labels) or to accidental overlapping as shown in Figure 2 where a piece of paper is trapped inside the PP sample. The other samples present purposely designed heterogeneous components such as labels and caps in the PET and PE samples, while in the paper sample only a cap is detected. The developed classification method takes into account these chemical and spectral variabilities naturally found in packaging waste.

2.2. RGB-Based Waste Classification

In a separate waste processing stream (see Figure 1), an RGB-based waste classification module is developed using the well-established Mask Regional Convolutional Neural Network (Mask R-CNN) architecture [30]. Mask R-CNN has proven highly effective in visual recognition tasks due to its ability to simultaneously perform object detection, instance segmentation, and classification. These capabilities make it particularly suitable for recyclable waste sorting applications, where accurate localisation and identification of diverse waste objects are required. To adapt Mask R-CNN for the specific task of waste classification, a transfer learning approach is employed. The training process begins with a pre-trained Mask R-CNN model, which significantly reduces the amount of waste-specific training data required and ensures faster convergence during fine-tuning. In this adaptation, only the final classification and mask prediction layers (referred to as the ‘heads’) are fine-tuned using annotated images from waste processing environments, while the feature extraction backbone remains fixed.
To train the model, a dataset was developed, consisting of 1000 manually annotated belt images enriched with synthetic waste object images as described in [16]. The model was trained using 80% of the images, keeping the 20% for validation. The results obtained after applying the newly trained model on the test images are summarised in Table 3.
Despite the overall successful performance of the model, there were cases where it occasionally underperformed. One such limitation is related to the classification of PP and PS waste items grouped into a single class in our dataset. This is because the waste samples were sourced from the local Material Recovery Facility in Heraklion (Crete, Greece), where PP and PS are manually sorted into the same bin. As a result, the dataset annotations also treat them as a unified category, preventing the model from learning to distinguish between them. Interestingly, although the RGB-based classifier is trained to treat PP and PS as a single class, by combining the outputs of the RGB and the HSI modules it is possible to differentiate between the two materials, as described in the following section.

2.3. Integrated HSI and RGB Decision Making

To address the limitations of the individual HSI and RGB classification methods described above, a Support Vector Machine (SVM) classifier that combines their predictions into a single, aggregated decision was trained following the methodology outlined in Section 4.3.
To acquire the dataset used for training the SVM, a new experiment in which both RGB and HSI monitoring were simultaneously activated on the same waste stream was conducted, which means the following modules operated in parallel: (i) the HSI classifier, (ii) the RGB classifier, (iii) the HSI/RGB image registration workflow, and (iv) a feature extraction process that collected object-specific attributes listed in Section 4.4. In particular, RGB and HSI data for 378 waste objects were captured. The resulting dataset was manually reviewed by a human expert who provided the ground truth classification and verified the accuracy of the data.
In this dataset, the combined PP/PS class used by the RGB module was split into two material-specific classes, PP and PS, which are considered separately by the SVM. Moreover, during experimentation with the SVM, it appeared that the generation of a new class dedicated to “dark-PP” objects, which are visible by the RGB but not the HSI camera, can better highlight their unique nature and facilitate their identification (otherwise, when using a single PP class, they seem to be treated as noise in the overall PP data and they are neglected). Therefore, one more class has been added as an option for the SVM outputs. These two classes (PP and Dark-PP) can be combined at the following stage when material recovery targets are sent to the robotic waste sorters, placing both PP and Dark-PP into the same bin.
Before training the SVM, Principal Component Analysis (PCA) was applied to reduce the problem’s dimensionality and filter out noise from the original dataset. Applying the PCA prior to classification improves the accuracy of the SVM model, while introducing only a minor impact on processing time. For training, the first four principal components were used, which contributed to enhanced classification robustness. The dataset was split into two parts, with 70% used for training the SVM and the remaining 30% reserved for testing and assessing its performance in previously unseen objects (264 items used for training, 114 for testing). The SVM model uses an RBF kernel with variance 3.5 (specified after repeating trials). Τhe hyperparameters of the SVM were selected empirically, to achieve good balance between classification accuracy and model generalisation. The radial basis function (RBF) kernel was employed, as it is capable of capturing complex, non-linear relationships in the feature space. The regularisation parameter C was set to 3.5, which provides a compromise between maximising the margin and penalising misclassifications, thereby controlling the trade-off between model flexibility and overfitting. The gamma parameter was set to ‘scale’, allowing it to be automatically adjusted based on the variance in the input data, which improves robustness across different feature distributions. The classification report of the trained model is summarised in Table 4.
It is of particular interest to examine how the joint, dual-modality waste classification approach compares against the single mode classification. Table 5 presents the success rate of waste object classification considering the processing of RGB images alone, HSIs alone, and the combination of the two. It is important to note that for the HSI results, the dominant material requiring >50% of the pixels on the same material type is used to define the category of an object.
It is noted that the class Dark_PP is only considered by the SVM classifier, as it does not exist for either the RGB-alone or the HSI-alone monitoring. In particular, as discussed already at the end of Section 2.2, the RGB waste classification model is trained to classify objects in the PP/PS class (this is reported as plain PP in Table 5). However, this is not the case for the HSI which can distinguish between PP and PS objects, with the exception that it faces difficulties with the dark objects. The SVM exploits the power of infrared imaging to correct RGB predictions, effectively classifying the relevant objects as either PP or PS. Examining specifically the Dark_PP class reported in Table 5, the RGB module detects an object and classifies it as PP/PS. Meanwhile, the HSI module can only identify part of the object’s pixels due to its darkness, but these pixels are correctly classified as PP. Interestingly, the SVM effectively combines the partially correct information from both the RGB and HSI modules to successfully classify the object into the correct PP material type.
Overall, integrating waste classification results from both the visible (RGB) and infrared (HSI) spectral domains enables more accurate and robust material differentiation. By leveraging the complementary strengths of RGB imaging (e.g., high spatial resolution and colour-based identification) and HSI (e.g., spectral signature discrimination of chemically similar materials), the system achieves enhanced classification performance. The trained SVM effectively combines these two modalities by dynamically weighing their respective advantages and limitations for each material type. This data fusion approach mitigates individual sensor shortcomings—such as RGB’s sensitivity to lighting conditions or HSI’s blindness on dark objects—resulting in highly reliable, automated waste classification with minimal error. Potential drawbacks of the proposed solution include the need for controlled lighting conditions that should remain minimally affected by external ambient light, the requirement for separate computing infrastructures to ensure reliable and fast processing in both the HSI and RGB domains as well as the necessity of training the AI components not on general-purpose waste sorting data, but on application-specific datasets collected on-site.
The above-described system is a core component of the portable robotic Material Recovery Facility (prMRF), developed under the EU-funded project RECLAIM. The system presented in the current work generates picking targets for a team of five low-cost robotic sorters [31], installed inside the prMRF. We do not, however, detail the design or operation of these robots, as their physical waste sorting mechanics are beyond the scope of this document.

3. Discussion

The present work considers the implementation and evaluation of a new waste classification approach that aims to increase the purity of recovered materials in automated waste sorting applications by combining HSI and RGB object monitoring and classification. Specifically, we investigate three classification methods tailored for real-world industrial settings, enabling continuous and automated waste sorting beyond laboratory conditions. The proposed solutions include the following:
  • An HSI module operating in the infrared spectrum, performing pixel-level material classification using spectral signatures.
  • An RGB-based module operating in the visible-spectrum to detect and classify waste objects based on visual appearance.
  • A bi-modal system integrating HSI and RGB outputs to combine spectral and visual information, improving classification accuracy.
Each module is independently optimised for its sensing modality: HSI excels at material identification through detailed chemical data, while RGB imaging provides fast, appearance-based object recognition. The proposed integration approach post-processes HSI and RGB results, extracting features for an SVM classifier trained to compensate for individual limitations. This unified system enhances robustness, achieving an average classification accuracy of 97% on waste items. Such high performance enables the recovery of materials with markedly improved purity, thereby reducing contamination in the recycling stream. In addition, the HSI and RGB combination allows the detection of more materials, such as, Dark_PP, which are usually challenging to classify. Therefore, the proposed approach strengthens recycling processes and supports the long-term viability of the circular economy by ensuring that secondary raw materials retain higher value and usability.
To evaluate performance, the three approaches (HSI alone, RGB alone, and HSI+RGB combined) were tested on real-world waste streams within the portable and robotic Material Recovery Facility (prMRF). The use of industrially sourced waste samples ensured realistic representation of the conditions encountered in recycling environments, including dirtiness, shape irregularities, and material complexity. Results show that the combined system outperforms individual modules, demonstrating the value of integrated sensing in practical waste sorting.
In contrast to previous HSI–RGB applications conducted under controlled laboratory lighting in the absence of object movement, the present work performs encoder-based synchronisation and homography alignment between a line-scan HSI stream and high-rate RGB images on a moving belt. This enables decision-level fusion in a dynamic industrial setting, addressing two failure modes that are rarely considered together: (i) reduced HSI response for dark plastics or overlapping objects, and (ii) RGB confusion between chemically different but similar-looking polymers. The resulting pipeline shows that real-time, on-belt fusion can be reliably integrated into existing sorting operations.
Future work is focused on the extensive testing of the developed solution with real waste streams exhibiting different compositions and quality characteristics (e.g., mixed plastic, metal, drink carton (PMD) waste), also considering both positive and negative waste sorting requirements. Additionally, the integration of RGB and HSI data sources presents a promising perspective for enhancing classification in other circular economy sectors such as textile recycling but also radically different application domains such as agriculture and food production. Such an application would require full retraining of all machine learning modules (material and object classification in the RGB and HSI domains, as well as SVM decision merging) before deployment in a new context. This retraining must be complemented by the recalibration of non-AI components to match the characteristics of the new operating environment—for example, adjusting for object height (which influences homography) or conveyor belt speed (which affects the relative sizing of HSI and RGB images).

4. Materials and Methods

4.1. Experimental Setup

To assess the performance of the waste classification modules summarised above, we integrated them into the portable and robotic Material Recovery Facility (prMRF), located in Heraklion (Crete, Greece), The prMRF, accommodates five robotic waste sorters housed inside a standard container box, which has been adapted to function as a fully automated and autonomous system for recovering and sorting material-specific fractions from mixed urban waste streams.
The waste classification modules under study are designed to monitor waste objects on the prMRF’s conveyor belt, identifying suitable targets for the robotic sorters to pick and direct to appropriate output bins. In the experimental setup presented here, waste classification is performed using three alternative sensing configurations: (a) Hyperspectral Imaging (HSI) alone, (b) RGB imaging alone, and (c) a combined HSI+RGB bi-modal approach.

4.2. HSI System and Data Acquisition

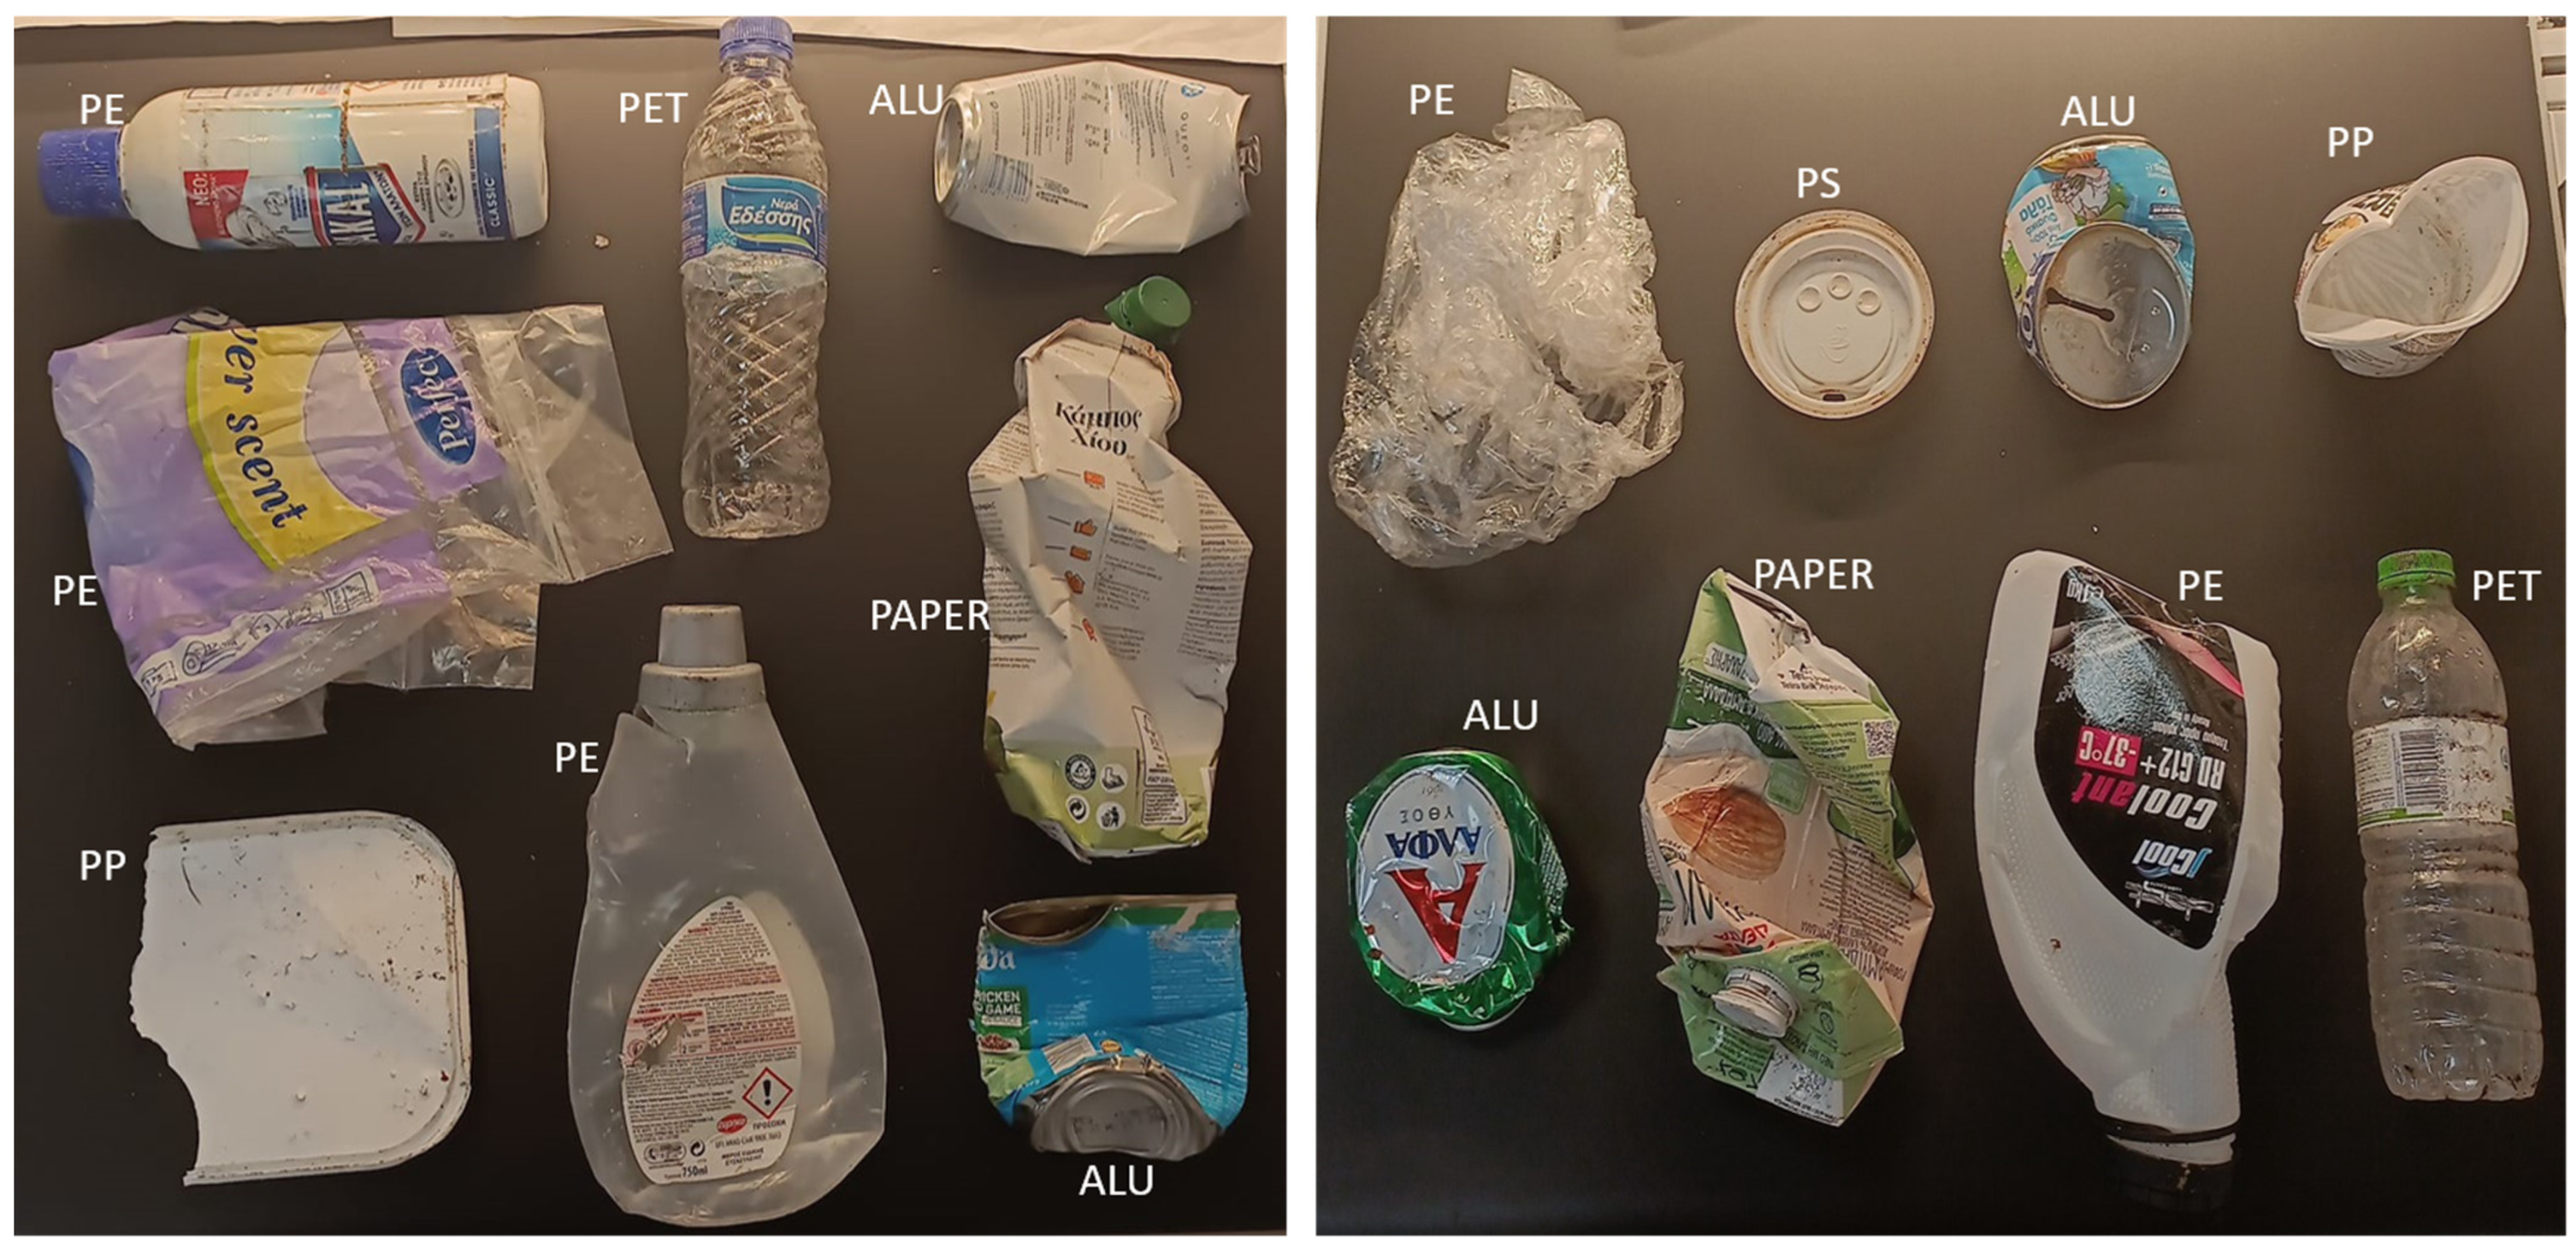
To facilitate the real-world applicability of the HSI waste classification module, it is essential to use representative samples that mirror the complex conditions found in actual recycling operations. For this reason, materials were sourced directly from an operational waste recycling plant. Materials selected as calibration samples (Figure 3) included six different types of materials, described in Table 6, which also explain the classes included in the classification model developed, such as polyethylene terephthalate (PET), polypropylene (PP), polyethylene (PE), paper-based, aluminium-based, and polystyrene (PS)-based samples. The total number of samples used for calibration was 60.
The collected waste items exhibited typical characteristics of post-consumer materials, including surface contamination from food residues or adhesives, heterogeneous material compositions (e.g., multilayer packaging), and irregular shapes resulting from handling and compaction. While these factors introduced variability that made classification more demanding, they also provided a valuable testing ground for developing robust models. Moreover, the selected training samples reflect the average composition of European PMD streams and are consistent with prior HSI sorting studies on packaging plastics [4,32,33,34]. Such real-world variability is critical in evaluating the reliability and practical value of the HSI classification system.
Hyperspectral data were acquired using the industrial Visum HSI™ Hyperspectral Imaging System (IRIS Technology Solution S.L., Barcelona, Spain), which utilises a line-scan (push-broom) imaging configuration. This configuration captures one line of spatial information at a time while simultaneously recording spectral data across a wide range of wavelengths, making it ideal for inspecting materials moving on a conveyor belt. The system is integrated with a dedicated electrical cabinet, computing system and halogen illumination setup that ensures consistent and uniform lighting across the scanned waste stream, minimising spectral distortions caused by shadows or ambient light variability.
Operating in the near-infrared (NIR) spectral range, the Visum HSI™ system is particularly well-suited for sorting municipal waste streams, especially those composed of PMD (Plastic, Metals, and Drink cartons) that exhibit distinct absorption features in the NIR spectrum, allowing for material discrimination based on the unique spectral “fingerprints” of the materials.
The system is managed through Visum HSI™ software (v1.9.5), which enables comprehensive control over the entire imaging pipeline—from hyperspectral image acquisition and preprocessing to feature extraction and automated material classification. This software leverages the spectral information encoded in each pixel to generate pixel-wise classification maps, supporting high-accuracy material sorting for downstream robotic separation processes.
HSI data analysis and modelling have been conducted with the support of MATLAB Version 24.1.0 (R2024a) and PLS_Toolbox 9.2.1 (2024) by Eigenvector Research, Inc., Manson, WA, USA.
Spectra pretreatment is a common step in spectroscopy-based material classification methods [6,35]. PLS-DA is a supervised classification algorithm that is usually implemented for robust discrimination of waste materials [36] and other types of waste such as construction waste [37] by integrating dimensionality reduction with supervised classification, making it particularly suitable for complex, heterogeneous samples found in real waste streams. This has also been explored in recent recycling-focused studies using HSI for plastic waste sorting and in the recycling of waste electrical and electronic equipment (WEEE) plastic [38]
For this application in particular, several combinations of spectra preprocessing techniques, such as standard normal variate (SNV) or mean centering (MC), were tested and implemented to ensure high-quality hyperspectral data and highlight the most important spectral features. Partial Least Squares Discriminant Analysis (PLS-DA) was employed to develop the classification model. PLSDA was implemented as a widely used method thanks to its effectiveness in handling high-dimensional data [22], typical of HSI data in the NIR range.
For the implementation of the validation activities, an independent set of 40 samples was used to evaluate the performance of the hyperspectral imaging (HSI)-based classification models. This set included representative samples from each material class. Spectral data were acquired on different days and from real waste streams.
To assess model performance, statistics have been calculated from the confusion matrix output, as widely implemented for similar applications and purposes [36,38,39]. The calculated parameters are as follows: precision, which represents the proportion of correctly predicted positive cases among all cases predicted as positive; sensitivity, which quantifies the model’s ability to correctly identify true positive cases; specificity (or true negative rate—TNR) indicates the ability to correctly reject negative cases; false negative rate (FNR) and false positive rate (FPR) which, respectively, represent the proportion of missed detections and incorrect positive assignments; and F1-score, the harmonic mean of precision and sensitivity.
Moreover, a second object-based classification assessment was conducted to better reflect the practical performance of this real-world waste application. This approach took into account the entire object classification, which was considered correctly classified if a minimum percentage of its pixels were predicted as belonging to the object’s true reference class. A similar approach is described in [28]. In our case, three different pixel classification thresholds have been set: 50–70–90%.

4.3. Waste Classification in the RGB Domain

Recent advancements in deep neural network technology have significantly improved the performance of waste classification systems in industrial environments. One critical and technically demanding aspect of waste identification is instance segmentation in which computer vision must detect and classify multiple objects in a single image while accurately separating overlapping items. This is particularly relevant in real-world material recovery facilities, where various recyclable objects are mixed together and transported on conveyor belts. Recent works examined the performance of different neural network models on instance segmentation tasks showing that it is still challenging to combine real-time operation with high-quality object masking [40].
The Mask Regional Convolutional Neural Network (Mask R-CNN), a well-established architecture that combines a region-based convolutional neural network with a mask prediction branch for pixel-level segmentation [30], has demonstrated high accuracy in waste identification and categorisation tasks [13]. In the current work, Mask R-CNN is adopted as the primary computer vision engine for identifying, localising, and classifying recyclable materials into material-specific categories.
Like most deep neural networks, Mask R-CNN requires a substantial amount of training data due to both its architectural complexity but also the difficulty and the nature of the waste classification task it is aimed to tackle. The industrial process of recyclable waste management creates the context in which data collection takes place as the waste is transported on a belt. The constant motion of the waste objects on the belt necessitates the use of a global shutter camera, which exposes all pixels simultaneously. This prevents motion blur and ensures sharp image capture that is not affected by the movement of objects. To generate constant lighting during both data collection and real-time application of the model, a small dark room was constructed to block ambient light. Inside this controlled environment, a high-intensity, stable lighting system is installed to eliminate variability caused by external lighting. The global shutter camera is also housed within this dark room, capturing images under nearly identical conditions each time.
Training with a large amount of data aims to prevent overfitting while promoting generalisation, ultimately allowing the model to make accurate predictions on data it has never seen before. However, one of the most significant bottlenecks in this process is the preparation and annotation of the training data. In industrial waste sorting contexts, cameras can capture per day millions of images depicting objects moving along conveyor belts. Manually annotating each object in these images is time-consuming, labour-intensive, and costly. Moreover, maintaining consistent annotation quality requires well-trained personnel and rigorous quality control procedures, further increasing the overhead.
To address these challenges, the use of synthetic waste data has emerged as a promising alternative. By generating artificial images with automatic annotations, synthetic datasets can significantly reduce the manual effort required. At the same time, they can improve the overall performance of waste classification models by increasing data diversity and balancing class distributions. As shown in [16], the integration of synthetic waste images into the training pipeline enhances both the accuracy and robustness of classification models. This hybrid approach, combining real-world and synthetic data, offers a scalable and efficient path forward for developing high-performance systems without being constrained by manual annotation bottlenecks.

4.4. Integrated Decision Making from HSI and RGB Waste Classification

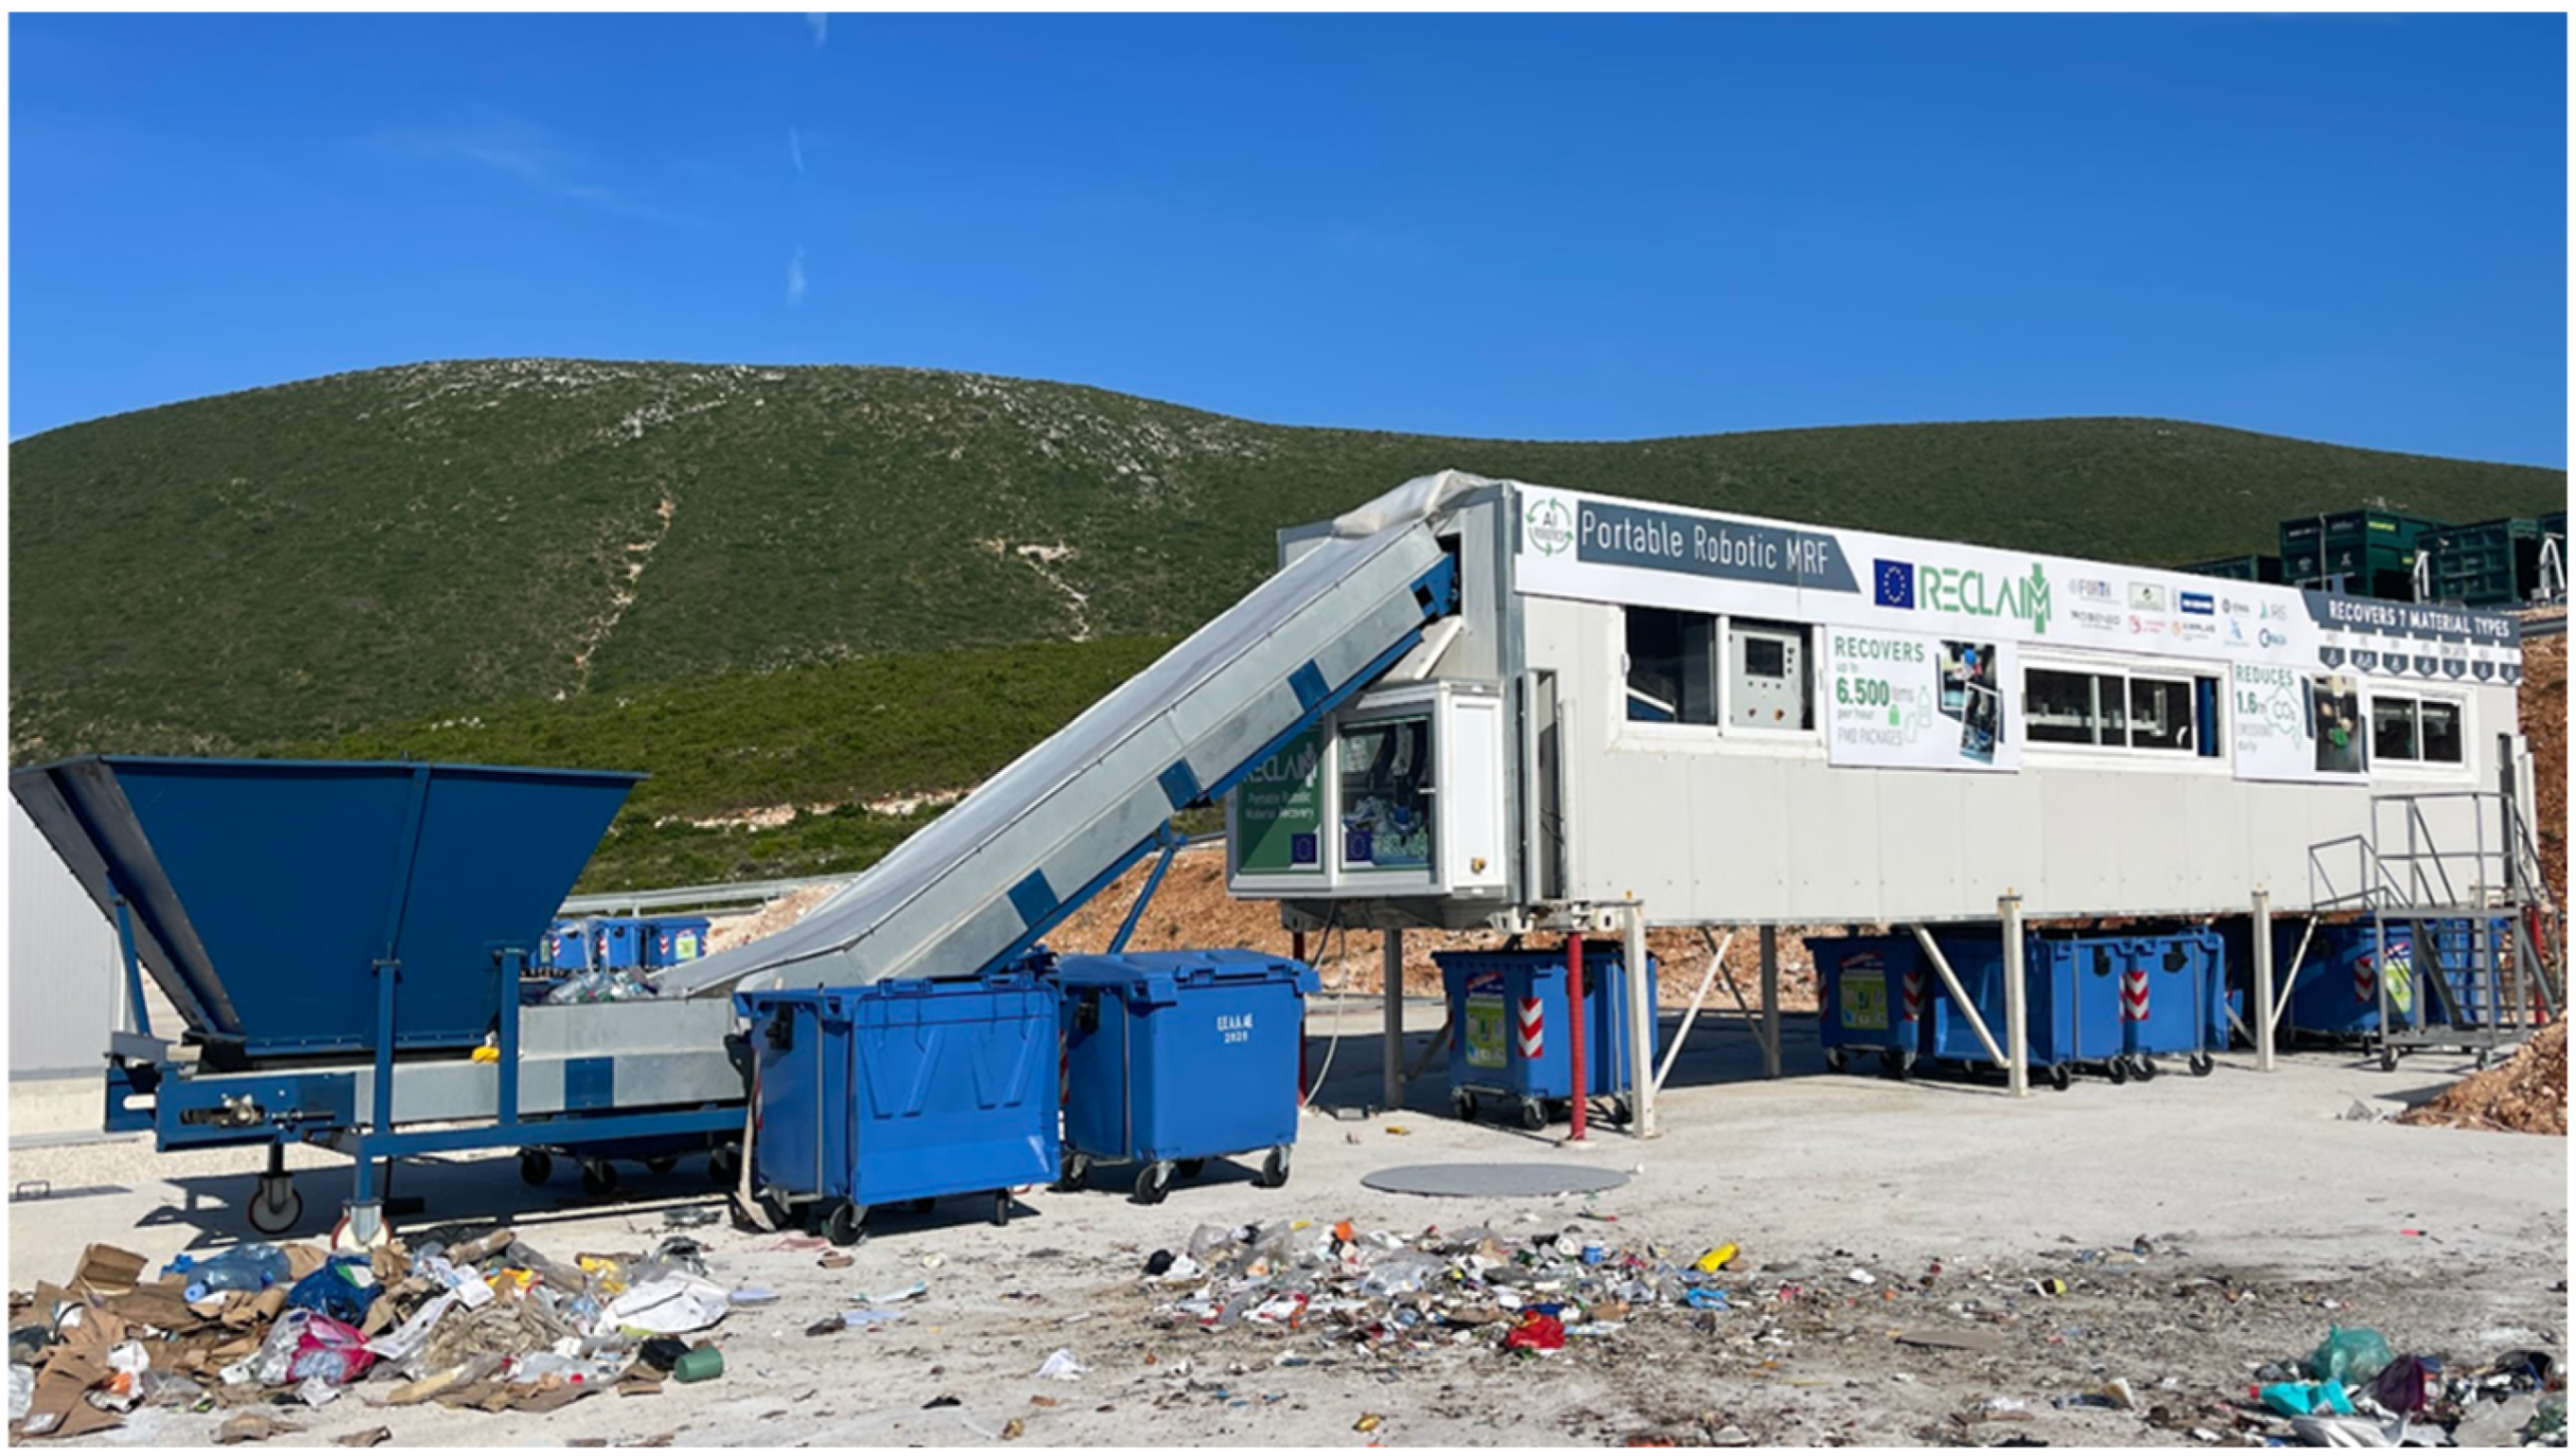
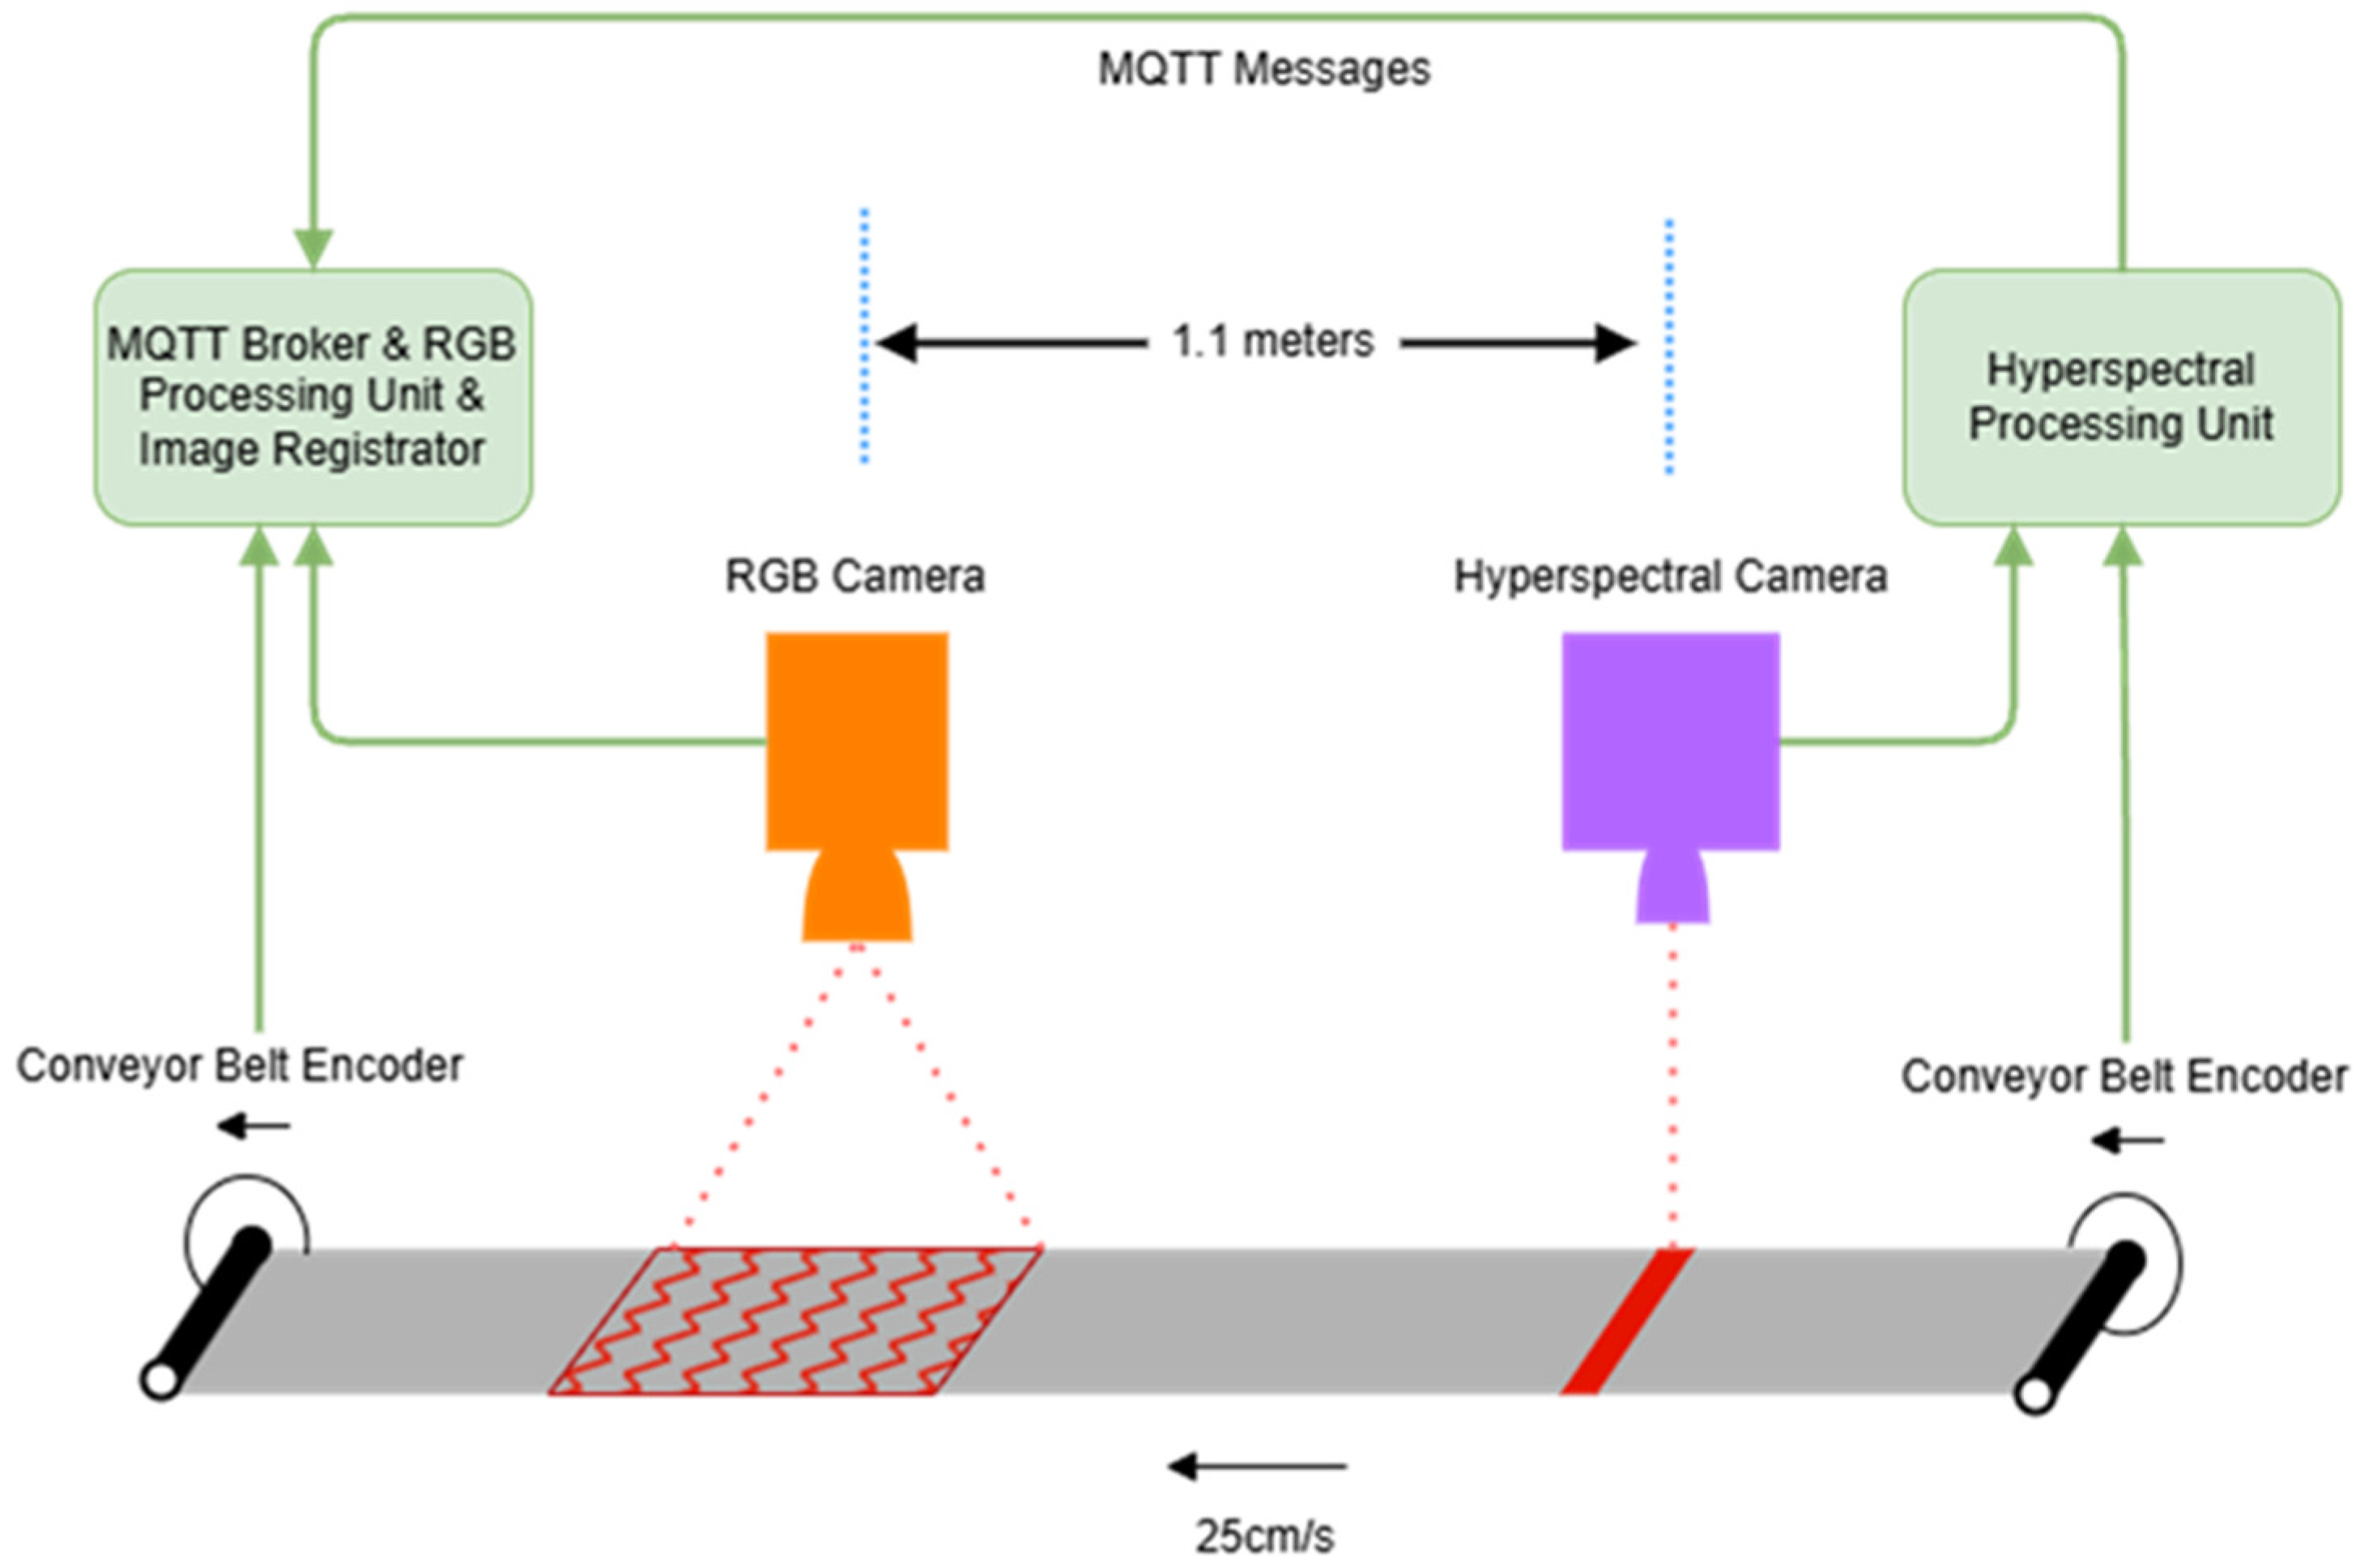
Both HSI and RGB modules were integrated into the containerised, portable, and robotic Material Recovery Facility (prMRF) developed within the EU-funded project RECLAIM (see Figure 4). To merge the classification results from the RGB and HSI modalities into a single unified decision over a continuously flowing waste stream, it is necessary to synchronise their operation. To this end, the two components were installed over the same belt as shown in Figure 5.
The belt operates autonomously at a predefined speed, transporting the waste that is monitored by the following two subsystems. The HSI camera is positioned first and captures lines at multiple narrow bands across the infrared spectrum, providing spectral information for each pixel that corresponds to a very small area of the real world. The RGB camera is placed after the hyperspectral camera (following the waste stream flow) and captures conventional 2D RGB images. All the information captured by the HSI and RGB cameras is stamped by dedicated encoders that are able to record in detail the position of the belt at the given moment. Indicative outputs of the HSI and RGB waste categorisation components are illustrated in Figure 6.
Off-line HSI and RGB camera calibration. Prior to integrating the HSI and RGB prediction outputs a registration of the two cameras is required, setting their predictions in a common ground where joint decisions can be made. Camera registration is performed once, and its result is subsequently utilised during regular system operation.
The HSI line scans are processed in batches of 200 lines. Each batch is timestamped with the encoder values corresponding to the first and last captured line, thus allowing all intermediate lines to be also time-stamped through an interpolation process. The RGB image-processing module utilises its own encoder’s values to assign a belt position to the centre of the image and based on that to all lines of the 2D image plane.
Additionally, the distance between the two cameras and the speed of the belt conveying recyclables is considered to find their relative distance in the encoders’ tick values. Given that the two encoders of the HSI and RGB cameras provide values at different frequencies, a predictive mechanism is implemented that allows using the outputs of the high-frequency encoder (RGB camera) to predict the corresponding values of the lower- frequency encoder (HSI camera). This synchronisation of the two cameras allows associating the lines of the HSIs with the corresponding lines of the RGB images. However, the HSI and RGB images are still different in nature due to the following reasons:
  • The sizes of the two images are different: HSI batches of size 200 × 640 vs. RGB images of size 1280 × 1080,
  • The view angles of the two cameras are different: vertical HSI line scans vs. Two-dimensional RGB scans with perspective distortions affected by the relative position of the camera and the object.
Therefore, a second phase of the RGB–HSI alignment is required, which involves estimating the geometric transformation that describes how the planar HSI can be mapped to the RGB image. To address this issue, the homography that encodes the projective transformation linking corresponding points between two images was estimated. This is represented by a 3 × 3 matrix H satisfying the following equation:
s x y 1 = H x y 1 = h 11 h 12 h 13 h 21 h 22 h 23 h 31 h 32 h 33 x y 1
where (x, y) and (x′, y′) are corresponding points in the two images, and s is a scale factor. The homography matrix H encapsulates rotation, translation, scaling, and perspective distortions transformations. By estimating H, images can be transformed into the same coordinate system, ensuring alignment and reliable integrated decision making.
A critical consideration in homography estimation is that the output of the HSI-based material classification module (see Figure 6a) cannot be directly used for aligning the RGB and HSI modalities. This is primarily because the material classification output lacks detailed texture information, which is essential for accurate feature matching. Moreover, classification boundaries in the HSI output may exhibit small-scale material mispredictions, introducing noise that can significantly degrade the accuracy of the homography estimation. To address this challenge, homography is instead estimated using the central spectral band of the raw HSI data, rather than the processed material predictions. This central band often resembles a grayscale image for many materials, preserving sufficient structural and textural detail for robust feature-based alignment. Once the homography is estimated using the raw central HSI band, it can be applied to align the RGB image with the HSI prediction output, due to the inherent 1:1 pixel correspondence between the raw HSI data and the processed classification results.
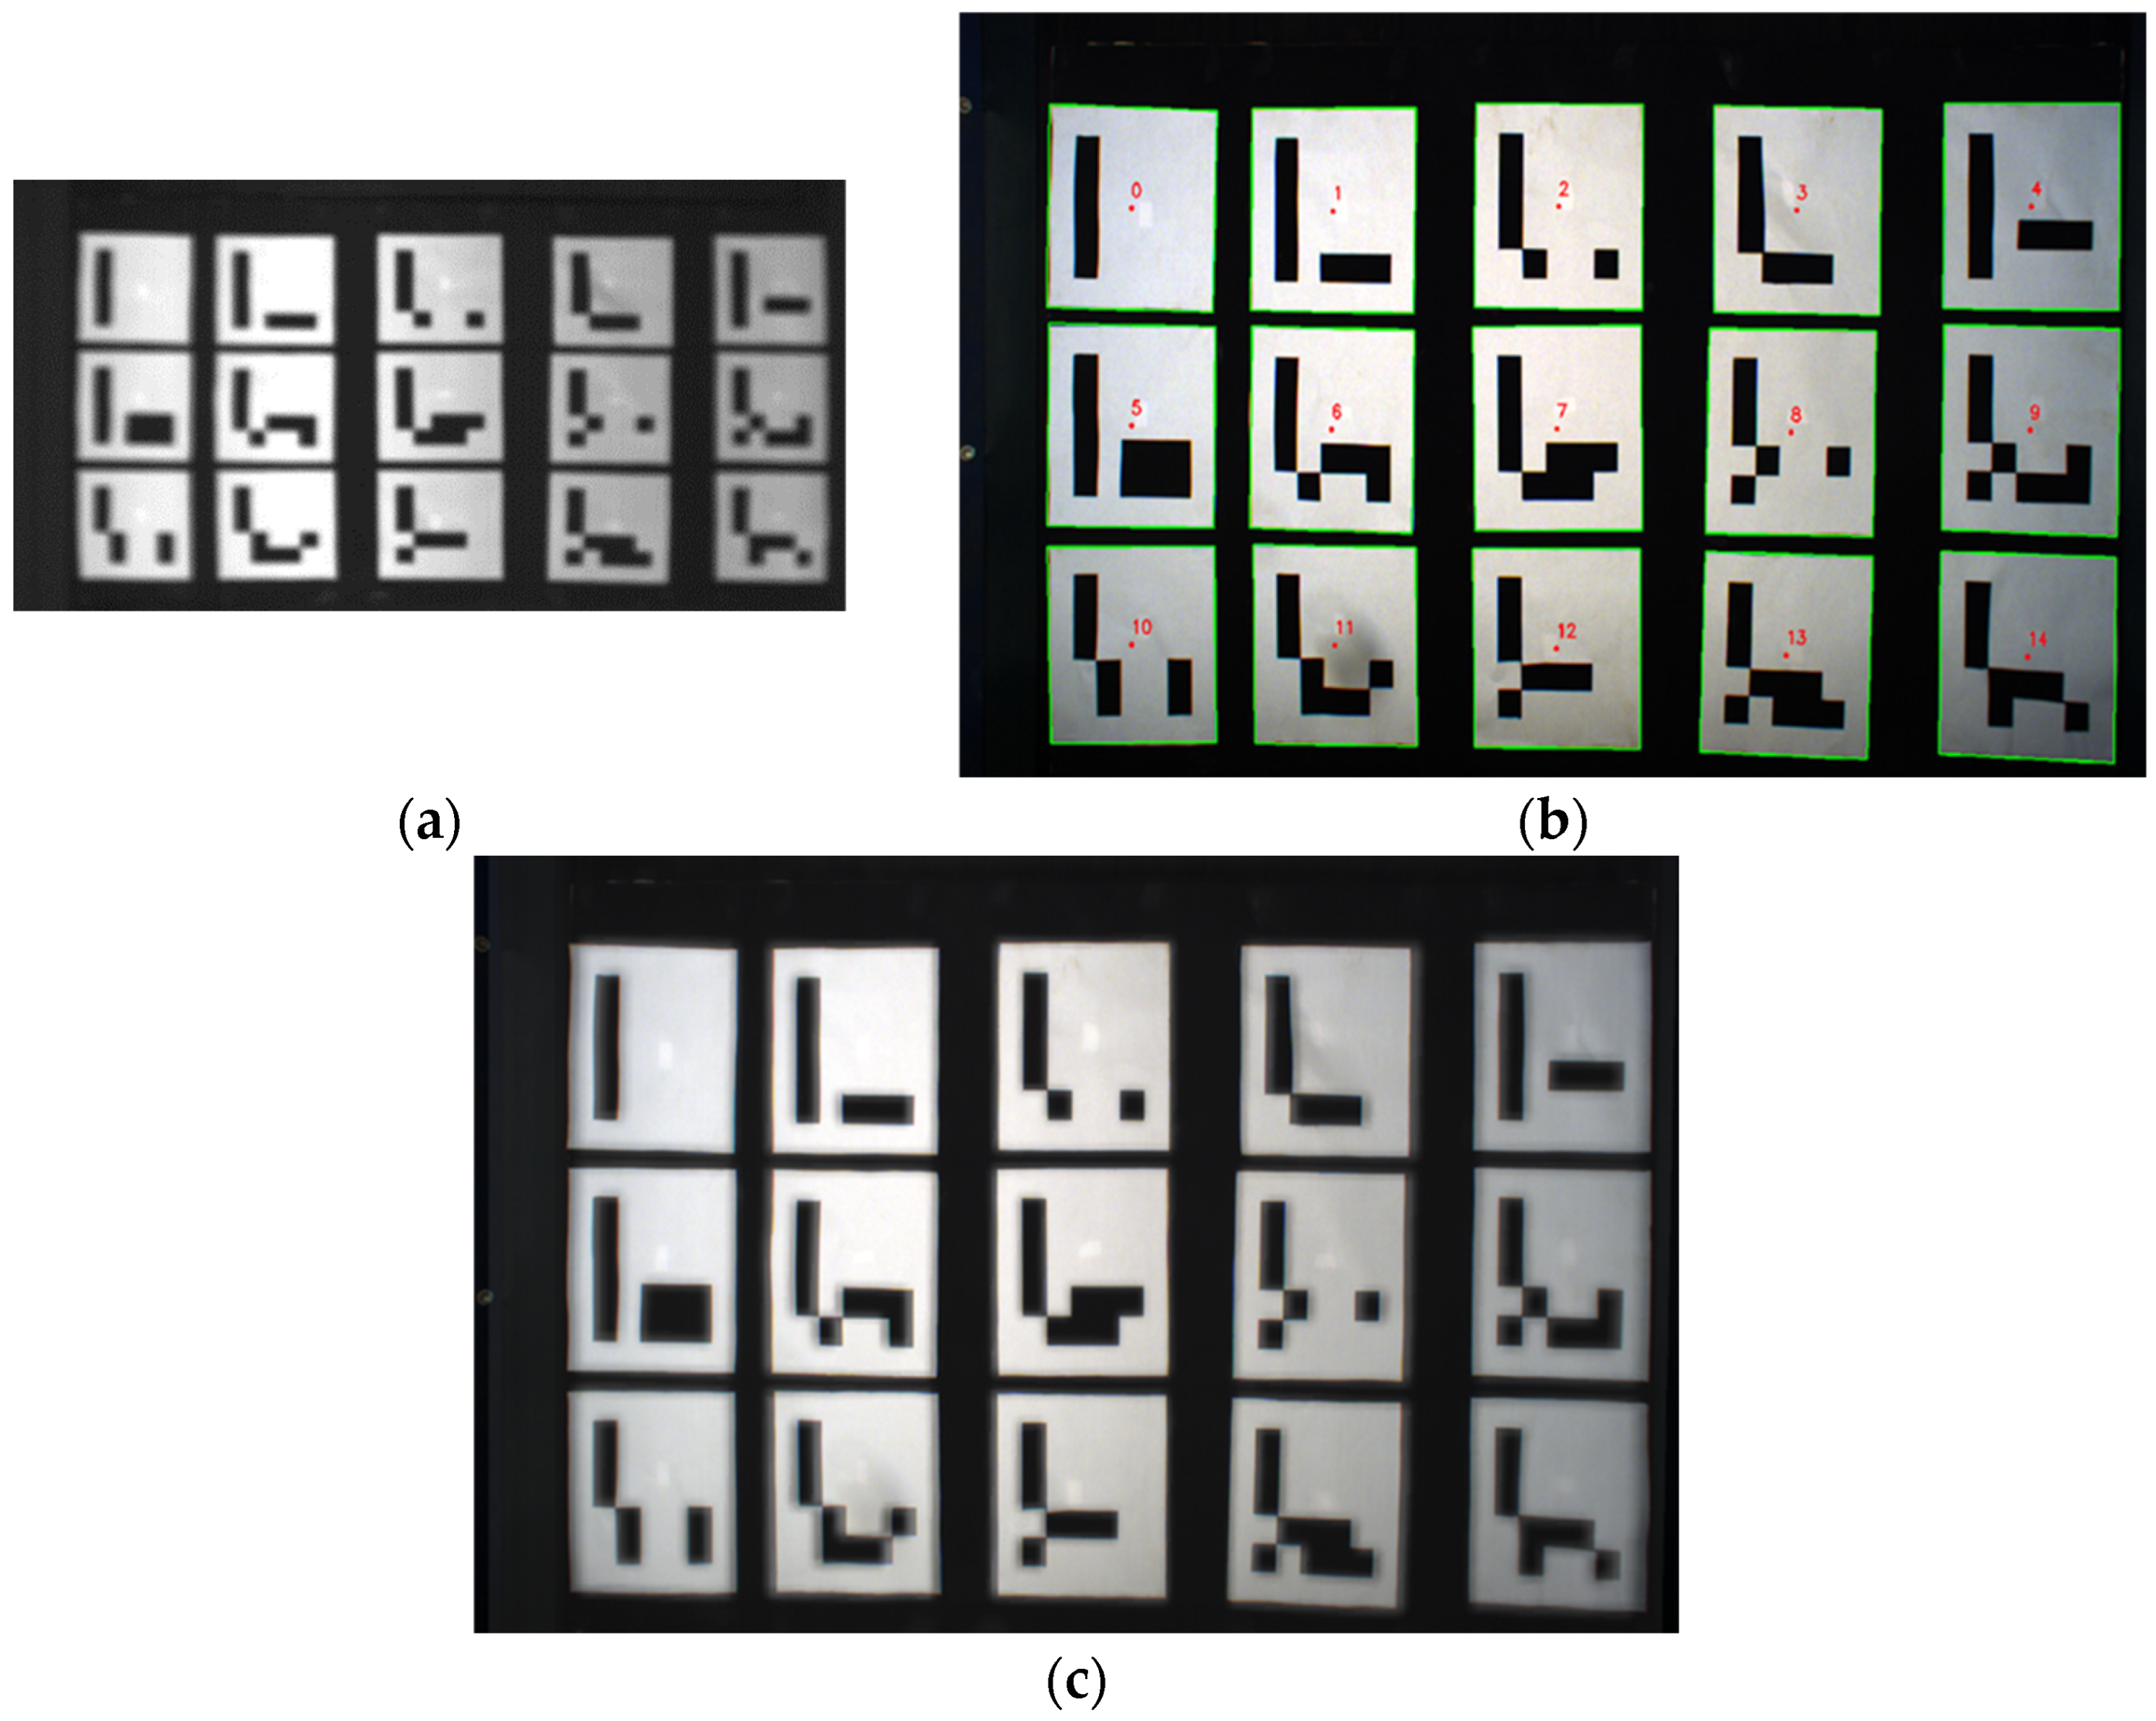
For estimating the homography matrix that encodes the correspondence between the two images, 15 ARUCO markers were used, with each ARUCO marker identified as a single composite item for which correspondence should be built. Therefore, by using a set of ARUCO markers, the robustness of the identification improves, and the effect of the pixel outliers is minimised.
We used highly reflective aluminium-foiled ARUCO markers mounted on a flat, cardboard background painted black with a non-reflective plastic colour. This high contrast in both material and appearance makes the markers clearly visible to both the HSI (Figure 7a) and the RGB (Figure 7b) cameras. The OpenCV ArucoDetector class was used for accurately detecting the location and orientation of ARUCO markers. The homography matrix was estimated using OpenCV, yielding an average reprojection error of 0.76 pixels. The successful alignment is visually confirmed by superimposing the transformed HSI onto the RGB reference image (Figure 7c). A further quantitative assessment was performed by calculating the normalised Mean Square Error between the original RGB image and the aligned HSI, normalised in the range [0, 1], which resulted in a value of 0.048.
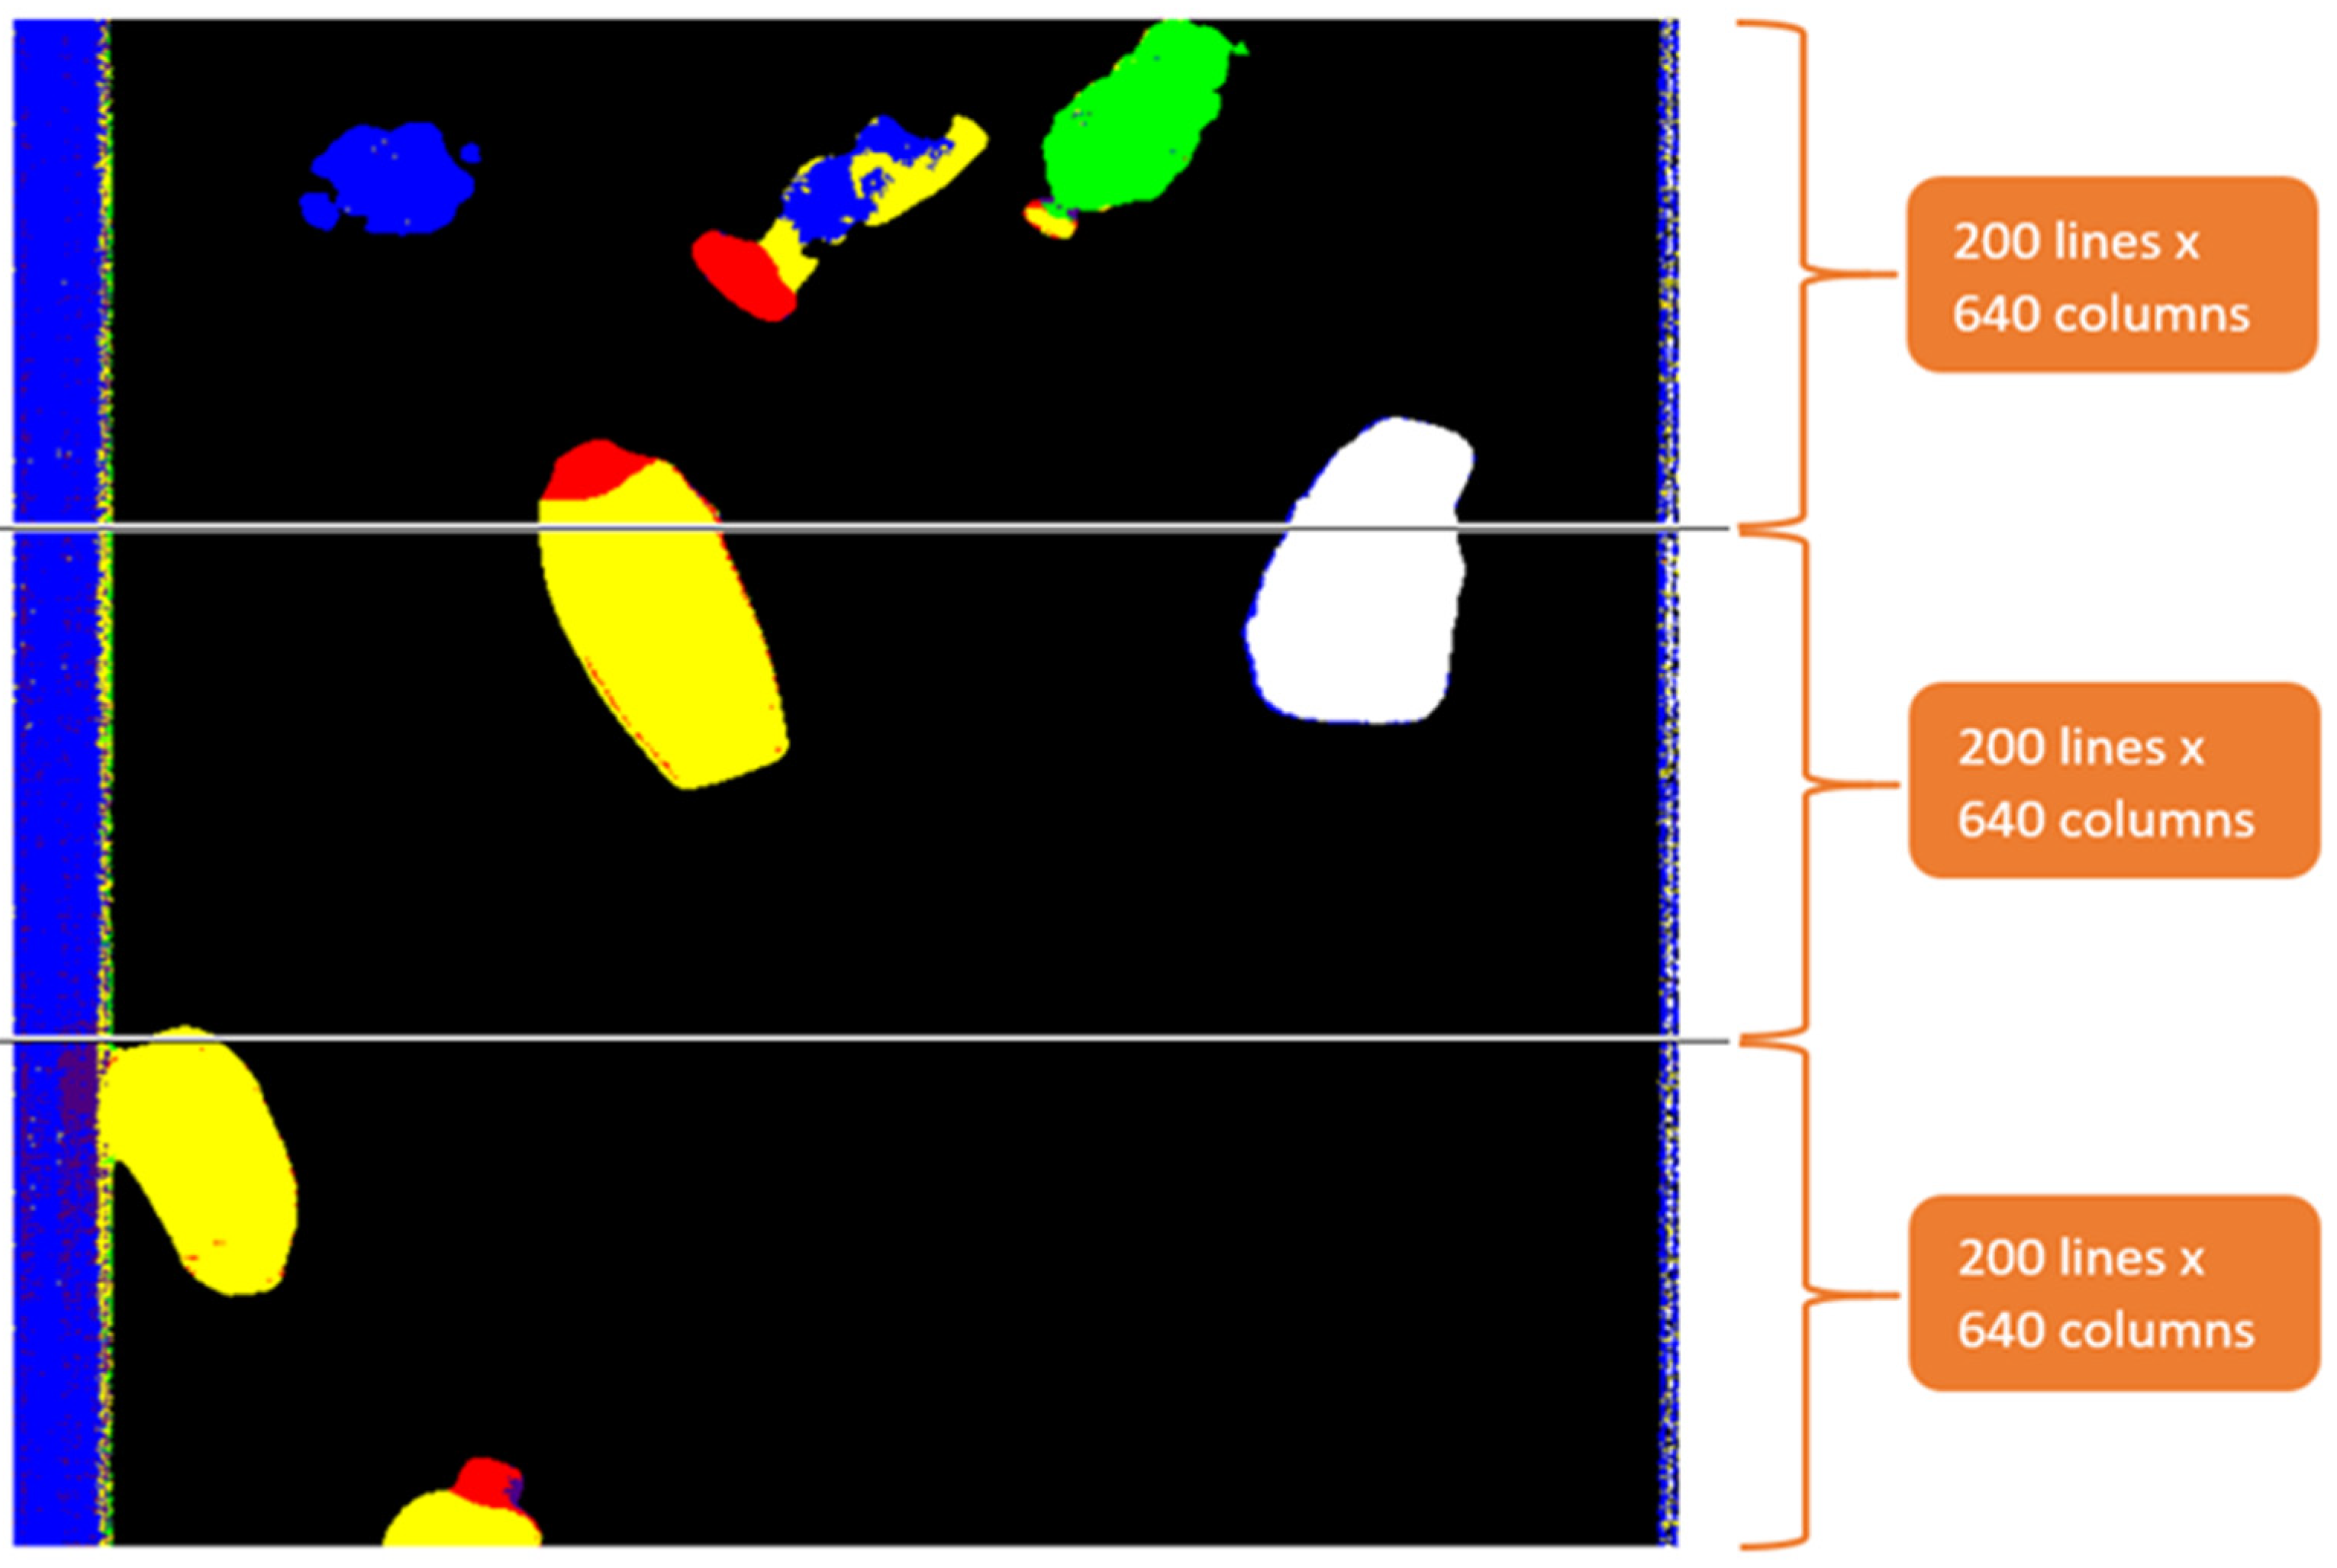
RGB/HSI alignment at runtime. As discussed already, the module processing the HSIs outputs the prediction of the material of every scanned pixel, based on the spectral information at that point. The HSI line-scans are processed in batches of 200 lines, each one consisting of 640 columns (see Figure 8). These are sent to the RGB module for registration with the RGB images that are captured repetitively at a much higher frequency (approximately 10 fps).
All HSI data received by the RGB module are dynamically stored in a queue to enable the 2D alignment with RGB images. In fact, the queue stores the HSI results in separate lines which are assigned an ID, and the expected encoder value as discussed above. When a new batch of HSI data is received, the old data are discarded, and the queue always has the newest HSI line outputs (i.e., the 1000 most recent lines of HSI results are stored in memory).
Figure 8. Visual demonstration of HSI line scanning and processing in batches of 200 lines. The colour map is explained in Figure 9.
Recycling 10 00179 g008
Figure 9. The HSI colour map for the material types considered.
Recycling 10 00179 g009
In parallel to the information provided above, a Mask R-CNN model trained on waste images is used to process the RGB images, which provides the mask of every identified object (i.e., the region covered by the object) and its material characterisation as the output. To align the HSI and RGB images, each time a new RGB image is captured, it is matched against the queue of previously stored HSI lines. Specifically, the central horizontal line of the RGB image is aligned with the closest corresponding line in the HSI queue. This first level of alignment is performed to compensate for the distance between the two cameras. After cropping the HSI area of interest, the homography alignment is implemented in order to make the two images match in size, enabling pixel correspondence between them.
Integrated decision making. Following the registration of the HSI and RGB images summarised in the previous paragraphs, waste object classification is improved by integrating the RGB and HSI outputs. To this end, it is necessary to use the boundaries of the objects which have been specified by the RGB image processing module. Then, a number of features extracted are consider separately for each object, by the outputs of the individual RGB and HSI classifiers, which are combined by using Support Vector Machines (SVMs) to provide a final integrated decision about the material type of objects.
More specifically, the features considered by the SVN are summarised in Table 7. These include the Mask R-CNN inferred masks of the objects, together with the class and confidence score. The former is used to segment the corresponding area in the HSI output image and concentrate the rest of the processing in this area. The total number P_Total of pixels assigned to an object in the RGB domain and the total number of non-background pixels P_nonB_HSI identified in the infrared domain are used as measures that can implicitly indicate the confidence of the HSI modality. Then, for each material type, the relevant number of pixels within this area is calculated, and these percentages are provided as input to the SVM. Finally, the manually provided feature Cross_Check_Class serves as the ground truth for assessing the SVM output. This is used both for the training of the model and for testing its performance against previously unseen objects. The procedure followed for training the SVM is influenced by the characteristics of the application domain and is summarised in Section 2.3.

5. Conclusions

This study highlights how integrating hyperspectral and RGB imaging can yield more robust material classification results in automated waste sorting. The proposed methodology aims to exploit the distinct advantages of each modality independently. Subsequently, their outputs are fused to create a unified classification system that compensates for the limitations of each individual approach, thereby improving overall accuracy and robustness. The validation activities conducted confirmed that the combined approach achieves higher rates of accuracy than single modalities alone, including for challenging materials such as dark plastics, which are difficult to classify individually. These findings underline the practical value of multi-modal imaging for improving classification rates and sequent sorting efficiency, aligning with continuous advancements in recycling technologies. However, significant room for improvement remains; real-time alignment and processing is characterised by computational cost, and further validation will be needed to expand this application across broader material categories, varying contamination levels, and larger-scale industrial deployments.
Future work should therefore focus on extending both trial activities and database enhancement to more diverse waste streams with different compositions and characteristics, as well as exploring optimisations to reduce processing requirements. Beyond its waste recycling purpose, the proposed HSI+RGB joint object classification system also demonstrates future potential for use in other sectors, including textile recycling, agriculture, and food production, where efficient material classification is a current need.

Author Contributions

Conceptualization, M.M. and L.R.-T.; Methodology, G.A. and M.P.; Software, G.A.; Validation, G.A., M.M., M.P. and L.R.-T.; Formal analysis, G.A. and M.P.; Investigation, M.M. and L.R.-T.; Resources, G.A., M.M. and L.R.-T.; Data curation, G.A. and M.P.; Writing—original draft preparation, M.M. and M.P.; writing—review and editing, M.M. and L.R.-T.; visualization, G.A. and M.P.; supervision, M.M. and L.R.-T.; project administration, M.M.; funding acquisition, M.M. All authors have read and agreed to the published version of the manuscript.

Funding

This work was funded by the European Union’s “Horizon Europe” Research and Innovation Programme through the project RECLAIM: GA-101070524.

Data Availability Statement

The data presented in this study are available on request from the corresponding author due to IRIS’ Intellectual Property policies. Access can be granted with the permission of IRIS Technology Solutions S.L.; approved recipients will receive access for non-commercial research use and may not redistribute the files.

Conflicts of Interest

Marina Pellegrino and Laura Rodriguez-Turienzo are employees in Company IRIS Technology Solutions S.L., Ctra. d’Esplugues, 39-41, 08940 Cornellà de Llobregat, Barcelona (Spain). The remaining authors have no conflicts of interest to declare.

References

  1. Arbeláez-Estrada, J.C.; Vallejo, P.; Aguilar, J.; Tabares-Betancur, M.S.; Ríos-Zapata, D.; Ruiz-Arenas, S.; Rendón-Vélez, E. A Systematic Literature Review of Waste Identification in Automatic Separation Systems. Recycling 2023, 8, 86. [Google Scholar] [CrossRef]
  2. Kiyokawa, T.; Takamatsu, J.; Koyanaka, S. Challenges for Future Robotic Sorters of Mixed Industrial Waste: A Survey. IEEE Trans. Autom. Sci. Eng. 2024, 21, 1023–1040. [Google Scholar] [CrossRef]
  3. Gadaleta, G.; De Gisi, S.; Todaro, F.; D’Alessandro, G.; Binetti, S.; Notarnicola, M. Assessing the Sorting Efficiency of Plastic Packaging Waste in an Italian Material Recovery Facility: Current and Upgraded Configuration. Recycling 2023, 8, 25. [Google Scholar] [CrossRef]
  4. Packaging Waste Statistics—Statistics Explained—Eurostat. Available online: https://ec.europa.eu/eurostat/statistics-explained/index.php?title=Packaging_waste_statistics#Data_sources (accessed on 26 August 2025).
  5. Amigo, J.M.; Grassi, S. Configuration of Hyperspectral and Multispectral Imaging Systems. Data Handl. Sci. Technol. 2019, 32, 17–34. [Google Scholar] [CrossRef]
  6. Zheng, Y.; Bai, J.; Xu, J.; Li, X.; Zhang, Y. A Discrimination Model in Waste Plastics Sorting Using NIR Hyperspectral Imaging System. Waste Manag. 2018, 72, 87–98. [Google Scholar] [CrossRef]
  7. Tamin, O.; Gubin Moung, E.; Dargham, J.A.; Yahya, F.; Omatu, S.; Moung, E.G. A Review of Hyperspectral Imaging-Based Plastic Waste Detection State-of-the-Arts. Int. J. Electr. Comput. Eng. (IJECE) 2023, 13, 3407–3419. [Google Scholar] [CrossRef]
  8. Jiang, Z.; Yu, Z.; Yu, Y.; Huang, Z.; Ren, Q.; Li, C. Spatial Resolution Enhancement for Pushbroom-Based Microscopic Hyperspectral Imaging. Appl. Opt. 2019, 58, 850. [Google Scholar] [CrossRef]
  9. Krasniewski, J.; Dabała, Ł.; Lewandowski, M. Hyperspectral Imaging for Analysis and Classification of Plastic Waste. In Proceedings of the 25th International Conference on Pattern Recognition, Milan, Italy, 10–15 January 2020; pp. 4805–4812. [Google Scholar] [CrossRef]
  10. Shennib, F.; Schmitt, K. Data-Driven Technologies and Artificial Intelligence in Circular Economy and Waste Management Systems: A Review. In Proceedings of the IEEE International Symposium on Technology and Society (ISTAS), Ontario, CA, USA, 28–31 October 2021. [Google Scholar] [CrossRef]
  11. Lu, W.; Chen, J. Computer Vision for Solid Waste Sorting: A Critical Review of Academic Research. Waste Manag. 2022, 142, 29–43. [Google Scholar] [CrossRef]
  12. Wu, T.W.; Zhang, H.; Peng, W.; Lü, F.; He, P.J. Applications of Convolutional Neural Networks for Intelligent Waste Identification and Recycling: A Review. Resour. Conserv. Recycl. 2023, 190, 106813. [Google Scholar] [CrossRef]
  13. Koskinopoulou, M.; Raptopoulos, F.; Papadopoulos, G.; Mavrakis, N.; Maniadakis, M. Robotic Waste Sorting Technology: Toward a Vision-Based Categorization System for the Industrial Robotic Separation of Recyclable Waste. IEEE Robot. Autom. Mag. 2021, 28, 50–60. [Google Scholar] [CrossRef]
  14. Bashkirova, D.; Abdelfattah, M.; Zhu, Z.; Akl, J.; Alladkani, F.; Hu, P.; Ablavsky, V.; Calli, B.; Bargal, S.A.; Saenko, K. ZeroWaste Dataset: Towards Deformable Object Segmentation in Cluttered Scenes. In Proceedings of the IEEE Computer Society Conference on Computer Vision and Pattern Recognition, New Orleans, LA, USA, 18–24 June 2022; p. 21115. [Google Scholar] [CrossRef]
  15. Luo, Y. Research on Sorting System of Industrial Robot Based on Machine Vision. In Proceedings of the 2024 International Conference on Power, Electrical Engineering, Electronics and Control (PEEEC), Athens, Greece, 14–16 August 2024; pp. 270–274. [Google Scholar] [CrossRef]
  16. Tsagarakis, N.; Maniadakis, M. On the Generation and Assessment of Synthetic Waste Images. In Proceedings of the 2024 IEEE Conference on Artificial Intelligence, Singapore, 25–27 June 2024; pp. 1011–1016. [Google Scholar] [CrossRef]
  17. AI-Powered Waste Sorting Solutions. Available online: https://ampsortation.com/ (accessed on 2 July 2025).
  18. Robenso. Available online: https://www.robenso.gr/ (accessed on 2 July 2025).
  19. SamurAI® Series—Sorting Robots—Machinex. Available online: https://www.machinexrecycling.com/sorting/equipment/samurai-sorting-robot/ (accessed on 2 July 2025).
  20. Recycleye QualiBot®—Recycleye. Available online: https://recycleye.com/robotics-3/ (accessed on 2 July 2025).
  21. Fast Picker|ZenRobotics. Available online: https://www.terex.com/zenrobotics/robots/fast-picker (accessed on 2 July 2025).
  22. Ghamisi, P.; Plaza, J.; Chen, Y.; Li, J.; Plaza, A.J. Advanced Spectral Classifiers for Hyperspectral Images: A Review. IEEE Geosci. Remote Sens. Mag. 2017, 5, 8–32. [Google Scholar] [CrossRef]
  23. Xu, Y.; Mao, Y.; Li, H.; Shen, J.; Xu, X.; Wang, S.; Zaman, S.; Ding, Z.; Wang, Y. A Deep Learning Model Based on RGB and Hyperspectral Images for Efficiently Detecting Tea Green Leafhopper Damage Symptoms. Smart Agric. Technol. 2025, 10, 100817. [Google Scholar] [CrossRef]
  24. Zhan, Y.; Wang, Y.; Yu, X. Semisupervised Hyperspectral Image Classification Based on Generative Adversarial Networks and Spectral Angle Distance. Sci. Rep. 2023, 13, 22019. [Google Scholar] [CrossRef]
  25. Mesa, A.R.; Chiang, J.Y. Multi-Input Deep Learning Model with Rgb and Hyperspectral Imaging for Banana Grading. Agriculture 2021, 11, 687. [Google Scholar] [CrossRef]
  26. Zheng, L.; Zhao, M.; Zhu, J.; Huang, L.; Zhao, J.; Liang, D.; Zhang, D. Fusion of Hyperspectral Imaging (HSI) and RGB for Identification of Soybean Kernel Damages Using ShuffleNet with Convolutional Optimization and Cross Stage Partial Architecture. Front. Plant Sci. 2023, 13, 1098864. [Google Scholar] [CrossRef]
  27. Neo, E.R.K.; Low, J.S.C.; Goodship, V.; Debattista, K. Deep Learning for Chemometric Analysis of Plastic Spectral Data from Infrared and Raman Databases. Resour. Conserv. Recycl. 2023, 188, 106718. [Google Scholar] [CrossRef]
  28. Bonifazi, G.; Fiore, L.; Gasbarrone, R.; Hennebert, P.; Serranti, S. Detection of Brominated Plastics from E-Waste by Short-Wave Infrared Spectroscopy. Recycling 2021, 6, 54. [Google Scholar] [CrossRef]
  29. Castro-Díaz, M.; Osmani, M.; Cavalaro, S.; Cacho, Í.; Uria, I.; Needham, P.; Thompson, J.; Parker, B.; Lovato, T. Hyperspectral Imaging Sorting of Refurbishment Plasterboard Waste. Appl. Sci. 2023, 13, 2413. [Google Scholar] [CrossRef]
  30. He, K.; Gkioxari, G.; Dollár, P.; Girshick, R. Mask R-CNN. IEEE Trans. Pattern Anal. Mach. Intell. 2020, 42, 386–397. [Google Scholar] [CrossRef] [PubMed]
  31. Kounalakis, N.; Alexakis, G.; Raptopoulos, F.; Maniadakis, M. Cost-Effective Robotic Recycling Workers: From Lab Experiments to Real-World Deployment. In Proceedings of the International Conference on Agents and Artificial Intelligence, ICAART, Porto, Portugal, 23–25 February 2025. [Google Scholar]
  32. Singh, M.K.; Hait, S.; Thakur, A. Hyperspectral Imaging-Based Classification of Post-Consumer Thermoplastics for Plastics Recycling Using Artificial Neural Network. Process Saf. Environ. Prot. 2023, 179, 593–602. [Google Scholar] [CrossRef]
  33. Lubongo, C.; Bin Daej, M.A.A.; Alexandridis, P. Recent Developments in Technology for Sorting Plastic for Recycling: The Emergence of Artificial Intelligence and the Rise of the Robots. Recycling 2024, 9, 59. [Google Scholar] [CrossRef]
  34. Araujo-Andrade, C.; Bugnicourt, E.; Philippet, L.; Rodriguez-Turienzo, L.; Nettleton, D.; Hoffmann, L.; Schlummer, M. Review on the Photonic Techniques Suitable for Automatic Monitoring of the Composition of Multi-Materials Wastes in View of Their Posterior Recycling. Waste Manag. Res. 2021, 39, 631. [Google Scholar] [CrossRef] [PubMed]
  35. Taneepanichskul, N.; Hailes, H.C.; Miodownik, M.; Taneepanichskul, N.; Hailes, H.C.; Miodownik, M. Using Hyperspectral Imaging and Machine Learning to Identify Food Contaminated Compostable and Recyclable Plastics. UCL Open Env. 2025, 7, 3237. [Google Scholar] [CrossRef]
  36. Bonifazi, G.; Capobianco, G.; Serranti, S. A Hierarchical Classification Approach for Recognition of Low-Density (LDPE) and High-Density Polyethylene (HDPE) in Mixed Plastic Waste Based on Short-Wave Infrared (SWIR) Hyperspectral Imaging. Spectrochim. Acta A Mol. Biomol. Spectrosc. 2018, 198, 115–122. [Google Scholar] [CrossRef]
  37. Bonifazi, G.; Capobianco, G.; Serranti, S. Hyperspectral Imaging and Hierarchical PLS-DA Applied to Asbestos Recognition in Construction and Demolition Waste. App. Sci. 2019, 9, 4587. [Google Scholar] [CrossRef]
  38. Bonifazi, G.; Fiore, L.; Gasbarrone, R.; Palmieri, R.; Serranti, S. Hyperspectral Imaging Applied to WEEE Plastic Recycling: A Methodological Approach. Sustainability 2023, 15, 11345. [Google Scholar] [CrossRef]
  39. Mazanov, G.; Iliushina, A.; Nesteruk, S.; Pimenov, A.; Stepanov, A.; Mikhaylova, N.; Somov, A. Hyperspectral Data Driven Solid Waste Classification. IEEE Access 2025, 13, 3551097. [Google Scholar] [CrossRef]
  40. Bolya, D.; Zhou, C.; Xiao, F.; Lee, Y.J. YOLACT++ Better Real-Time Instance Segmentation. IEEE Trans. Pattern Anal. Mach. Intell. 2022, 44, 1108–1121. [Google Scholar] [CrossRef] [PubMed]
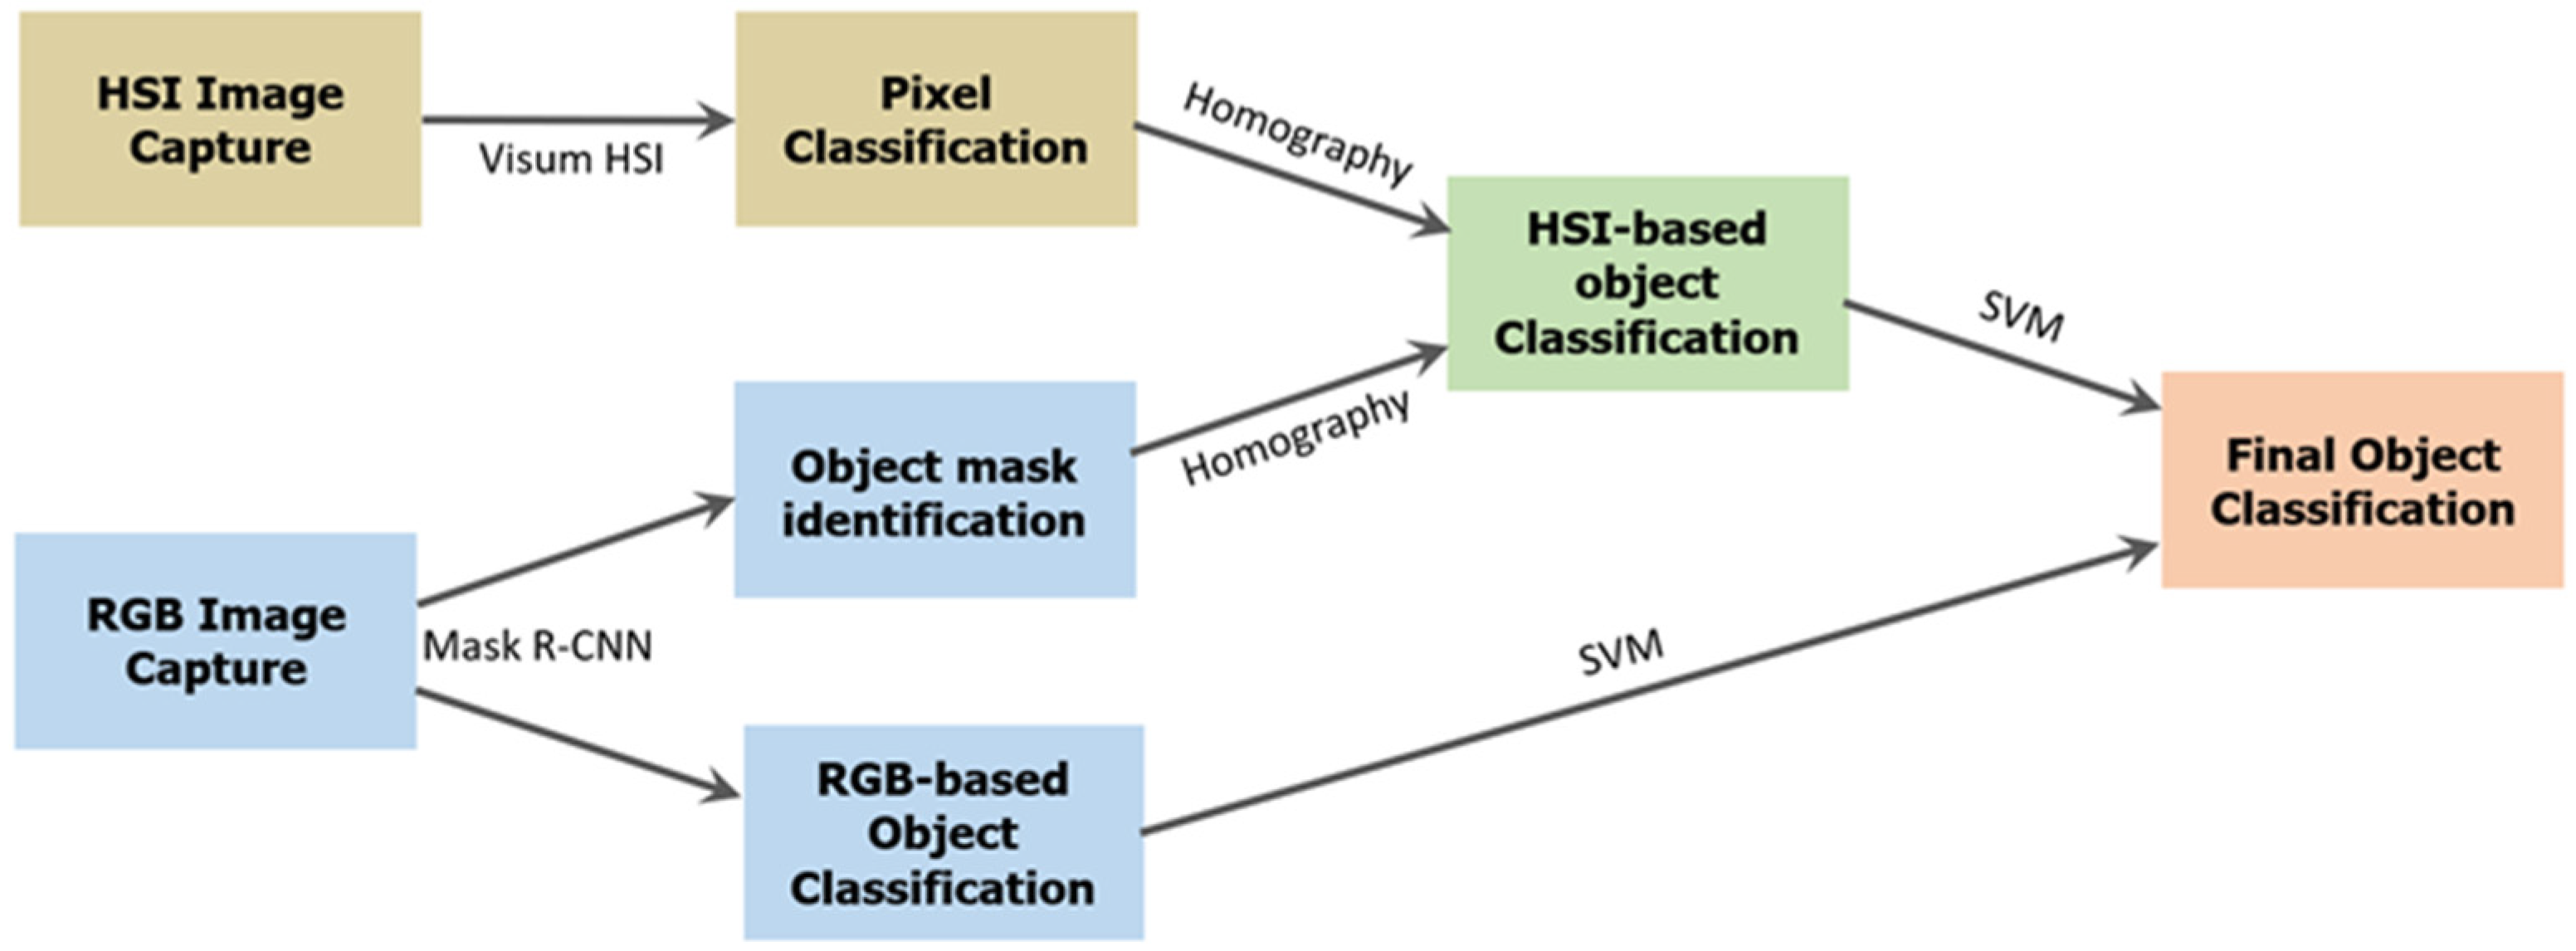
Figure 1. Overview of the workflow presented in this study, integrating HSI and RGB technologies to enhance waste classification.
Recycling 10 00179 g001
Figure 2. Validation samples and prediction results for objects that present components of different materials. Each prediction map is paired with a specific legend for class assignment.
Recycling 10 00179 g002
Figure 3. Examples of real waste samples used for classification models development.
Recycling 10 00179 g003
Figure 4. The portable robotic Material Recovery Facility (prMRF) housing the HSI and RGB waste classification modules.
Recycling 10 00179 g004
Figure 5. The architecture of the coupled HSI–RGB waste classification system.
Recycling 10 00179 g005
Figure 6. Two waste objects processed independently by (a) the HSI and (b) the RGB module.
Recycling 10 00179 g006
Figure 7. Part (a) shows ARUCO markers as captured by the HSI camera; (b) the same markers captured by the RGB camera; (c) the resulting registration after applying the homography transformation, with the HSI superimposed onto the RGB image.
Recycling 10 00179 g007
Table 1. Model performance statistical parameters derived from confusion matrix values, including precision, sensitivity (also known as recall), specificity (also known as true negative rate), false negative rate (FNR), false positive rate (FPR), and F1-score for each material class.
ClassPrecisionSensitivitySpecificityFNRFPRF1-Score
PET0.7400.9870.9500.0130.0500.846
PP0.9000.9180.9800.0820.0200.909
PE0.9200.7860.9830.2140.0170.848
PS0.9600.9800.9920.0200.0080.970
PAPER0.9500.9790.9900.0210.0100.964
ALU0.9900.8610.9980.1390.0020.921
Table 2. Object-based validation results.
ClassObject Classification
>50/70% Pixels
Object Classification
>90% Pixels
PET5/51/5
PP10/106/10
PE8/84/8
PS2/22/2
PAPER8/87/8
ALU6/66/6
Table 3. RGB-based waste classification results.
MaterialPrecisionSensitivitySpecificityFNRFPRF1-Score
PET0.940.930.9950.0640.0050.93
PP/PS0.840.870.9860.1590.0140.85
PE0.960.980.9850.0360.0150.99
PAPER0.970.960.0900.0310.0100.96
ALU0.990.990.9990.0100.0010.99
Table 4. SVM classification report.
MaterialPrecisionSensitivitySpecificityFNRFPRF1-Score
PET1.000.971.000.00.01.00
PP0.881.000.970.00.030.97
PE1.000.971.000.040.00.98
PS1.00.671.000.00.01.00
PAPER1.001.001.000.00.01.00
ALU1.001.001.000.00.01.00
Dark_PP1.000.501.000.00.00.67
Table 5. Percentage of waste samples successfully classified across three spectral domains: the visible spectrum (RGB), the infrared spectrum (HSI), and the joint visual–infrared spectrum using SVM.
Success Rate
MaterialRGBHSI (>50%)JOINT/SVM
PET92.7986.7598.99
PP89.6694.2598.85
PE97.8997.8997.89
PS0.0100.0100.0
PAPER98.1598.25100.0
ALU100.088.82100.0
Dark_PP0.00.083.33
Table 6. Materials selected for classification model calibration.
Material CLASSDescription
PETPolyethylene-terephthalate-based waste materials
PPPolypropylene-based waste materials
PEPolyethylene-based waste materials
PSPolystyrene-based waste materials
PAPERPaper and tetrapak-like waste materials
ALUAluminium waste materials
Table 7. The features extracted by image processing in the visible and infrared domain.
FeatureDescription
Mask RCNN_ClassInstance segmentation class
Mask RCNN_ConfidenceInstance segmentation score
P_TotalNumber of RGB Masks’ Pixels
P_nonB_HSINumber of HSI Masks’ Pixels
HSI_PET_PercentagePercentage of PET classified pixels in mask
HSI_PE_PercentagePercentage of PE classified pixels in mask
HSI_ALU_PercentagePercentage of ALU classified pixels in mask
HSI_PAP_PercentagePercentage of PAP classified pixels in mask
HSI_PP_PercentagePercentage of PP classified pixels in mask
HSI_PS_PercentagePercentage of PS classified pixels in mask
HSI_Background_PercentagePercentage of Background classified pixels in mask
Cross_Check_ClassGround Truth
Disclaimer/Publisher’s Note: The statements, opinions and data contained in all publications are solely those of the individual author(s) and contributor(s) and not of MDPI and/or the editor(s). MDPI and/or the editor(s) disclaim responsibility for any injury to people or property resulting from any ideas, methods, instructions or products referred to in the content.