3.2. Major Elements
Prior to proceeding with the correct valorization diagnosis, it is necessary to determine the major elements (concentrations > 0.1% in general) that characterize the waste (
Table 6). Roasted pyrite ashes are mainly composed of iron (Fe = 46.4 ± 0.6% average). These iron values are similar for each type of mine (28–58%), and are generally one order of magnitude higher than those of soils (around 4.0%) [
29]. This waste, as expected, presented a low content of S in relation to pyrite (1.23 ± 0.03% on average with low variability when in pyrite around 50%), although exceeding typical S soil values (0.02%) by 2 orders of magnitude [
30].
For the rest of the elements, there were more discrepancies depending on the mines of origin. The average concentrations of Al (0.59%), K (0.18%) and Na (0.09%) were lower than the expected soil concentrations in the IPB (8.72% for Al, 1.95% for K, and 0.87% for Na), especially those of the Zarza-Perrunal residue for Al and K. On the other hand, Mg (0.14% on average) and Ti (0.17% on average) concentrations corresponded to the soil (0.26% and 0.24%, respectively) for the Sotiel Coronada wastes, but were lower for the rest [
29].
Moreover, for heavy metals/metalloids such as Cu, Pb, Zn, and As, the values obtained for most of the wastes exceeded the values for unperturbed soil by 1-to-3 orders of magnitude (5.9∙10
−3% Cu; 6.3∙10
−3% Pb; 8.3∙10
−3% Zn; 4.2∙10
−3% As [
29]). Zarza-Perrunal and San Telmo wastes presented the lowest concentrations of these elements, while Sotiel Coronada waste showed the highest concentrations. It is necessary to emphasize the extremely high concentration of Pb obtained in the Lagunazo sample (LA1) (2.1%). Consequently, these wastes have high toxicological implications for the environment [
31], but they could be valorized by extracting the Pb content. Similarly, high sulfur levels imply acidity in the area and a possible impact from AMD.
All these major element concentrations are consistent with those of previous studies on roasted ashes located in the Iberian Pyrite Belt. Yesares and collaborators (2023) obtained the following concentrations: Fe 37–50%, S < 5%, Al < 4%, and K < 2%. Moreover, the concentrations of the toxic metals Pb and As are in the range of 0.5–2% [
2]. Another study carried out by Oliveira in 2012 on these wastes in Santa Catarina, Brazil, reports that, although there is consistency in elements such as Fe (around 51%) and S (around 1%), there are no such high concentrations for toxic elements, proving to be a problem in IPB [
32].
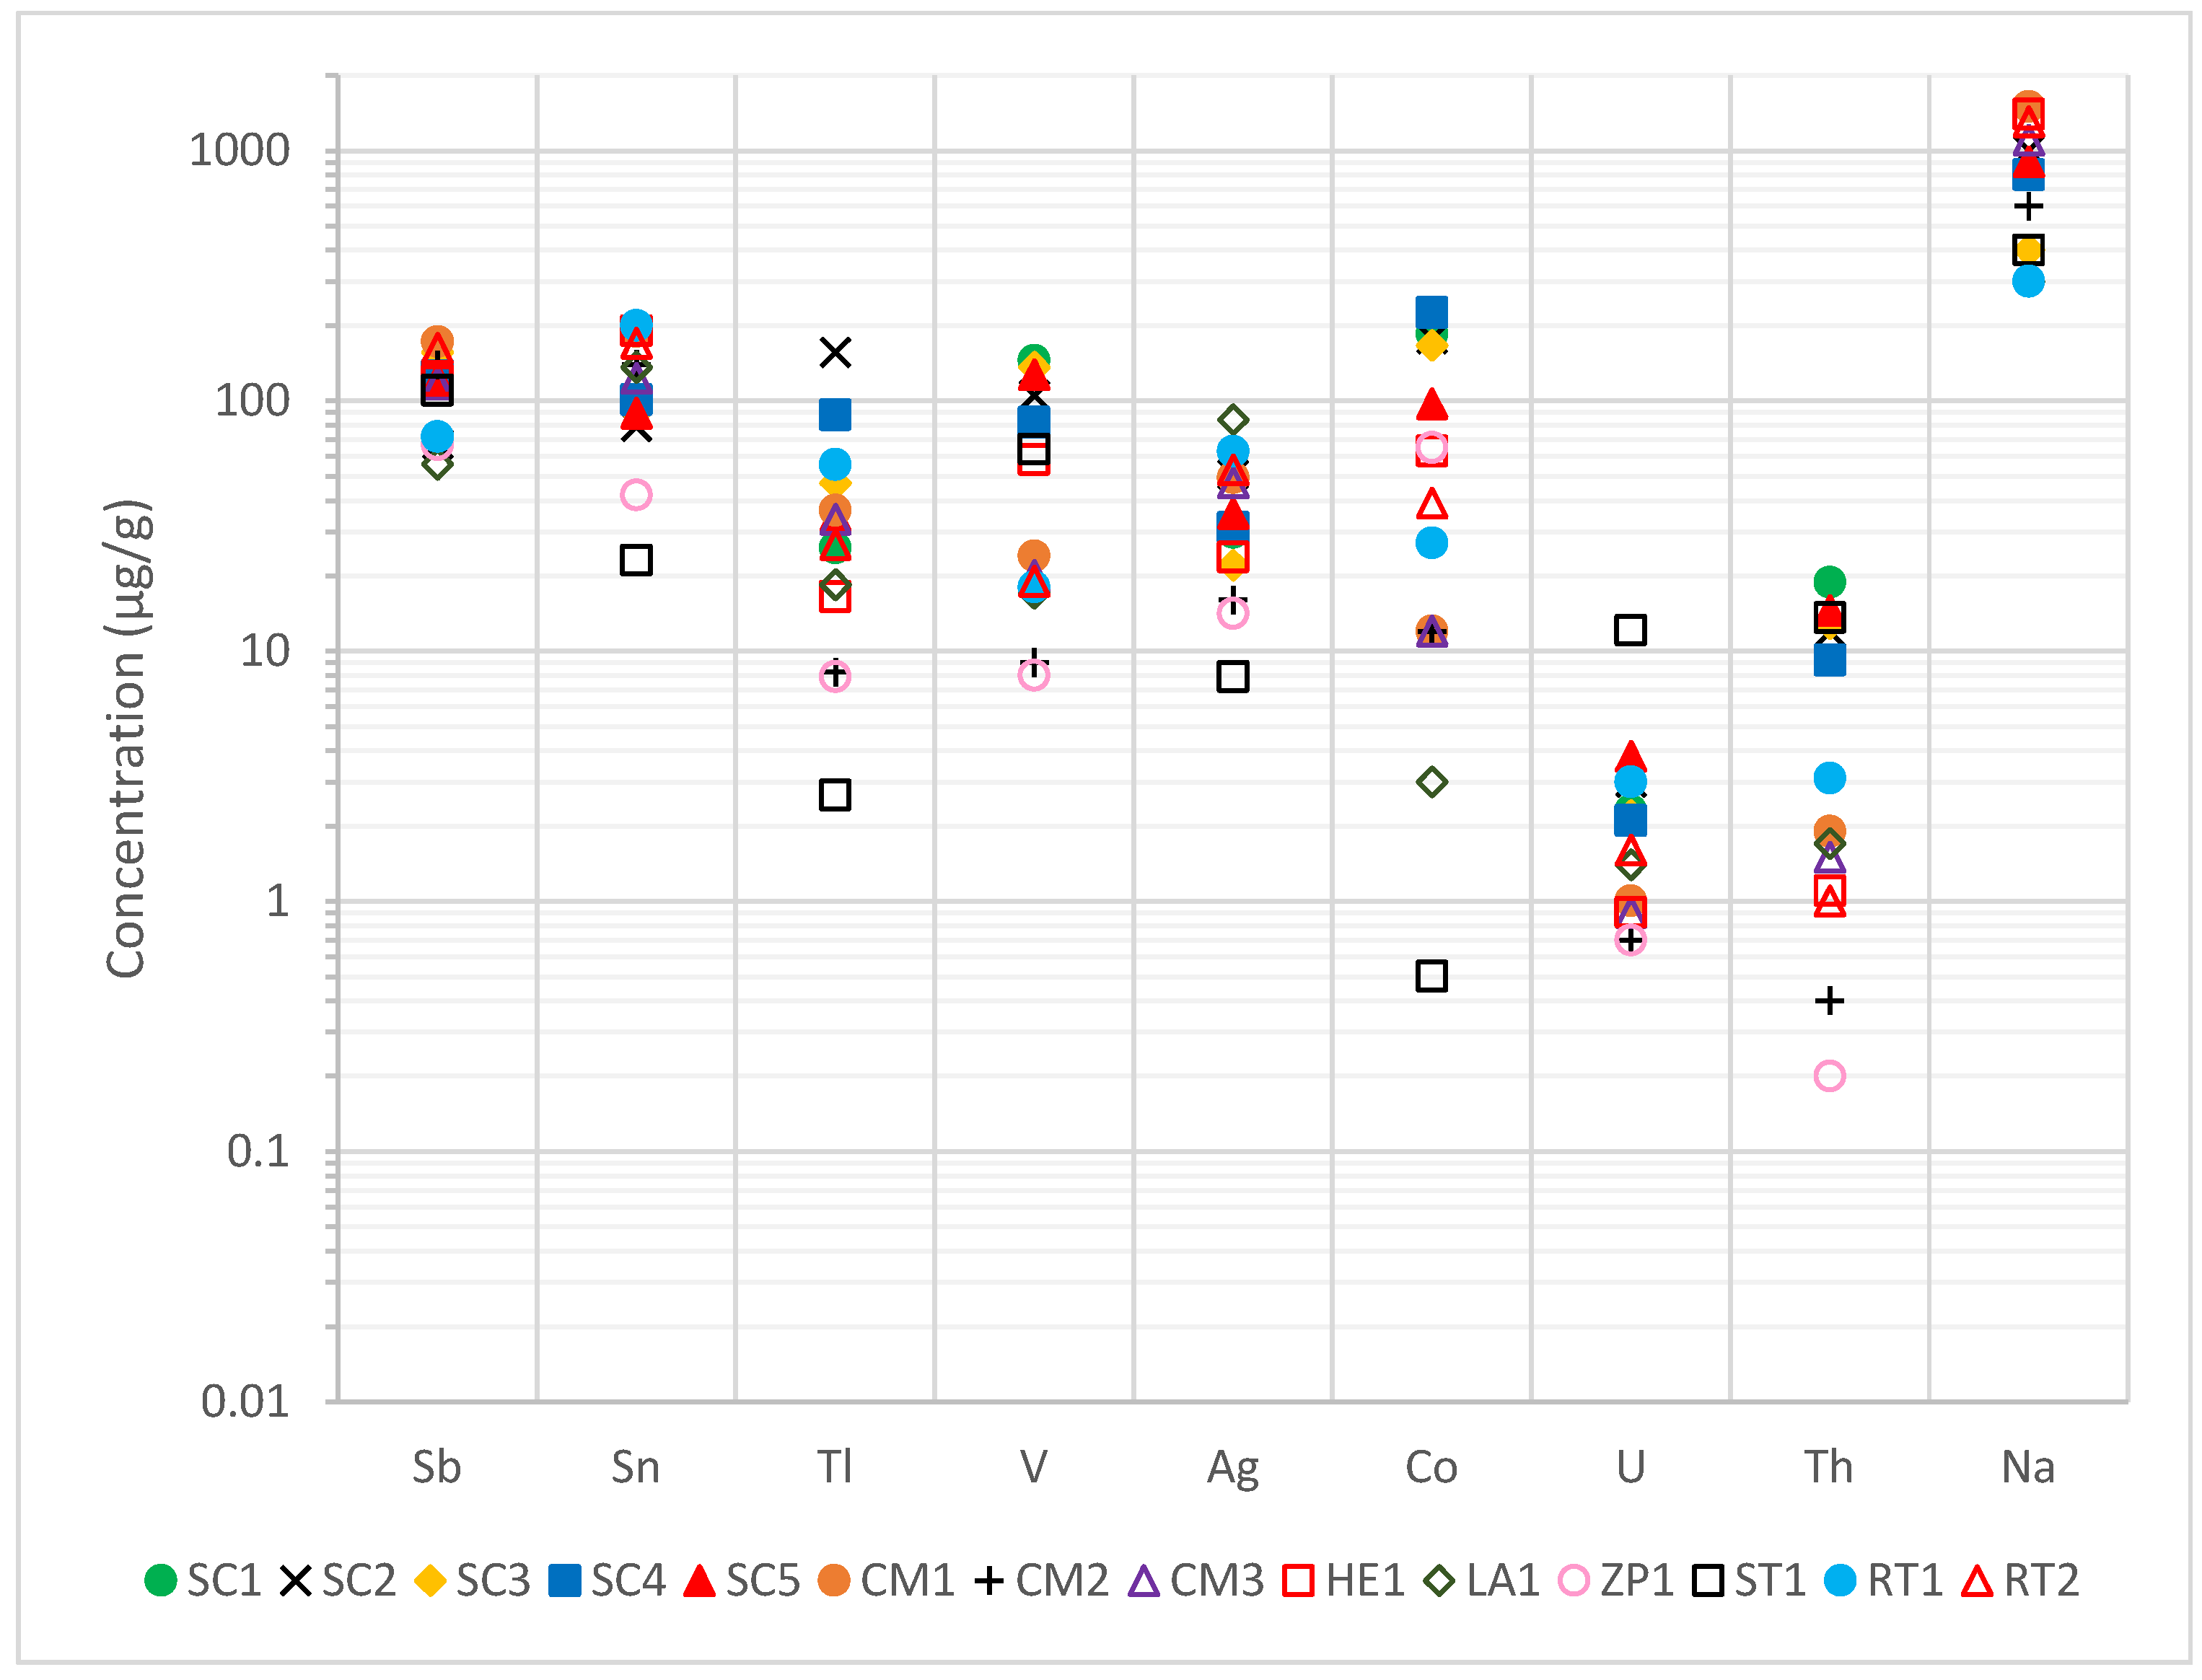
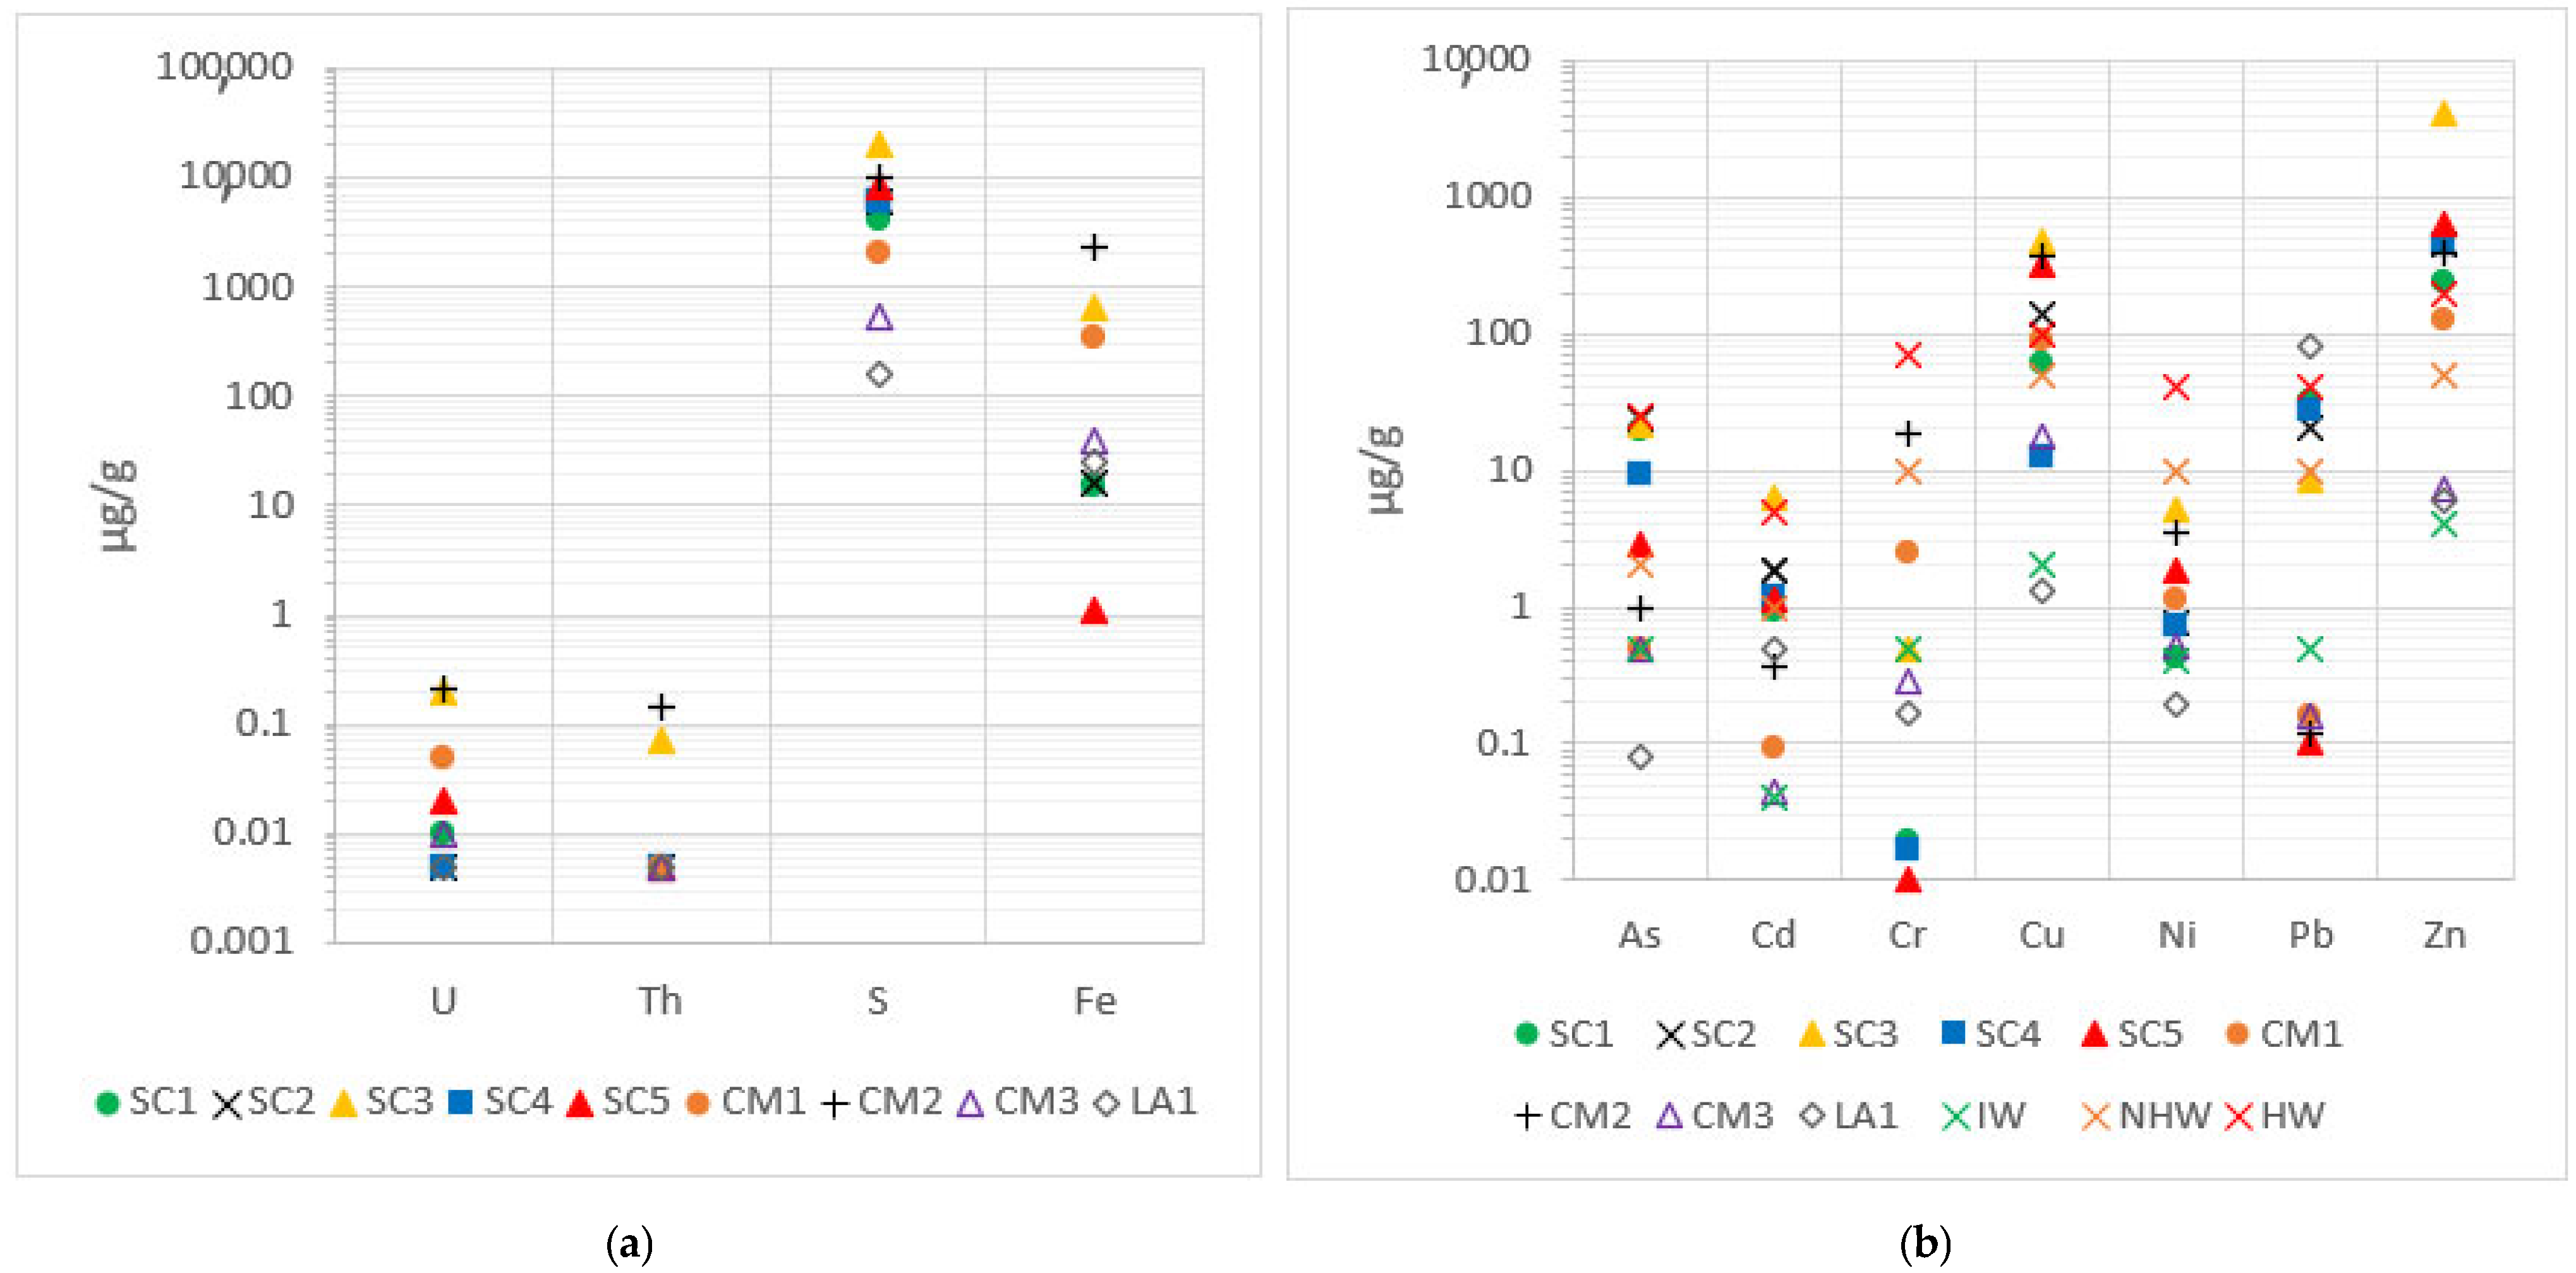
3.3. Trace Elements
The concentrations of trace elements (<0.1% = 1000 µg/g) are presented in
Figure 3, which were measured by ICP-MS/OES. For the natural radioelements (U and Th), the obtained results resemble those expected for typical soils (2.7 µg/g for U and 10.5 µg/g for Th, respectively), with even lower values in some cases [
26]. It is worth mentioning the San Telmo waste, ST1, where the uranium concentration stood out for its high value (12.1 µg/g) compared with the other wastes, which was one order of magnitude higher.
The obtained Sb values exceeded the expected value for soils in the IPB of 6.32 µg/g by one order of magnitude. The obtained concentrations were in the range between 55.8 µg/g and 172 µg/g. There is a potential contamination problem due to this element, which would need to be studied for feasibility of extraction and recovery [
33]. Furthermore, thallium concentrations exceeded, on average (40 µg/g), by two orders of magnitude the typical value in this area (0.7 µg/g) [
29]. Tl is a heavy metal with extreme biotoxicity, being even more dangerous for living organisms than As, Cd, or Pb, producing high contamination in the environment [
34].
On the other hand, V and Co concentrations were similar to those expected for soils (68 µg/g and 19 µg/g, respectively), although concentrations were slightly higher in the latter. It is necessary to note the case of the Sotiel Coronada wastes, where vanadium concentrations were higher than the rest and cobalt concentrations were one order of magnitude higher than expected for the other mines. It should also be noted that, in general, all wastes exceeded the soil Sn concentration of 1.87 µg/g by two orders of magnitude, with a mean value of 120 µg/g [
29].
The average silver concentration of 37.6 µg/g, being two orders of magnitude above typical soil, raises significant implications from an economic point of view. Depending on the volume of waste and processing costs, there is an opportunity for extraction and valorization. Moreover, this result considers the historical past of most of the mines, where the main extraction was silver in that area in ancient times [
35].
It is necessary to point out that differences in concentrations between mines may be due to the presence of host minerals in the deposit, such as ilmenites (for V) or monazites (for Th), also due to different roasting conditions between mines or interactions with the environment. As the raw materials have different properties at each mine, the roasted pyrites will also have different concentrations. In addition, the mining process has undergone changes over time (one century), thus the methods have been refined, and it is possible that, in the processing, certain differences may be detected in each waste. Lastly, the results are similar to those obtained in the Yesares and Oliveira studies mentioned above [
2,
32].
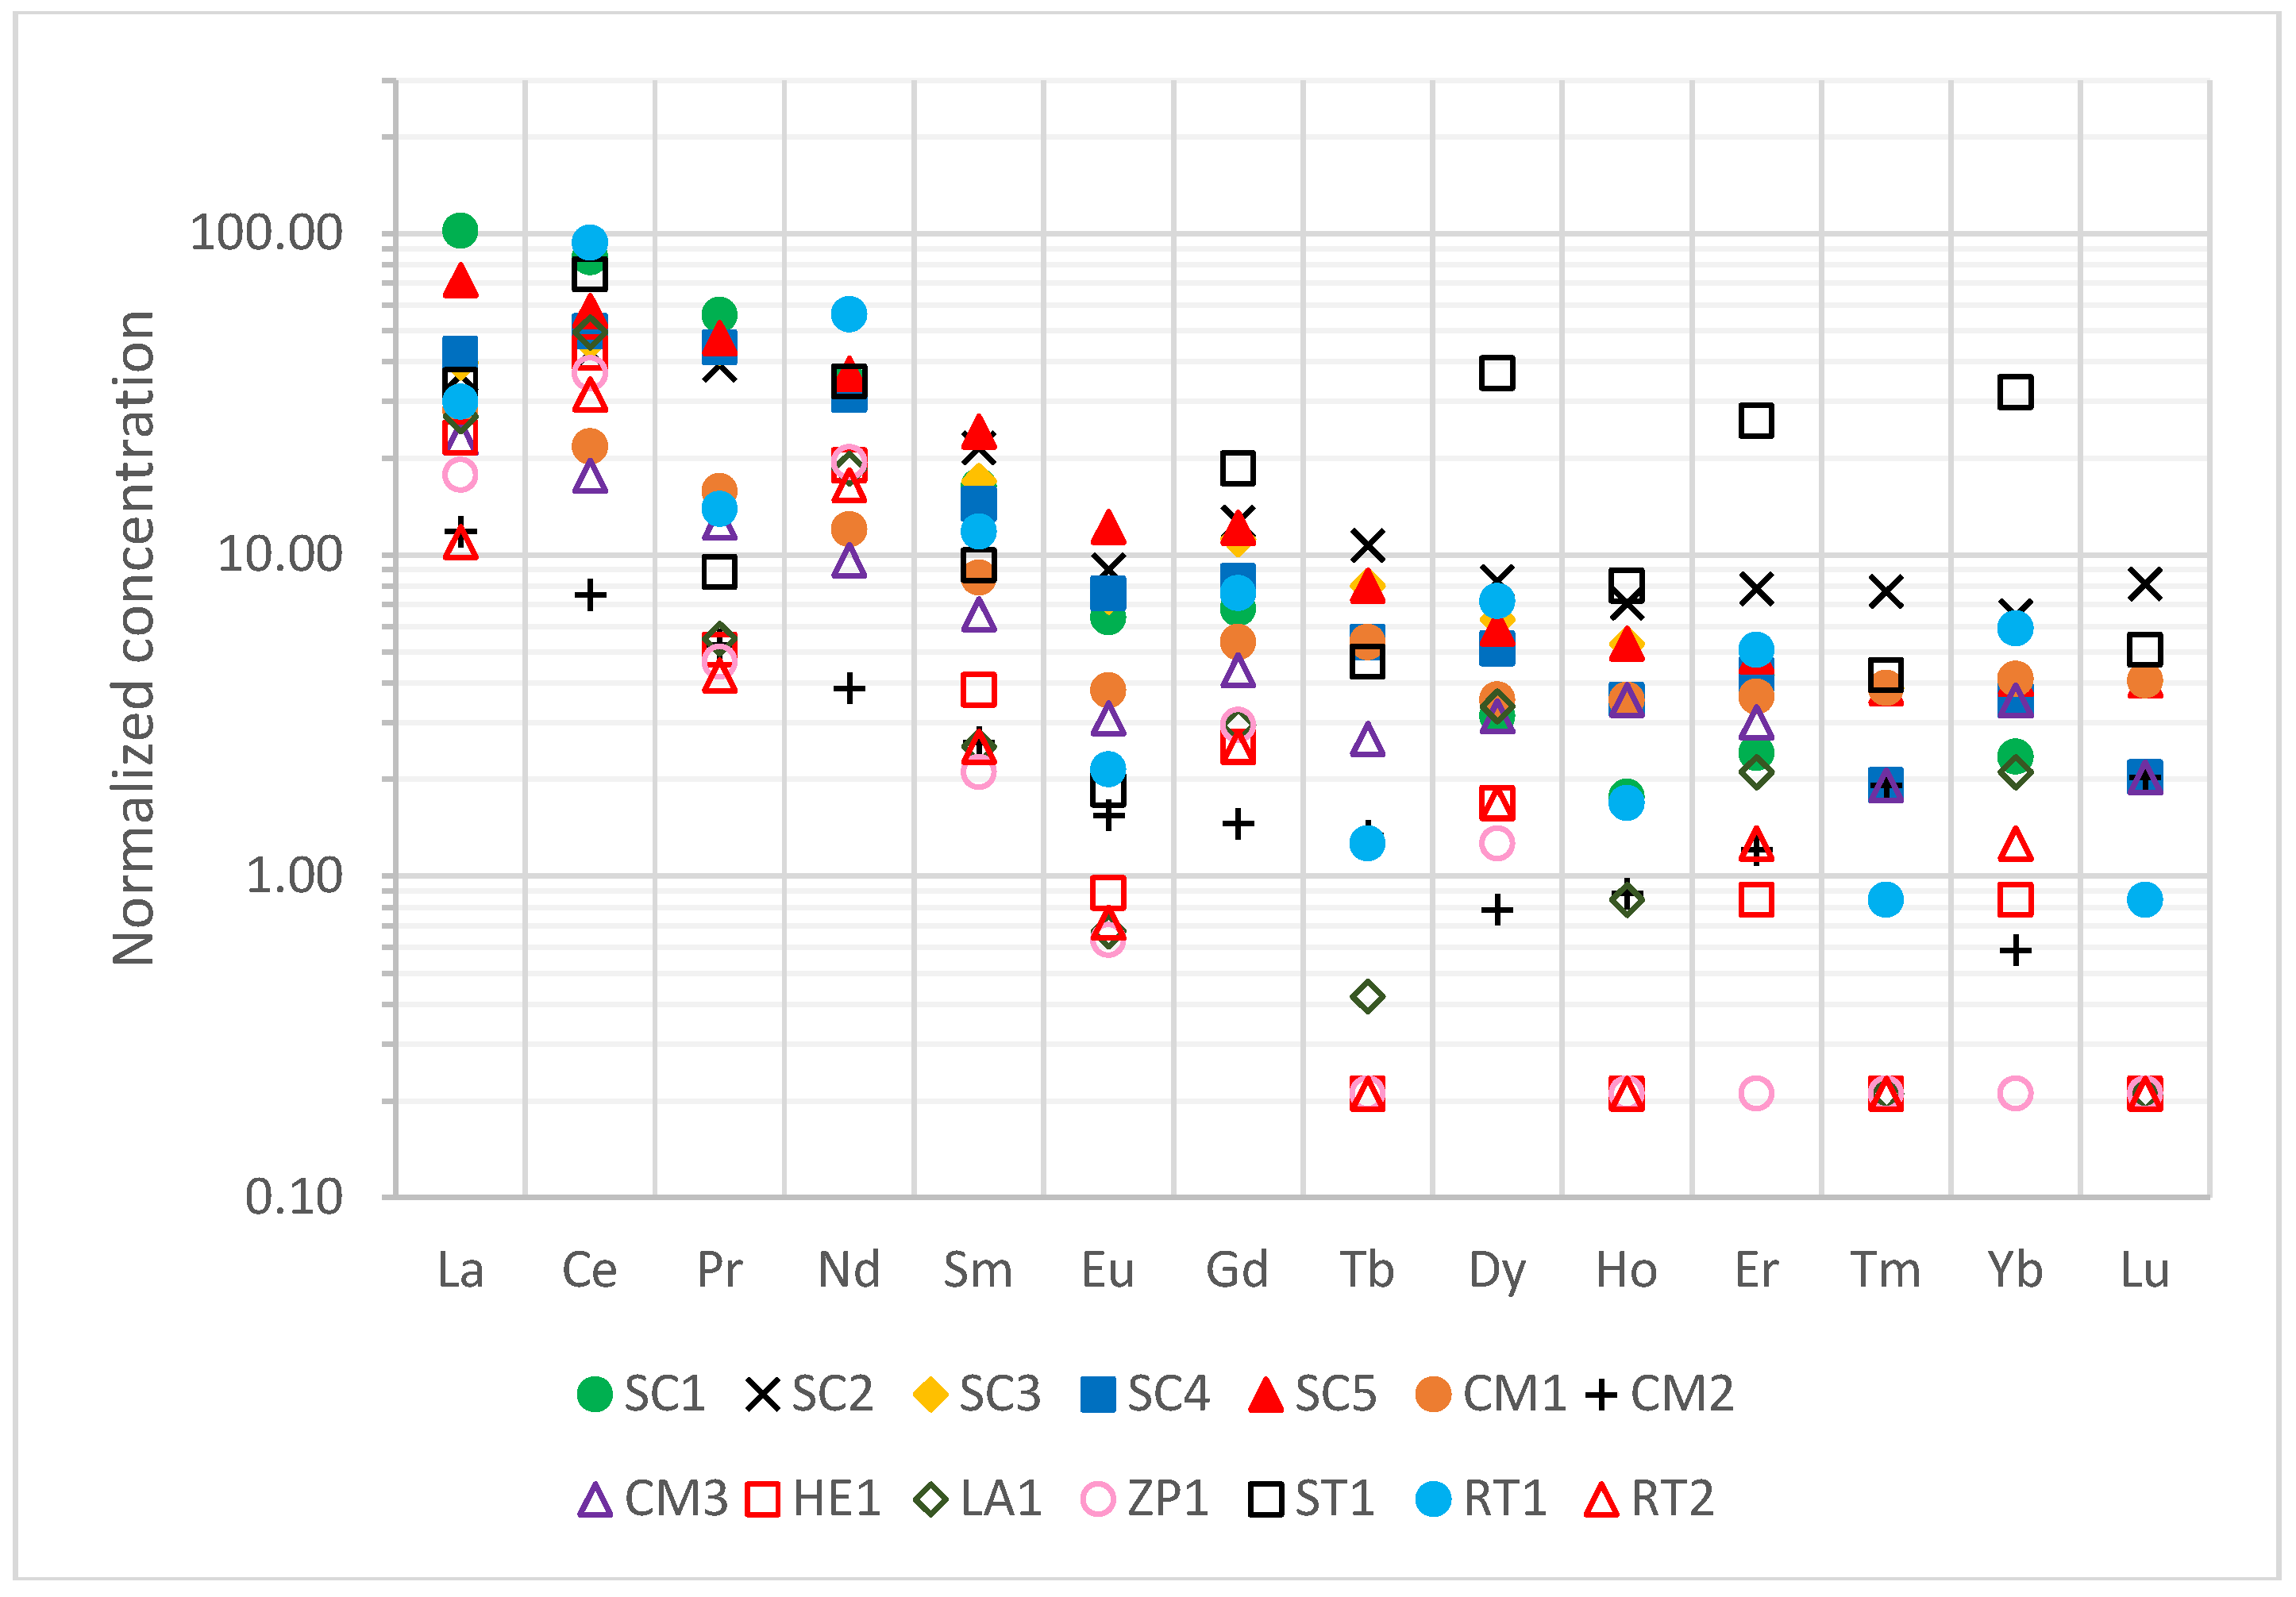
3.4. Rare Earth Elements
Another main feature to be studied are rare earth elements (REEs). These elements usually have concentrations of several orders of magnitude in relation to each other depending on the mineral. Therefore, a standardization to chondrite abundance was established in order to better study and understand these elements. Chondrite is a very old mineral that resembles the Earth’s crust at the beginning of its formation. The Earth’s crust is highly weathered and the elements concentrations are very dependent on each geographical area, thus chondrite is the reference sample of choice in many REE studies. The REE chondrite normalization values are shown in
Table 7 [
36]:
Normalized values are shown in
Figure 4. There was a high variability of results depending on the type of REE and the mine of origin. Light REEs (LREEs; La, Ce, Pr, Nd, and Sm) had concentrations 1–2 orders of magnitude higher than chondrite, with the highest average values being found at the Sotiel Coronada and San Telmo mines, while the lowest values were found at Zarza-Perrunal. Medium rare earth elements only outnumbered it by 1 in the case of Sotiel Coronada and San Telmo. For the rest, the levels were very similar to those of chondrite, even with lower concentrations in samples from Herrerías (HE1), Lagunazo (LA1), and Zarza-Perrunal (ZP1). Heavy rare earth elements (HREEs; Ho, Er, Tm, Yb, and Lu) concentrations were similar to those of chondrite (range of 2–6), although the values of the San Telmo residue (ST1) stood out, with a value of 26.1 and 32 for Er and Yb, respectively.
High normalized concentrations of REEs were identified, especially for light REEs, which could be due to several reasons, such as REEs often being associated with the presence of iron oxides, such as hematite (Fe
2O
3) [
38]. These residues are mainly made up of these iron oxides, hence their reddish color, thus justifying the concentrations obtained. Other studies have shown that REEs are associated with high
232Th contents [
39], which was observed in roasted pyrites in San Telmo and Sotiel Coronada.
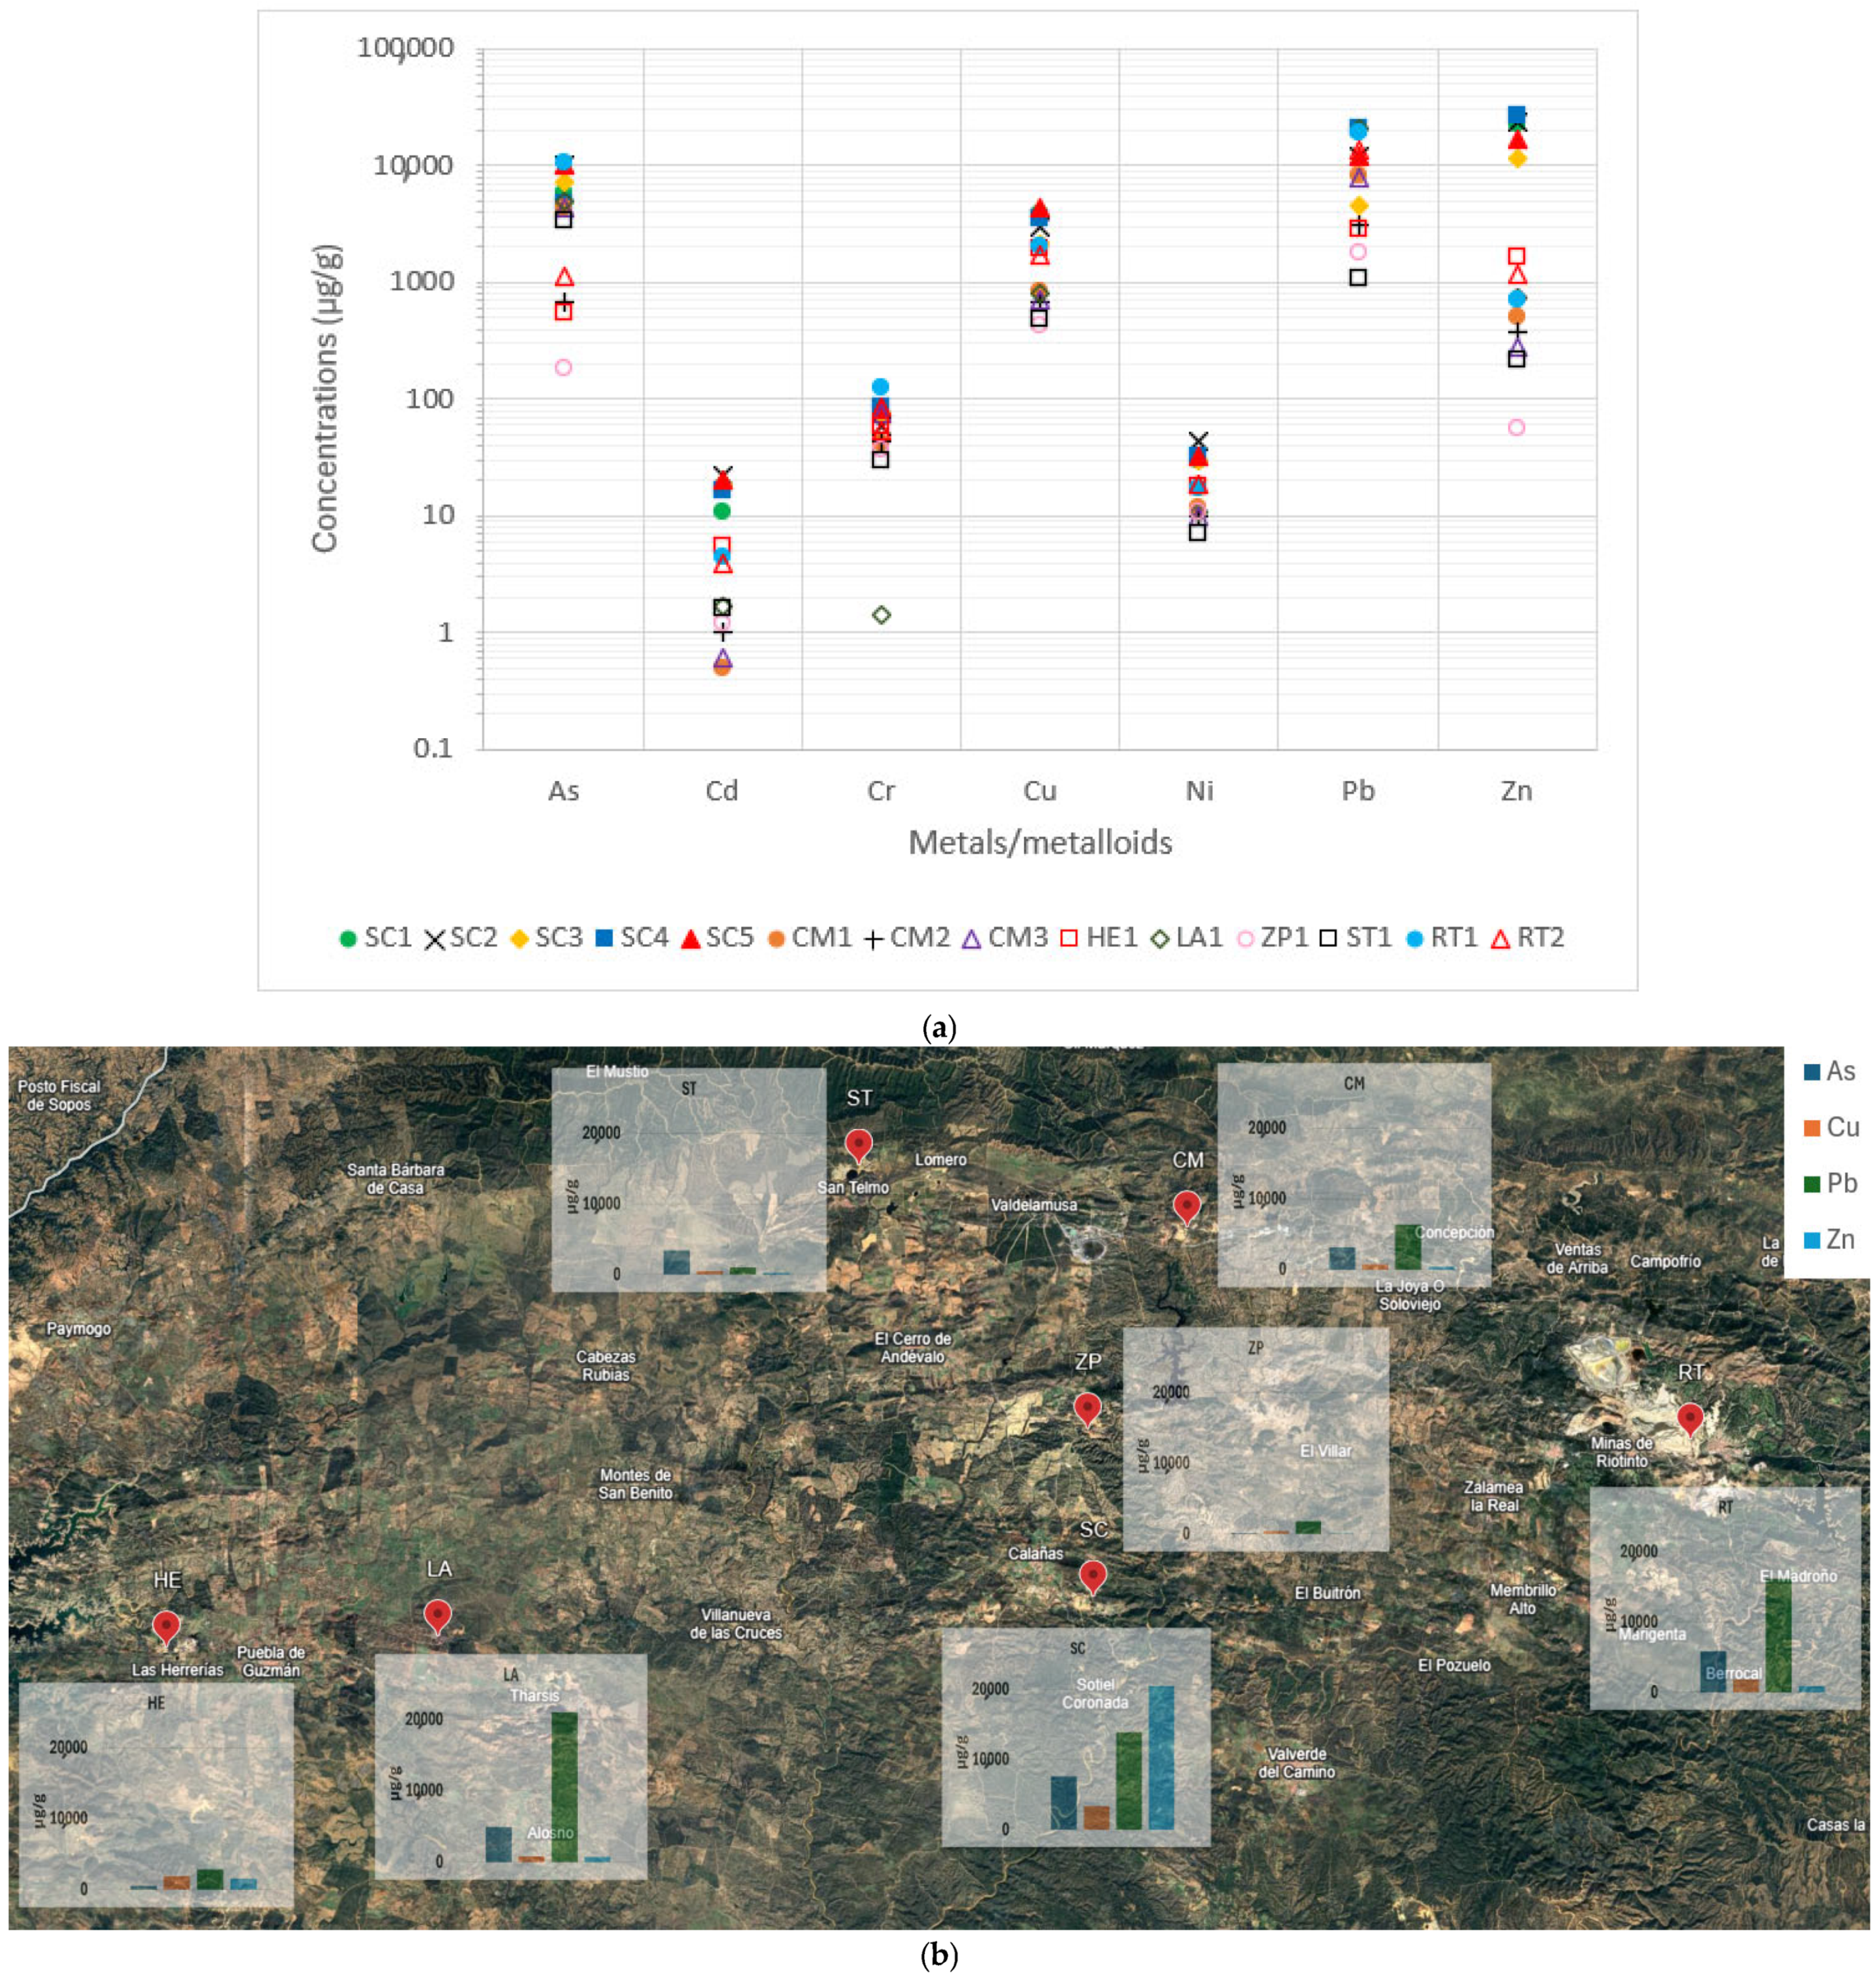
3.5. Heavy Metals/Metalloids
The concentrations of the highly toxic metals/metalloids are shown in
Figure 5a.
Figure 5b represents a standardized visual map of the concentrations of these major toxic elements. As can be seen, Cu, Pb, Zn, and As concentrations obtained for most wastes surpassed the expected values for soils in the IPB by 1-to-3 orders of magnitude (300 µg/g Cu; 400 µg/g Pb; 800 µg/g Zn; 200 µg/g As [
26]). Sotiel Coronada (SC) wastes had the highest concentration. On the other hand, Zarza-Perrunal roasted pyrite ashes (ZP1) presented values similar to those established for unpolluted soils.
For Cd, all wastes had a Cd concentration above the reference 0.12 µg/g [
26]. Roasted pyrite ashes from the Cueva de la Mora mine only exceeded them by one order of magnitude, as did Zarza-Perrunal and Lagunazo. The residues from Sotiel Coronada were notable for exceeding them by 2 orders of magnitude. The high toxicity of Cd exposure, such as bone disease and kidney problems, along with the serious danger it poses to the environment and the surroundings, must be emphasized [
40]. Finally, Ni and Cr concentrations of the collected samples resembled those expected for a typical soil (37 μg/g and 125 μg/g, respectively [
26]), and were even lower in several cases.
As a summary of the previous facts, it is important to point out that these wastes could have a great impact on the environment and require measures for the remediation of these legacy sites to avoid their release into the water systems, as they could reach the human food chain.
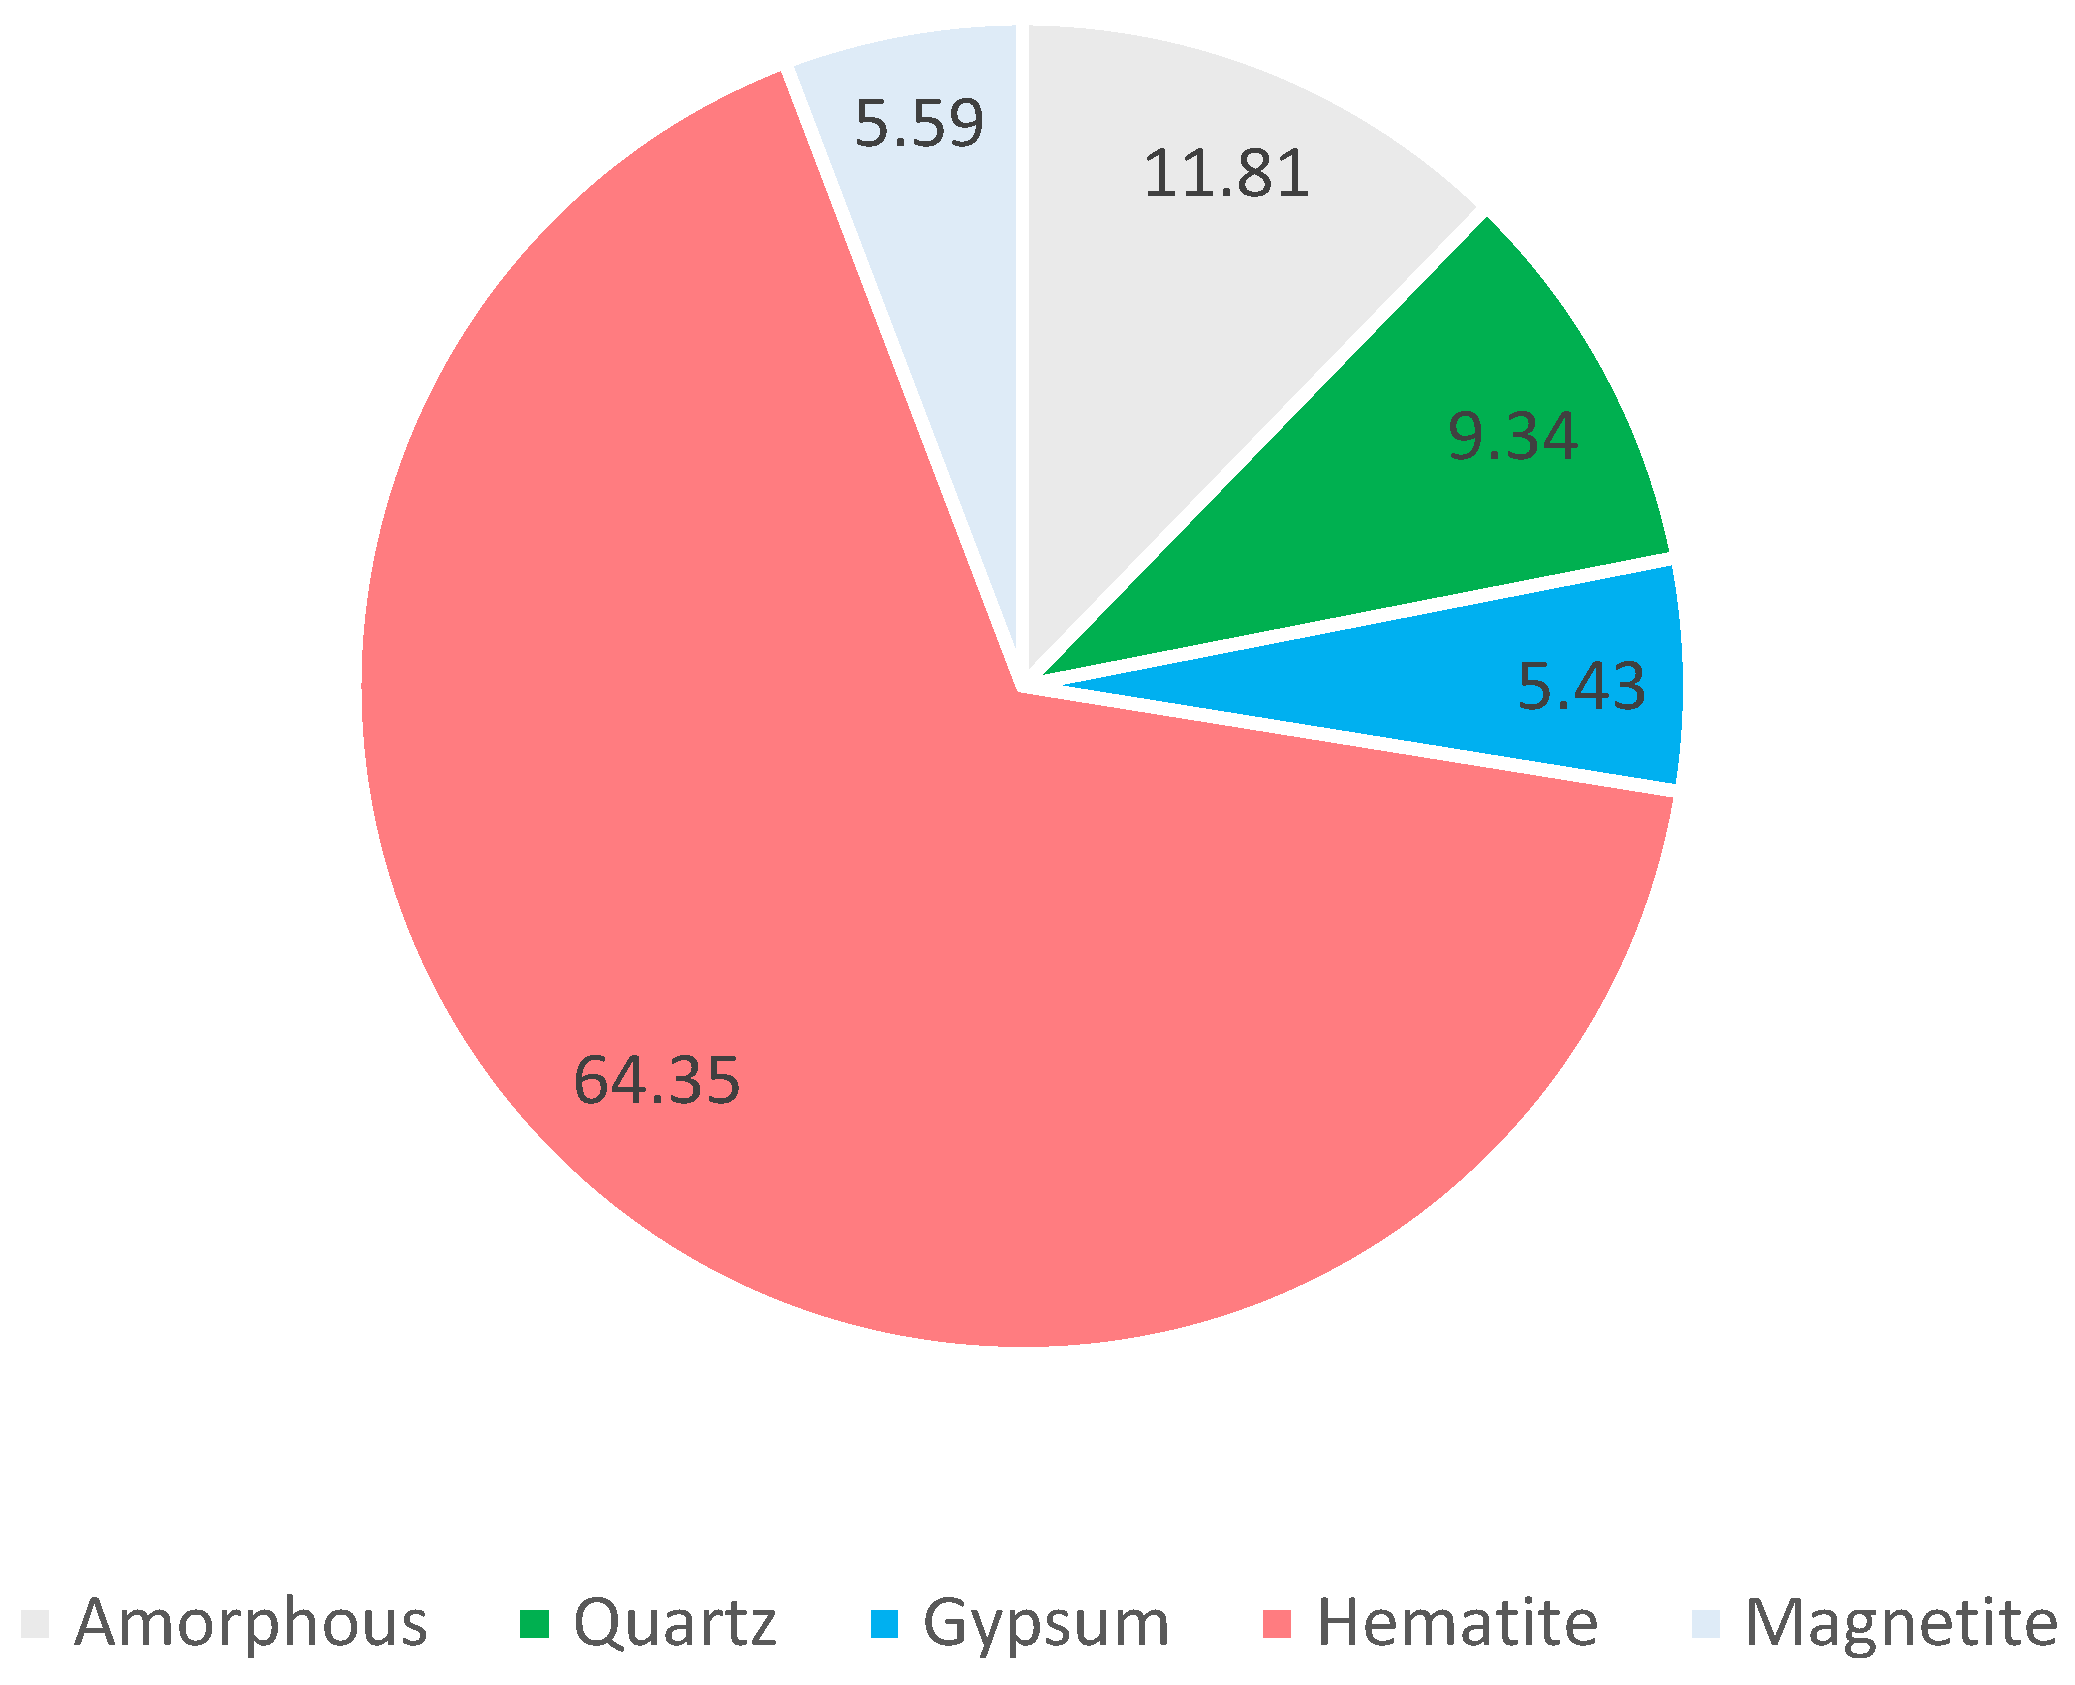
3.6. Mineralogy
In order to diagnose the recovery of this waste, it is important to know not only the concentration of major elements but also in which mineralogical form they exist, as future recovery will depend on this fact. The mineralogy of the samples consisted mostly of iron oxides and silica compounds [
41]. The mines analyzed by XRD to obtain the mineralogy were those of Sotiel Coronada (SC) and Cueva de la Mora (CM).
Roasted pyrite ash contains an average (see
Figure 6) of 64.3% hematite (Fe
2O
3), 9.3% quartz (SiO
2), 5.56% magnetite (Fe
2+Fe
3+2O
4), and 5.43% gypsum (CaSO
4·2H
2O). The percentage of amorphous phase obtained in the samples was 11.81% on average. There were also other secondary minerals depending on the sample and mining location.
In the wastes from Sotiel Coronada (SC), an amount of around 10% gypsum was observed in all samples. In SC1, SC4, and SC5, a significant amount of magnetite was also detected, between 10% and 20%. For SC2, 7.5% franklinite (Fe,Mn,Zn)2+(Fe,Mn)3+2O4) was also detected. The residues from Cueva de la Mora (CM) had a similar distribution. In CM1, 3.9% kalsilite (KAlSiO4), 0.8% massicot (PbO), and 11% beaverite (Pb(Fe3+2Zn)(SO4)2(OH)6) were observed. In CM2, 1.6% zinc sulfide (ZnS) was measured and, in CM3, another 1.6% massicot was detected.
These mineralogical distributions correspond to those previously expected according to the following majority elements obtained: presence of iron oxides such as hematite due to the high Fe (~50%) and O (~30%) content, presence of quartz due to the silicon content (2–8%), presence of minerals with toxic metals/metalloids (Zn and Pb) such as massicot or franklinite, and the existence of gypsum in the Sotiel Coronada residues due to the calcium obtained in some samples (~1.5–2%).
The study of Oliveira’s roasted ashes is compatible with our results. They obtained, through XRD, distributions in the range of 73–92% hematite, around 15% magnetite, between 1 and 3% quartz, and, depending on the sample, between 2 and 16% gypsum. It is worth mentioning that the amorphous part was not considered in this study [
32].
3.7. Radionuclide Concentrations
For certain applications and environmental impact assessments, it is necessary to analyze the radiological content of the samples. Since mining is considered a NORM activity, the waste generated from roasted pyrite ashes may pose a radiological risk. Therefore, the activity concentrations of natural radionuclides were determined.
Activity concentrations for each waste of the U-series radionuclides are shown in
Table 8 including mean values. For the
238U series radionuclides, it can be observed that, for roasted pyrite ashes, all radionuclides had activity concentrations in the same range as expected for soils, i.e., around 30–40 Bqkg
−1 [
23,
42]. The only exception was the San Telmo residue (ST1), where the U-series radionuclide concentrations were up to one order of magnitude higher (
226Ra = 220 Bqkg
−1;
238U = 95 Bqkg
−1, and
210Pb = 109 Bqkg
−1), indicating that U-series radionuclides were not in secular equilibrium, with these disequilibria being probably due to the previous processes applied on the iron minerals. Considering the obtained standard uncertainties, for most of the samples, there was (or nearly was) secular equilibrium between the long-lived radionuclides of both radioactive series (
238U and
232Th). Due to this secular equilibrium in radionuclides, demonstrated through the Sotiel Coronada and Cueva de la Mora mines, not all radionuclides of the radioactive decay series were measured in the following mines in order to speed up the work. In general, the radionuclide concentrations ranged from about 10 Bqkg
−1 to up to 220 Bqkg
−1, with San Telmo being the mine with the highest activity concentrations for U-series.
It should be noted that, in some samples, there are particular cases of disequilibrium between
210Pb and
210Po, and between
230Th and
226Ra (e.g., ST2). This is due to the chemical processes carried out in the mine, which produce the rupture of the secular equilibrium and the enrichment of these two radionuclides. The depletion of
210Pb and
210Po in relation to
226Ra can be justified by considering that their volatility increases with the temperatures of the process, especially above 500 °C, as in the formation of pyrite ashes during the combustion of pyrite [
43,
44].
Analogously,
Table 9 presents the mean activity concentrations of the radionuclides belonging to Th-series and
40K. In the same way as above described, it can be asserted that secular equilibrium was also fulfilled in Th-series. The waste with the highest
232Th-
228Ra-
228Th activity concentrations was the roasted pyrite ashes from San Telmo, with values between 81 and 94 Bqkg
−1. On the other hand, the Zarza Perrunal (ZP) waste had the lowest activity concentrations, very close to the minimum detectable activity, between 2 and 0.56 Bqkg
−1. All these values are expected for undisturbed soils, as the Spanish average is 41 Bqkg
−1 [
45].
In the case of
40K, all the activity concentrations obtained were one order of magnitude lower than the Spanish average value, i.e., around 600 Bqkg
−1 [
20]. The highest activity concentration was obtained for ST1 (158 Bqkg
−1), while the lowest value was obtained for ZP1 (11 Bqkg
−1).
235U was also measured by alpha spectrometry, with activity concentrations averaging 1.5–2.8 Bqkg
−1. This is not shown in
Figure 4, due to its low relevance. Thus, the roasted pyrite wastes contain activity concentrations of natural radionuclides very similar to those of undisturbed soils.
It is necessary to emphasize the fact that each mine has its own activity concentrations. This can be assumed to be due to the variability of natural terrain (host rocks), and mineralogical processes unique to each mine or storage conditions, if they have suffered from external factors.
3.8. Radon Emanation
Analogously, as previously mentioned, according to European Directive 2013/35/EU, it is necessary to avoid radon gas concentrations above 300 Bqm
−3 in buildings and structures [
4]. If there is a possibility to use these mining wastes as future building materials, the emanation factor and the exhalation rate must be analyzed.
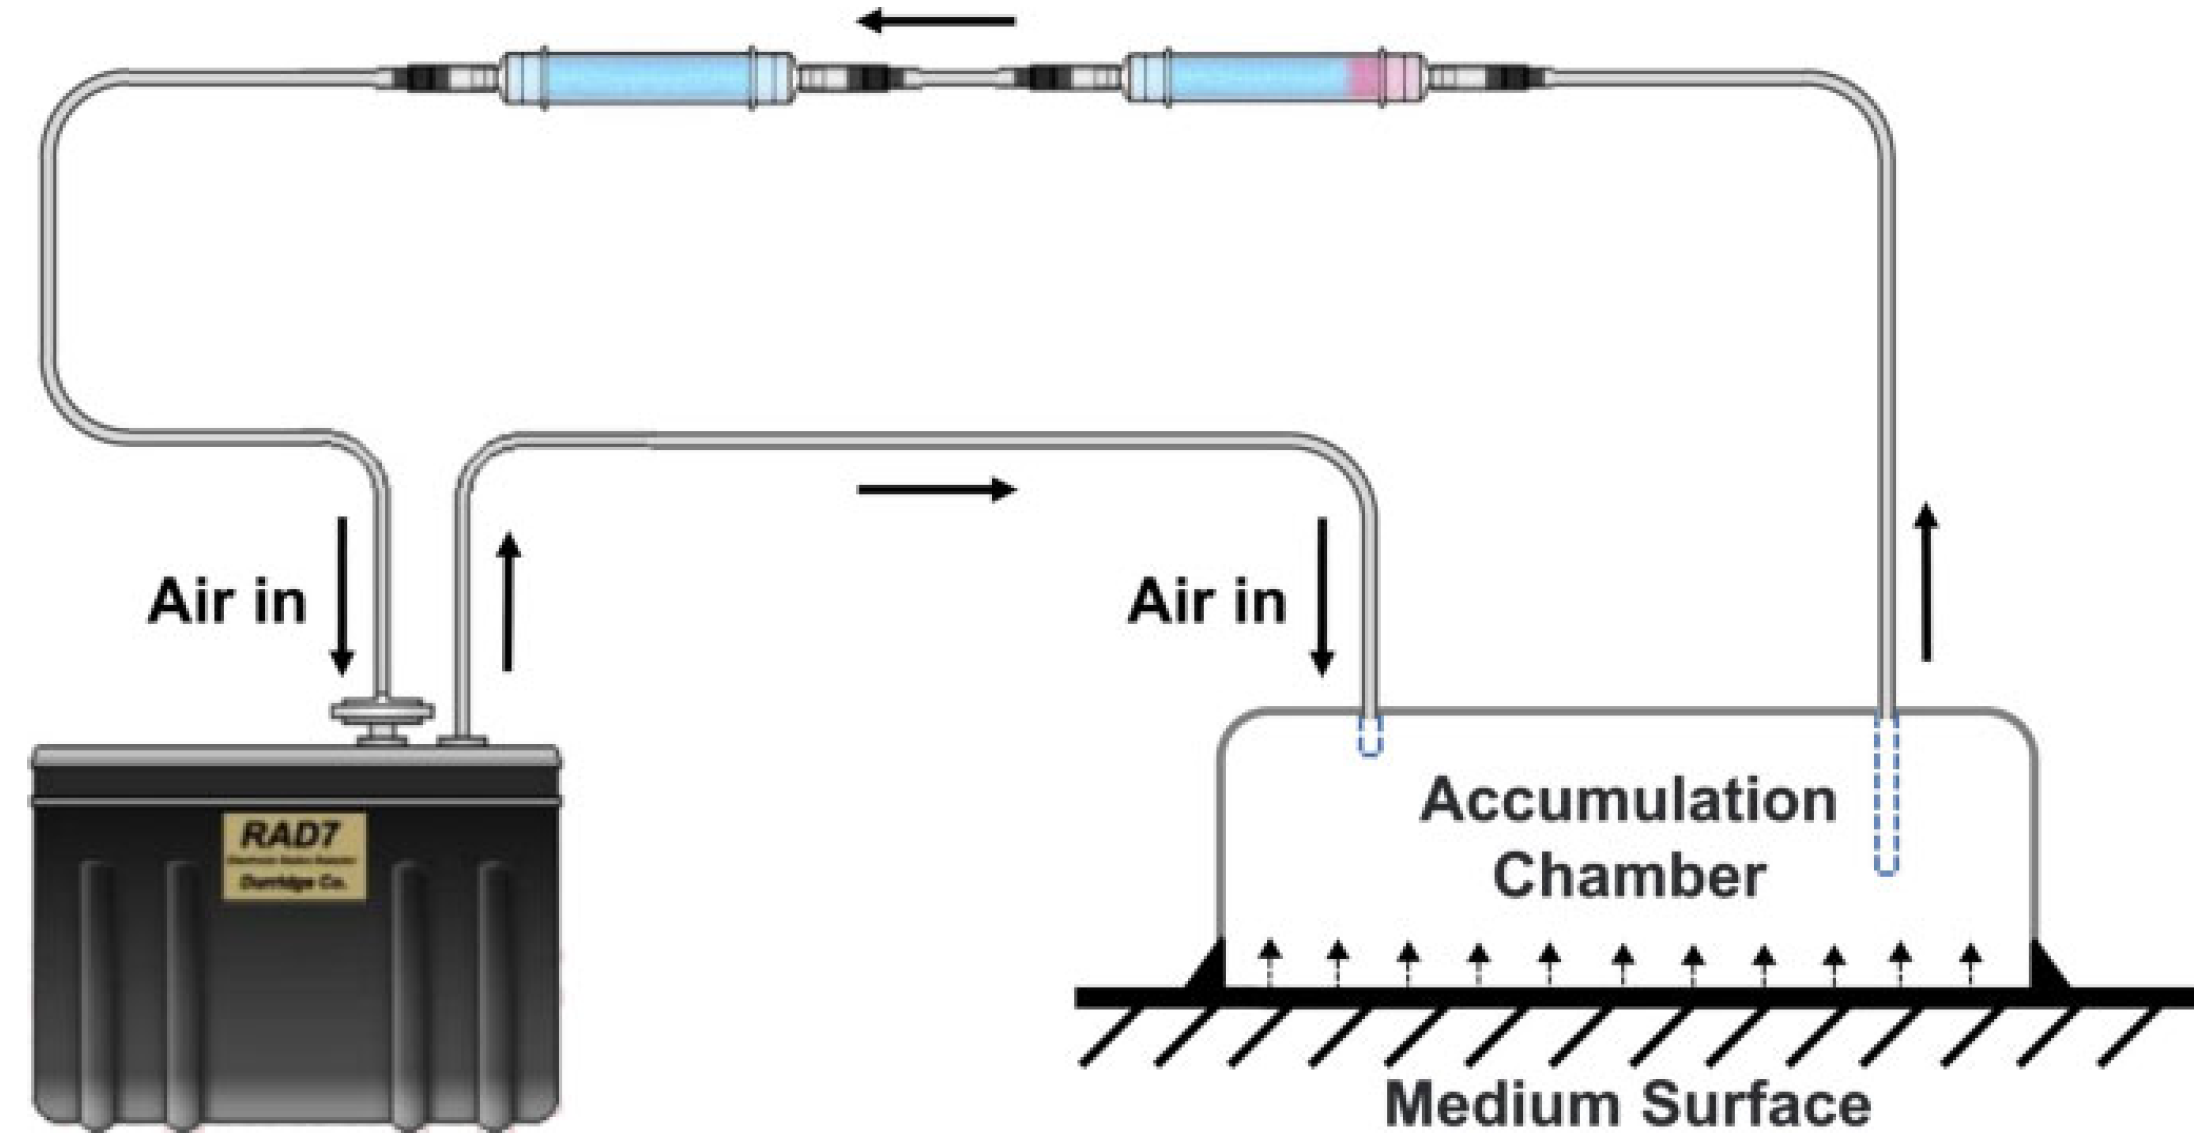
The last radioactive property measured was the Rn emanation factor, through the collection of a composite sample from each mine by mixing the different ashes. The radon accumulation curve is shown in
Figure 7. The experimental data can be seen together with the fit. The shaded background corresponds to the measurement errors. The saturation concentration obtained was (29.1 ± 1.3) Bqkg
−1. In the same way, the effective time constant obtained was (2.2 ± 0.7)·10
−5 s
−1.
In this way, the emanation factor (ε) and the exhalation rate (E
0) were obtained using Equations (3) and (4). The obtained results were an emanation factor (ε) of (22 ± 7)% and an exhalation rate (E
0) of (0.43 ± 14) Bqm
−2h. This emanation factor is within the error range of the emanations obtained by Rogers et al. on different soils (10–30% [
46]). According to the classification criteria proposed by Tuccimei on exhalation rates for building materials, this waste belongs to category A (E0 < 0.49 Bqm
−2h), thus it would not be a potential source of risk [
47].
3.9. Radiological Hazard Indexes
In
Table 10, the different radiological hazard indexes are shown for every waste in each mine, including mean values. The calculated indexes were radium equivalent activity (Ra
eq), external hazard index (H
ex), activity concentration index for gamma radiation emitted by building materials (Ic), and concentration factor for
238U (Fc
238U) and
232Th (Fc
232Th).
The mean Raeq value obtained was 70.0 Bqkg
−1, which is identical to those that have been previously obtained in soils [
48]. The mine with the highest average value was Sotiel Coronada, with 130 Bqkg
−1, while the mine with the lowest Raeq was Zarza-Perrunal, with 3.8 Bqkg
−1. All the results in this study were appreciably lower than 370 Bqkg
−1, which is the world’s recommended value as the equivalent to the 1 mSv/y dose rate limit set by the International Commission on Radiation Protection (ICRP) [
21]. This result means, as a potential line of valorization, that these wastes can be reused and sold as construction materials.
External hazard index (H
ex) values for all samples ranged from 0.04 to 0.60. The highest values were obtained for ST1 waste (0.60), and the lowest values were obtained for CM2 waste (0.04). The mean value obtained was 0.22. All estimated values were lower than the threshold global recommended value (<1). These results imply that the radiation levels measured for these mining wastes do not pose a serious radiological health risk, confirming that exposure to low natural radiation is negligible [
21]. A similar analysis was applied for Ic, whose values were in the range between 0.06, for CM2, and 0.58, for RT1 (except for San Telmo waste, ST1). Most wastes had values lower than 1. Thus, as a result, they would comply with Spanish regulations for gamma radiation emitted as construction materials [
49]. As a particular case, the Ic obtained for ST1 was 1.65. For this sample, further analysis would not be useful, as it would not comply with the required regulations.
The concentration factors obtained for 238U (Fc238U) were very close to 1 or lower. As previously mentioned, the San Telmo (ST) sample stood out for its high concentration in 238U, thus this factor was 4.48. On the other hand, the Zarza-Perrunal (ZP) sample had a deficit of this radionuclide, with a factor of 0.26. Therefore, it can be ascertained that these wastes have 238U activity concentrations in the range of undisturbed soils. The same justification can be applied to 232Th, as its concentration factors (Fc232Th) ranged from 0.02 for Zarza-Perrunal to 1.50 for Sotiel Coronada (mean value). It can also be stated that the activity concentrations of this radionuclide are typical soil concentrations.
As a summary conclusion, the radiological hazard indexes ratify the results obtained from activity concentration values, affirming that radiological implications of these wastes (direct irradiation) are very low or null. Nevertheless, in waters affected by AMD, high concentrations of both U- and Th-isotopes have been measured, due to the high solubility of these radioelements in the sulfuric acid aqueous medium generated by the AMD processes [
50].
3.10. Pollution Indexes
Table 11 shows the different C
i values for the different previously analyzed toxic elements and C
d values for all samples. As, Cu, and Pb contamination factors are notorious for contributing very high levels of pollution in general (C
i > 6), exceeding C
i values in some samples by 2 or 3 orders of magnitude for the levels of a typical soil. Exactly the same is true for Zn, except that, in the samples from Cueva de la Mora (CM2 and CM3), the level of contamination was “only” considerable.
A similar situation was detected for Ni and Cr. The samples from Sotiel Coronada, Cueva de la Mora, and Herrerías (and Lagunazo in the case of Cr) had a low level of contamination (Ci < 1), while, in the rest of the samples, the level was higher (very high for Cr and moderate-considerable for Ni). Cadmium, on the other hand, presented the opposite behavior. The wastes from Lagunazo, Zarza-Perrunal, San Telmo, and Riotinto showed a low level of contamination, and the rest showed a very high level. It is worth mentioning that all samples had a very high contamination degree Cd (>32), specifically 3 orders of magnitude above that of uncontaminated soil. These results illustrate the serious impact of mining waste on the environment, especially for Riotinto-, Lagunazo-, and Sotiel-Coronada-roasted pyrite ash.
Potential ecological risks and ecological risk indexes are shown in
Table 12. For arsenic, lead, and copper, as in the previous case, the potential ecological risk of these wastes was extreme (E
i > 160). In the same way, Cr and Ni values for Ei in all samples were low (E
i < 40), with the exception of the Riotinto wastes, where the risk for Cr was considerable-moderate. In the case of zinc and cadmium, as in the former case, depending on the mine and sample, the risk was one way or another. For zinc, with the exception of Cueva de la Mora and Herrerías, where the risk was low, the rest of the mines had an extreme potential ecological risk for this element. For Cd, the samples from Lagunazo (LA), Zarza-Perrunal (ZP), San Telmo (ST), and Riotinto (RT) showed a low risk, while, in Sotiel Coronada (SC), Cueva de la Mora (CM), and Herrerías (HE), the risk for this element was extreme. Finally, the ecological risk index was very high for all wastes (RI > 600), specifically several orders of magnitude higher, with RT1 standing out (RI = 67380). Thus, in general, there is an urgent need to consider the serious environmental impact caused by mining waste located in these areas.
3.11. Pollutant Mobility
Concentrations of the different anions found in the waters after forced leaching are shown in
Table 13. In addition, to make a rigorous comparison, the same process was carried out on a sample of soil from the IPB. The anions that form the generated leachates consist mainly of fluorides (F
−), chlorides (Cl
−), and sulfates (SO
42−). For fluorides and chlorides, the anion concentrations were in the ranges of 2–37 µg/g and 5–38 µg/g, respectively. These concentrations are far below the limits (500 µg/g fluorides; 25,000 µg/g chlorides) established in R.D. 646/2020 for the acceptance of hazardous waste in landfills [
49]. The results are as expected for typical uncontaminated soils. For sulfates, this limit value is at 5.104 µg/g. The wastes from Cueva de la Mora and Sotiel Coronada had sulfate concentrations in the same order of magnitude as this limit, with even sample SC3 exceeding it (6.1.104 µg/g). In roasted pyrite, sulfates are present in the leachates due to the high concentration of S (1–5%) in the ashes [
51]. These values, apart from being very close to the limit in several cases, are 2 orders of magnitude higher than those obtained in the soil.
The concentrations of the different elements in the leachates of the samples are listed in
Figure 8. For uranium and thorium, roasted pyrite ash leachate concentrations did not exceed the International Atomic Energy Agency recommended limits of 3 µg/g. These elements would have low mobility and solubility in this type of waste, obtaining values similar to those found in soils. In the case of Fe, according to the European Union Water Framework Directive (WFD), the limit for Fe in water is 200 µg/g. This value was only exceeded by two samples from Cueva de la Mora, CM1 and CM2, with 346 µg/g and 2281 µg/g, respectively. Moreover, these values were several orders of magnitude higher than the 0.12 µg/g obtained in soil. This may justify the poor roasting process at this mine, due to the existence of soluble secondary minerals such as beaverite (Pb(Fe
3+2Zn)(SO
4)
2(OH)
6), which is more soluble in acidic conditions, releasing iron into the leachate [
52]. The limit according to R.D. 646/2020 for S is 16,600 µg/g, a value only exceeded by SC3.
Similarly, the seven heavy metals/metalloids with a high toxic component had limits according to Decision 2003/33/EC. These values established by the European Union for classification and admission as hazardous wastes in landfills are as follows: 25 µg/g for As, 5 µg/g for Cd, 70 µg/g for Cr, 100 µg/g for Cu, 40 µg/g for Ni, 50 µg/g for Pb, and 200 µg/g for Zn [
53]. For arsenic, chromium, and nickel, no sample exceeded the established limit values. In the case of cadmium and copper, only sample SC3 exceeded the established limits, with concentrations of 6.34 µg/g and 481 µg/g, respectively, indicating a high release of pollutants into the environment by this sample. Similarly, in the case of lead, the values were below the limit, except in LA1, with 79 μg/g. The very high concentration of Pb in this sample affected the release of this element in the same way. Consequently, it is necessary to seek solutions for serious health and environmental problems [
54], as soil values for all toxic metals/metalloids were exceeded by several orders of magnitude.
In addition, a previous study by Soriano et al., where a leaching test was performed on roasted pyrite ashes located in Cartagena, provides data of the same order of magnitude for concentrations of toxic metals/metalloids in the leached liquid: 3.8 µg/g for Cd, 1.1 µg/g for Cr, 78 µg/g for Cu, 2.8 µg/g for Ni, 228 µg/g for Pb, and 423 µg/g for Zn. Differences only exist for lead, where the release in Cartagena waste was one order of magnitude higher [
55].
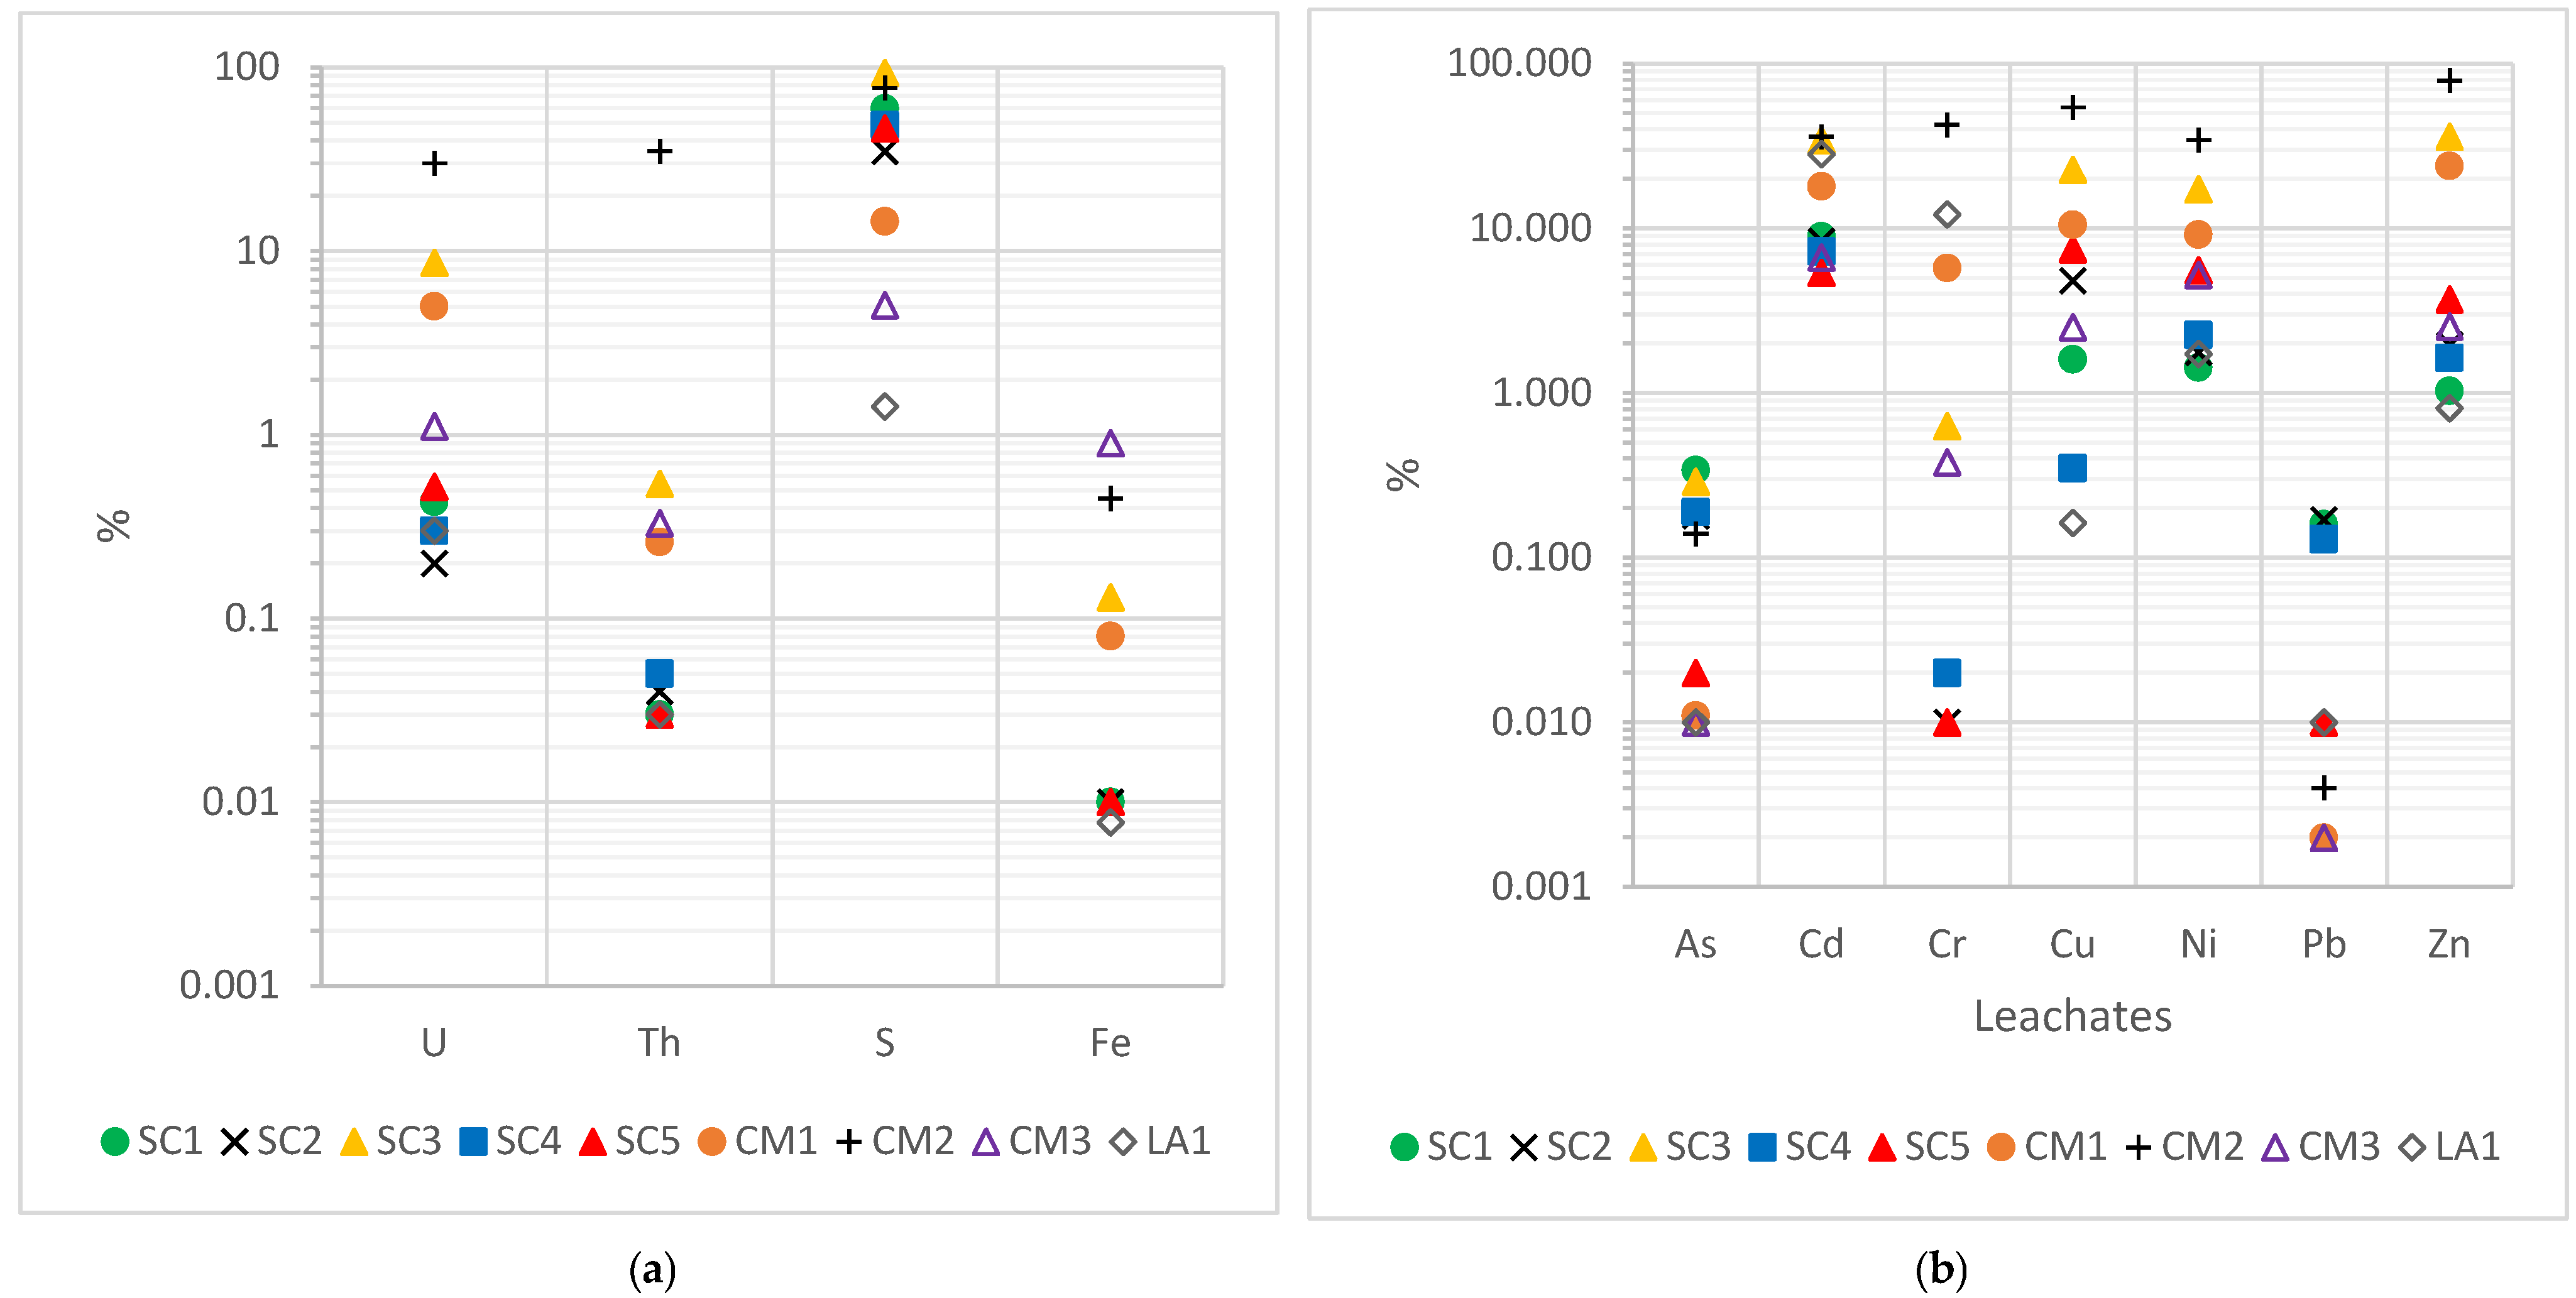
The transfer factors (TF) obtained are shown in
Figure 9. The low transfer factors of U (5.1%) and Th (4%) indicate that most of these elements did not pass into the water, remaining in the solid matrix. This limits the potential impact on water, thus reducing the risk of radioactive pollution. As the wastes had a large amount of residual sulfur that had not been burned, due to a not fully efficient roasting process, there would be remains of partially oxidized sulfides, which, under leaching conditions, would oxidize into soluble sulfates. This justifies the large amount of leached S and its high transfer factor (42% on average). The low TF of Fe (0.18%) was due to the presence of insoluble iron oxides such as hematite.
In metals and metalloids, there was a variety of TFs, from 0.06% of Pb to 16.9% of cadmium. Although, for some elements, the fraction of the sample that becomes part of the leachate is small (0.06% for Pb or 0.13% for As), due to the high concentrations, it is necessary to monitor their environmental impact. Concentrations were 2 to 3 orders of magnitude higher than expected for uncontaminated soils, thus, even at low TFs, leachates can cause environmental contamination risks, exceed permitted limits for surface water or groundwater, and affect aquatic organisms.
The mean values of the partition coefficients K
d for each element are provided in
Table 14, including ranges and standard deviations. The calculated results for As (405 L/kg), Cr (338 L/kg), Pb (1744 L/kg), and Zn (4.5 L/kg) are similar to K
d obtained in soil sediments established by other studies (140 L/kg, 350 L/kg, 9600 L/kg, and 1.6 L/kg, respectively). These elements have a similar release. However, for U (19.1 L/kg), Th (170.8 L/kg), Fe (724 L/kg), Cd (0.94 L/kg), Cu (11.7 L/kg), and Ni (3.1 L/kg), due to the acidic environment of the waste and leaching, the release and mobility of contaminants was higher, resulting in lower k
d with respect to soils (4000 L/kg, 25,000 L/kg, 25,000 L/kg, 230 L/kg, 780 L/kg, and 980 L/kg, respectively) [
56]. According to the mean K
d shown in
Table 14, the elements were ordered from highest to lowest mobility:
Although the order of mobility of some elements may be characteristic of this waste, comparing the results with those of other studies where the mobility of these pollutants in soils is analyzed, the order is generally similar. In both studies, cadmium is the most mobile element, while arsenic and lead are among the least mobile [
57].


