Article

The Characterization of Black Mass from Spent Lithium-Ion Scooter Batteries Using Multi-Analytical Techniques

by
Mahsa Pourmohammad
1,*,
Josep Oliva Moncunill
1,
Hernan Anticoi
1,
Carlos Hoffmann Sampaio
1,
Pura Alfonso
1,
César Valderrama
2 and
Jose Luis Cortina Pallas
2
1
Department of Mining, Industrial and ICT Engineering, Universitat Politècnica de Catalunya Barcelona Tech (UPC), 08242 Barcelona, Spain
2
Department of Chemical Engineering, Universitat Politècnica de Catalunya Barcelona Tech (UPC), 08028 Barcelona, Spain
*
Author to whom correspondence should be addressed.
Recycling 2025, 10(2), 54; https://doi.org/10.3390/recycling10020054
Submission received: 29 October 2024 / Revised: 21 January 2025 / Accepted: 23 March 2025 / Published: 1 April 2025

Abstract

:
The process of recycling lithium-ion batteries is drawing global attention due to a shortage of critical raw materials (CRMs), a sustainable and environmentally friendly approach that meets the needs of many industries. Characterization is an important step in the recycling of black mass resulting from the processing of a lithium-ion battery at the beginning and the end of the processes because of the complexity of the feed material and to evaluate the process. This research proposes a beneficiation flowchart for the further separation of graphite particles from metal oxides based on the characterization results by combining scanning electron microscopy with energy dispersive spectroscopy (SEM-EDS), laser-induced breakdown spectroscopy, laser scattering particle size distribution analysis, X-ray fluorescence (XRF), X-ray diffraction analysis (XRD), inductively coupled plasma–optical emission spectroscopy (ICP-OES), and thermogravimetry–differential thermal analysis (TG/DTA). Based on these characterization results, it is suggested that black mass with coarser particle size (0.2–1 mm) goes to the liberation process for beneficiation of the Al and Cu and black mass with a size range of 0.053–0.2 mm goes to the froth flotation for beneficiation of the Mn, Ni, Fe, and Co. Finally, a black mass with a size range of <0.053 mm goes through the froth flotation after the agglomeration process.

1. Introduction

The circular economy is a regenerative strategy for reducing waste and ensuring the eco-sustainability of post-use products. Reusing a product at the end of its lifespan leads to the generation of high-added-value materials, which reduces both the need for primary materials and waste production. The scientific community has shown increasing interest in developing and optimizing different methods for recycling and reusing waste, particularly hazardous waste, which necessitates proper management [1]. Batteries are currently used in many electronic devices, including electric and hybrid vehicles. Due to the exponentially increasing number of spent batteries recently generated, the recycling of battery components has attracted global attention. Spent batteries contain heavy metals, which may seep out, negatively affecting the environment and human health [2,3].
The black mass is a fine powder that is produced after battery cells have undergone thermomechanical and physical treatments (shredding, grinding, heat treatment, and density separation) [4,5,6,7,8]. It accounts for roughly 30% of the original battery’s weight and can be used as a tradable feedstock for pyrometallurgical and hydrometallurgical processes [9]. Most of the raw materials used in manufacturing lithium-ion batteries (LIBs) are currently obtained from primary resources (mining). For example, aluminum (Al), copper (Cu), nickel (Ni), manganese (Mn), cobalt (Co), lithium (Li), and natural graphite present a supply risk and are categorized as critical raw materials (CRMs) by the European Commission [10].
More importantly, the increasing global demand for electronic devices has resulted in a growing need for these CRMs, which can result in supply risks, price fluctuations, and market monopolies [11]. Therefore, raw material production combined with mining and recycling will be essential and unavoidable to meet the upcoming demand for LIBs [10,12,13]. Based on the regulations set in Europe in the Batteries Directive (2006/66/EG) for LIBs, the recycling efficiency must be at least 50% by mass. The European Commission (EC) proposed an initiative in 2020 to replace the 2006 Battery Directive as part of the European Green Deal. The recycling efficiency targets for 2030 are 65% for LIBs, 95% for Co, 95% for Cu, 95% for lead (Pb), 95% for Ni, and 70% for Li [14].
Batteries have three main components—two electrodes and an electrolyte, regardless of the cell type. The electrodes consist of a conductive foil coated in active particles. Typically, the anode is composed of copper foil and spherical natural graphite, and the cathode is made up of lithium metal oxide particles on aluminum foil. Currently, a wide variety of different cathode chemistries are found in LIBs, each with a specific set of properties (e.g., specific energy, power, performance, safety, and lifespan), which further complicates their recycling. An organic binder is used to tightly pack together and adhere to these cell components. The black mass consists of different ratios of metal mixtures, such as lithium, manganese, cobalt, nickel, and other phases in different ratios. The electrolyte is usually a Li salt dissolved in an organic solvent. Other additional components necessary for LIB cells include separators, casing, and other plastics [9,15,16,17,18,19].
The chemical composition of batteries plays a key role in determining how they can be recycled because different techniques are required to extract and recover valuable materials. Therefore, it is fundamental to correctly identify the composition of materials present in black masses to use the correct recycling processes.
Because black masses are heterogeneous samples, a combination of analytical methods can provide significantly better characterization than a single method [10]. Since quantifying the composition of metals such as Co, Ni, Mn, Cu, and Al in battery waste streams is relatively straightforward, techniques such as X-ray diffraction (XRD) [2,12,14], inductively coupled plasma (ICP) spectroscopy [20,21], scanning electron microscopy (SEM) [22,23,24], and energy dispersive X-ray spectroscopy (EDS) have been utilized in the published literature to characterize battery waste. In addition, complementary elemental and oxide analyses using X-ray fluorescence (XRF) [2,14,25] and laser-induced breakdown spectroscopy have emerged as powerful analytical methods for the elemental mapping and depth profiling of many materials, from laboratory-synthesized model materials to real-world products, including materials for fusion reactors, photovoltaic cells, ceramic and galvanic coatings, lithium batteries, historical and archaeological artifacts, and polymeric materials [24,26,27,28].
In addition, the characterization of elements such as sulfur, carbon, hydrogen, and oxygen, as they are difficult to quantify, can be carried out through elemental analysis such as LECO (CS230) [14,29], which is the fastest and most appropriate technique [30,31,32].
Carbon-containing species require special characterization due to the difficulty of distinguishing among total organic carbon (TOC), total inorganic carbon (TIC), and elemental carbon (EC). In addition, battery waste may contain various forms of carbon in its composition or as impurities of the raw materials used in its production. Due to its relevance in various industries and fields, there are multiple methods available for the characterization of carbon-containing species. Some common techniques include Raman spectroscopy [14,33,34], X-ray powder diffraction (XRD) [14,34], Fourier transform infrared (FTIR) spectroscopy [14,35], combustion analysis, and X-ray photoelectron spectroscopy (XPS) [14]. Although techniques such as ICP spectroscopy and thermogravimetric analysis (TGA) [14,34] are not intended for determining carbon-containing species, they can be utilized to determine the carbon content of a sample. Additionally, gas chromatography and thermal conductivity detectors after combustion can be used to obtain a precise calculation of carbon and other elements, such as hydrogen and sulfur. Distinguishing graphitic carbon from other carbon species can be achieved by using techniques that distinguish the atomic structures and energy spectrum between amorphous carbon and graphite, including XRD, Raman spectroscopy, SEM, and transmission electron microscopy [7,15].
Although the recycling of batteries has gained the attention of many scientists, there has been limited research and few publications on the characterization of black masses [7]. In 2020, a multi-analytical methodology combining elemental analyses, XRD analyses, magnetic susceptibility measurements, and electron probe m-analysis (EPMA) was implemented by Zielinski et al. [6] to characterize several sieving fractions of industrial black mass (BM) powders. In addition, in 2022, Donnelly et al. [9] used a combination of techniques, such as SEM-EDS, X-ray computed tomography (X-CT), and laser ablation inductively coupled plasma mass spectrometry (LA-ICP-MS), to characterize and quantify the phases and particle types present in black masses; however, they confirmed that further work is needed to refine the compositional groups, with the analysis of additional samples from different feeds/streams in Europe, China, and the USA. Elsayed Mousa et al., in 2023 [14], studied comprehensive qualitative and quantitative analytic techniques, such as inductively coupled plasma–optical emission spectrometry (ICP-OES), X-ray fluorescence (XRF), X-ray diffraction (XRD), scanning electron microscopy with energy-dispersive spectroscopy analysis (SEM-EDS), petrography (optical and reflectance), and Raman microspectroscopy to characterize and evaluate the effects of thermal treatment on the black masses from spent lithium-ion batteries. Lastly, Laurance Donnelly et al., in 2023 [7], used a combination of methods, such as Micro X-CT, Micro-XRF, laser ablation–inductively coupled plasma–mass spectrometry (LA-ICP-MS), and automated SEM-EDS (AMICS), to characterize and quantify the phases present and particle chemistry. More importantly, they mentioned that further research is recommended to refine the compositional group, with the analysis of additional samples, since each sample from different recycling plants (streams) will vary in composition. Therefore, further analysis of a range of different samples is recommended to develop a cost-effective and timely workflow for sample characterization [1,7].
This study presents an extensive characterization of a black mass through the integration of a range of analytical methods to describe chemical and mineralogical compositions, as well as the morphological structure of the black masses from spent lithium-ion batteries from scooters, since this is an essential step before beneficiation. Maximizing the recovery of graphite and metal oxide will allow for subsequent efficient pyrometallurgical and hydrometallurgical processes.

2. Results and Discussion

2.1. Particle Size Distribution (PSD)

The particle size fractions were determined with three repetitions of wet sieving using sieves of 1000, 500, 200, 100, and 53 μm and masses of 50 g, 100 g, and 100 g, using distilled water (Table 1). The average results in Table 1 show that about 71.1% of the particles were under 100 μm and 28.9% were bigger than 100 μm. In addition, the graph (Figure 1) reveals that the three repetitions of the method used to determine the particle size distribution had approximately the same results.
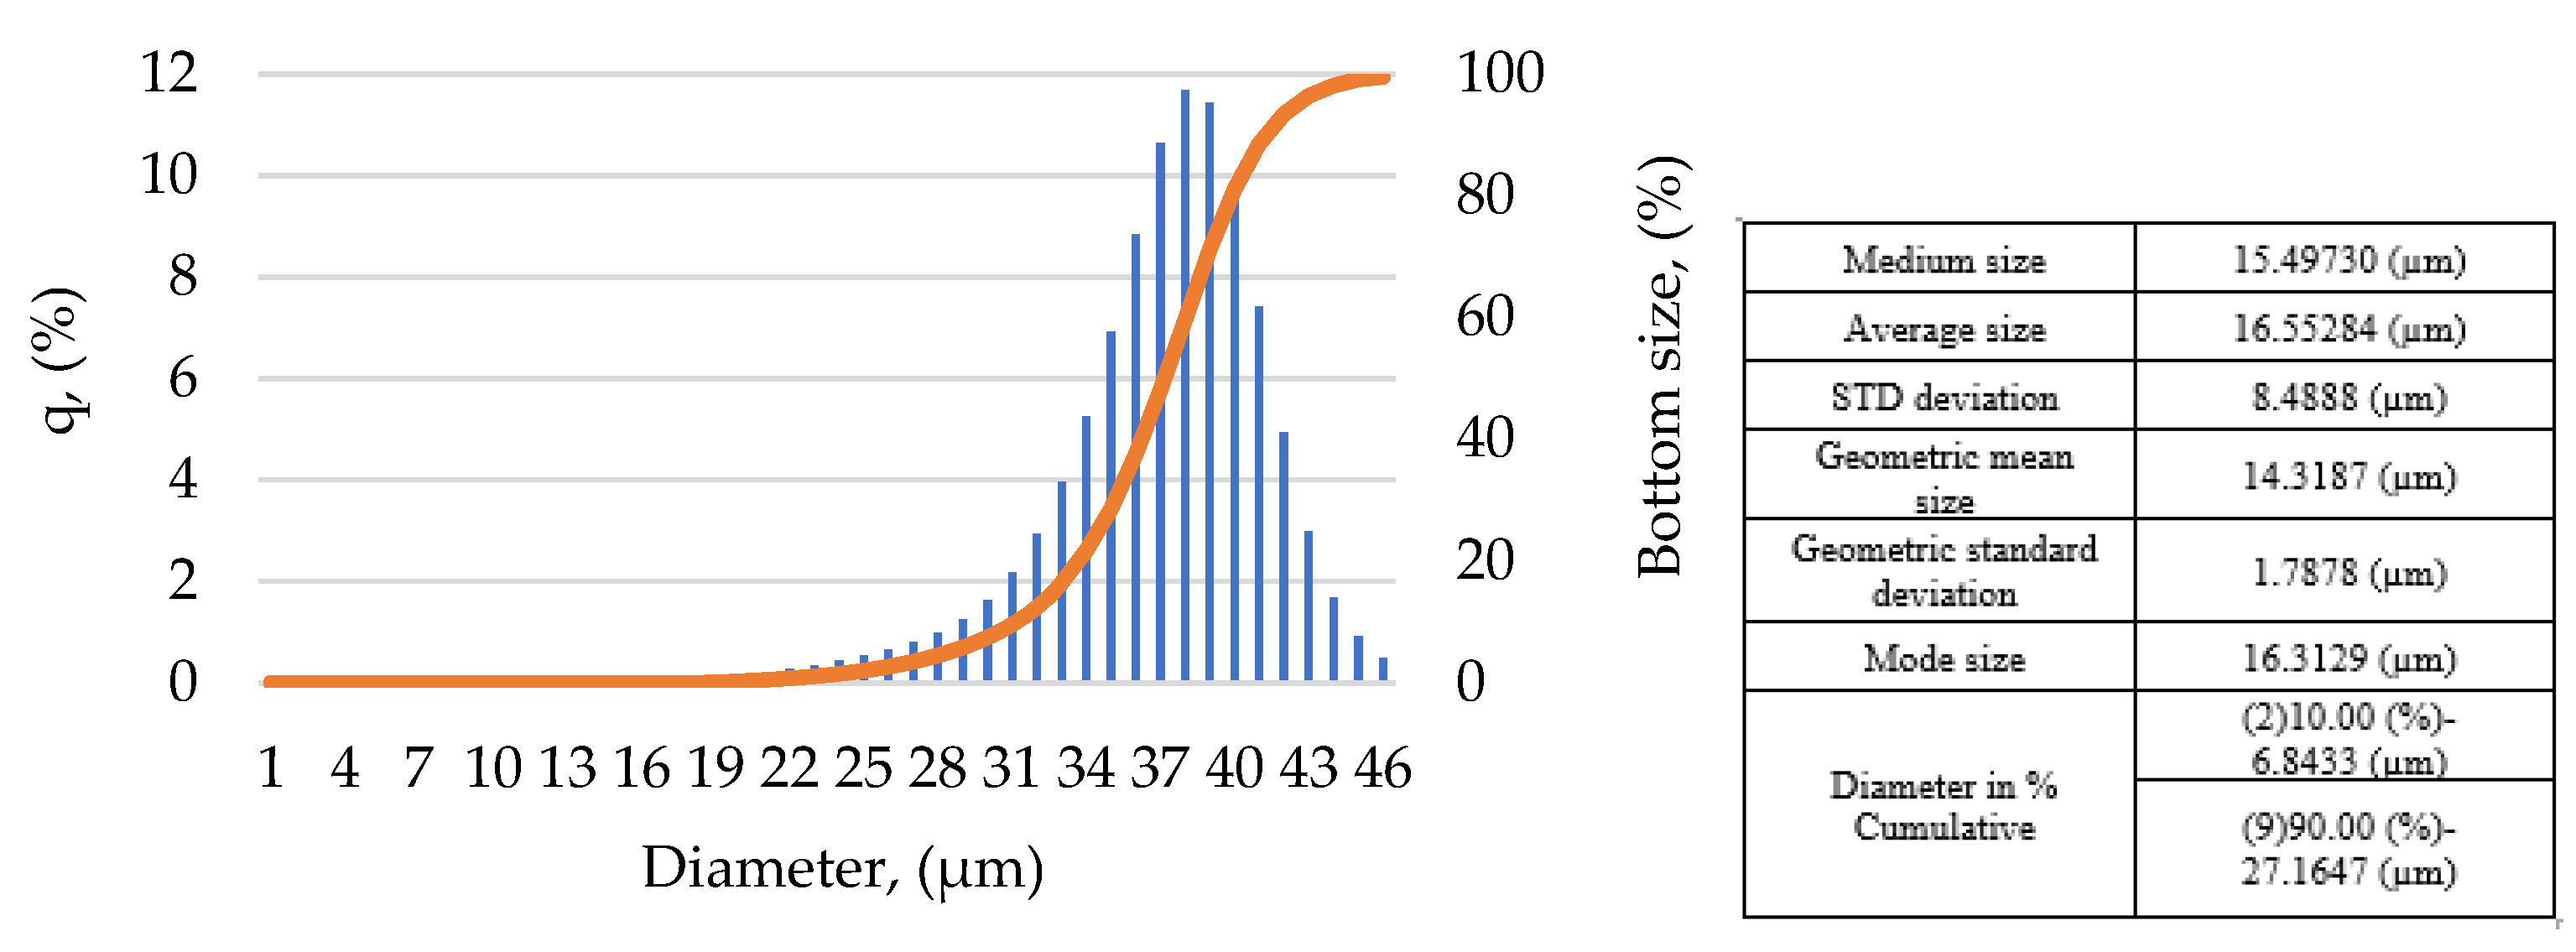
For samples under 53 μm, the laser scattering analyzer was used to determine the size ranges of the fine particles (Figure 2). The results show that 90% were under 27.16 μm and 10% were under 6.84 μm. Normally, the optimum particle size range for froth flotation is under 100 μm [36], but some pretreatment steps, such as agglomeration processes, will probably be needed for samples under 27.16 μm. However, depending on the material being separated, the particle size range will change. For example, graphite beneficiation can follow the particle size range of coal. The optimum size for the maximum flotation recovery of coal is 100–200 microns [37].

2.2. Inductively Coupled Plasma Optical Emission Spectroscopy (ICP-OES)

ICP-OES was carried out on the black mass sample without any treatment to determine its chemical composition, especially potentially strategically and economically important metals, such as lithium, since other methods cannot quantify amounts of light elements [7].
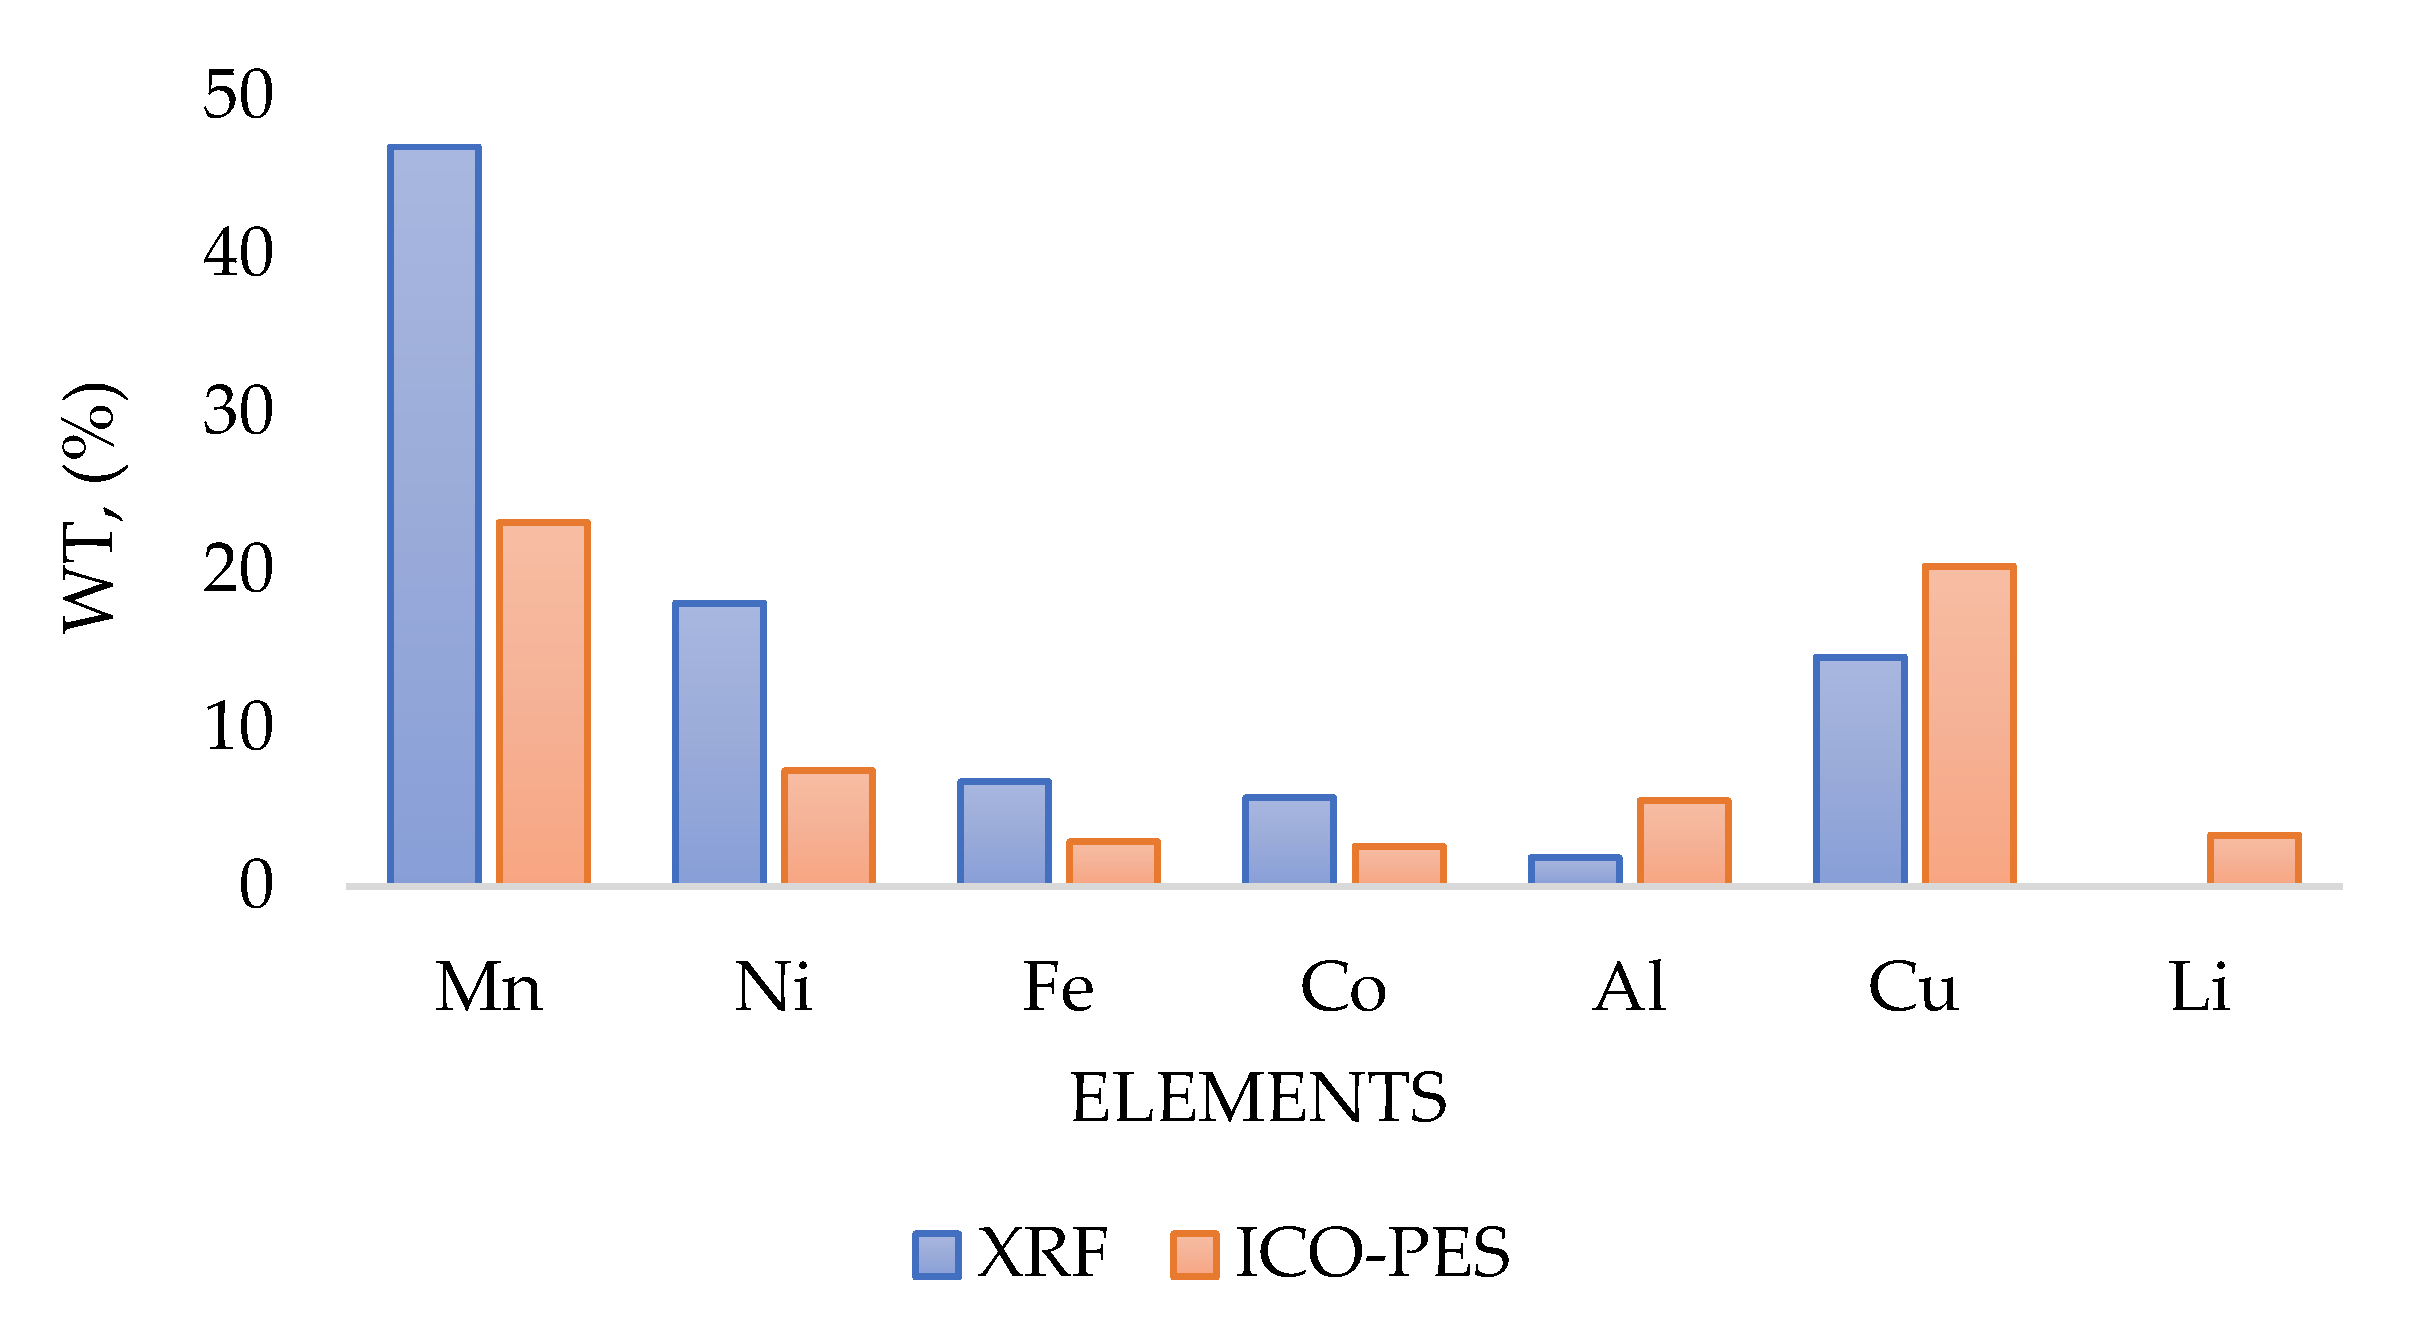
According to the ICP-OES results, the wt.% values of the major elements and Li that existed in the black mass were 23.01% Mn, 20.24% Cu, 7.3% Ni, 5.4% Al, and 3.2% Li (Figure 3).

2.3. X-Ray Fluorescence Analysis (XRF)

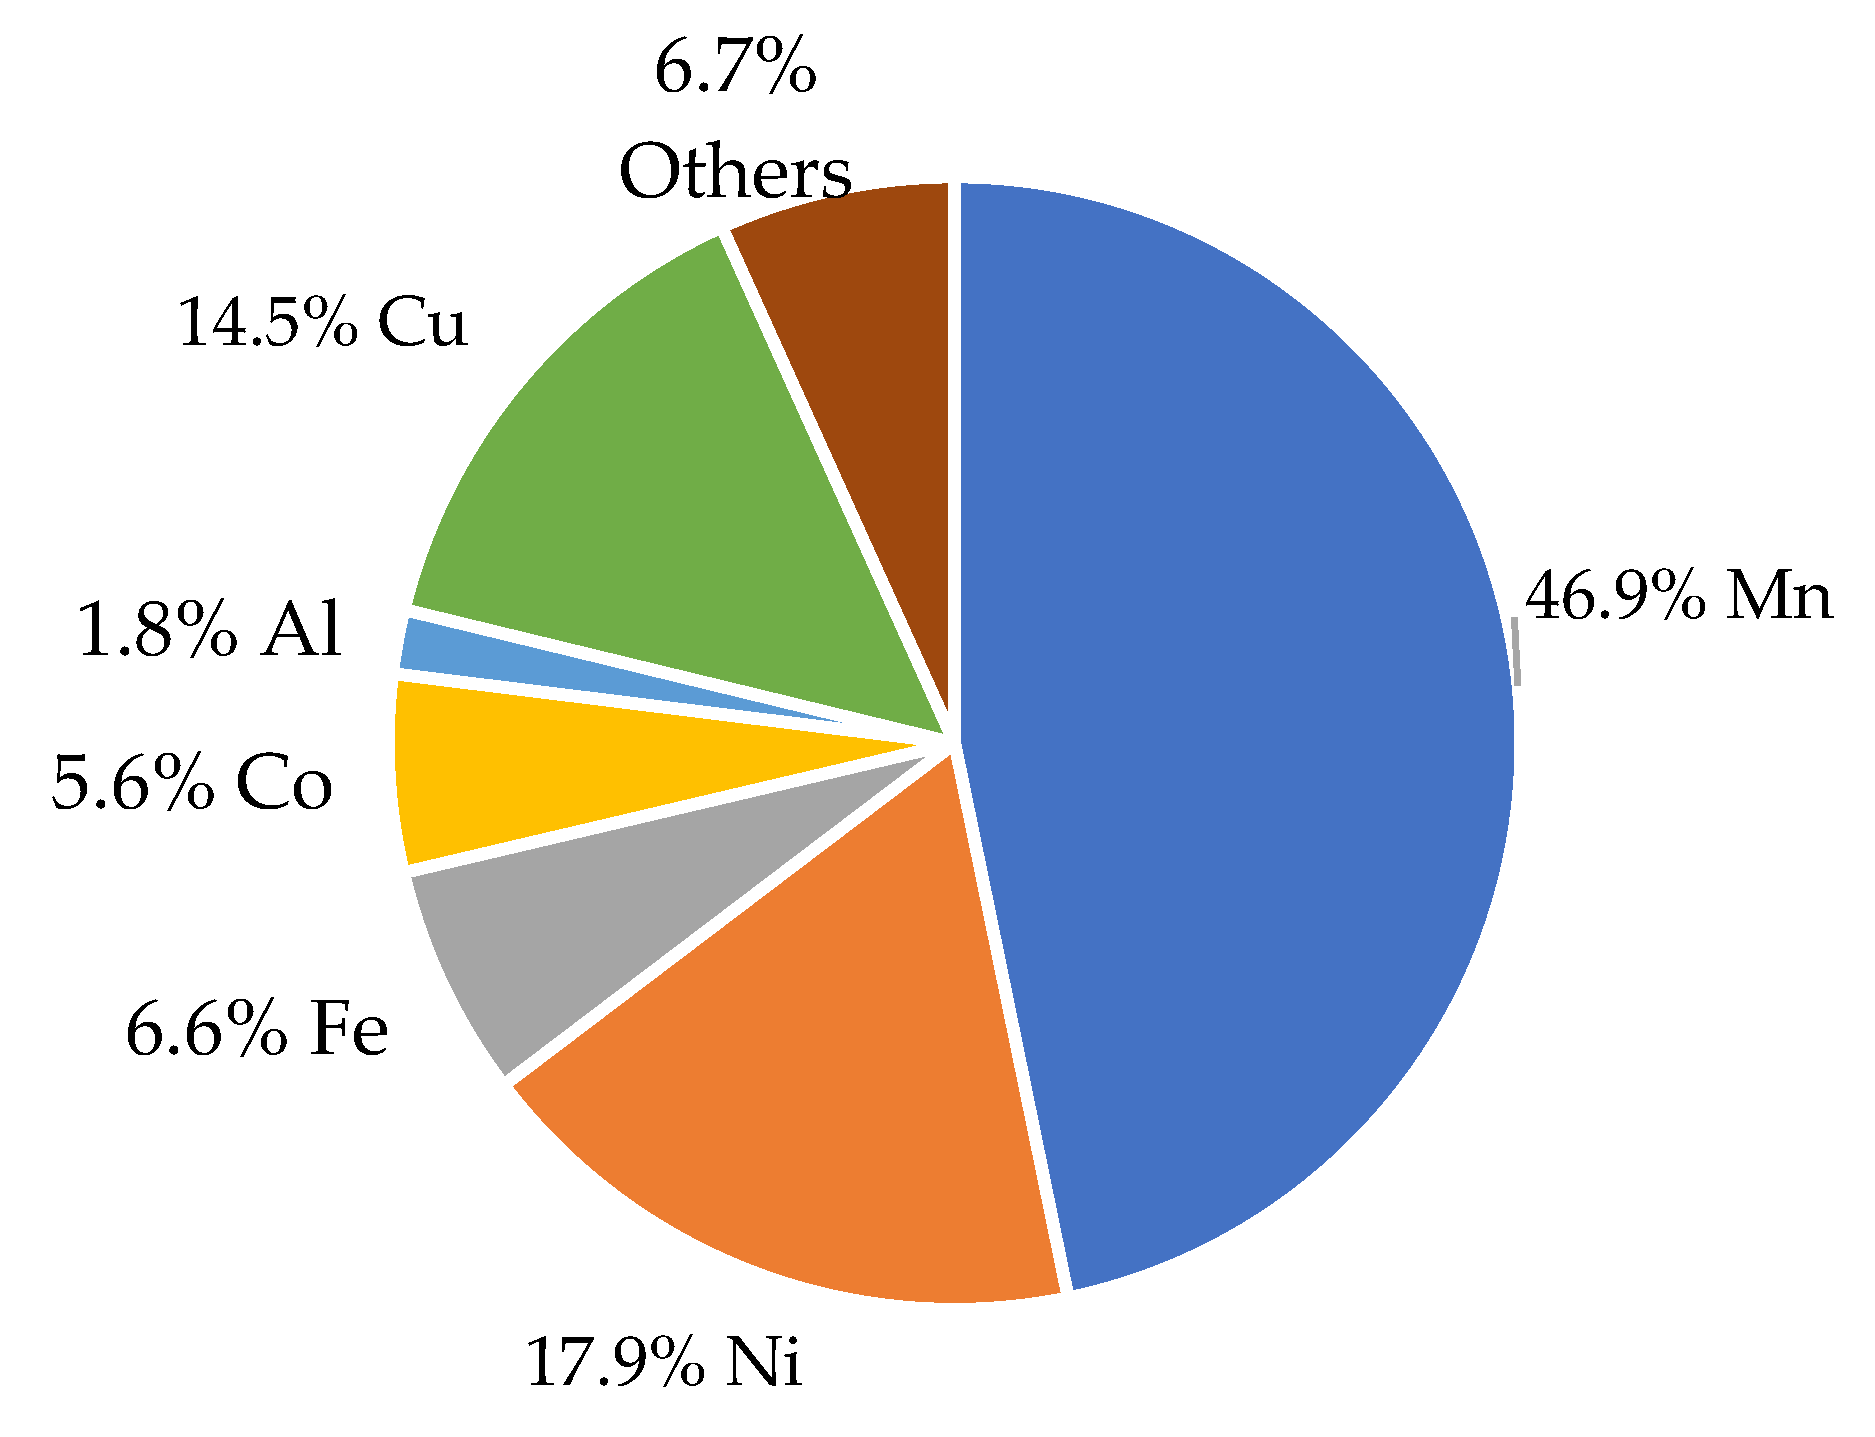
An XRF analysis was first carried out on the total black mass without treatment and then on the different particle size fractions for semi-quantitative determination of the elements such as nickel, manganese, cobalt, copper, and aluminum in black mass with three repetitions each time for higher accuracy (Table 2). The results have been chosen to be presented normalized and in element. Based on the XRF results, the major elements of the black mass were Mn, Ni, Cu, Fe, and Co at 46.8%, 17.9%, 14.5%, 6.6%, and 5.6%, respectively (Figure 4).
The normalized results of the XRF analysis of different particle size fractions of the black mass show that Mn, Ni, Fe, and Co were mostly on particles smaller than 100 μm. Al and Cu were mostly on particles coarser than 100 μm because Al and Cu are ductile and not easily reduced in size during pulverization [14,17].
Since the particle size distribution has a direct effect on the selection of separation techniques, key elements such as Mn, Ni, and Co were considered in different particle size fractions. Figure 5 represents the distribution of the Mn, Ni, and Co based on particle size, and it is obvious that more than 50% of Mn, 20% of Ni, and 7% of the Co were on particles smaller than 53 μm, approximately.
It can be seen (Figure 6) that the results are similar, yet not equal, as XRF analysis cannot measure light elements, and it is not accurate for the low-concentrate elements, 0.1 wt.%. So, considering the elements that XRF cannot measure, the differences will be much less. As XRF cannot measure light elements, the obtained total value (normalized) was used, which is another reason why the results are not the same. Indeed, the XRF analyses tended to overestimate certain elements (such as Co, Fe, and the total) and underestimate others (such as Al, Cu, and P) [14,17]. Moreover, its non-destructive nature, speed, and capacity to handle a diverse range of concentrations make it suitable for analyzing complex matrices found in black mass. So, for metals that exist in the black mass like Mn, Co, Cu, and Ni, XRF analysis, and light and low-concentrated elements like Li, ICP-OES analysis can be used [38].
More importantly, bulk analysis (e.g., XRF or ICP-OES) is used to validate the results of the automated mineralogy analysis. So, the combination of these two analyses for chemical and elemental analysis is recommended as black mass is highly heterogeneous in terms of size, shape, and density [39].

2.4. Compound Phases

The results of the XRD analysis indicate that the chemical elements determined were well-defined in three different Li metal oxide phases [14], such as triphylite, lithium nickel manganese, and lithium nickel cobalt oxide, in the investigated black mass (Table 3).

2.5. Scanning Electron Microscopy with Energy-Dispersive Spectroscopy (SEM-EDS)

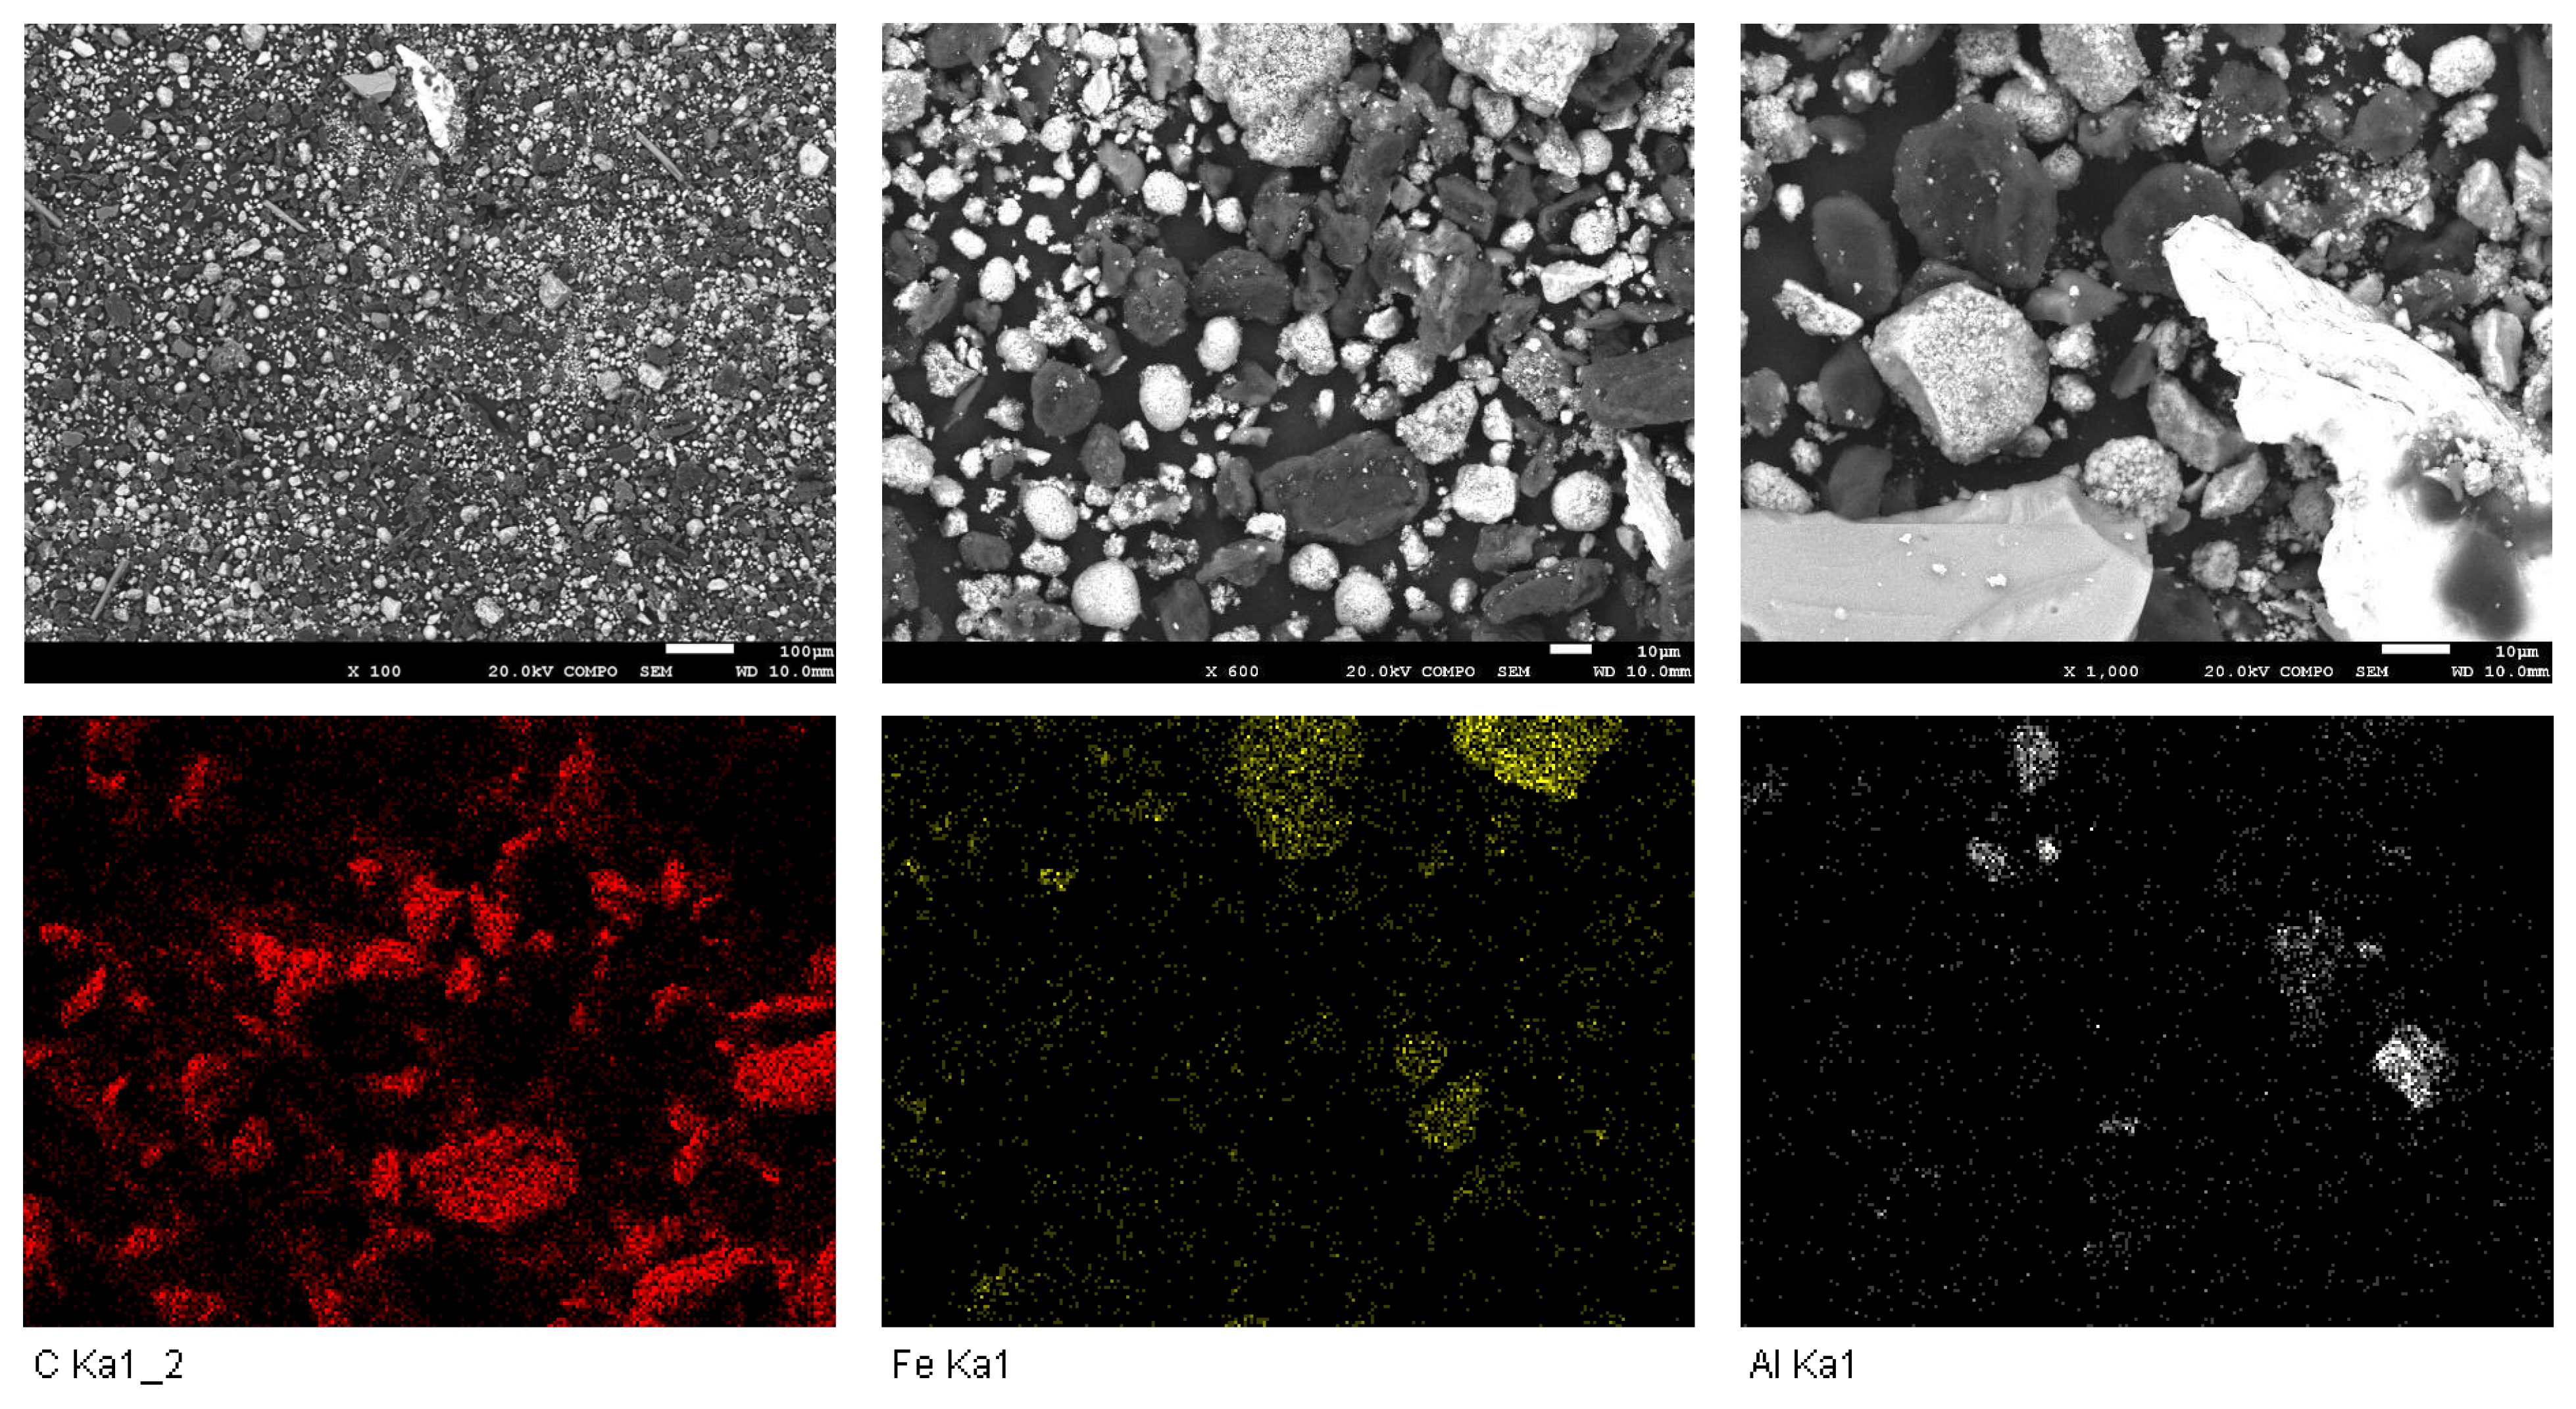
Studying the morphological structure of the black mass using SEM-EDS revealed that there were two types of particles: black particles and white particles [14]. Black particles refer to graphite, and white particles refer to the metals present in the black mass. It should be mentioned that, based on the results, most of the graphite particles were liberated from the metal particles. However, there were some metal particles on the surface of the graphite particles (Figure 7), which were found to be Co, Ni, and Mn, according to the SEM-EDS results, or Li, according to the laser-induced breakdown spectroscopy results. These results will be further explained.
In the following figures, the graphite particles can be identified, here called dense graphite. Fluorine (F) and phosphorus (P) were also identified on the surfaces of the black mass, which is seen as a fingerprint of the PVDF binder. The PVDF binder limited the beneficiation of the graphite from the metal oxides in the next steps, such as froth flotation, an effective mineral processing separation technique, since it relies on surface interactions [14].
For a better visual understanding of their distributions, the graphite, Fe, Al, Mn, Ni, and Cu were identified using different colors in SEM-EDS (Figure 7).
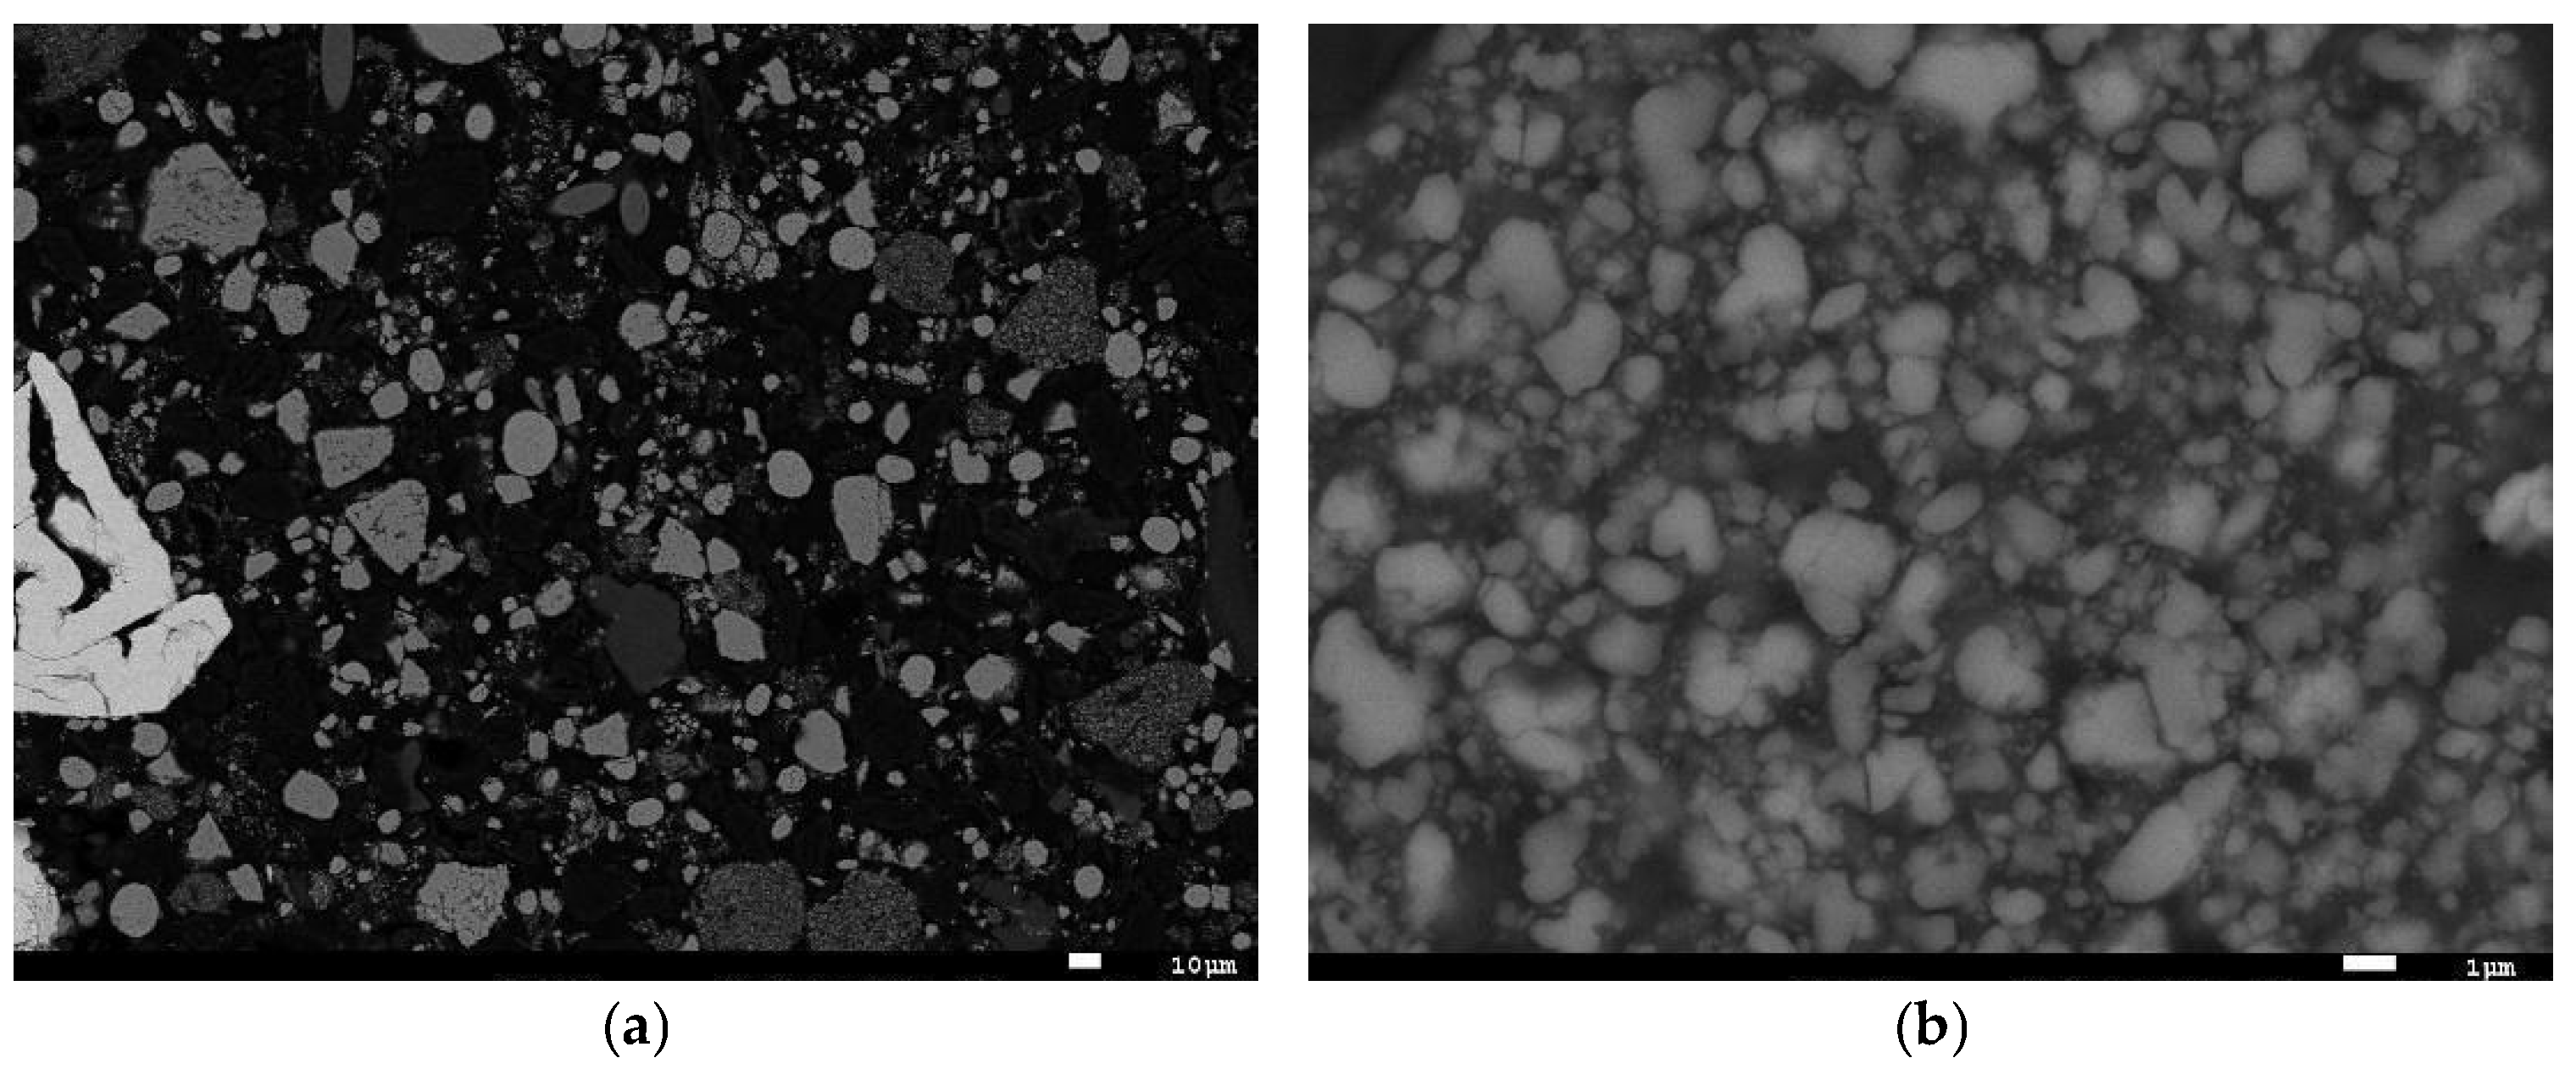
Based on the results of SEM-EDS analysis, it is concluded that the separation of the graphite from metal particles was achieved. To confirm the initial SEM-EDS results, polished black mass samples were prepared. After polishing, it was observed that the metal particles on the surface of the graphite particles had disappeared. Therefore, it can be concluded that they existed on the surface of the graphite. To sum up, these findings validate the initial SEM-EDS findings, suggesting that graphite particles and metal particles are liberated particles and not associated with each other (Figure 8). Moreover, metal particles are partially liberated and partially agglomerated. It can be seen that there were more liberated metal particles than agglomerated ones. However, some agglomerated particles showed the existence of C, P, Mn, Ni, and Fe together. Figure 8b shows a magnified image of one agglomerated particle, proving that some metals and graphite particles were linked because of the binder. The results of the laser-induced breakdown spectroscopy analysis carried out on the black mass sample also confirm these data. Based on this analysis, more than 50% of the particles on the black particles were Mn. The existence of Li on both the graphite and metal particles is also shown. Therefore, this analysis also confirms the agglomeration of the metals and graphite because of the existence of the binder. It should be noted that the Si was due to contamination from the polisher.

2.6. Laser-Induced Breakdown Spectroscopy

The purpose of performing laser-induced breakdown spectroscopy was to prepare a map of all the particles, especially Li. Since the distribution of the Li particles was not detectable using SEM-EDS, we decided to combine these two methods to determine the distribution of all elements. To determine the distribution of the Li particles, laser-induced breakdown spectroscopy was used to analyze 100 different particles—50 black particles and 50 metallic particles (Figure 9). For laser-induced breakdown spectroscopy analysis, it is necessary to use a laser spot of at least 25 µm to obtain sufficient sensitivity.
The number of particles (as a percentage) that contained the elements Cu, Fe, Li, Mg, and Mn are described in Table 4. These results do not express the concentration of analytes. This means that the results are expressed as the signal intensity, not as the concentrations. To express the results as the concentrations, matrix-matched standards with known contents are needed.
The results confirm the existence of the Li particles in both the graphite and metal particles. It can be concluded that the Li particles were distributed on the surface of all particles (Figure 10). Furthermore, the results reveal that the graphite particles had a higher Mn content than the metal particles, with 58% and 16%, respectively. This can be explained in two ways: Firstly, because the analysis was carried out on the surface of the particles, it is probable that the analysis was focused on the Mn particles that existed on the surface of the graphite particles, as SEM-EDS revealed the metal particles on the surface of the graphite particles.
Secondly, the metal analysis was probably focused on other metal particles, such as Ni and Co, rather than the Mn particles. Therefore, less Mn was determined in the metal particles, with 16%. Another possibility is that the Mn concentration was close to the limit of detection, so it could sometimes be seen and sometimes not (Table 4). The elements Na, K, C, and H were detected in the blank; therefore, they were not considered elemental components of the sample. It should be mentioned that Ni and Co are less sensitive and cannot be seen. Therefore, they are not reported in the results (Figure 10).

2.7. Thermogravimetry–Differential Thermal Analysis (TG/DTA)

The binder will limit the beneficiation of graphite from the metal oxides in the following steps. Therefore, TG/DTA analysis was performed to understand the thermal behavior of the black mass for further pretreatment steps. Thermal treatments are a common pretreatment before froth flotation.
The TG/DTA results of the black mass samples varied depending on their composition, but a gradual decrease was a common pattern among them because of the loss of graphite. Organic compound decomposition can cause a gradual decrease in mass up to 650 °C, while metal oxide reduction can cause a sharp increase in mass at higher temperatures [14]. In this sample, the total mass loss was about 17.35%. It can be seen from the decline in the decomposition curve (Figure 11) that the first stage of 25–110 °C corresponded to the evaporation and decomposition of moisture, electrolytes, and other volatile organics. Then, 110–227.8 °C corresponded to the decomposition of LiFe (PO4). The next stage, at 227.8–480 °C, corresponded to the decomposition of the binder, such as polyvinylidene fluoride (PVDF). Stage IV, at 480–801 °C corresponded to the reduction of cathode to graphite. The reduction of Ni and Co theoretically started at 440 °C and 500 °C, respectively, by the reduction of Mn r at 800 °C. The latter is more difficult due to its standard Gibbs free energy of formation (−Δ G°), making its oxide form relatively stable. However, it can be reduced with graphite at higher temperatures (>550). Theoretically, Li2O is the most difficult oxide phase to reduce, as it has the lowest Gibbs energy from the oxides present [15].

2.8. Beneficiation Flowsheet

Based on the results of this characterization, the flowsheet for the beneficiation of this black mass is proposed (Figure 12). According to the normalized XRF analysis of different particle size distributions of the black mass, Mn, Ni, Fe, and Co are mostly on the particles smaller than 200 μm. However, Al and Cu are mostly on particles coarser than 200 μm. So, it is suggested that black mass with coarser particle size (0.2–1 mm) go to the liberation process to reduce sizes for beneficiation of the Al and Cu. In addition, black mass with a size range of 0.053–0.2 mm will go to the froth flotation processes for beneficiation of the Mn, Ni, Fe, and Co, as they are major elements in this size range. Finally, a black mass with a size range of <0.053 mm will go through the froth flotation process after the agglomeration process, froth flotation is a widely used process for extracting minerals from ore resources, such as graphite from gangue minerals like quartz or carbonate [10].
As a binder is problematic in the beneficiation of the graphite from metal oxides, some pre-treatments, such as thermal [14], chemical, and physical, should be carried out before the separation stage to develop alternative processes and sustainable waste management strategies for batteries [11,14,25,40,41,42,43]. A pulsed electric field (PEF) is also suggested as a pre-treatment step before graphite separation from the metal oxides using froth flotation.

3. Materials and Methods

3.1. Sample Preparation

In this study, a black mass sample was received from an industrial recycling plant where electric scooter batteries are treated using dry mechanical processes, such as comminution, sieving, magnetic separators, and gravity concentration. This work focuses on the output from these stages, with black mass samples with fractions under 1000 μm.

3.2. Methodology

First, the size distribution was determined using two different methods: sieving for particles under 1000 μm and laser scattering analysis for particles under 53 μm. The LA-350 laser scattering particle size distribution (PSD) analyzer was used for the fine samples. For the material under 1000 μm, the following sieve openings were used: 1000, 500, 200, 100, and 53 μm. The sieving was repeated 3 times to obtain higher accuracy. Then, the black mass samples were subjected to comprehensive characterization using qualitative and quantitative analytic techniques.
To determine the chemical and elemental composition of the black mass, we decided to use a combination of the X-ray fluorescence (XRF) Epsilon 1 model from Malvern Panalytical, Malvern, Almelo, The Netherland, and inductively coupled plasma–optical emission spectroscopy (ICP-OES) using the 5100 ICP-OES from Agilent Technologies (Santa Clara, CA, USA) after digestion. XRF is used for the qualitative and quantitative determination of elements such as nickel, manganese, cobalt, fluorine, copper, phosphorus, and aluminum in black masses. But ICP-OES is another highly effective technique for analyzing trace elements such as lithium in black masses, with high sensitivity and precision, which XRF is not able to achieve. For XRF analysis, two kinds of samples were prepared—powder and probate. Each measurement took 10 min, and the components were determined as elements in the program created for black mass analysis. The analysis was carried out with three repetitions to ensure the accuracy of the results.
Phase content and crystalline structure studies were performed using X-ray diffraction (XRD) analysis with the following equipment: D8 Advance, Bruker (graphite monochromator, automatic gap, Kα-radiation of Cu at λ = 1.54061 Å, powered at 45 kV–40 mA, scanning range of 4–100° with a 0.017° 2θ step scan and a 50 s measuring time). The identification and semiquantitative evaluation of the phases were conducted using PANanalytical X’Pert HighScore software, Version 2.0.1 (PANanalytical, Almelo, The Netherlands).
To determine the elemental distribution and characterize the mineralogy, scanning electron microscopy (SEM) paired with energy-dispersive spectroscopy (EDS) was carried out using a field emission scanning electron microscope (FESEM)(JSM 7001F-JEOL LTD Chome-1-2, Tokyo, Japan, and energy-dispersive spectrometer (EDS; Oxford Ultim model max 20m2, Oxford Instruments Abingdon OX13 5QX, Oxford, UK). To confirm the results, SEM-EDS analysis was carried out on polished samples prepared using resin.
Qualitative analysis of a catalyst sample was carried out using laser-induced breakdown spectroscopy to determine the distribution of the Li particles. We decided to conduct this analysis since lithium is a light element and not detectable with an SEM-EDS analyzer. So, 100 different particles were analyzed, including 50 black particles and 50 metallic particles. Laser-induced breakdown spectroscopy was performed using the J200–Applied Spectra Inc., Riverside Pkwy, West Sacramento, CA, USA, at the University Institute of Engineering Research of Aragon (I3A), University of Zaragoza.
Differential thermal analysis and thermogravimetry (DTA-TG) were carried out using the NETZSCH instrument, STA 409 C/CD, TASCH 414/3 model (Netzsch, Selb, Germany) at the University of Barcelona. The analyses were performed within a temperature range of 25–900 °C under a nitrogen atmosphere, at a constant flow rate of 80 mL/min, in a platinum crucible, and at a heating rate of 10 °C/min. The amount of sample analyzed was ∼62 mg. DTA-TG was conducted to understand the thermal behavior of the black mass under different temperatures for further pretreatment steps before separation techniques, such as froth flotation, were applied.
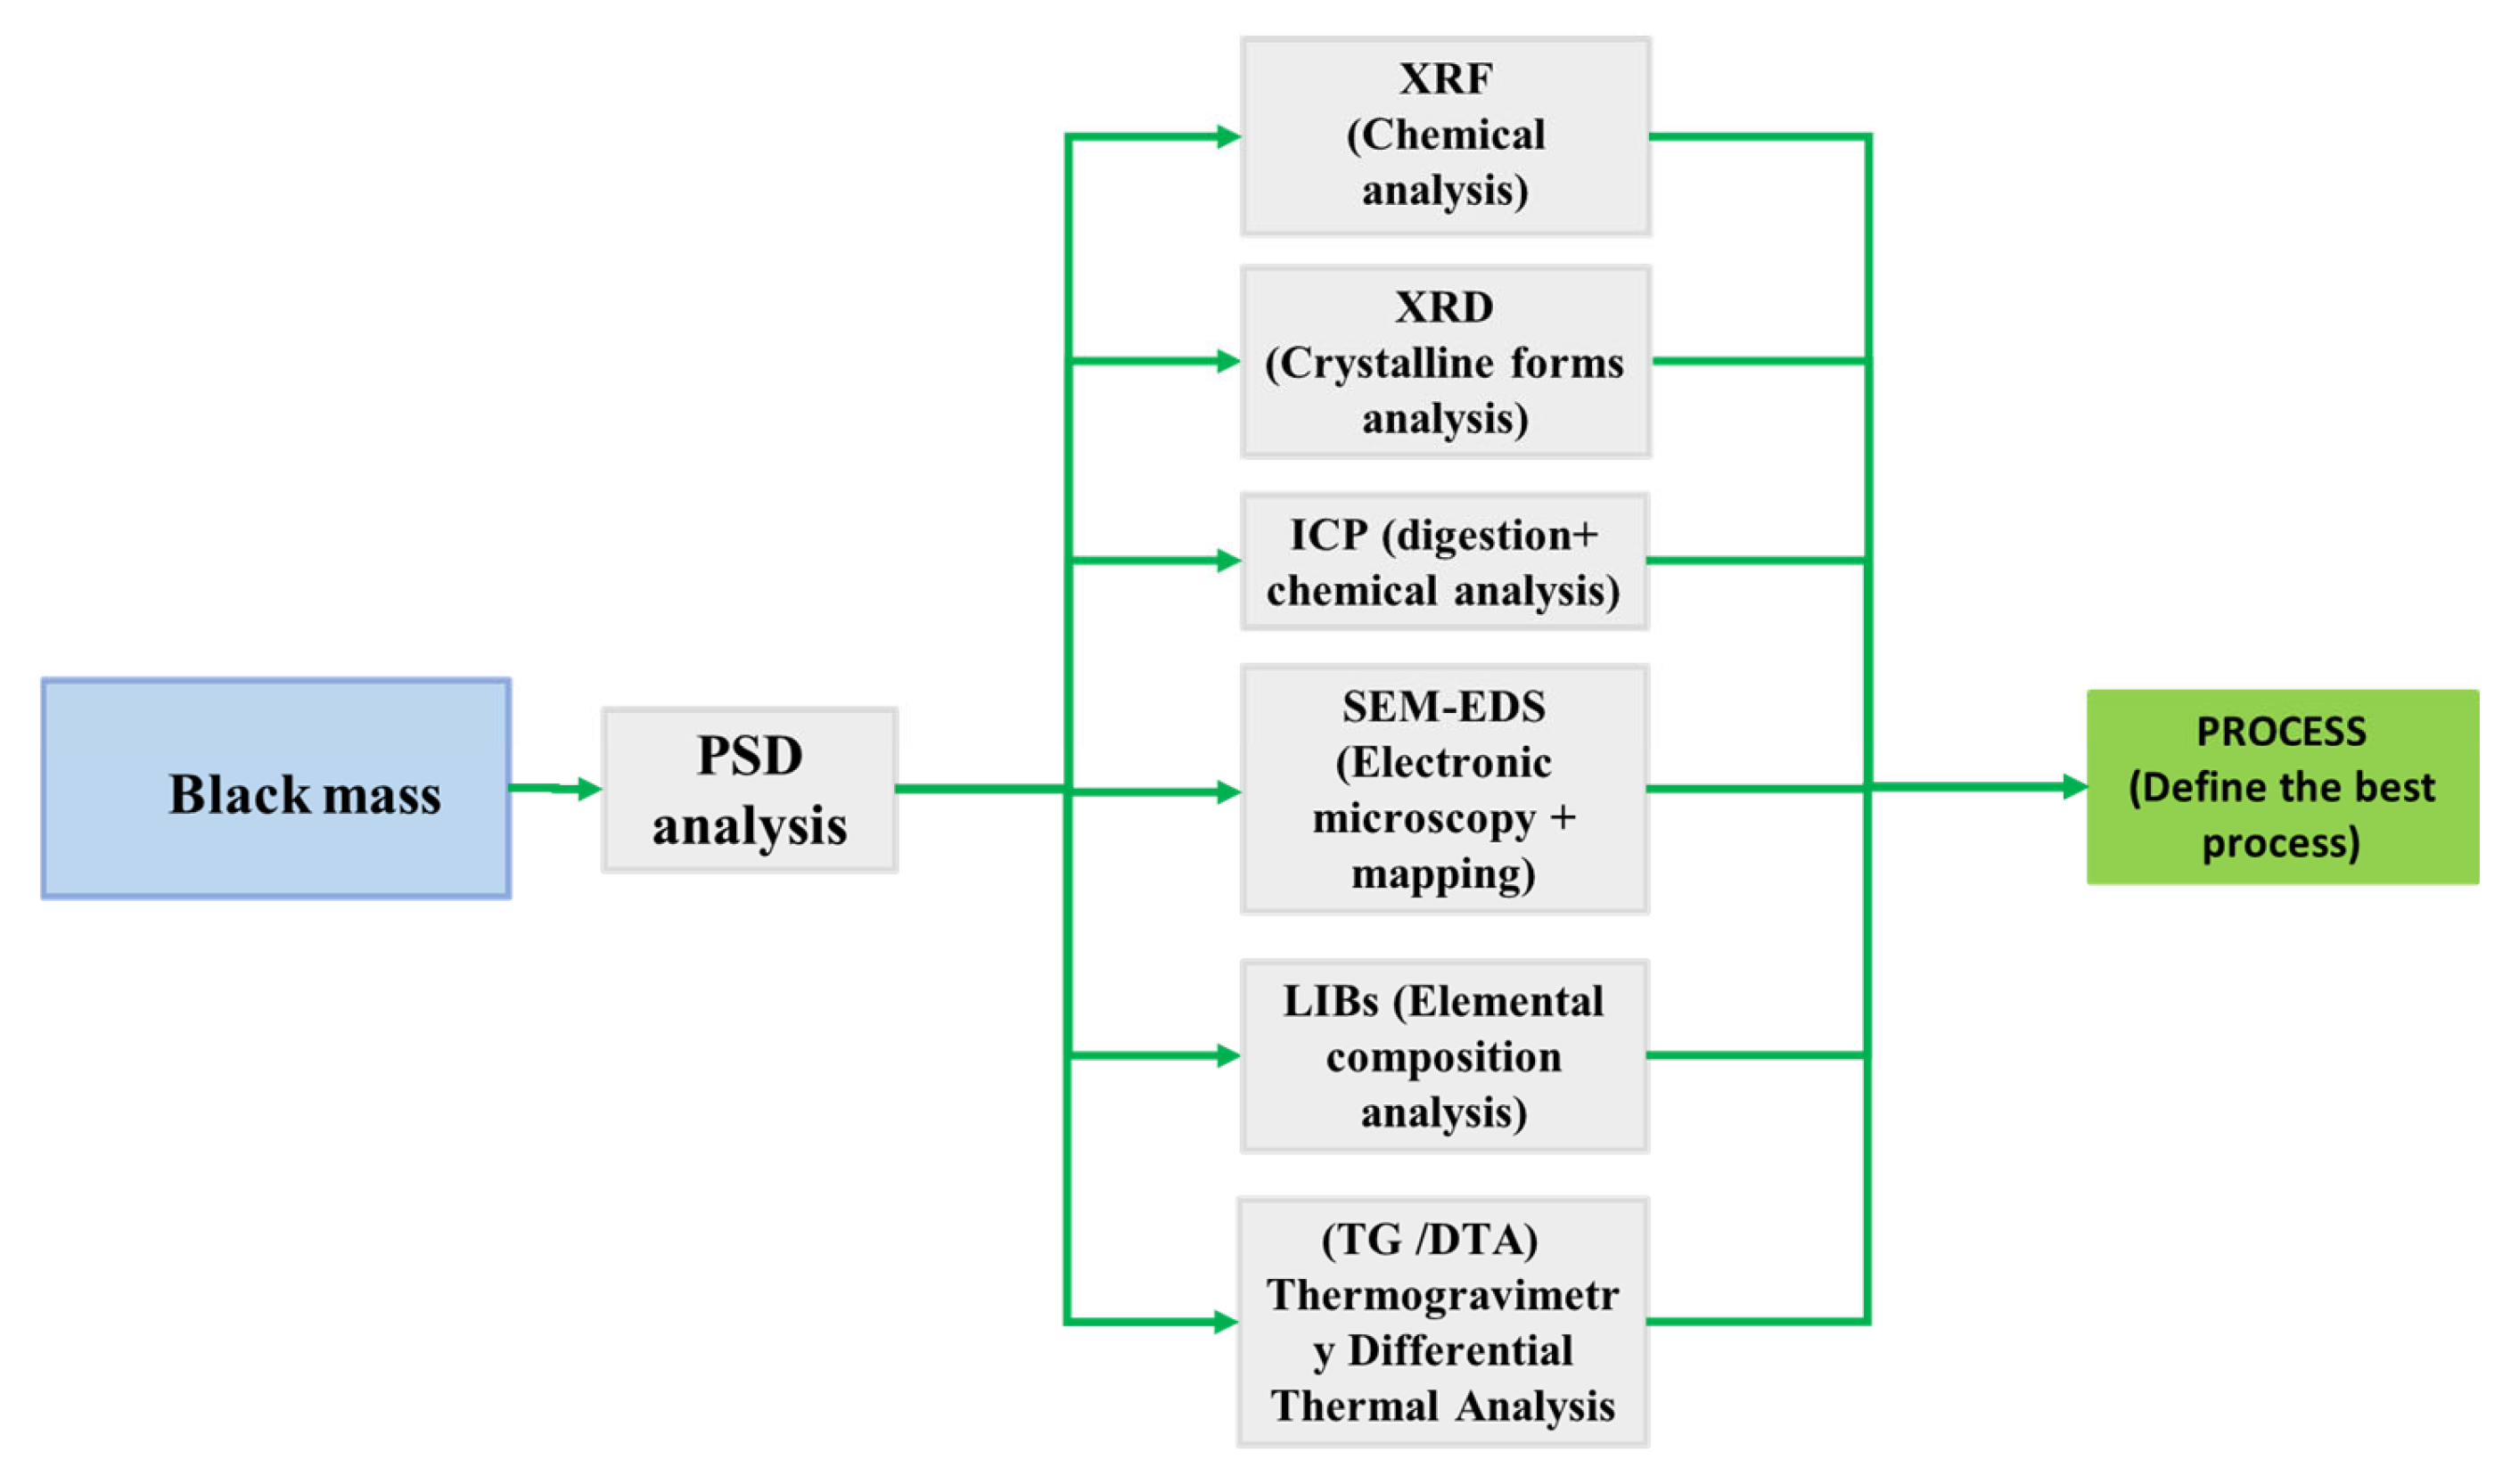
The results of all these analyses (Figure 13) present complete information regarding the particle contents, distribution, structure, and liberation degree, which is significant for establishing further beneficiation processes using mineral processing techniques for key materials such as graphite, Ni, Mn, and Co.

4. Conclusions

In this study, a type of industrial black mass was fully studied to determine not only the liberation of each particle for further beneficiation steps but also the chemical composition and morphological and mineralogical structure. This methodology is proposed for complex secondary materials, such as black masses, since several methods are necessary to completely determine all compositions. First, the particle size distribution analysis revealed that about 71.1% of the black mass particles were under 100 μm, and 28.9% were bigger than 100 μm. In addition, the laser scattering analysis showed that 90% of the fine particles were under 27.16 μm and 10% were under 6.84 μm. Secondly, a characterization of the different particle size fractions of the black mass indicated that Mn, Ni, Fe, and Co were mostly on the particles smaller than 100 μm, and more than approximately 45% of Mn, 15% of Ni, and 5% of Co were on the particles smaller than 53 μm, but Al and Cu were mostly on particles bigger than 100 μm. Based on the XRF and PSD analyses, in further separation steps, it would probably be better to limit the particle size ranges. For example, beneficiation of Mn, Ni, Fe, and Co with 53–100 μm and Cu with 100–200 μm could be achieved. For particles bigger than 400 μm, the comminution stage, and for particles smaller than 53 μm, an agglomeration process should be used.
Lastly, the combination of SEM and laser-induced breakdown spectroscopy analysis provided satisfying results regarding the distribution of all particles, including Li. Most of the graphite particles were liberated from the metal particles. However, there were some metal particles on the surface of the graphite particles that were found to be Co, Ni, and Mn, according to the SEM-EDS results, or Li, according to the laser-induced breakdown spectroscopy results. Further studies could develop a new methodology to polish the surfaces of free graphite particles so they could be more easily separated for high recovery.
The purpose of this work is to follow the objectives of the LIBs recycling by proposing a flowsheet for beneficiation, based on the characterization results, to develop alternative processes based on different particle size ranges to separate the graphite and metals with high recovery for further pyrometallurgical and hydrometallurgical processes. The LIB recycling goal is to achieve a sustainable, efficient, and low-cost system to process spent LIBs on an industrial scale as well as achieve sustainability in the global automotive and renewable energy sectors, but many efforts are still needed to translate laboratory methods to industrial plants.

Author Contributions

Conceptualization, M.P.; methodology, C.H.S. and J.O.M.; software, M.P.; validation, M.P., C.H.S. and J.O.M.; formal analysis, C.H.S., J.O.M., P.A. and H.A.; investigation, M.P.; resources, C.H.S. and J.O.M.; data curation, M.P.; writing—original draft preparation, M.P.; writing—review and editing, C.H.S., J.O.M., H.A., P.A., C.V. and J.L.C.P.; visualization, M.P.; supervision, C.H.S., J.O.M., H.A. and P.A.; project administration, M.P., J.O.M., C.H.S. and C.V.; funding acquisition, C.H.S., J.O.M., C.V. and J.L.C.P. All authors have read and agreed to the published version of the manuscript.

Funding

This research was funded by Agencia Estatal de Investigación del Ministerio de Ciencia e Innovación, grant number: PID2021-127028OB-I00.

Data Availability Statement

Data are contained within the article.

Acknowledgments

The authors would like to thank the Agencia Estatal de Investigación del Ministerio de Ciencia e Innovación for the funding received. The authors belong to the 2021-SGR 01041 (RiiS) and 2021-SGR 00596 (R2EM) research groups financed by the AGAUR, Generalitat de Catalunya.

Conflicts of Interest

The authors declare no conflicts of interest.

References

  1. Yurramendi, Y.; Hidalgo, J.; Siriwardana, A. A Sustainable Process for the Recovery of Valuable Metals from Spent Lithium Ion Batteries by Deep Eutectic Solvents Leaching. Mater. Proc. 2021, 5, 100. [Google Scholar] [CrossRef]
  2. Alcaraz, L.; Díaz-Guerra, C.; Calbet, J.; López, M.L.; López, F.L. Obtaining and Characterization of Highly Crystalline Recycled Graphites from Different Types of Spent Batteries. Materials 2022, 15, 3246. [Google Scholar] [CrossRef] [PubMed]
  3. Ma, X.; Ge, P.; Wang, L.; Sun, W.; Bu, Y.; Sun, M.; Yang, Y. The Recycling of Spent Lithium-Ion Batteries: Crucial Flotation for the Separation of Cathode and Anode Materials. Molecules 2023, 28, 4081. [Google Scholar] [CrossRef] [PubMed]
  4. Vanderbruggen, A.; Gugala, E.; Blannin, R.; Bachmann, K.; Serna-Guerrero, R.; Rudolph, M. Automated mineralogy as a novel approach for the compositional and textural characterization of spent lithium-ion batteries. Miner. Eng. 2021, 169, 106924. [Google Scholar] [CrossRef]
  5. Bhar, M.; Ghosh, S.; Krishnamurthy, S.; Kaliprasad, Y.; Martha, S.K. A review on spent lithium-ion battery recycling: From collection to black mass recovery. R. Soc. Chem. Sustain. 2023, 1, 1150–1167. [Google Scholar] [CrossRef]
  6. Zielinski, M.; Cassayre, L.; Floquet, P.; Macouin, M.; Destrac, P.; Coppey, N.; Foulet, C.; Biscans, B. A multi-analytical methodology for the characterization of industrial samples of spent Ni-MH battery powders. Waste Manag. 2020, 118, 677–687. [Google Scholar] [CrossRef]
  7. Donnelly, L.; Pirrie, D.; Power, M.; Corfe, I.; Kuva, J.; Lukkari, S.; Lahaye, Y.; Liu, X.; Dehaine, Q.; Jolis, E.M.; et al. The Recycling of End-of-Life Lithium-Ion Batteries and the Phase Characterisation of Black Mass. Recycling 2023, 8, 59. [Google Scholar] [CrossRef]
  8. Broussely, M.; Pistoia, G.E. Chapter 14: Battery Collection and Recycling. In Industrial Applications of Batteries. From Cars to Aerospace and Energy Storage; Elsevier B.V.: Amsterdam, The Netherlands, 2007; Available online: https://www-sciencedirect-com.recursos.biblioteca.upc.edu/book/9780444521606/industrial-applications-of-batteries (accessed on 13 February 2007).
  9. Donnelly, L.; Pirrie, D.; Power, M.; Corfe, I.J.; Kuva, J.; Lukkari, S.; Lahaye, Y.; Liu, X.; Butcherda, A.R. The sampling and phase characterization of black mass. IMPublications Open 2022, 11, 397–409. [Google Scholar] [CrossRef]
  10. Vanderbruggen, A.; Sygusch, J.; Rudolph, M.; Serna-Guerrero, R. A contribution to understanding the flotation behavior of lithium metal oxides and spheroidized graphite for lithium-ion battery recycling. Colloids Surf. A Physicochem. Eng. Asp. 2021, 626, 127111. [Google Scholar] [CrossRef]
  11. Vanderbruggen, A.; Hayagan, N.; Bachmann, K.; Ferreira, A.; Werner, D.; Horn, D.; Peuker, U.; Serna-Guerrero, R.; Rudolph, M. Lithium-Ion Battery Recycling Influence of Recycling Processes on Component Liberation and Flotation Separation Efficiency. ACS EST Eng. 2022, 2, 2130–2141. [Google Scholar] [CrossRef]
  12. Dadé, M.; Wallmach, T.; Laugier, O. Detailed Microparticle Analyses Providing Process Relevant Chemical and Microtextural Insights into the Black Mass. Minerals 2022, 12, 119. [Google Scholar] [CrossRef]
  13. Passerini, S.; Barelli, L.; Baumann, M.; Peters, J.F.; Weil, M. Emerging Battery Technologies to Boost the Clean Energy Transition: Cost, Sustainability, and Performance Analysis; The Materials Research Society Series; Springer: Gewerbestrasse, Switzerland, 2024; ISSN 2730-7360. ISBN 978-3-031-48358-5. [Google Scholar] [CrossRef]
  14. Mousa, E.; Hu, X.; Ånnhagen, L.; Ye, G.; Cornelio, A.; Fahimi, A.; Bontempi, E.; Frontera, P.; Badenhorst, C.; Cláudia Santos, A.; et al. Characterization and Thermal Treatment of the Black Mass from Spent Lithium-Ion Batteries. Sustainability 2023, 15, 15. [Google Scholar] [CrossRef]
  15. Arturo Gomez-Moreno, L.; Klemettinen, A.; Serna-Guerrero, R. A simple methodology for the quantification of graphite in end-of-life lithium-ion batteries using thermogravimetric analysis. Science 2023, 26, 107782. [Google Scholar] [CrossRef]
  16. Traore, N.; Kelebek, S. Characteristics of Spent Lithium Ion Batteries and Their Recycling Potential Using Flotation Separation: A Review. Miner. Process. Extr. Metall. Rev. 2023, 44, 231–259. [Google Scholar] [CrossRef]
  17. Renier, O.; Pellini, A.; Spooren, J. Advances in the Separation of Graphite from Lithium Iron Phosphate from End-of-Life Batteries Shredded Fine Fraction Using Simple Froth Flotation. Batteries 2023, 9, 589. [Google Scholar] [CrossRef]
  18. Mennik, F.; Ilkyaz Dinç, N.; Burat, B. Selective recovery of metals from spent mobile phone lithium-ion batteries through froth flotation followed by magnetic separation procedure. Results Eng. 2023, 17, 100868. [Google Scholar] [CrossRef]
  19. Velázquez-Martínez, O.; Valio, J.; Santasalo-Aarnio, A.; Reuter, M.; Serna-Guerrero, R. A Critical Review of Lithium-Ion Battery Recycling Processes from a Circular Economy Perspective. Batteries 2019, 5, 68. [Google Scholar] [CrossRef]
  20. Chen, W.; Ho, H. Recovery of Valuable Metals from Lithium-Ion Batteries NMC Cathode Waste Materials by Hydrometallurgical Methods. Metals 2018, 8, 321. [Google Scholar] [CrossRef]
  21. Peschel, P.; Wickeren, S.V.; Preibisch, Y.; Naber, V.; Werner, D.; Frankenstein, L.; Horsthemke, F.; Peuker, U.; Winter, M.; Nowak, S. Comprehensive Characterization of Shredded Lithium-Ion Battery Recycling Material. Chem.-A Eur. J. 2022, 28, e202200485. [Google Scholar]
  22. Rinne, M.; Aromaa-Stubb, R.; Elomaa, H.; Porvali, A.; Lundström, M. Evaluation of hydrometallurgical black mass recycling with simulation-based life cycle assessment. Int. J. Life Cycle Assess. 2024, 29, 1582–1597. [Google Scholar] [CrossRef]
  23. Sommerfeld, M.; Vonderstein, C.; Dertmann, C.; Klimko, J.; Orác, D.; Miškufová, A.; Havlík, T.; Friedrich, B. A Combined Pyro- and Hydrometallurgical Approach to Recycle Pyrolyzed Lithium-Ion Battery Black Mass Part 1: Production of Lithium Concentrates in an Electric Arc Furnace. Metals 2020, 10, 1069. [Google Scholar] [CrossRef]
  24. Królicka, A.; Maj, A.; Lój, G. Application of Laser-Induced Breakdown Spectroscopy for Depth Profiling of Multilayer and Graded Materials. Materials 2023, 16, 6641. [Google Scholar] [CrossRef]
  25. Vanderbruggen, A.; Sales, A.; Ferreira, A.; Rudolph, M.; Serna-Guerrero, R. Improving Separation Efficiency in End-of-Life Lithium-Ion Batteries Flotation Using Attrition Pre-Treatment. Minerals 2022, 12, 72. [Google Scholar] [CrossRef]
  26. Smyrek, P.; Proll, J.; Seifert, H.J.; Pfleging, W. Laser-Induced Breakdown Spectroscopy of Laser-Structured Li(NiMnCo)O2 Electrodes for Lithium-Ion Batteries. J. Electrochem. Soc. 2016, 163, AA26. [Google Scholar]
  27. Imashuku, S.; Taguchi, H.; Fujieda, S.; Suzuki, S.; Wagatsuma, K. Three-dimensional lithium mapping of graphite anode using laser-induced breakdown spectroscopy. Electrochim. Acta 2019, 293, 78–83. [Google Scholar] [CrossRef]
  28. Smyrek, P.; Bergfeldt, T.; Jürgen Seifert, H.; Pfleging, W. Laser-induced breakdown spectroscopy for the quantitative measurement of lithium concentration profiles in structured and unstructured electrodes. J. Mater. Chem. A 2019, 7, 5656–5665. [Google Scholar] [CrossRef]
  29. Mousa, E.; Hu, X.; Ye, G. Effect of Graphite on the Recovery of Valuable Metals from Spent Li-Ion Batteries in Baths of Hot Metal and Steel. Recycling 2022, 7, 5. [Google Scholar] [CrossRef]
  30. Kandioller, W.; Theiner, J.; Kepplera, B.K.; Kowol, C.R. Elemental analysis: An important purity control but prone to manipulations. Inorg. Chem. Front. 2022, 9, 412–416. [Google Scholar] [CrossRef]
  31. Gazulla, M.F.; Ventura, M.G.; Andreu, C.; Gilabert, J.; Orduña, M.; Rodrigo, M. Praseodymium oxides. Complete characterization by determining oxygen content. Microchem. J. 2019, 148, 291–298. [Google Scholar] [CrossRef]
  32. Hammesa, K.; Smernik, R.J.; Skjemstad, J.O.; Schmid, M.W.I. Characterisation and evaluation of reference materials for black carbon analysis using elemental composition, colour, BET surface area and 13C NMR spectroscopy. Appl. Geochem. 2008, 23, 2113–2122. [Google Scholar] [CrossRef]
  33. Panitz, J.-C.; Joho, F.; Novák, P. In Situ Characterization of a Graphite Electrode in a Secondary Lithium-Ion Battery Using Raman Microscopy. Appl. Spectrosc. 1999, 53, 1188–1199. [Google Scholar] [CrossRef]
  34. Sandmann, D.; Haser, S.; Gutzmer, J. Characterisation of graphite by automated mineral liberation analysis. Miner. Process. Extr. Metall. Trans. Inst. Min. Metall. 2014, 123, 184–189. [Google Scholar] [CrossRef]
  35. Tucureanu, V.; Matei, A.; Avram, A.M. FTIR spectroscopy for carbon family study. Crit. Rev. Anal. Chem. 2016, 46, 502–520. [Google Scholar] [CrossRef] [PubMed]
  36. Gaudin, A.M. Flotation; McGRAW-HILL Book Company, Inc.: New York, NY, USA; London, UK, 1922. [Google Scholar]
  37. Gupta, A.; Yan, D.S. Mineral Processing Design and Operations: An Introduction; Elsevier: Amsterdam, The Netherlands, 2006. [Google Scholar]
  38. Badenhorst, C.; Kuzniarska-Biernacka, I.; Guedes, A.; Mousa, E.; Ramos, V.; Rollinson, G.; Ye, G.; Valentim, B. Recovery of Graphite from Spent Lithium-Ion Batteries. Recycling 2023, 8, 79. [Google Scholar] [CrossRef]
  39. Vanderbruggen, A. Lithium-Ion Batteries Recycling with Froth Flotation—A Study on Characterization and Liberation Strategies. Doctoral Thesis, Aalto University, Espoo, Finland, 2022. [Google Scholar] [CrossRef]
  40. Ebin, B.; Petranikova, M.; Ekberg, C. Physical separation, mechanical enrichment and recycling-oriented characterization of spent NiMH batteries. J. Mater. Cycles Waste Manag. 2018, 20, 2018–2027. [Google Scholar] [CrossRef]
  41. Sahivirta, H.; Wilson, B.P.; Lundstrom, M.; Serna-Guerrero, R. A study on recovery strategies of graphite from mixed lithium-ion battery chemistries using froth flotation. Waste Manag. 2024, 180, 96–105. [Google Scholar] [CrossRef]
  42. Hong, G.; Park, H.; Gomez-Flores, A.; Kim, H.; Lee, J.M.; Lee, J. Direct flotation separation of active materials from the black mass of lithium nickel cobalt manganese oxides-type spent lithium-ion batteries. Sep. Purif. Technol. 2024, 336, 126327. [Google Scholar] [CrossRef]
  43. Premathilake, D.S.; Botelho Junior, A.B.; Tenório, J.A.S.; Espinosa, D.C.R.; Vaccari, M. Designing of a Decentralized Pretreatment Line for EOL-LIBs Based on Recent Literature of LIB Recycling for Black Mass. Metals 2023, 13, 374. [Google Scholar] [CrossRef]
Figure 1. The results of three repetitions of wet sieving to determine the particle size distribution of the black mass.
Recycling 10 00054 g001
Figure 2. The results of the particle size distribution (PSD) of the black mass (<53 microns) using laser scattering.
Recycling 10 00054 g002
Figure 3. Chemical composition of the black mass using ICP-OES.
Recycling 10 00054 g003
Figure 4. The normalized major elements of the black mass in %.
Recycling 10 00054 g004
Figure 5. Mn, Ni, and Co distribution of the black mass based on particle size.
Recycling 10 00054 g005
Figure 6. Comparison between XRF and ICP-OES results.
Recycling 10 00054 g006
Figure 7. SEM-EDS images of the black mass sample with magnifications of 100, 600, and 1000; C, Fe, Al, Mn, Ni, and Cu particles are identified with different colors.
Recycling 10 00054 g007aRecycling 10 00054 g007b
Figure 8. (a) Polished black mass SEM-EDS results, and (b) magnification image of the agglomerated particles.
Recycling 10 00054 g008
Figure 9. Microscopic images of the analyzed particles. The red circles indicate the (a) metallic particles and (b) black particles (diameter: 15 µm).
Recycling 10 00054 g009
Figure 10. The spectra of the 100 analyzed particles. (a) The black particles and (b) the metallic particles.
Recycling 10 00054 g010
Figure 11. Thermogravimetry–differential thermal analysis (TG/DTA) graph.
Recycling 10 00054 g011
Figure 12. Proposed beneficiation flowsheet for the separation of graphite from metal oxides.
Recycling 10 00054 g012
Figure 13. General scheme of black mass characterization.
Recycling 10 00054 g013
Table 1. Particle size distribution (PSD) analysis—sieving.
Sieve (µm)Sieving (µm)Average Sieve (µm)Differential Mass (%)Cumulative Mass (%)Retained Mass (%)
+100010001000 0.0100.00.028.9%
−1000 + 500500750 3.2100.03.2
−500 + 200200350 16.396.819.5
−200 + 100100150 9.480.528.9
−100 + 535377 8.371.137.271.1%
−5310 62.862.8100.0
Σ100.0
Table 2. The normalized wt.% XRF results of the total and different particle size fractions of the black mass.
Black Mass Size Ranges (µm)
Total<5353–100100–200200–500>500
Mn46.855.139.3912.211.421.1
Ni17.922.213.644.34.78.33
Fe6.66.98.043.52.85.06
Co5.67.14.261.21.32.44
P2.92.52.862.22.62.95
Al1.81.83.278.921.926.01
Cu14.52.422.8951.237.427.65
Ca0.90.51.484.13.01.51
Si0.70.41.415.15.11.75
Mg0.20.20.581.41.00.55
Cl0.60.10.663.35.20.37
S0.40.10.110.20.20.24
Nb0.20.20.160.00.10.10
Sn0.30.20.550.50.20.35
Cr0.10.10.080.00.00.04
Ti0.10.00.080.20.70.11
Pb0.10.10.070.10.00.11
Zn0.10.00.160.30.10.29
Br0.20.00.130.71.60.21
Table 3. XRD results of the black mass.
Compound NameChemical Formula
1CopperCu
2Triphylite, synLiFe(PO4)
3GraphiteC
4Lithium Nickel Manganese OxideLiNi0.18Mn1.82O4
5Lithium Nickel Cobalt Oxide(Li0.973Ni0.027)(Ni0.8973Co0.1027)O2
Table 4. Laser-induced breakdown spectroscopy results of the black mass.
ElementBlack ParticlesMetallic Particles
Cu2%2%
Fe-2%
Li100%100%
Mg-2%
Mn58%16%
Disclaimer/Publisher’s Note: The statements, opinions and data contained in all publications are solely those of the individual author(s) and contributor(s) and not of MDPI and/or the editor(s). MDPI and/or the editor(s) disclaim responsibility for any injury to people or property resulting from any ideas, methods, instructions or products referred to in the content.