Abstract
The COVID-19 pandemic posed challenges to pre-crisis waste management systems. In this study, two sequential scenarios were identified and compared to investigate the quantitative and environmental impacts of COVID-19 induced changes in the generation and management of residual municipal waste (RMW) in two provincial territories (PTPU, PTMC) of the Marche region (Central Italy, Adriatic Sea side). The pandemic implied, in 2020 (COVID-19 scenario), quantitative reductions in RMW compared to the preceding year, 2019 (Pre-COVID-19 scenario), which were limited to −3.9 and −1.9% in PTPU and PTMC, respectively. Life cycle assessment (LCA) results showed that adapted RMW management practices in 2020 (COVID-19 scenario) improved all the considered environmental indicators in PTMC, compared to the preceding year, 2019 (Pre-COVID-19 scenario), and most of them in PTPU, with the exception of climate change (CC), human toxicity, non-cancer (HTnc), and eutrophication, marine (Em). The hypothetical option of waste-to-energy (WtE) for the RMW, originally destined for direct landfilling in 2020 (COVID-19 scenario), would have represented a safe and environmentally sound option in terms of health protection and CC indicator.
1. Introduction
Following the initial occurrence in Wuhan (Hubei Province, China) in December 2019, the corona virus disease (COVID-19), caused by the severe acute respiratory syndrome coronavirus 2 (SARS-CoV-2) [1], rapidly spread worldwide, and consequently, it was characterised as a pandemic by the World Health Organisation (WHO) [2,3]. The transmission behaviour of SARS-CoV-2 was expected to occur through the respiratory system (via airborne droplets) and indirect contact with surfaces contaminated by infectious droplets [4,5], particularly in colder temperatures [6]. The survival time of SARS-CoV-2 in the environment on a range of different surfaces was expected to vary from several hours up to several days [7,8]. Thus, human-to-human transmission and the persistence of this virus on several surfaces caused the rapid spread of COVID-19 [4]. Since 2020, the COVID-19 pandemic posed enormous health, social, economic, and environmental challenges to the human population [1]. Particularly, the temporally implemented efforts to limit the transmission of SARS-CoV-2, based on lockdown or restriction measures of human activities, were expected to induce positive and negative impacts on the global environment inclusive of resource, material, and energy flows [1,9,10,11,12].
Referring to the overall waste management sector, industrial waste [13] generation was expected to decrease, during the COVID-19 pandemic, due to the forced non-functioning or reduction in various types of industrial activities [1,10]. Differently, food losses and consequential waste [14] from farming were expected to increase due to the restriction of harvesting activities caused by the impact of lockdown measures on the related workers [7,10]. Concerning municipal waste (MW) [14], the influence of the COVID-19 pandemic was expected to differ depending on geographical, sociological, behavioural, and operational factors and situations [4,9]. Certainly, the COVID-19 pandemic posed challenges to the pre-crisis MW management systems, particularly in terms of operational procedures for the stream of residual or mixed MW (RMW) generated from households and quarantine facilities with infected or suspected patients and possible modifications to specific treatment steps or practices as health and safety protection measures for employees involved in the waste sector in order to reduce the risk for a spread of the virus [4,7]. Consequently, there is the technical–scientific need for detailed research studies that evaluate different MW management situations occurred during the COVID-19 pandemic in diversified regions or areas worldwide, with the aim of facilitating the development of a comprehensive understanding and decision making to overcome waste management challenges in similar disease outbreaks or public health emergencies in the future [7,9]. Particularly, evaluation approaches, such as material flow analysis and life cycle assessment (LCA), could be properly implemented to comprehend the occurred environmental impacts of COVID-19 induced temporal changes in MW generation and management [10]. Several works (for instance [15,16,17]) applied LCA in relation to the waste management of single-use masks and gloves that represent less than 1% of the RMW [10]. Few studies focused on LCA of medical waste, providing recommendations on their management and disposal for future similar emergencies [18,19], and infectious waste in emerging and underdeveloped nations [20]. However, only a few researchers applied LCA for evaluating the environmental impact of changes in MW management during COVID-19, providing recommendations for future cases, in diversified areas around the globe (for instance, in Teheran, Iran [21], and in Goiânia, Brazil [22]), while Aldaco et al. [23] evaluated the impact in terms of greenhouse gas (GHG) emissions from modifications in food waste generation and management in Spain during COVID-19.
Among the Western countries, Italy was one of the first nations that faced the COVID-19 pandemic, starting from the day (i.e., 21 February 2020) the first patient was diagnosed with COVID-19 within the national territory [11]. In particular, the provincial territory of Pesaro-Urbino, which is located in the Marche region (Central Italy, Adriatic Sea side), was directly included in the inter-regional area of the national territory interested by the first emergency limitation measures issued on 1 March 2020 by a specific decree of the Italian President of the Council of Ministers [24]. Indeed, Italy also has a long tradition in the separate collection (SC) and recycling of MW fractions, with the associated management of the remaining RMW [11,25].
Given the above considerations, this study aimed at comparing the environmental impacts of the RMW management practices that were implemented regularly before (reference year 2019 as the corresponding scenario) and extraordinarily during the COVID-19 pandemic (reference year 2020 as the subsequent scenario) in two selected provincial territories of the Marche region. The environmental impact assessment was performed by LCA, and it was preceded by a waste flow analysis to quantify and compare the resulting streams of the main separately collected MW fractions and remaining RMW before and during the COVID-19 pandemic (according to the respective reference years) in the selected provincial territories.
2. Materials and Methods
2.1. Provincial Territories and Scenarios
The provincial territories of the Marche region selected in this study are (Figure 1) (1) the mentioned provincial territory of Pesaro-Urbino (hereinafter identified as PTPU), which is located in the northern part of the region with an extension of about 2570 km2 [26] and an average population of about 358,000 inhabitants in the biennial period 2019–2020 [27,28], and (2) the provincial territory of Macerata (hereinafter identified as PTMC), which is located in the south-central part of the region with an extension of about 2800 km2 [26] and an average population of about 325,000 inhabitants (including a neighbouring municipality also operated by the provincial waste management company) in the same biennial period [27,28].
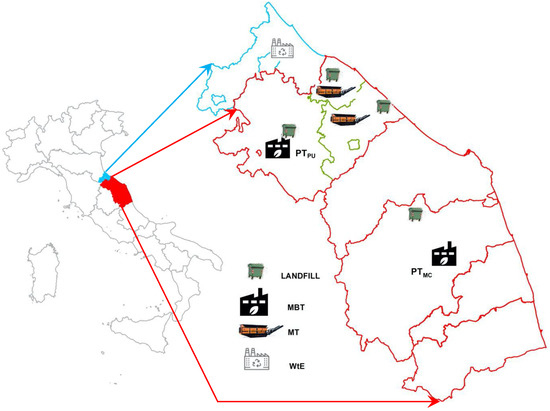
Figure 1.
Overview on the Italian division in regional territories with details of the Marche region (in red) and the adjacent Province of Rimini within the Emilia-Romagna region (in blue) (left). The enlarged map (right) shows the northern provincial territory of Pesaro-Urbino (PTPU) and south-central provincial territory of Macerata (PTMC), both in the Marche region, with the location of the available facilities for RMW management (as for the reference years 2019–2020) (additional legend for PTPU: green line = disaggregation in two—upper and lower—coastal districts and one inland district). The location of the available WtE plant in the Province of Rimini is included.
In the first scenario, temporally referred to as 2019 and called “Pre-COVID-19”, the regularly implemented SC of MW, in the provincial territories PTPU and PTMC, regarded the following material fractions (and related European Waste Codes—EWCs) [27,29]: paper and cardboard (identified by the aggregation of EWCs 15 01 01 and 20 01 01); glass (identified by the aggregation of EWCs 15 01 07 and 20 01 02); biodegradable kitchen and canteen waste (identified by EWC 20 01 08); green waste (identified by EWC 20 02 01); plastic (identified by the aggregation of EWCs 15 01 02 and 20 01 39); metal (identified by the aggregation of EWCs 15 01 04 and 20 01 40); mixed plastic and metal packaging (identified by EWC 15 01 06); wood (identified by the aggregation of EWCs 15 01 03 and 20 01 38); and other (including textile, waste electrical and electronic equipment, medicines, batteries and accumulators, and bulky waste). In the Pre-COVID-19 scenario, the remaining RMW (identified by EWC 20 03 01 [29]) was regularly addressed, for both the provincial territories PTPU and PTMC, to the aerobic biostabilisation variation of the mechanical biological treatment (MBT) [30], generating the following material outputs [31]: magnetically separated metal (identified by EWC 19 12 02 [29]), destined for material recovery [14]; mechanically separated, oversize fraction of RMW (os-RMW, identified by EWC 19 12 12 [29]); and aerobically biostabilised organic fraction of RMW (bios-OFRMW, identified by EWC 19 05 03 [29]). Both the bios-OFRMW and os-RMW were disposed of at pertaining controlled landfills (Figure 1). Concerning provincial territory PTPU, the implemented complementary aerobic biostabilisation MBT system comprised two mechanical (selection) treatment (MT) steps, located in the upper and lower coastal districts, whose generated streams of undersize organic fraction of RMW (us-OFRMW, identified by EWC 19 05 01 [29]) were addressed to the aerobic biological treatment phase of the complete MBT plant located in the inland district (Figure 1).
In the subsequent scenario, temporally referred to as 2020 and called “COVID-19”, in line with the European Commission recommendation on waste management in the context of COVID-19 pandemic [32], both the provincial territories PTPU and PTMC were intended to safeguard the overall continuity of the implemented SC of MW. However, the COVID-19 pandemic induced changes in the previously implemented management practices of RMW due to the consequential generation of two diversified streams following the start of emergency. At first, according to the specific guidelines issued by the Italian National Institute of Health (ISS) [5,11,33] and technical report issued by the European Centre for Disease Prevention and Control (ECDC) [34], the RMW generated (without any preceding sorting) by suspected or confirmed COVID-19 subjects self-isolating or treated at home, hereinafter identified as RWMCOVID-19, was directly addressed to the thermal treatment of incineration, which was made possible—for both the provincial territories PTPU and PTMC—at the waste-to-energy (WtE) plant operating in the Province of Rimini of the adjacent Emilia-Romagna region (Figure 1). However, the remaining, main stream of RMW, hereinafter identified as RMWNO-COVID-19, was subjected to the following temporal and territorial management variations: after a first emergency decree by the President of the Marche region, issued on 21 March 2020 and aimed at ensuring health and hygienic protection in all phases of MW management [35], the RMWNO-COVID-19 was directly addressed (without treatment) to landfilling in both provincial territories PTPU and PTMC, by skipping the aerobic biostabilisation MBT as an initial precautionary measure; then, in provincial territory PTPU, the RMWNO-COVID-19 continued to be destined directly to landfilling until the end of 2020, as a confirmed safety measure, particularly considering the disaggregated location of the available MT and MBT facilities (in provincial coastal and internal districts, Figure 1); instead, following a further emergency decree by the President of the Marche region, issued on 24 April 2020 and offering the alternative to reactivate the conventional MBT approach under the conditions of confinement of treatment operations and avoidance of any direct contact of workers with waste [36], the provincial territory PTMC reactivated the confined aerobic biostabilisation MBT [37] for the RMWNO-COVID-19, prior to landfilling, from the end of May until the end of 2020.
The changes in RMW management in 2020, described above, are expected to bring non-negligible modifications on the environmental impacts of the overall waste management systems, with respect to the preceding 2019 situation. In particular, the direct landfilling of non-pretreated RMWNO-COVID-19 is expected to increase the environmental impacts, since higher biodegradable and non-stabilised fractions are contained in the deposited waste [38]. On the other hand, the direct energy recovery in WtE of the RWMCOVID-19 is expected to provide beneficial avoided effects [39,40,41], depending on the incidence of waste amounts effectively addressed to the thermal treatment of incineration.
The schematisation in Figure 2 summarises the temporal and provincial evolutions of the RMW management practices in the considered scenarios.

Figure 2.
Schematisation of the temporal and provincial evolutions of the RMW management practices in the sequential scenarios.
2.2. Data Collection and Elaboration for Waste Flow Analysis
For the Pre-COVID-19 scenario, the basic data to perform the waste flow analysis in the year 2019 were represented by a complete database in Microsoft Excel format containing the resulting amounts of separately collected MW fractions and RMW disaggregated in terms of individual EWCs [29], months of the year, and municipal territories of generation within the respective provincial territories (PTPU, PTMC). This database was defined by the Waste Register Section at the Environmental Protection Agency of the Marche Region (ARPAM) through the institutional web-based application called “ORSo, Supra-Regional Waste Observatory” [42].
For the COVID-19 scenario, the resulting amounts of separately collected MW fractions and RMW disaggregated in terms of individual EWCs [29], months of the year 2020, and municipal territories of generation, particularly with the RMW distinguished between RMWNO-COVID-19 and RMWCOVID-19, were provided (as Microsoft Excel databases) by the respective waste management companies operating in the upper coastal and internal districts of provincial territory PTPU, the lower coastal district of provincial territory PTPU, and provincial territory PTMC (Figure 1).
The adoption of the pivot tool in Microsoft Excel format allowed the aggregation of resulting amounts of separately collected MW fractions and RMW (or RMWNO-COVID-19 and RMWCOVID-19) for the overall provincial territories PTPU and PTMC, respectively, in the reference years 2019 (Pre-COVID-19 scenario) and 2020 (COVID-19 scenario).
2.3. LCA
The LCA was carried out according to the procedural phases defined by the ISO (International Organisation for Standardisation) standards 14040 [43] and 14044 [44].
2.3.1. Goal and Scope Definition
The LCA was applied to assess and compare the environmental impacts of the implemented RMW management practices in provincial territories PTPU and PTMC in the sequential Pre-COVID-19 and COVID-19 scenarios (Figure 2). The LCA application considered the consumption and/or production of energy and materials, as well as the pollutant emissions generated over the entire life cycle of each treatment approach. The waste collection step was not included. The functional unit (FU) was assumed as 1 tonne of RMW.
2.3.2. Inventory Analysis
In this LCA phase, the studied systems on RMW were described according to the material and energy flows across the system boundaries in the considered scenarios.
Pre-COVID-19 Scenario
Figure 3 shows the process units included in the RMW management in provincial territories PTPU and PTMC during the ordinary Pre-COVID-19 scenario. These units consisted of: the MT of the incoming RMW; the aerobic biological treatment of the us-OFRMW, which included—in provincial territory PTPU—the preliminary transportation of the pertaining us-OFRMW from the upper and lower coastal MT steps to the inland MBT (at distances of about 41 and 61 km, respectively) and the consequential transportation of the obtained bios-OFRMW back to the upper and lower coastal controlled landfills (Figure 1); the os-RMW and bios-OFRMW landfilling, which included—in provincial territory PTMC—their preliminary transportation from the MBT to the pertaining controlled landfill at a distance of about 27 km (Figure 1); and the treatment and combustion of the extracted landfill gas (LFG). Material recovery from the separated metal in the MBT and energy recovery from the extracted LFG were considered by expanding the overall system boundary to include avoided primary productions (Figure 3). The transportation of separated metal from provincial territories PTPU and PTMC to dedicated installations for material recovery in Northern Italy, at average distances of about 350 and 500 km, respectively, was included in the system boundary. However, the building of plants and assembly of equipment were not considered.
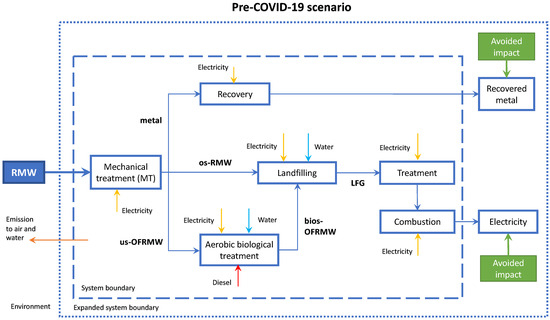
Figure 3.
Pre-COVID-19 scenario: process units of the RMW management in provincial territories PTPU and PTMC within the considered system boundaries.
The mass balances of the aerobic biostabilisation MBTs in provincial territories PTPU and PTMC (Table S1 of the Supplementary Materials) were derived in a previous study [31]. The specific electric energy (EE) consumption for the MT steps (Table S2 of the Supplementary Materials) was derived from the permit on Integration Pollution Prevention and Control of the MBT in provincial territory PTMC [37]. Instead, the specific EE and material (water, diesel) consumptions (per tonne of us-OFRMW) for the aerobic biological treatment steps (Table S3 of the Supplementary Materials) were retrieved from Ardolino et al. [45], while the specific air emissions (per tonne of us-OFRMW) after biofiltration from the aerobic biological treatment steps (Table S4 of the Supplementary Materials) were retrieved from Avadí et al. [46] and the mentioned study [45]. The separated metal was assumed to be reprocessed with an efficiency of 88%, while the substitution by secondary raw metal was considered with a ratio of 100% to the virgin one [41]. Consequently, the overall inventory data for the aerobic biostabilisation MBTs in provincial territories PTPU and PTMC, in the ordinary Pre-COVID-19 scenario, are summarised in Table 1.

Table 1.
Pre-COVID-19 scenario: overall inventory data for the aerobic biostabilisation MBTs in provincial territories PTPU and PTMC (units expressed per tonne of RMW).
Regarding the bios-OFRMW and os-RMW landfilling, the specific landfill EE and water consumptions (both per tonne of deposited waste, Table S5 of the Supplementary Materials) were derived from the annual environmental statement on the controlled landfill in provincial territory PTMC [47] and assumed the same for the controlled landfills in provincial territory PTPU. The specific leachate productions (per tonne of deposited waste, Table S6 of the Supplementary Materials) were derived from the mentioned environmental statement [47] for the controlled landfill in provincial territory PTMC and from the annual reports [48,49,50] for the controlled landfills in provincial territory PTPU [51].
The estimation of methane and related landfill gas (LFG) generations, expected from the deposited bios-OFRMW and os-RMW, was based on the following assumptions: the values of biochemical methane potential (BMP) and related physico-chemical characteristics derived in previous studies [30,31], as representative for the bios-OFRMW in provincial territories PTPU and PTMC (Table S7 of the Supplementary Materials); the values of BMP and related physico-chemical characteristics derived in a further previous study [52], as representative for the residual organic fraction still contained (with the related compositional percentage level) in the os-RMW in provincial territory PTPU, along with an identical assumption for provincial territory PTMC (Table S7 of the Supplementary Materials); and the compositional percentage levels (by vol) of methane in LFG, as derived from the annual reports [48,49,50] for the controlled landfills in provincial territory PTPU, along with the assumed mean of compositional percentage level (from these landfills) for the controlled landfill in provincial territory PTMC. For the provincial controlled landfills, a volumetric LFG collection proportion of 76% and a complementary volumetric LFG diffuse emission incidence of 24% were assumed, as derived from a multiyear LFG diffuse emission monitoring study performed at the lower coastal controlled landfill in provincial territory PTPU [53,54]. The disaggregation of LFG diffuse emissions as gaseous components was based on available LFG compositions for the controlled landfills in provincial territory PTPU from the respective annual reports [48,49,50], while compositional means derivable from these landfills were assumed for the controlled landfill in provincial territory PTMC (Table S8 of the Supplementary Materials). The specific EE consumption for the cooling treatment of the collected LFG (0.0267 kWh Nm−3) was determined from the permit on Integration Pollution Prevention and Control of the lower coastal controlled landfill in provincial territory PTPU [55], with the same assumption for the remaining controlled landfills in provincial territories PTPU and PTMC. To derive the EE productions from on-site conversion of the collected LFG through internal combustion engine (ICE) technology, the following assumptions were made: an EE efficiency of 37% [31], a methane lower heating value (LHV) equal to 35.8 MJ m−3 [56], and a self-consumption of 3% [57]. Finally, the compositions of exhaust gases from ICEs were retrieved from the annual reports [48,50] for the lower coastal and inland controlled landfills in provincial territory PTPU; however, the resulting mean conditions from the previous sites were assumed for the remaining controlled landfills (i.e., the upper coastal one in provincial territory PTPU and the pertaining one in provincial territory PTMC, Table S9 of the Supplementary Materials). Consequently, the overall inventory data for the bios-OFRMW and os-RMW landfilling in provincial territories PTPU and PTMC, in the ordinary Pre-COVID-19 scenario, are summarised in Table 2.
Table 2.
Pre-COVID-19 scenario: overall inventory data for the landfilling of bios-OFRMW and os-RMW in provincial territories PTPU and PTMC (units expressed per tonne of RMW).
COVID-19 Scenario
Regarding the thermal treatment of incineration for the RMWCOVID-19, Figure 4 shows the included process units that consisted of: the RMWCOVID-19 transportation to the WtE plant in the Province of Rimini, at the considered distances of about 29, 50, 64, and 159 km from the assumed collection centres at MT locations in upper and lower coastal districts of provincial territory PTPU and MBT locations in the inland coastal district of provincial territory PTPU and in provincial territory PTMC, respectively (Figure 1); the combustion process with energy recovery; the manufacturing processes of chemicals required for flue gas cleaning (FGC); the treatment and final disposal of bottom ash (BA); and the disposal of fly ash (FA) and air pollution control residues (APCR). Material and energy recoveries through the treatment of BA were considered by expanding the overall system boundary to include the avoided primary productions. However, plant building and equipment assembly were not considered.
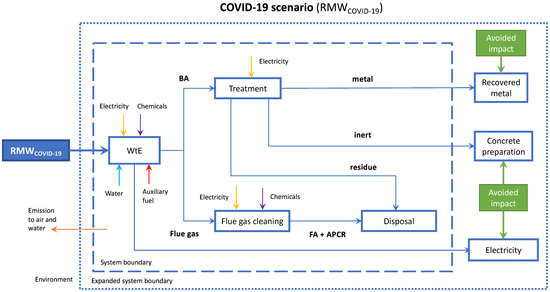
Figure 4.
COVID-19 scenario: process units of the RMWCOVID-19 thermal treatment within the considered system boundaries.
The basic consumption data (Table S10 of the Supplementary Materials) for the adopted WtE plant (with a moving grade combustion technology and a double filtration dry acid removal FGC) were derived from the annual operating report [58]. For consistency with the considered WtE plant in the Province of Rimini, alternatives for the thermal treatment of the RWMCOVID-19, for instance the advanced waste gasification [59], were not evaluated. The LHVs for the RMW in provincial territories PTPU and PTMC were estimated using the modified Dulong expression [60]. In this respect, the compositions (in terms of needed C, H, O, S, and moisture contents) of the RMW in the considered provincial territories were determined based on the assumed typical elemental compositions for relevant waste material fractions (organic as kitchen and fines, green, glass, metal, paper/cardboard, plastic, textile, and wood) and the compositional characteristics (expressly in terms of the mentioned material fractions) for the RMW in provincial territories PTPU and PTMC, as derivable from a previous study [31] (Tables S11–S13 of the Supplementary Materials). The resulting LHVs, along with the specific gross EE productions based on the assumption of a typical electric net efficiency of 24% for a conventional WtE plant [61], are reported in Table S14 of the Supplementary Materials. The basic data on outputs (such as flue gas and residues) from the considered WtE plant (Table S15 of the Supplementary Materials) were derived from the annual operating report [58]. The specific inert recovery from BA was assumed equal to 751 kg t BA−1, according to a previous study [62]. Consequently, the recovered inert was considered for use in concrete preparation with substitution levels of gravel and sand equal to 40 and 60%, respectively [62]. For the separated metal from BA, the assumptions on the reprocessing and substitution efficiencies were identical as for the inventory analysis of the biostabilisation MBT. The basic data on chemical consumptions (for FGC) and air emissions for the considered WtE plant (Table S16 of the Supplementary Materials) were retrieved from the annual report [58]. Regarding CO2 emissions, only those originated from non-renewable RMW material fractions were considered [62], in accordance with the assumptions and resulting values in Table S17 of the Supplementary Materials. Consequently, the overall inventory data for the thermal treatment of RMWCOVID-19 in provincial territories PTPU and PTMC, in the COVID-19 scenario, are summarised in Table 3.
Table 3.
COVID-19 scenario: overall inventory data for the thermal treatment (WtE) of RMWCOVID-19 in provincial territories PTPU and PTMC (units expressed per tonne of RMW).
Regarding the RMWNO-COVID-19 management in provincial territories PTPU and PTMC during the COVID-19 scenario, Figure 5 shows the involved process units that were the same as for the Pre-COVID-19 scenario (Figure 3), while addressing diversified temporal evolutions and waste flows (Figure 2). In addition to assumptions and data in Tables S1–S6, S8, and S9 of the Supplementary Materials, the estimation of methane and related LFG generations, from the direct landfilling of RMWNO-COVID-19, considered the following (Table S7 of the Supplementary Materials): a BMP value for the organic fraction in RMW derived in a previous study [30], as representative for the us-OFRMW in provincial territory PTPU, along with the same assumption for provincial territory PTMC; the values of related physico-chemical characteristics for the us-OFRMW in provincial territories PTPU and PTMC, as derived in a further previous study [31]; and the resulting compositional levels of the organic fraction in RMW, as obtained in the mentioned study [31], based on detailed compositional analyses on RMW samples in provincial territories PTPU and PTMC (including the material fractions diaper, glass, metal, organic, paper/cardboard, plastic, textile, wood, and other). Consequently, the overall inventory data for the aerobic biostabilisation MBTs and the bios-OFRMW + os-RMW and RMWNO-COVID19 landfilling in provincial territories PTPU and PTMC, in the COVID-19 scenario, are summarised in Table 4 and Table 5, respectively.

Figure 5.
COVID-19 scenario: process units of the RMWNO-COVID-19 management in provincial territories PTPU and PTMC within the considered system boundaries.
Table 4.
COVID-19 scenario: overall inventory data for the aerobic biostabilisation MBTs in provincial territories PTPU and PTMC (units expressed per tonne of RMW).
Table 5.
COVID-19 scenario: overall inventory data for the landfilling of bios-OFRMW + os-RMW and RMWNO-COVID-19 in provincial territories PTPU and PTMC (units expressed per tonne of RMW).
2.3.3. Impact Assessment Method
The Environmental Footprint (EF) 3.0 method [63], developed by the Joint Research Centre (JRC) of the European Commission [64], was used to perform the Life Cycle Impact Assessment (LCIA), comprising the following EF impact categories: climate change (CC) in kg CO2 eq; ozone depletion (OD) in kg CFC-11 eq; ionising radiation (IR) in kBq U235 eq; photochemical ozone formation (POF) in kg NMVOC eq; particulate matter (PM) in disease incidence; human toxicity, non-cancer (HTnc) in CTUh (comparative toxic unit for humans); human toxicity, cancer (HTc) in CTUh; acidification (A) in mol H+ eq; eutrophication, freshwater (Ef) in kg P eq; eutrophication, marine (Em) in kg N eq; eutrophication, terrestrial (Et) in mol N eq; ecotoxicity, freshwater (ETf) in CTUe (comparative toxic unit for ecosystems); land use (LU) in Pt (soil quality index); water use (WU) in m3 deprived; resource use, fossils (RUf) in MJ; and resource use, minerals and metals (RUmm) in kg Sb eq. In the classification step, all the material and energy flows of the inventory phase were identified according to their contribution to each EF impact category [41].
The calculation of EF indicators was performed using SimaPro software (version 9.2) [65] with its database Ecoinvent 3.7.1 [66], which is updated to the year 2020, granting the representativeness of data for the reference years 2019 (Pre-COVID-19 scenario) and 2020 (COVID-19 scenario). In this LCA study, normalization and weighting steps were not performed.
3. Results and Discussion
3.1. Comparison of Waste Flows in the Considered Scenarios
The generation of MW (as the sum of separately collected material fractions, RMW, street cleaning residues to disposal, and bulky waste to disposal) in provincial territory PTPU amounted to 209,098 and 192,815 tonnes in 2019 (Pre-COVID-19 scenario) and 2020 (COVID-19 scenario), respectively, with a resulting relative reduction (calculated as [(MW2020 − MW2019)/(MW2019)] × 100) equal to −7.8%. In provincial territory PTMC, 165,509 and 160,427 tonnes of MW were generated in 2019 and 2020, respectively, with a resulting relative reduction equal to −3.1%. Indeed, the temporally implemented and repeated lockdown measures might have affected the generations of MW due to urban activities forced to stop and possible material accumulations by citizens at home; although, the yearly decreasing effects were likely counterbalanced partially by occurred seasonal mitigations of restriction measures [11,67].
3.1.1. Main Separately Collected MW Fractions
Figure 6 and Figure 7 display the resulting amounts of main separately collected MW fractions in 2019 (Pre-COVID-19 scenario) and 2020 (COVID-19 scenario) in provincial territories PTPU and PTMC, respectively. The amounts of biodegradable kitchen and canteen waste (Figure 6a and Figure 7a) showed relative decreases, calculated comparing 2020 to 2019 as [(kitchen-canteen waste2020 − kitchen-canteen waste2019)/(kitchen-canteen waste2019)] × 100, equal to −4.6 and −1.6% in provincial territories PTPU and PTMC, respectively (Figure 6f and Figure 7f). Indeed, the temporally implemented and repeated lockdown measures might have caused reductions in the generation (and collection) of food waste due to the closing of restaurants and bars and a possible attitude of citizens to buy more frozen and packed and less fresh foods [68]; probably, these reductions were partially counterbalanced by a possible different attitude of citizens to make provision of food in inadequate large amounts [6].
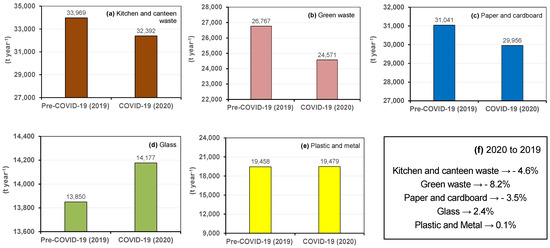
Figure 6.
Provincial territory PTPU: resulting amounts of main separately collected MW fractions (a–e) in 2019 (Pre-COVID-19 scenario) and 2020 (COVID-19 scenario) and corresponding relative differences (f).
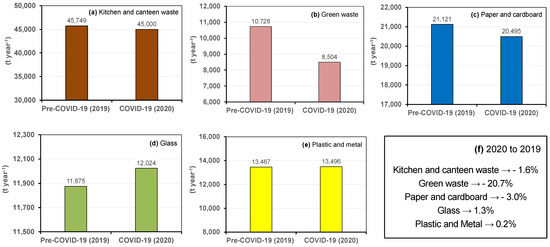
Figure 7.
Provincial territory PTMC: resulting amounts of main separately collected MW fractions (a–e) in 2019 (Pre-COVID-19 scenario) and 2020 (COVID-19 scenario) and corresponding relative differences (f).
The amounts of green waste (Figure 6b and Figure 7b) presented relative decreases, calculated comparing 2020 to 2019 as [(green waste2020 − green waste2019)/(green waste2019)] × 100, equal to −8.2 and −20.7% in provincial territories PTPU and PTMC, respectively (Figure 6f and Figure 7f). Indeed, the temporally implemented and repeated lockdown measures might have affected the regular management of gardens and parks [11]. The amounts of paper and cardboard (Figure 6c and Figure 7c) also presented relative decreases that, calculated comparing 2020 to 2019 as [(paper-cardboard2020 − paper-cardboard2019)/(paper-cardboard2019)] × 100, were equal to −3.5 and −3.0% in provincial territories PTPU and PTMC, respectively (Figure 6f and Figure 7f). Effectively, the physical closing of offices and institutional and educational activities, which mostly shifted to smart working and telematic procedures during the temporally implemented and repeated lockdown measures, might have caused reduced usages of clean paper and cardboard materials; although, partly counterbalancing effects were likely given by expected increases in packaging waste (including cellulosic-based materials) due to online shopping for home delivery [4,6,11].
However, the amounts of glass (Figure 6d and Figure 7d) showed relative increases, calculated comparing 2020 to 2019 as [(glass2020 − glass2019)/(glass2019)] × 100, equal to 2.4 and 1.3% in provincial territories PTPU and PTMC, respectively (Figure 6f and Figure 7f). Indeed, people’s preference in buying long shelf life products (expected to be also in glass jars), during the temporally implemented and repeated lockdown measures, might have caused increases in glass fractional waste generation (and collection); although, partly counterbalancing effects were likely given by the forced closing of bars and restaurants with reduced beverage consumptions [6]. Finally, the aggregated amounts of plastic and metal (Figure 6e and Figure 7e) remained almost unchanged due to resulting relative differences, calculated comparing 2020 to 2019 as [(plastic-metal2020 − plastic-metal2019)/(plastic-metal2019)] × 100, limited to 0.1 and 0.2% in provincial territories PTPU and PTMC, respectively (Figure 6f and Figure 7f). In this respect, the opposing effects of the expected increase in light packaging (from online shopping for home delivery) and decrease in waste (including plastic and metal fractions) assimilable to MW might have concurrently occurred during the temporally implemented and repeated lockdown measures [9,11,69].
3.1.2. RMW
Figure 8 displays the resulting amounts of overall RMW in 2019 (Pre-COVID-19 scenario) and 2020 (COVID-19 scenario) in provincial territories PTPU and PTMC. The overall RMW presented relative decreases, calculated comparing 2020 to 2019 in provincial territories PTPU (Figure 8a) and PTMC (Figure 8b) as [(RMW2020 − RMW2019)/(RMW2019)] × 100, equal to −3.9 and −1.9%, respectively (Figure 8c). The comparative sequence of these relative decreases qualitatively agreed with the mentioned provincial relative reductions on MW generation due to resulting similar values for the respective MWrelative reduction/RMWrelative reduction ratios (equal to 2 for provincial territory PTPU and 1.6 for provincial territory PTMC). The quantitative impact on overall RMW in 2020 of the large utilisation of single-use masks and gloves by provincial populations was expected to be of minor concern due to the light individual weights of these personal protective equipment products [11,33].

Figure 8.
Resulting amounts of overall RMW in 2019 (Pre-COVID-19 scenario) and 2020 (COVID-19 scenario) in provincial territories PTPU (a) and PTMC (b) and corresponding relative differences (c).
In the COVID-19 scenario (2020), the yearly quantitative incidences of RMWCOVID-19 to overall RMW in provincial territories PTPU (Figure 9a) and PTMC (Figure 9b) were limited to 0.54 and 2.7%, respectively (Figure 9c). Indeed, the resulting higher incidence of RMWCOVID-19 in provincial territory PTMC, compared to provincial territory PTPU (Figure 9c), was likely related to the precautionary attitude by the waste management company in provincial territory PTMC to include also RMW from provincial nursing homes into the collected RMWCOVID-19 stream [36].
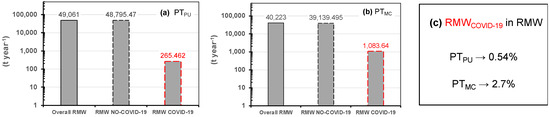
Figure 9.
COVID-19 scenario (2020): yearly quantitative contributions of RMWCOVID-19 and RMWNO-COVID-19 to overall RMW in provincial territories PTPU (a) and PTMC (b) and resulting incidences of RMWCOVID-19 (c). The vertical axes (a,b) are on the logarithmic scale.
Interestingly, both the temporal evolutions of monthly amounts of RMWCOVID-19 and percentage ratios of RMWCOVID-19 to overall RMW, during 2020 (COVID-19 scenario) in provincial territory PTPU (Figure S1 of the Supplementary Materials), qualitatively paralleled the temporal evolution of the occurred COVID-19 crisis, with comparatively higher monthly RMWCOVID-19 amounts and RMWCOVID-19/RMW ratios revealed from April to June and in November–December in agreement with the initial and second waves of emergency (with related lockdown measures) and the start (from end of March, see Section 2.1 and Figure 2) of operational RMW differentiation in RMWCOVID-19 and RMWNO-COVID-19 streams; however, comparatively lower monthly RMW amounts and RMWCOVID-19/RMW ratios were revealed in summer and initial autumn seasons (i.e., from July to October) in qualitative combination with the occurred seasonal mitigations of restriction measures [24,35,67]. In provincial territory PTMC, the comparative differences in monthly RMWCOVID-19 amounts and RMWCOVID-19/RMW ratios during 2020 became less pronounced, while still indicating higher values in April extended to July and November–December (Figure S2 of the Supplementary Materials); in this respect, it should be considered the mentioned precautionary attitude to include also RMW from provincial nursing homes into the RMWCOVID-19 stream.
Finally, the quantitative partitions of RMWNO-COVID-19 management practices during 2020 (COVID-19 scenario) resulted higher (at 81.4% of the yearly stream) to direct landfilling and lower (at 18.6% of the yearly stream) to combined aerobic biostabilisation MBT + landfilling in provincial territory PTPU, while the opposite occurred in provincial territory PTMC (i.e., lower at 16.1% and higher at 83.9% of the yearly stream to direct landfilling and combined aerobic biostabilisation MBT + landfilling, respectively) (Figure S3 of the Supplementary Materials). This comparative difference in provincial percentage partitions reflected the diversified monthly durations of RMWNO-COVID-19 management practices that occurred in the considered provincial territories (see Section 2.1 and Figure 2).
3.2. Comparison of LCIA in the Considered Scenarios
Table 6 shows the resulting values of the indicators calculated for the EF impact categories of RMW management in provincial territories PTPU and PTMC, in the Pre-COVID-19 (2019) and COVID-19 (2020) scenarios, according to the chosen FU. In general, positive values of the indicators mean a burden for the environment, while negative values represent a saving for the environment [41]. Specifically, some impact categories resulted in Table 6 in environmental burdens (positive values), regardless of the RMW management practices implemented in the respective Pre-COVID-19 (2019) and COVID-19 (2020) scenarios for the considered provincial territories (i.e., CC, POF, PM, HTnc, Em, and Et). However, some other impact categories resulted in Table 6 in environmental benefits (negative values) in the Pre-COVID-19 (2019) and COVID-19 (2020) scenarios for both provincial territories (i.e., OD, IR, HTc, A, Ef, Etf, LU, WU, Ruf, and Rumm).
Table 6.
Resulting values of the indicators calculated for the EF impact assessment categories of RMW management in provincial territories PTPU and PTMC in the sequential Pre-COVID-19 (2019) and COVID-19 (2020) scenarios (FU = 1 tonne of RMW).
Interestingly, all the calculated indicators resulted in improved (lower) values for the COVID-19 (2020) scenario compared to the ordinary Pre-COVID-19 (2019) scenario in provincial territory PTMC, as shown by the negative relative differences reported in Table 6. Concerning provincial territory PTPU, the predominance of calculated indicators confirmed improved (lower) values for the COVID-19 (2020) scenario compared to the ordinary Pre-COVID-19 (2019) scenario, except for three indicators (i.e., CC, HTnc, and Em) showing in Table 6 higher values in the COVID-19 (2020) scenario with resulting positive relative differences. To better understand the behaviour of the calculated indicators, the analysis of contributions from different process units has been detailed in the following section Contribution Analysis. However, it is rather expected that, for CC, the predominant practice of direct landfilling of RMWNO-COVID-19 in the COVID-19 scenario (2020) for provincial territory PTPU (see Section 3.1.2 and Figure S3 of the Supplementary Materials) had a detrimental environmental effect, explaining the positive relative increase resulting in Table 6.
Contribution Analysis
The contribution analysis helped in investigating the causes of different behaviours in the considered impact indicators. Particularly, the following key process units were identified to investigate the main contributions that affected the total environmental performances of RMW management practices in provincial territories PTPU and PTMC in the sequential Pre-COVID-19 (2019) and COVID-19 (2020) scenarios: MT, aerobic biological treatment, metal recovery, post-MBT landfilling (i.e., for the resulting main MBT outputs of os-RMW and bios-OFRMW), direct landfilling of RMWNO-COVID-19, LFG treatment (via cooling), LFG energy recovery, transportation, and direct WtE for RMWCOVID-19. For each process unit, the contribution of each involved activity (consumption/production of energy and substances, emissions, treatment of residues/waste) has been accounted for. Avoided impacts due to beneficial effects from the substitution of conventional energy or material (metal) have been expressed as negative values.
Figure 10 reports the contribution analysis for the three impact categories presenting variations in Table 6 from 2019 (Pre-COVID-19 scenario) to 2020 (COVID-19 scenario) that are qualitatively different in the respective provincial territories (i.e., increasing values for PTPU while decreasing values for PTMC), i.e., the mentioned CC, HTnc, and Em.

Figure 10.
Contribution of process units of RMW management for 2019 (Pre-COVID-19 scenario) and 2020 (COVID-19 scenario) to climate change (CC) for provincial territories PTPU (a) and PTMC (b), human toxicity, non-cancer (HTnc) for PTPU (c) and PTMC (d), and eutrophication, marine (Em) for PTPU (e) and PTMC (f). The dots (Total) display the resulting values of the indicators in Table 6.
The total CC resulted in environmental burdens (positive values) for the two provincial territories in both considered scenarios (Figure 10a,b). Despite the energy recovery from the collected LFG combustion represented an avoided impact (accounting for −16 and −18% for PTPU and both −16% for PTMC in 2019 and 2020, respectively), it was not enough to counterbalance the large positive contribution given mainly by landfilling. In 2019 (Pre-COVID-19 scenario), only the post-MBT landfilling of os-RMW and bios-OFRMW occurred (see Section 2.1 and Figure 2), accounting for 99 and 97% for provincial territories PTPU and PTMC, respectively. In 2020 (COVID-19 scenario), two landfilling contributions overall occurred, i.e., for post-MBT outputs (os-RMW and bios-OFRMW) and directly for RMWNO-COVID-19 (see Section 2.1 and Figure 2). While, for provincial territory PTMC, the direct landfilling of RMWNO-COVID-19 took place for only two months with a lower amount (see Figure 2 and Section 3.1.2) contributing to the 2020 indicator for 17% (post-MBT landfilling contributed for 80%), in provincial territory PTPU, the direct landfilling of RMWNO-COVID-19 was implemented for the whole yearly time after the start of management of the COVID-19 pandemic and at higher amount (see Figure 2 and Section 3.1.2), thus representing 98% of 2020 impact (post-MBT landfilling only contributed for 17%). It is rather clear from Figure 10a how the predominance of the direct landfilling of RMW in provincial territory PTPU influenced the indicator worsening in 2020 (COVID-19 scenario), because of the higher methane diffuse emissions from disposal of untreated RMW. At the same time, MT and aerobic biological treatment impacts decreased in 2020 (COVID-19 scenario), especially for provincial territory PTPU, but their contributions were definitely less relevant in both scenarios (6 and 1% and 10 and 2% for PTPU, 5 and 4% and 13 and 10% for PTMC in 2019 and 2020, respectively) than landfilling ones (Figure 10a,b). Overall, WtE impact in 2020 (COVID-19 scenario) was negligible for provincial territory PTPU, given the very small amount of RMWCOVID-19 directly addressed to thermal treatment (see Figure 9 and Section 3.1.2). For provincial territory PTMC, the overall WtE impact in 2020 accounted for 2.9%, given the slightly higher quantitative incidence of RMWCOVID-19 (see Figure 9 and Section 3.1.2).
The Increase in the HTnc indicator from 2019 (Pre-COVID-19 scenario) to 2020 (COVID-19 scenario), in provincial territory PTPU, was referable again to the main contribution of direct landfilling of RWMNO-COVID-19 during 2020 (Figure 10c). Figure 10c also shows in 2020 the increase in negative contribution from collected LFG energy recovery (because more LFG has been produced) and the very small negative contribution of WtE, but both were in all not enough to compensate for the mentioned positive increase. In provincial territory PTMC (Figure 10d), the sum of contributions of the direct landfilling of RMWNO-COVID-19 and the post-MBT landfilling of os-RMW and bios-OFRMW in 2020 (3.02E-07 CTUh t−1) was very similar to the contribution of post-MBT landfilling in 2019 (3.04E-07 CTUh t−1); however, the contributions of MT and aerobic biological treatment slightly decreased from 2019 to 2020; in addition, a visible contribution from WtE in Figure 10d further decreased the total indicator value in 2020 (COVID-19 Scenario), resulting in a lower value with respect to 2019 (Pre-COVID-19 scenario).
The Em indicator (Figure 10e,f) was dominated by the collected LFG combustion emissions, in particular NO2 emissions (included in LFG energy recovery contribution), generally lower for provincial territory PTMC than for provincial territory PTPU because of different assumptions and consequential inventory data on components in ICE exhaust gas resulting in the considered provincial territories (with specific NO2 emissions per FU, in provincial territory PTPU, almost 2.4–2.5 times larger than in provincial territory PTMC, see Table 2 and Table 5). The Em indicator slightly worsened from 2019 (Pre-COVID-19 scenario) to 2020 (COVID-19 scenario) in provincial territory PTPU (Figure 10e) because of the resulting higher volume of produced and consequently collected LFG sent to energy recovery during 2020. The same contribution also dominated the indicator for provincial territory PTMC (Figure 10f), but in this case, the volume of produced and, consequently, collected LFG was similar during 2019 and 2020, and so, the impact, while the slight decrease in the indicator from 2019 (Pre-COVID-19 scenario) to 2020 (COVID-19 scenario) was due to the negative contribution of WtE. The contribution from landfilling (of os-RMW and bios-OFRMW or direct RMWNO-COVID) was more evident in the case of provincial territory PTPU (Figure 10e) for the predominant sub-contribution of leachate treatment due to leachate specific production values higher in PTPU than in PTMC (see Table 2 and Table 5). Similarly, other indicators were dominated by the sub-contribution of the LFG combustion emissions (included in the LFG energy recovery contribution) as OD, POF, HTc, A, RUmm, IR, Ef, ETf, WU, LU, and RUf (Figures S4–S14 of the Supplementary Materials). Also, PM and Et indicators were dominated by the LFG combustion emissions for provincial territory PTPU, while for provincial territory PTMC, the contributions were more equally distributed (due to different assumptions and consequential inventory data on components in ICE exhaust gas, see Table 2 and Table 5) (Figures S15 and S16 of the Supplementary Materials).
Finally, given the mentioned impact of direct RMWNO-COVID-19 landfilling on the distinctive CC indicator in 2020 for provincial territory PTPU, it has been worth simulating, in a definable “hypothetical 2020” option oriented to a very strict precaution on lowering any potential spreading of the virus from management of RMW [33], what the CC indicator would have been in 2020 if the RMWNO-COVID-19 amounts, originally destined at diversified provincial partitions (see Section 3.1.2 and Figure S3 of the Supplementary Materials) for direct landfilling, were sent (in addition to RMWCOVID-19) to thermal treatment (WtE). As consequently shown in Figure 11, the potential option to address the RWMCOVID-19 and the RMWNO-COVID-19, originally destined for direct landfilling, to WtE (hypothetical 2020) would have reduced the value of the CC indicator by −15% with respect to 2020 (COVID-19 scenario) and −5% with respect to 2019 (Pre-COVID-19 scenario), in the case of provincial territory PTPU, and −4% with respect to 2020 (COVID-19 scenario) and −5% with respect to 2019 (Pre-COVID-19 scenario), in the case of provincial territory PTMC.
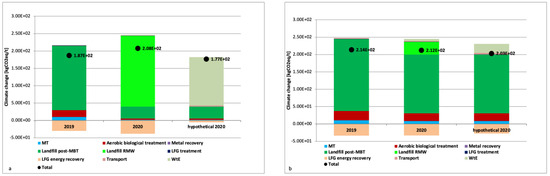
Figure 11.
Contribution to climate change (CC) for 2019 (Pre-COVID-19 scenario), 2020 (COVID-19 scenario), and hypothetical 2020 (with RMWCOVID-19 and RMWNO-COVID-19, originally destined for direct landfilling, to WtE) for provincial territories PTPU (a) and PTMC (b). The dots (total) display the resulting values of the indicator.
The results of this simulation agreed with several studies in the technical–scientific literature, showing how the introduction of WtE for RMW allows for an improvement in the CC indicator [41,70,71].
4. Conclusions
In 2020 (COVID-19 scenario), the pandemic resulted in limited quantitative reductions in the overall RMW in both provincial territories (PTPU, PTMC) compared to the preceding 2019 (ordinary Pre-COVID-19 scenario). These yearly reductions, qualitatively in agreement with concurrent and higher decreases in MW generation, were likely the effect of the closing of urban activities and material accumulations by citizens at home, partially counterbalanced by seasonal mitigations of restrictions. Although the yearly quantitative incidences of collected RMWCOVID-19 to overall RMW (COVID-19 scenario) were limited or minimal, particularly in provincial territory PTPU, the temporal evolutions of monthly incidences qualitatively paralleled the occurred evolution of the COVID-19 pandemic, with more evidence in provincial territory PTPU. As RMW is the remaining stream after the SC of MW, the contextual flow analysis on main separately collected MW fractions showed in 2020 (COVID-19 scenario) resulting decreases (for green waste more evidently, kitchen and canteen waste, and paper and carboard), increases (for glass), or almost invariances (for plastic and metal) in both provincial territories compared to the preceding 2019 (ordinary Pre-COVID-19 scenario).
The LCA results showed that adapted and combined management practices in 2020 (COVID-19 scenario) of direct thermal treatment (WtE) for RMWCOVID-19 (at limited amount) and addressing RMWNO-COVID-19 in a lower amount to direct landfilling and a prevailing amount to maintained and confined aerobic biostabilisation MBT + landfilling, as occurred in provincial territory PTMC, improved all the environmental indicators compared to the preceding year, 2019 (ordinary Pre-COVID-19 scenario), but with diversified relative performances. However, adapted and combined management practices in 2020 (COVID-19 scenario) of direct thermal treatment (WtE) for RMWCOVID-19 (but at minimal amount) and addressing RMWNO-COVID-19 in a lower amount to maintained aerobic biostabilisation MBT + landfilling, while sending a higher amount to direct landfilling, as occurred in provincial territory PTPU, improved the majority of environmental indicators compared to 2019 (ordinary Pre-COVID-19 scenario), again with diversified relative performances, but this worsened three indicators (CC, HTnc, and Em). Particularly, the contribution analysis of the mentioned indicators highlighted that the prolonged direct landfilling of RMWNO-COVID-19 implied burdens for the environment; the reduced adoption of the aerobic biostabilisation MBT generated limited savings for the environment; and addressing RMWCOVID-19 to direct thermal treatment (WtE), even if at limited amount, was able to generate some beneficial effects on the environment. Indeed, the hypothetical option of using WtE for the treatment (in addition to RMWCOVID-19) of RWMNO-COVID-19, originally destined—at diversified amounts—for direct landfilling in provincial territories PTPU and PTMC, would have implied improvements for the distinctive CC indicator. At the same time, the WTE option would have represented a strict precaution on the safety management of RMW during a pandemic like the COVID-19 one, by avoiding any waste movement expected during placement operations in the case of direct landfilling or any waste movement and transportation during treatment steps in the case of MBT with diversified locations of MT and aerobic biological treatment facilities.
Supplementary Materials
The following supporting information can be downloaded at https://www.mdpi.com/article/10.3390/recycling10020040/s1, Table S1: Mass balances of the aerobic biostabilisation MBTs in provincial territories PTPU and PTMC; Table S2: EE consumption for the MT steps expressed per tonne of incoming RMW; Table S3: EE and material consumptions for the aerobic biological treatment steps expressed per tonne of incoming us-OFRMW; Table S4: Air emissions after biofiltration from the aerobic biological treatment steps expressed per tonne of incoming us-OFRMW; Table S5: EE and water consumptions for landfilling expressed per tonne of deposited waste; Table S6: Leachate productions in landfilling expressed per tonne of deposited waste; Table S7: Representative BMPs and physico-chemical characteristics of bios-OFRMW, residual organic fraction in os-RMW, and organic fraction in RMW for provincial territories PTPU and PTMC; Table S8: LFG compositions for the controlled landfills in provincial territories PTPU and PTMC (NA = not available); Table S9: Exhaust gas compositions from ICEs for the controlled landfills in provincial territories PTPU and PTMC; Table S10: Basic consumption data for the considered WtE plant; Table S11: Elemental compositions for relevant waste material fractions; Table S12: Compositional characteristics (expressly in terms of the material fractions in Table S11) for the RMW in provincial territories PTPU and PTMC; Table S13: Elemental compositions of the RMW in provincial territories PTPU and PTMC; Table S14: LHVs of the RMW in provincial territories PTPU and PTMC and consequential EE productions by thermal treatment per tonne of input waste; Table S15: Basic output data (flue gas and residues) for the considered WtE plant; Table S16: Basic data on chemical consumptions (for FGC) and air emissions for the considered WtE plant; Table S17: Assumptions and resulting values of non-renewable CO2 emissions from thermal treatment of RMW in provincial territories PTPU and PTMC; Figure S1: COVID-19 scenario (2020), provincial territory PTPU: resulting monthly amounts of RMWCOVID-19 (a) and percentage ratios of RMWCOVID-19 to overall RMW (b); Figure S2: COVID-19 scenario (2020), provincial territory PTMC: resulting monthly amounts of RMWCOVID-19 (a) and percentage ratios of RMWCOVID-19 to overall RMW (b); Figure S3: COVID-19 scenario (2020): resulting amounts of RMWNO-COVID-19 yearly addressed to alternative management practices (see Figure 2) in provincial territories PTPU (a) and PTMC (b) and percentage partitions (c); Figure S4: Contribution of process units of RMW management for 2019 (Pre-COVID-19 scenario) and 2020 (COVID-19 scenario) to ozone depletion (OD) for provincial territories PTPU (a) and PTMC (b). The dots (total) display the resulting values of the indicator in Table 6; Figure S5: Contribution of process units of RMW management for 2019 (Pre-COVID-19 scenario) and 2020 (COVID-19 scenario) to photochemical ozone formation (POF) for provincial territories PTPU (a) and PTMC (b). The dots (total) display the resulting values of the indicator in Table 6; Figure S6: Contribution of process units of RMW management for 2019 (Pre-COVID-19 scenario) and 2020 (COVID-19 scenario) to human toxicity, cancer (HTc) for provincial territories PTPU (a) and PTMC (b). The dots (total) display the resulting values of the indicator in Table 6; Figure S7: Contribution of process units of RMW management for 2019 (Pre-COVID-19 scenario) and 2020 (COVID-19 scenario) to acidification (A) for provincial territories PTPU (a) and PTMC (b). The dots (total) display the resulting values of the indicator in Table 6; Figure S8: Contribution of process units of RMW management for 2019 (Pre-COVID-19 scenario) and 2020 (COVID-19 scenario) to resource use, mineral and metals (RUmm) for provincial territories PTPU (a) and PTMC (b). The dots (total) display the resulting values of the indicator in Table 6; Figure S9: Contribution of process units of RMW management for 2019 (Pre-COVID-19 scenario) and 2020 (COVID-19 scenario) to ionising radiation (IR) for provincial territories PTPU (a) and PTMC (b). The dots (total) display the resulting values of the indicator in Table 6; Figure S10: Contribution of process units of RMW management for 2019 (Pre-COVID-19 scenario) and 2020 (COVID-19 scenario) to eutrophication, freshwater (Ef) for provincial territories PTPU (a) and PTMC (b). The dots (total) display the resulting values of the indicator in Table 6; Figure S11: Contribution of process units of RMW management for 2019 (Pre-COVID-19 scenario) and 2020 (COVID-19 scenario) to ecotoxicity, freshwater (ETf) for provincial territories PTPU (a) and PTMC (b). The dots (total) display the resulting values of the indicator in Table 6; Figure S12: Contribution of process units of RMW management for 2019 (Pre-COVID-19 scenario) and 2020 (COVID-19 scenario) to water use (WU) for provincial territories PTPU (a) and PTMC (b). The dots (total) display the resulting values of the indicator in Table 6; Figure S13: Contribution of process units of RMW management for 2019 (Pre-COVID-19 scenario) and 2020 (COVID-19 scenario) to land use (LU) for provincial territories PTPU (a) and PTMC (b). The dots (total) display the resulting values of the indicator in Table 6; Figure S14: Contribution of process units of RMW management for 2019 (Pre-COVID-19 scenario) and 2020 (COVID-19 scenario) to resource use, fossils (RUf) for provincial territories PTPU (a) and PTMC (b). The dots (total) display the resulting values of the indicators in Table 6; Figure S15: Contribution of process units of RMW management for 2019 (Pre-COVID-19 scenario) and 2020 (COVID-19 scenario) to particulate matter (PM) for provincial territories PTPU (a) and PTMC (b). The dots (total) display the resulting values of the indicator in Table 6; Figure S16: Contribution of process units of RMW management for 2019 (Pre-COVID-19 scenario) and 2020 (COVID-19 scenario) to eutrophication, terrestrial (Et) for provincial territories PTPU (a) and PTMC (b). The dots (total) display the resulting values of the indicator in Table 6.
Author Contributions
Conceptualization, M.B., L.L. and F.T. (Fabio Tatàno); methodology, M.B., A.F., L.L. and F.T. (Fabio Tatàno); validation, M.B., L.L. and F.T. (Fabio Tatàno); formal analysis, M.B., L.L, F.T. (Fabio Tatàno) and V.S.; investigation, M.B., A.F. and V.S.; resources, L.L. and F.T. (Fabio Tatàno); data curation, M.B., L.L. and F.T. (Fabio Tatàno); writing—original draft preparation, L.L., F.T. (Fabio Tatàno) and F.T. (Francesca Tuci); writing—review and editing, L.L. and F.T. (Fabio Tatàno); visualization, M.B., L.L., F.T. (Fabio Tatàno) and F.T. (Francesca Tuci); supervision, L.L., F.T. (Fabio Tatàno) and P.S.; project administration, L.L. and F.T. (Fabio Tatàno); funding acquisition, L.L. and F.T. (Fabio Tatàno) All authors have read and agreed to the published version of the manuscript.
Funding
This research received no external funding.
Data Availability Statement
The data presented in this study are available on request from the corresponding authors.
Acknowledgments
The ARPAM—Environmental Protection Agency of the Marche Region is mentioned for the availability to permit the online carrying out of the final year internship of Valentina Spadi, during her MSc Course in Environmental Engineering, at its Waste Register Section. The authors thank S. de Rosa and E. Laici (at the ASET in Fano, Marche region), L. Giulianelli, F. Macor, R. Testalunga, and D. Ugolini (at the Marche Multiservizi in Pesaro, Marche region), and M. Bussolotto and M. Procaccini (at the COSMARI in Tolentino, Marche region) for providing useful information and MW operation data for the reference year 2020 in the respective provincial territories.
Conflicts of Interest
The authors declare no conflicts of interest.
References
- Chakraborty, I.; Maity, P. COVID-19 outbreak: Migration, effects on society, global environment and prevention. Sci. Total Environ. 2020, 728, 138882. [Google Scholar] [CrossRef] [PubMed]
- WHO (World Health Organisation). WHO Director-General’s Opening Remarks at the Media Briefing on COVID-19—11 March 2020. Available online: https://www.who.int/director-general/speeches/detail/who-director-general-s-opening-remarks-at-the-media-briefing-on-covid-19---11-march-2020 (accessed on 1 February 2024).
- Singer, B.J.; Thompson, R.N.; Bonsall, M.B. The effect of the definition of “pandemic” on quantitative assessments of infectious disease outbreak risk. Sci. Rep. 2021, 11, 2547. [Google Scholar] [CrossRef] [PubMed]
- Das, A.K.; Islam, M.N.; Billah, M.M.; Sarker, A. COVID-19 and municipal solid waste (MSW) management: A review. Environ. Sci. Pollut. Res. 2021, 28, 28993–29008. [Google Scholar] [CrossRef] [PubMed]
- Di Maria, F.; Beccaloni, E.; Bonadonna, L.; Cini, C.; Confalonieri, E.; La Rosa, G.; Milana, M.R.; Testai, E.; Scaini, F. Minimization of spreading of SARS-CoV-2 via household waste produced by subjects affected by COVID-19 or in quarantine. Sci. Total Environ. 2020, 743, 140803. [Google Scholar] [CrossRef]
- Filho, W.L.; Voronova, V.; Kloga, M.; Paço, A.; Minhas, A.; Salvia, A.L.; Ferreira, C.D.; Sivapalan, S. COVID-19 and waste production in households: A trend analysis. Sci. Total Environ. 2021, 777, 145997. [Google Scholar] [CrossRef]
- Kulkarni, B.N.; Anantharama, V. Repercussions of COVID-19 pandemic on municipal solid waste management: Challenges and opportunities. Sci. Total Environ. 2020, 743, 140693. [Google Scholar] [CrossRef]
- Nghiem, L.D.; Morgan, B.; Donner, E.; Short, M.D. The COVID-19 pandemic: Considerations for the waste and wastewater services sector. Case Stud. Chem. Environ. Eng. 2020, 1, 100006. [Google Scholar] [CrossRef]
- Fan, Y.V.; Jiang, P.; Hemzal, M.; Klemeš, J.J. An update of COVID-19 influence on waste management. Sci. Total Environ. 2021, 754, 142014. [Google Scholar] [CrossRef]
- Dente, S.M.R.; Hashimoto, S. COVID-19: A pandemic with positive and negative outcomes on resource and waste flows and stocks. Resour. Conserv. Recycl. 2020, 161, 104979. [Google Scholar] [CrossRef]
- Ragazzi, M.; Rada, E.C.; Schiavon, M. Municipal solid waste management during the SARS-CoV-2 outbreak and lockdown ease: Lessons from Italy. Sci. Total Environ. 2020, 745, 141159. [Google Scholar] [CrossRef]
- Saadat, S.; Rawtani, D.; Hussain, C.M. Environmental perspective of COVID-19. Sci. Total Environ. 2020, 728, 138870. [Google Scholar] [CrossRef] [PubMed]
- Christensen, T.H. Industrial waste. In Solid Waste Technology & Management; Christensen, T.H., Ed.; John Wiley & Sons Ltd.: Chichester, UK, 2010; Volume 1, pp. 100–103. [Google Scholar]
- European Parliament and Council of the European Union. Directive (EU) 2018/851 of the European Parliament and of the Council of 30 May 2018 amending Directive 2008/98/EC on waste. Off. J. Eur. Union 2018, L 150, 109–140.
- van Straten, B.; Ligtelijn, S.; Droog, L.; Putman, E.; Dankelman, J.; Sperna Weiland, N.H.; Horeman, T. A life cycle assessment of reprocessing face masks during the COVID-19 pandemic. Sci. Rep. 2021, 11, 17680. [Google Scholar] [CrossRef] [PubMed]
- Ajaj, R.; Dweik, R.A.; Syed Ali, S.A.; Stietiya, M.H. Life cycle assessment studies to evaluate the sustainability of various facemasks used during COVID-19: A UAE case study. J. Environ. Chem. Eng. 2023, 11, 110491. [Google Scholar] [CrossRef]
- Maceno, M.M.C.; João, S.; Voltolini, D.R.; Zattar, I.C. Life cycle assessment and circularity evaluation of the non-medical masks in the COVID-19 pandemic: A Brazilian case. Environ. Dev. Sustain. 2023, 25, 8055–8082. [Google Scholar] [CrossRef]
- Zhao, H.; Liu, H.; Wei, G.; Wang, H.; Zhu, Y.; Zhang, R.; Yang, Y. Comparative life cycle assessment of emergency disposal scenarios for medical waste during the COVID-19 pandemic in China. Waste Manag. 2021, 126, 388–399. [Google Scholar] [CrossRef]
- Lu, D.; Iqbal, A.; Zan, F.; Liu, X.; Dong, Z.; Jiang, C.; Chen, G. Integrated life cycle assessment with data envelopment analysis for enhancing medical waste management during a public health crisis. J. Clean. Prod. 2023, 426, 139074. [Google Scholar] [CrossRef]
- Belhadi, A.; Kamble, S.S.; Khan, S.A.R.; Touriki, F.E.; Kumar, D.M. Infectious waste management strategy during COVID-19 pandemic in Africa: An integrated decision-making framework for selecting sustainable technologies. Environ. Manag. 2020, 66, 1085–1104. [Google Scholar] [CrossRef]
- Shekoohiyan, S.; Hadadian, M.; Heidari, M.; Hosseinzadeh-Bandbafha, M. Life cycle assessment of Tehran municipal solid waste during the COVID-19 pandemic and environmental impacts prediction using machine learning. Case Stud. Chem. Environ. Eng. 2023, 7, 100331. [Google Scholar] [CrossRef]
- Colvero, D.A.; Pfeiffer, S.C.; Ramalho, J.C.M.; do Nascimento, A.A.; de Lima, A.C.A. Identification of environmental impacts associated with municipal solid waste management through life cycle assessment. Int. J. Environ. Sci. Technol. 2024, 1–18. [Google Scholar] [CrossRef]
- Aldaco, R.; Hoehn, D.; Laso, J.; Margallo, M.; Ruiz-Salmón, J.; Cristobal, J.; Kahhat, R.; Villanueva-Rey, P.; Bala, A.; Batlle-Bayer, L.; et al. Food waste management during the COVID-19 outbreak: A holistic climate, economic and nutritional approach. Sci. Total Environ. 2020, 742, 140524. [Google Scholar] [CrossRef] [PubMed]
- Italian President of the Council of Ministers. Decree of 1 March 2020 on urgent measures in containing and managing the COVID-19 epidemic emergency. Ital. Off. Gaz. 2020, 52, 1–6. (In Italian) [Google Scholar]
- ISPRA (Italian Institute for Environmental Protection and Research). Municipal Waste Report—Edition 2023; Report Series No. 393/2023; ISPRA: Rome, Italy, 2023. (In Italian)
- ISTAT (Italian National Institute of Statistics). The Extensions of Italian Municipalities, Provinces, and Regions; Report; ISTAT: Rome, Italy, 2013. (In Italian)
- ARPAM (Environmental Protection Agency of the Marche Region). Annual Report on Municipal Waste in the Marche Region. 2019; Boccarossa, M., Ed.; ARPAM: Pesaro, Italy, 2020. (In Italian)
- ARPAM. Annual Report on Municipal Waste in the Marche Region 2020; Boccarossa, M., Ed.; ARPAM: Pesaro, Italy, 2021. (In Italian)
- European Commission. Commission Decision of 18 December 2014 amending Decision 2000/532/EC on the list of waste pursuant to Directive 2008/98/EC of the European Parliament and of the Council. Off. J. Eur. Union 2014, L 370, 44–86.
- Carchesio, M.; Di Addario, M.; Tatàno, F.; de Rosa, S.; Gambioli, A. Evaluation of the biochemical methane potential of residual organic fraction and mechanically-biologically treated organic outputs intended for landfilling. Waste Manag. 2020, 113, 20–31. [Google Scholar] [CrossRef] [PubMed]
- Boccarossa, M.; Di Addario, M.; Folino, A.; Tatàno, F. Scenarios of bioenergy recovery from organic fraction of residual municipal waste in the Marche Region (Italy). Sustainability 2021, 13, 11462. [Google Scholar] [CrossRef]
- European Commission. Waste Management in the Context of the Coronavirus Crisis; European Commission: Brussels, Belgium, 2020.
- ISS (Italian National Institute of Health). Interim Guidance to Manage Municipal Waste Related to the Transmission of the SARS-CoV-2 Virus Infection; Report Series ISS COVID-19 No. 3/2020, rev. 2; ISS: Rome, Italy, 2020. (In Italian) [Google Scholar]
- ECDC (European Centre for Disease Prevention and Control). Infection Prevention and Control in the Household Management of People with Suspected or Confirmed Coronavirus Disease (COVID-19); ECDC Technical Report; ECDC: Stockholm, Sweden, 2020.
- President of the Marche Region. Decree No. 13 of 21 March 2020 on Urgent Measures to Manage the Municipal Waste in the COVID-19 Epidemic Emergency; Marche Region: Ancona, Italy, 2020; Available online: https://www.regione.marche.it/ars/Aree-di-Attività/Coronavirus/Normativa-regionale (accessed on 1 February 2024). (In Italian)
- President of the Marche Region. Decree No. 23 of 24 April 2020 on Further Measures to Manage the Municipal Waste in the COVID-19 Epidemic Emergency; Marche Region: Ancona, Italy, 2020; Available online: https://www.regione.marche.it/ars/Aree-di-Attività/Coronavirus/Normativa-regionale (accessed on 1 February 2024). (In Italian)
- Province of Macerata. Permit on Integration Pollution Prevention and Control for the Installation of Treatment Plant for Non-Hazardous Waste in the Municipality of Tolentino; Decision No. 150—Section 10; Province of Macerata: Macerata, Italy, 2016; Available online: https://istituzionale.provincia.mc.it/avvisi-cms/elenco-autorizzazioni-integrate-ambientali/ (accessed on 1 February 2024). (In Italian)
- Sauve, S.; Van Acker, K. The environmental impacts of municipal solid waste landfills in Europe: A life cycle assessment of proper reference cases to support decision making. J. Environ. Manag. 2020, 261, 110216. [Google Scholar] [CrossRef]
- Rigamonti, L.; Grosso, M.; Biganzoli, L. Environmental assessment of refuse-derived fuel co-combustion in a coal-fired power plant. J. Ind. Ecol. 2012, 16, 748–760. [Google Scholar] [CrossRef]
- Fiorentino, G.; Ripa, M.; Protano, G.; Hornsby, C.; Ulgiati, S. Life cycle assessment of mixed municipal solid waste: Multi-input versus multi-output perspective. Waste Manag. 2015, 46, 599–611. [Google Scholar] [CrossRef]
- Mancini, G.; Lombardi, L.; Luciano, A.; Bolzonella, D.; Viotti, P.; Fino, D. A reduction in global impacts through a waste-wastewater-energy nexus: A life cycle assessment. Energy 2024, 289, 130020. [Google Scholar] [CrossRef]
- ARPAM. The Role of the Environmental Protection Agency of the Marche Region in Elaboration of Waste Data; Boccarossa, M., Ed.; ARPAM: Pesaro, Italy, 2016. Available online: https://www.arpa.marche.it/temi-ambientali/2012-06-12-08-52-59 (accessed on 1 February 2024). (In Italian)
- ISO 14040; Environmental Management—Life Cycle Assessment—Principles and Framework. ISO: Geneva, Switzerland, 2006.
- ISO 14044; Environmental Management—Life Cycle Assessment—Requirements and Guidelines. ISO: Geneva, Switzerland, 2006.
- Ardolino, F.; Berto, C.; Arena, U. Environmental performances of different configurations of a material recovery facility in a life cycle perspective. Waste Manag. 2017, 68, 662–676. [Google Scholar] [CrossRef]
- Avadí, A.; Aissani, L.; Pradel, M.; Wilfart, A. Life cycle inventory data on French organic waste treatments yielding organic amendments and fertilisers. Data Brief 2020, 28, 105000. [Google Scholar] [CrossRef] [PubMed]
- COSMARI. Environmental Statement for the Year 2019 according to the Commission Regulation (EU) 2018/2026; COSMARI: Tolentino, Italy, 2020. (In Italian) [Google Scholar]
- ASET. Annual Report 2019 for the Controlled Landfill for Non-hazardous Waste in Fano Town District; Farina, D., Ed.; ASET: Fano, Italy, 2020. (In Italian) [Google Scholar]
- Marche Multiservizi. Annual Report 2019 for the Controlled Landfill for Non-hazardous Waste in Pesaro Town District; Farina, D., Ed.; Marche Multiservizi: Pesaro, Italy, 2020. (In Italian) [Google Scholar]
- Marche Multiservizi. Annual Report 2019 for the Controlled Landfill for Non-hazardous Waste in Urbino Town District; Cioppi, L., Ed.; Marche Multiservizi: Pesaro, Italy, 2020. (In Italian) [Google Scholar]
- Christensen, T.H.; Kjeldsen, P.; Bjerg, P.L.; Jensen, D.L.; Christensen, J.B.; Baun, A.; Albrechtsen, H.J.; Heron, G. Biogeochemistry of landfill leachate plumes. Appl. Geochem. 2001, 16, 659–718. [Google Scholar] [CrossRef]
- Carchesio, M.; Di Addario, M.; Tatàno, F.; de Rosa, S.; Gambioli, A. Biochemical Methane Potential of Intermediate and Final Outputs from Biostabilisation MBT. In Proceedings of the Venice 2020, 8th International Symposium on Energy from Biomass and Waste, Venice, Italy, 16–19 November 2020; CISA Publisher: Padova, Italy, 2020; pp. 1–2. [Google Scholar]
- Capaccioni, B.; Caramiello, C.; Tatàno, F.; Viscione, A. Effects of a temporary HDPE cover on landfill gas emissions: Multiyear evaluation with the static chamber approach at an Italian landfill. Waste Manag. 2011, 31, 956–965. [Google Scholar] [CrossRef] [PubMed]
- Tatàno, F.; Viscione, A.; de Rosa, S.; Corigliano, G.; Capaccioni, B. Landfill Gas Emission Monitoring with the Static, Non-stationary Chamber Method: A Long-term (2005–2016) Study at an Italian Site. In Proceedings of the Sardinia 2017, Sixteenth International Waste Management and Landfill Symposium, S. Margherita di Pula, Cagliari, Italy, 2–6 October 2017; CISA Publisher: Padova, Italy, 2017; pp. 1–17. [Google Scholar]
- Province of Pesaro-Urbino. Permit on Integration Pollution Prevention and Control for the Controlled Landfill for Non-Hazardous Waste of the Fano Town District; Decision No. 1778—07/07/2010; Province of Pesaro-Urbino: Pesaro, Italy, 2010. (In Italian) [Google Scholar]
- Engineering ToolBox. Resources, Tools and Basic Information for Engineering and Design of Technical Applications. 2001. Available online: https://www.engineeringtoolbox.com (accessed on 1 February 2024).
- Pöschl, M.; Ward, S.; Owende, P. Evaluation of energy efficiency of various biogas production and utilization pathways. Appl. Energy 2010, 87, 3305–3321. [Google Scholar] [CrossRef]
- Herambiente. Annual Report for the WtE Plant for Non-Hazardous Waste in Coriano Town District; Herambiente: Rimini, Italy, 2020. (In Italian) [Google Scholar]
- Voss, R.; Lee, R.P.; Keller, F.; Huang, Q.; Fröhling, M. Decarbonization potential and economic viability of chemical recycling for China’s transformation towards carbon neutrality: Case analysis of global warming potential and costs of municipal solid waste gasification for methanol production. Resour. Conserv. Recycl. 2024, 206, 107613. [Google Scholar] [CrossRef]
- Calì, G.; Tedde, F.; Meloni, S.; Deiana, P.; Subrizi, M.; Bassano, C. Production of Gaseous Fuels, Coal Gasification and Biomass Co-gasification; ENEA (Italian National Agency for New Technologies, Energy and Sustainable Economic Development): Rome, Italy, 2016. (In Italian)
- Bogale, W.; Viganò, F. A preliminary comparative performance evaluation of highly efficient waste-to-energy plants. Energy Procedia 2014, 45, 1315–1324. [Google Scholar] [CrossRef]
- Lombardi, L.; Carnevale, E.A. Evaluation of the environmental sustainability of different waste-to-energy plant configurations. Waste Manag. 2018, 73, 232–246. [Google Scholar] [CrossRef]
- European Commission. Commission Recommendation of 9 April 2013 on the use of common methods to measure and communicate the life cycle environmental performance of products and organisations (2013/179/EU). Off. J. Eur. Union 2013, L 124, 1–210.
- Zampori, L.; Pant, R. Suggestions for Updating the Product Environmental Footprint (PEF) Method; JRC Technical Report EUR 29682 EN.; Publications Office of the European Union: Luxembourg, 2019. [Google Scholar]
- 2B. SimaPro LCA Software for Informed Change-Makers; 2B Srl: Mogliano Veneto, Italy. Available online: https://to-be.it/en/instruments/simapro-software-di-life-cycle-assessment/ (accessed on 1 February 2020).
- Ecoinvent. The Word’s Most Transparent Life Cycle Inventory Database; Ecoinvent: Zurich, Switzerland. Available online: https://ecoinvent.org (accessed on 1 February 2020).
- Italian Territorial Cohesion Agency. COVID-19: Collection of Acts Regarding Urgent Measures on Containment and Management of the Epidemic Emergency. Available online: https://www.agenziacoesione.gov.it/covid19-atti-emergenza-epidemiologica/ (accessed on 2 May 2022). (In Italian)
- Bracale, R.; Vaccaro, C.M. Changes in food choice following restrictive measures due to COVID-19. Nutr. Metab. Cardiovasc. Dis. 2020, 30, 1423–1426. [Google Scholar] [CrossRef]
- Zambrano-Monserrate, M.A.; Ruano, M.A.; Sanchez-Alcalde, L. Indirect effects of COVID-19 on the environment. Sci. Total Environ. 2020, 728, 138813. [Google Scholar] [CrossRef]
- Hupponen, M.; Grönman, K.; Horttanainen, M. Areas on which to focus when seeking to reduce the greenhouse gas emissions of commercial waste management. A case study of a hypermarket, Finland. Waste Manag. 2018, 76, 1–18. [Google Scholar] [CrossRef]
- Starostina, V.; Damgaard, A.; Eriksen, M.K.; Christensen, T.H. Waste management in the Irkutsk region, Siberia, Russia: An environmental assessment of alternative development scenarios. Waste Manag. Res. 2018, 36, 373–385. [Google Scholar] [CrossRef]

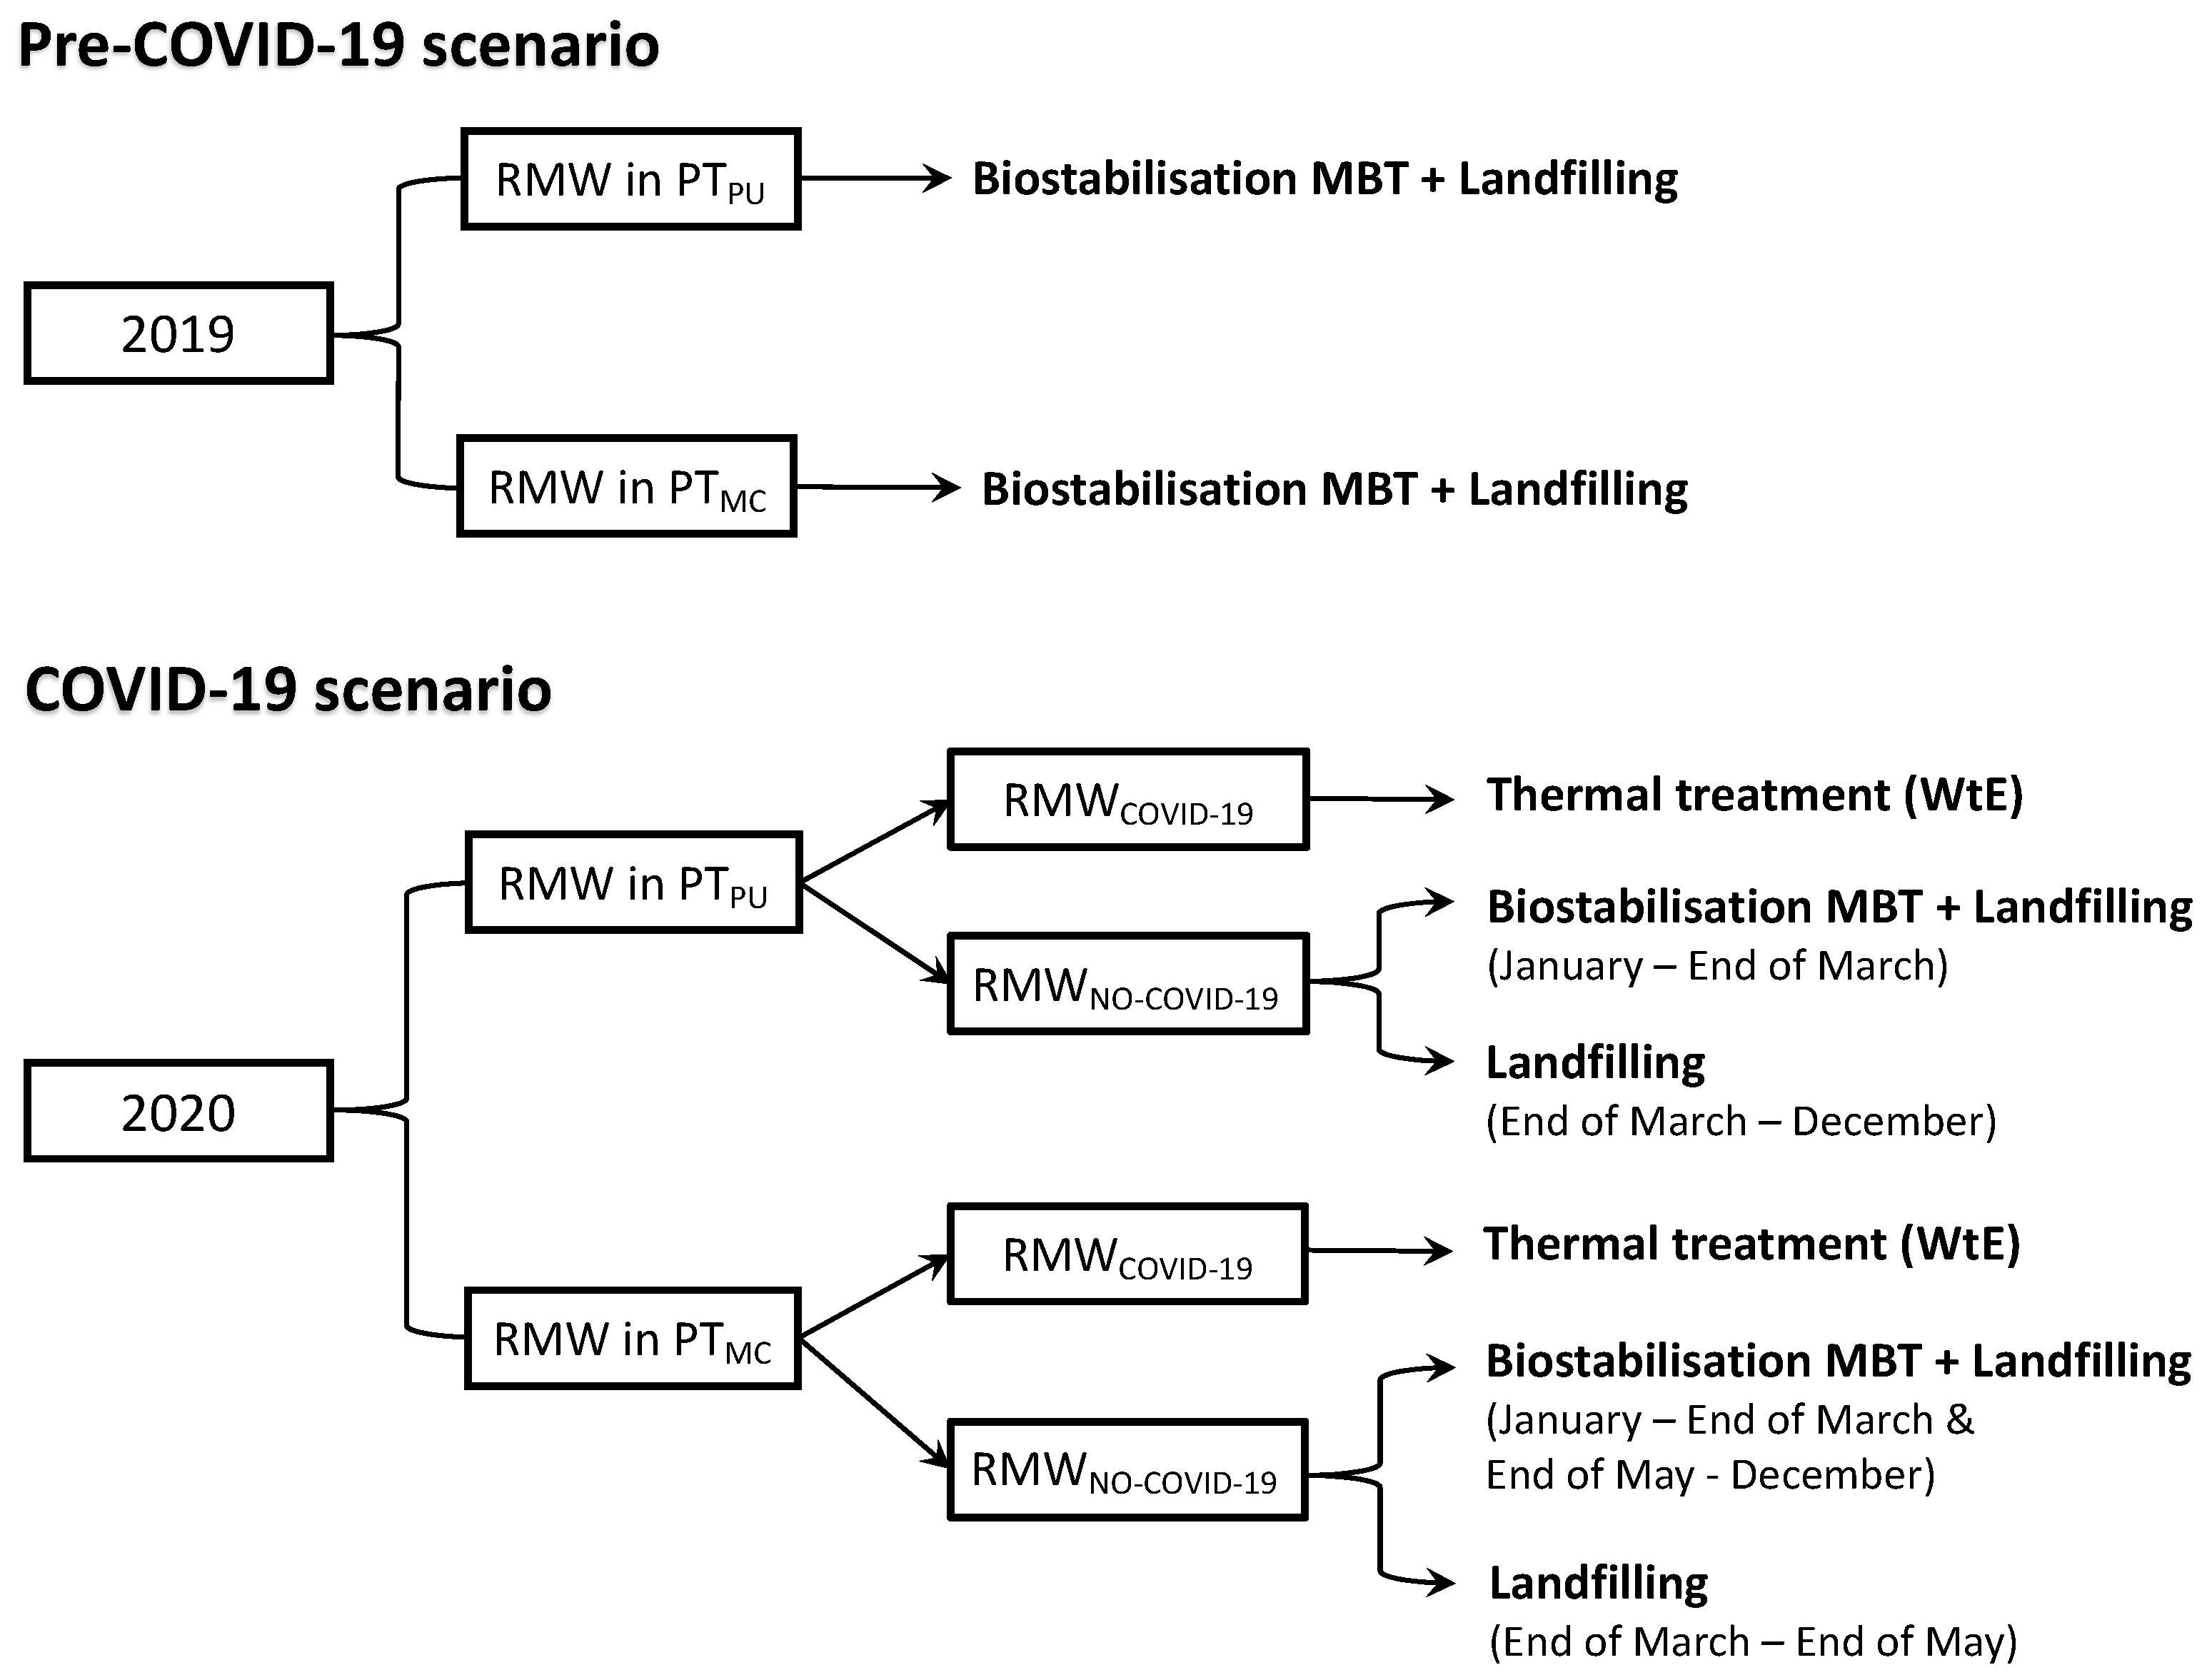

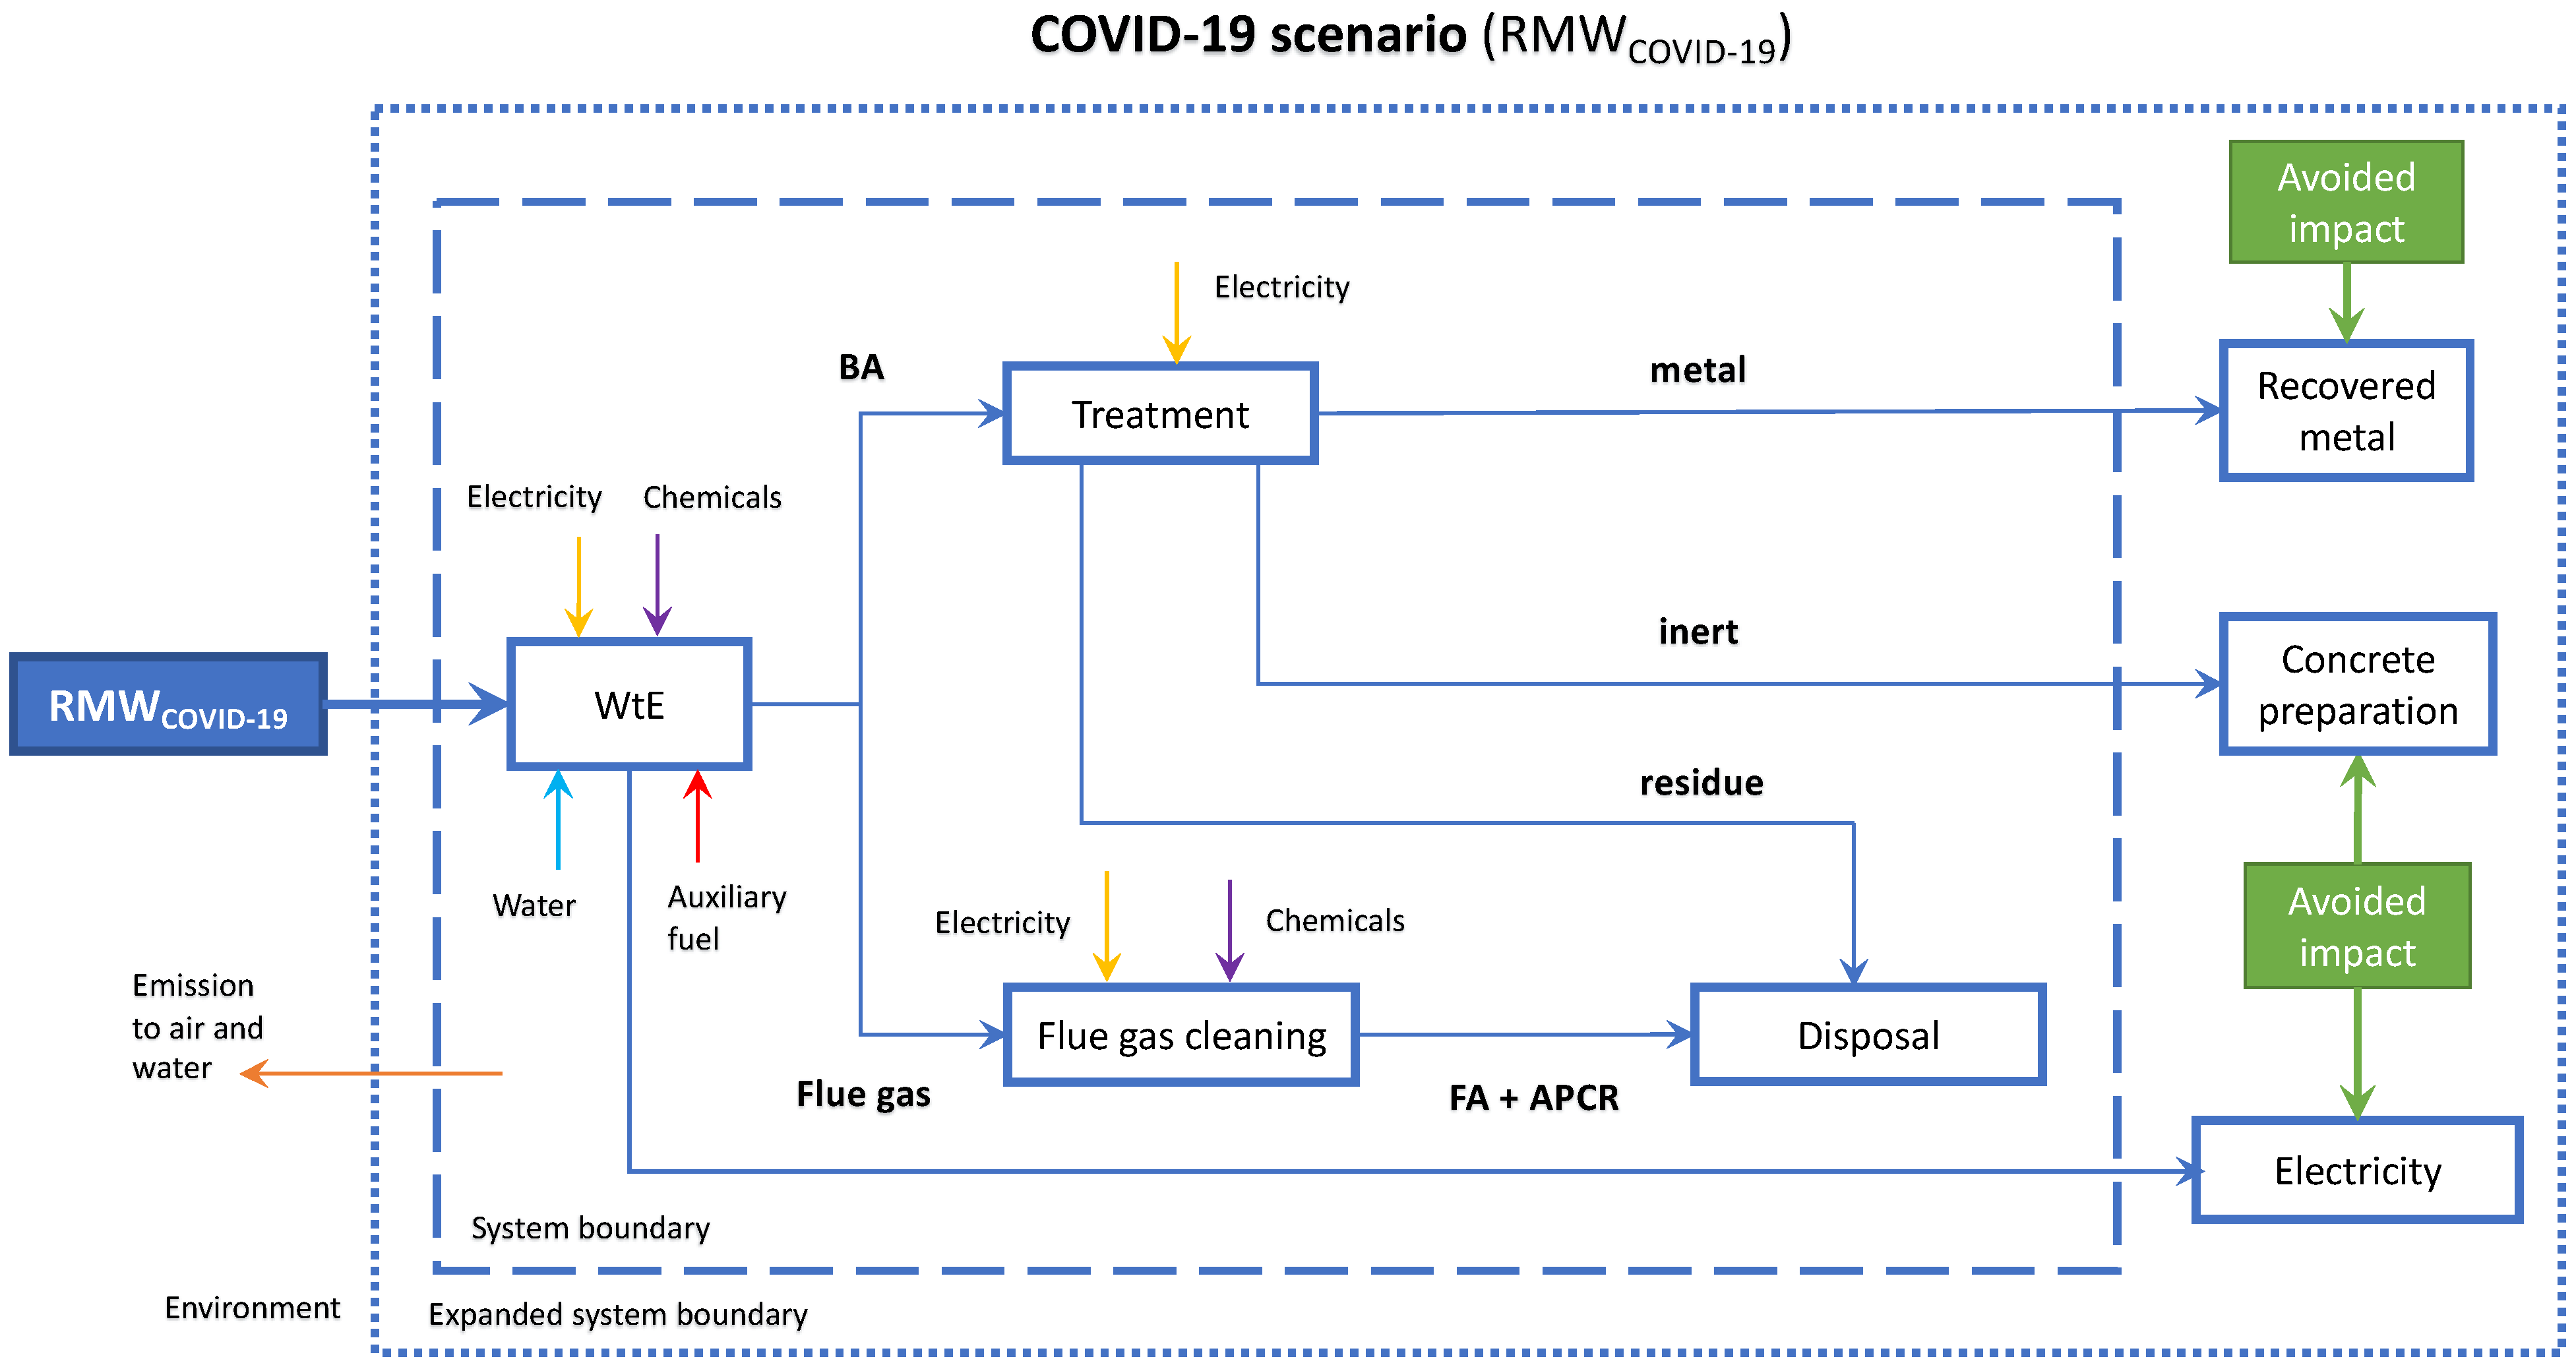
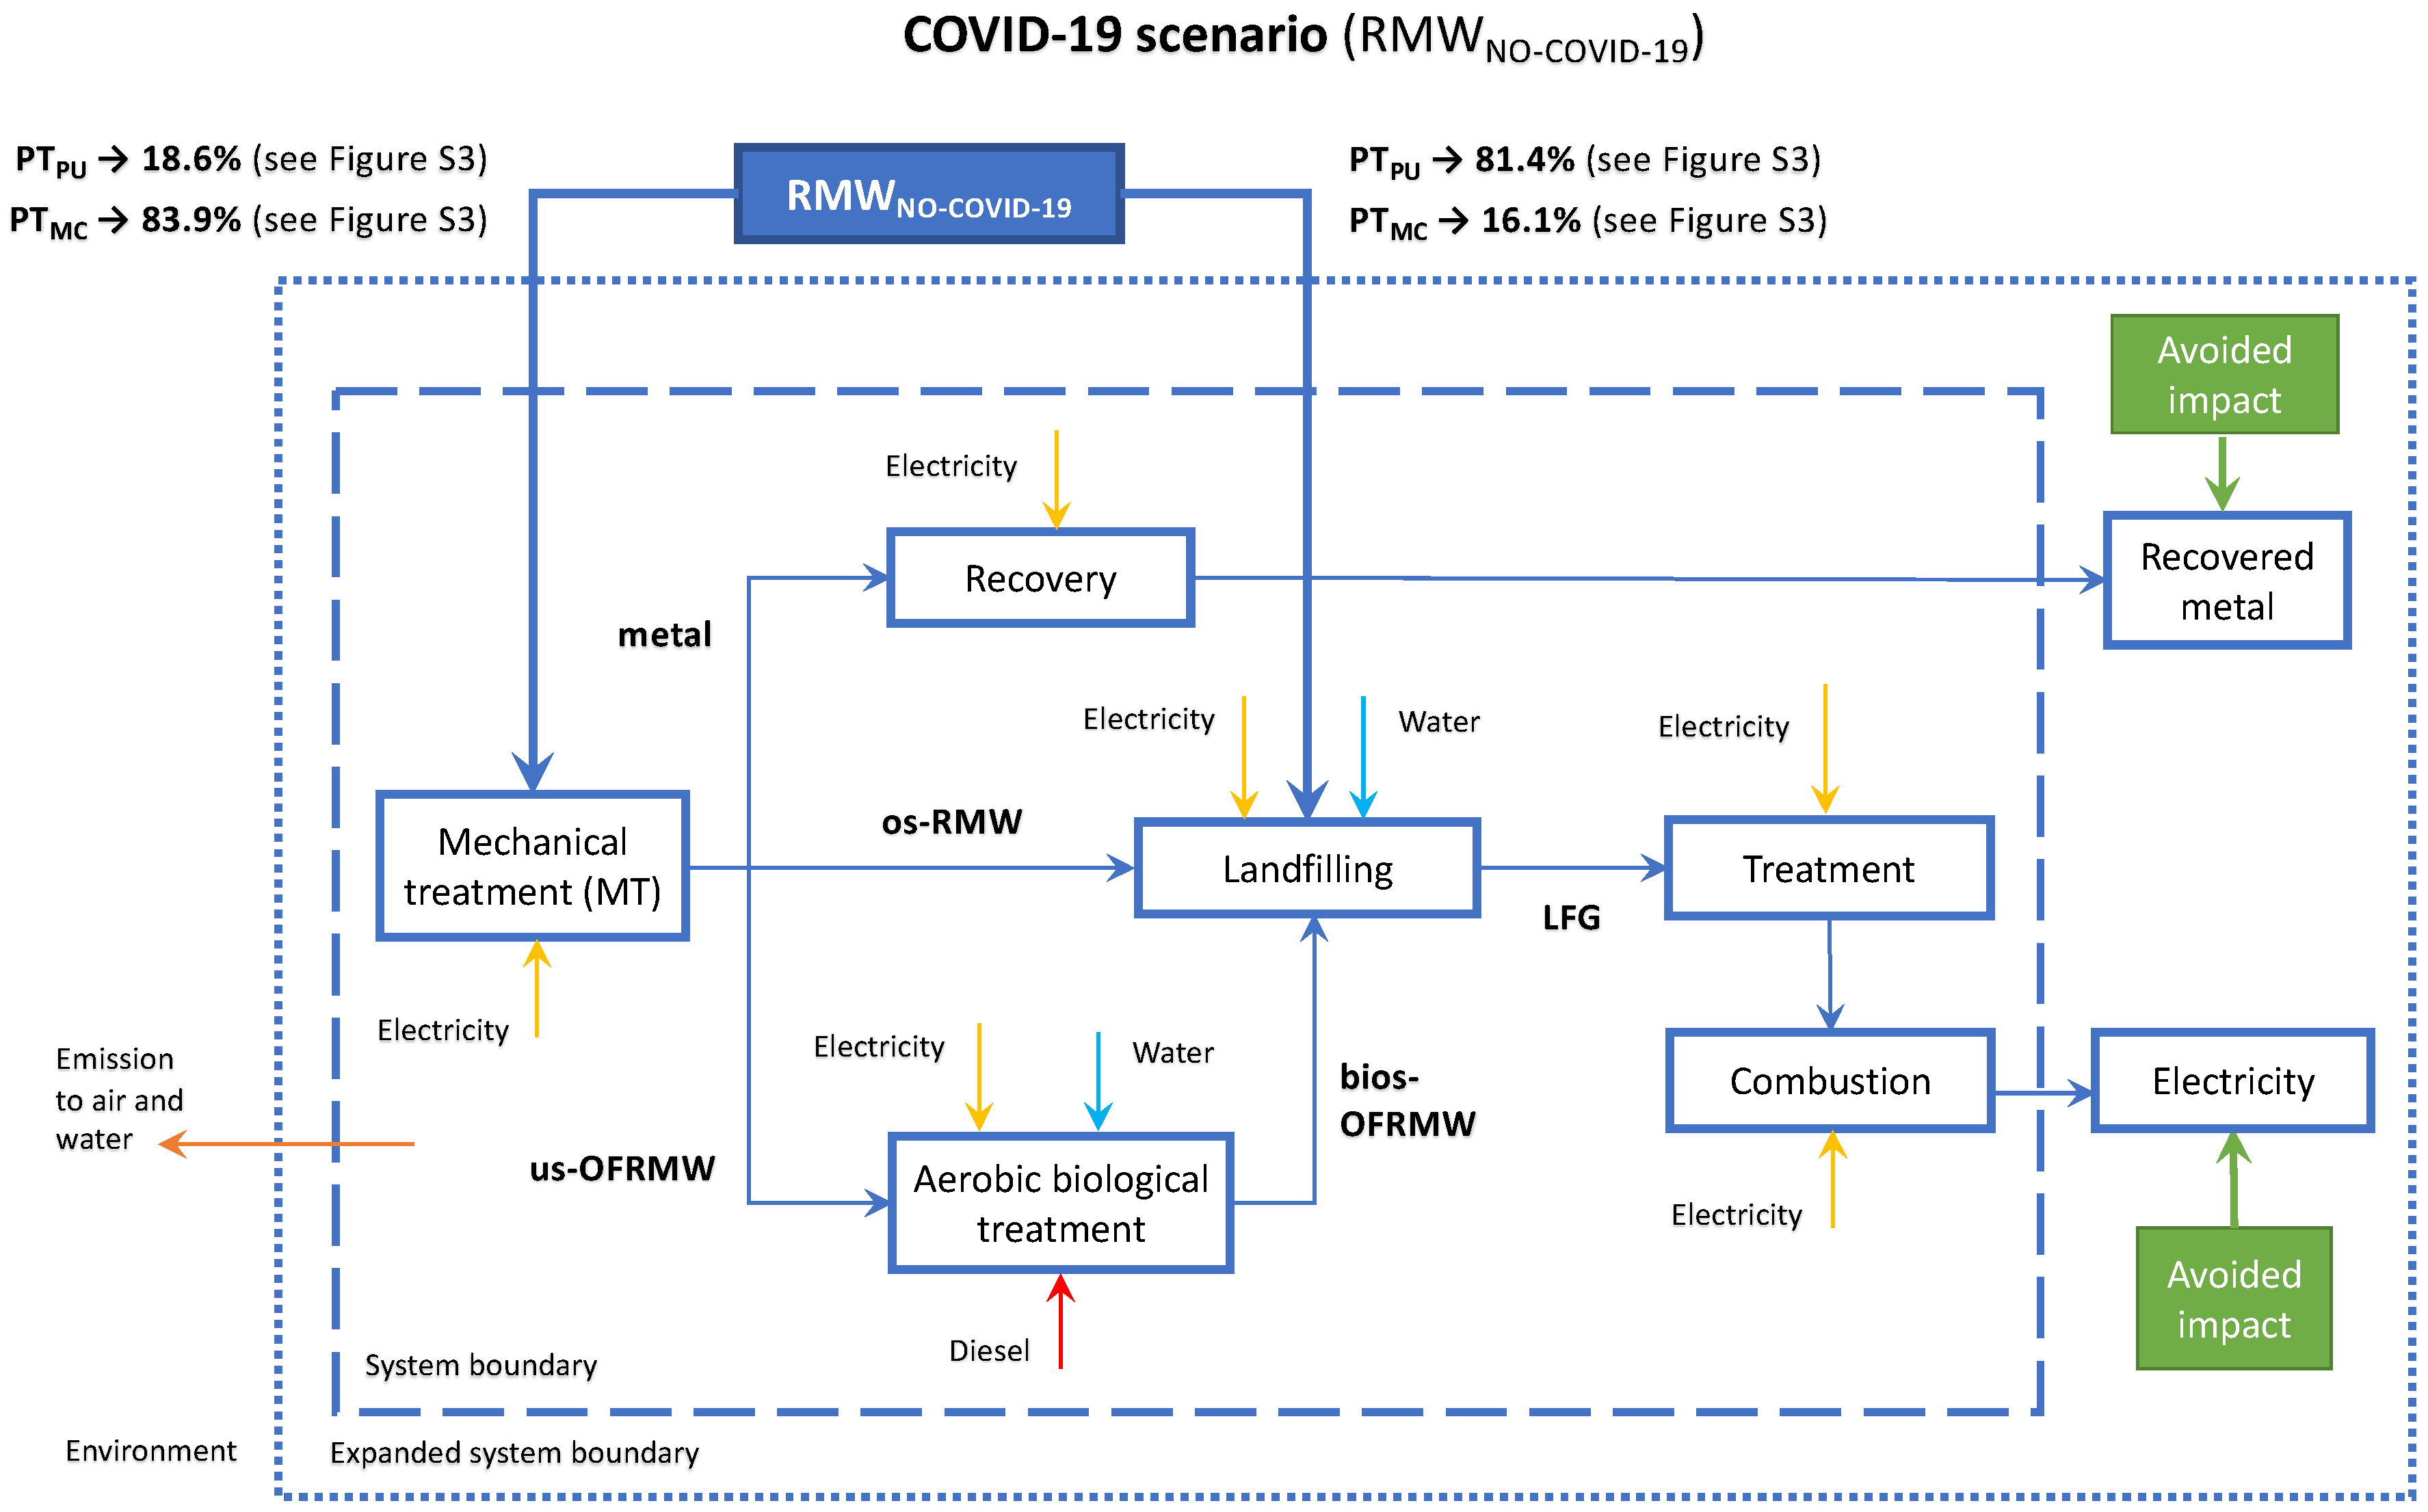
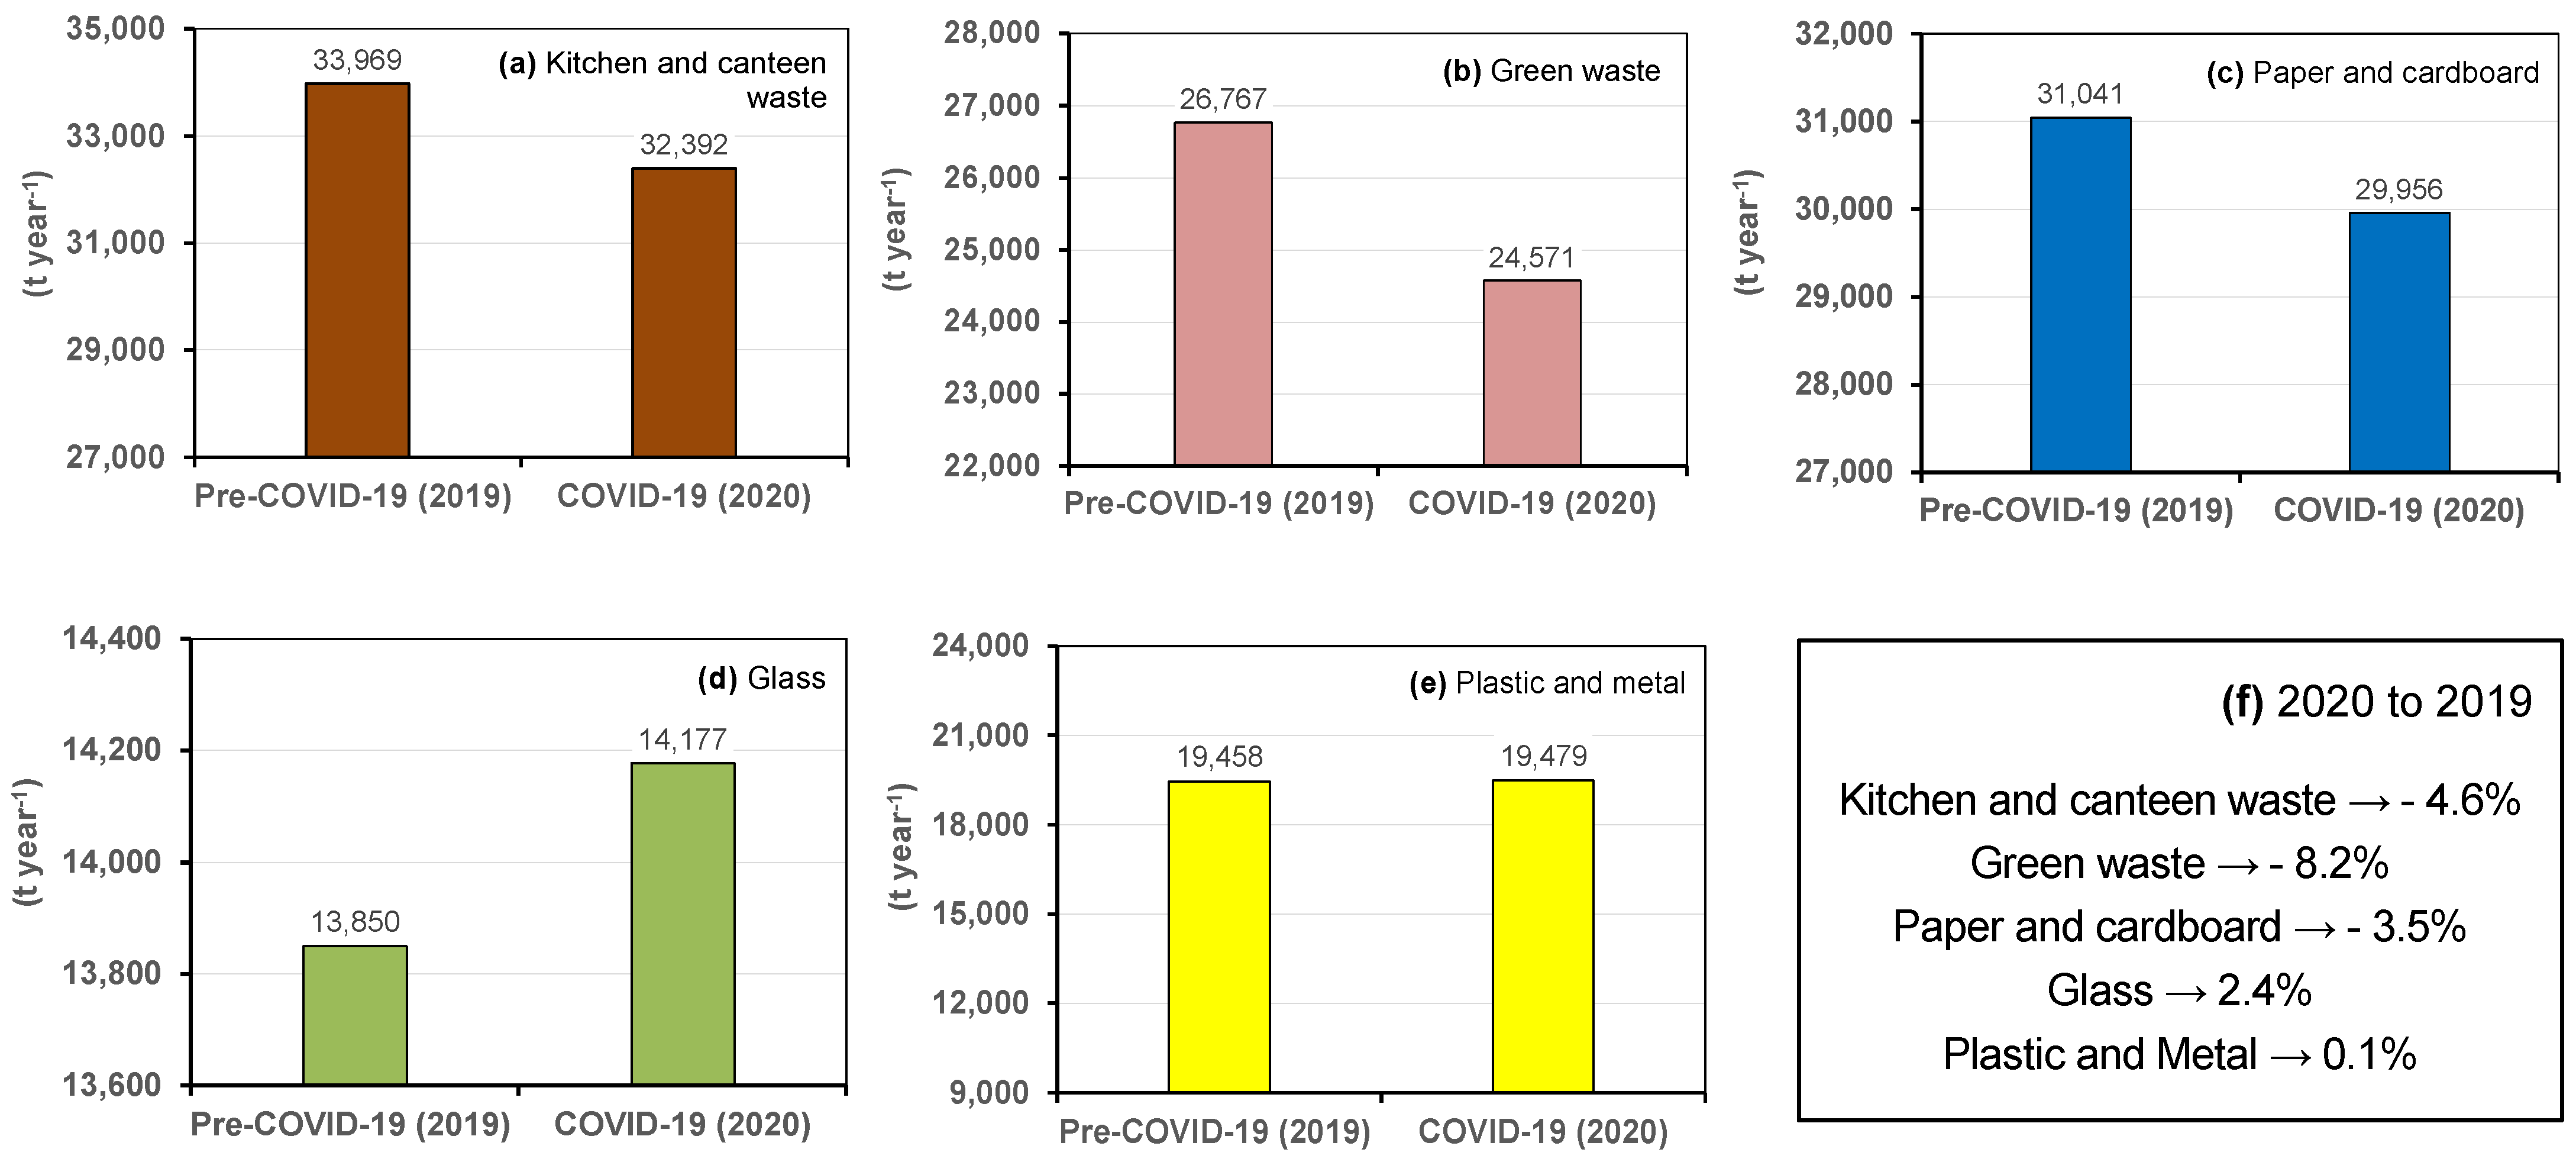

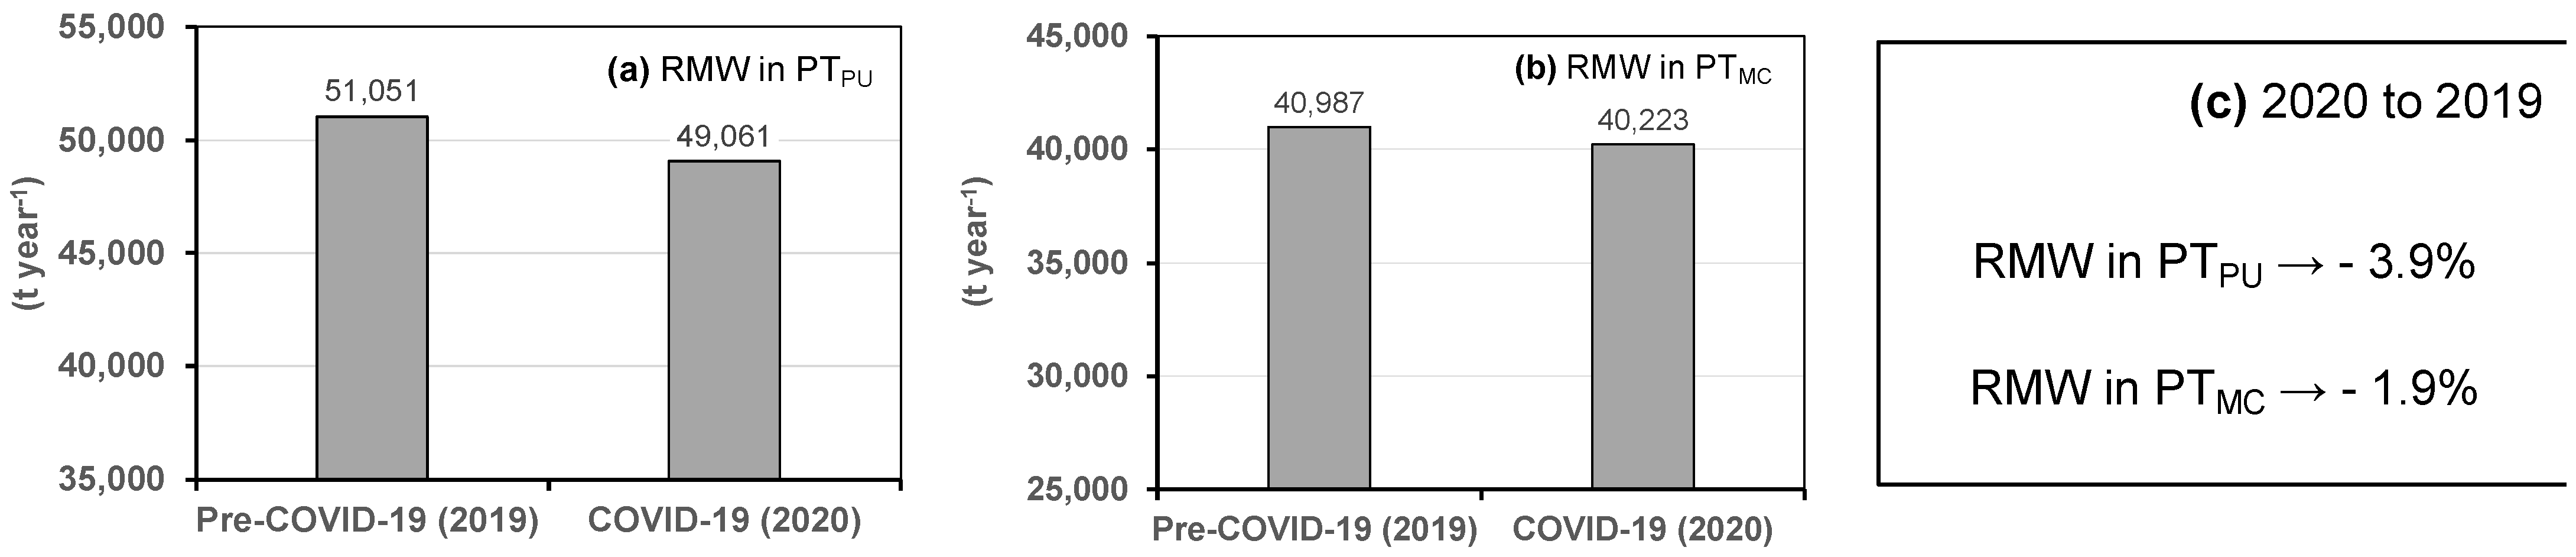
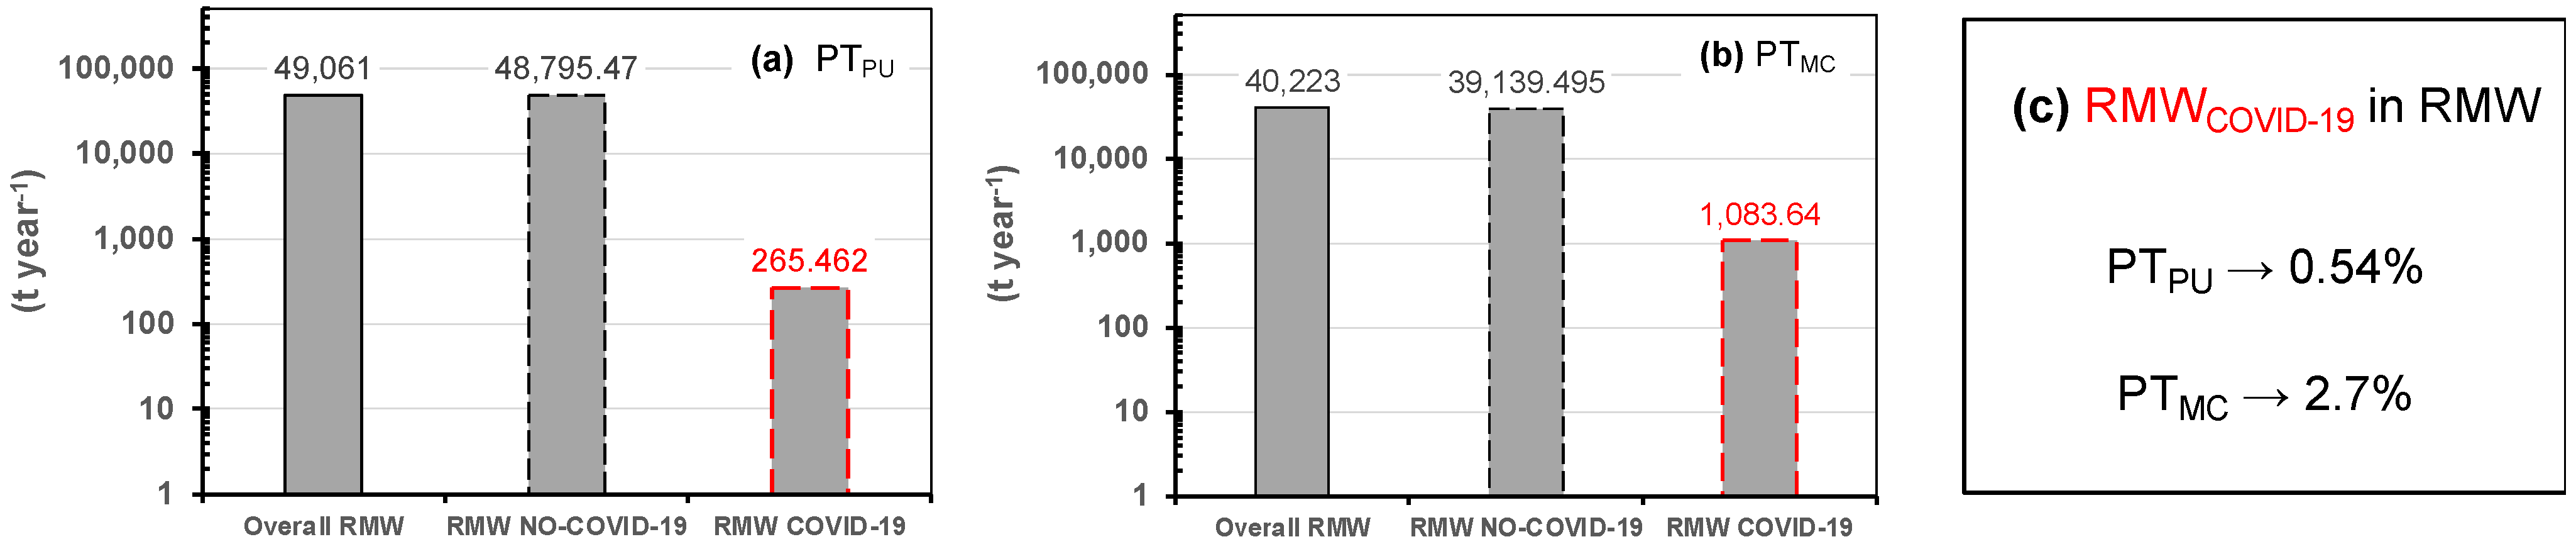
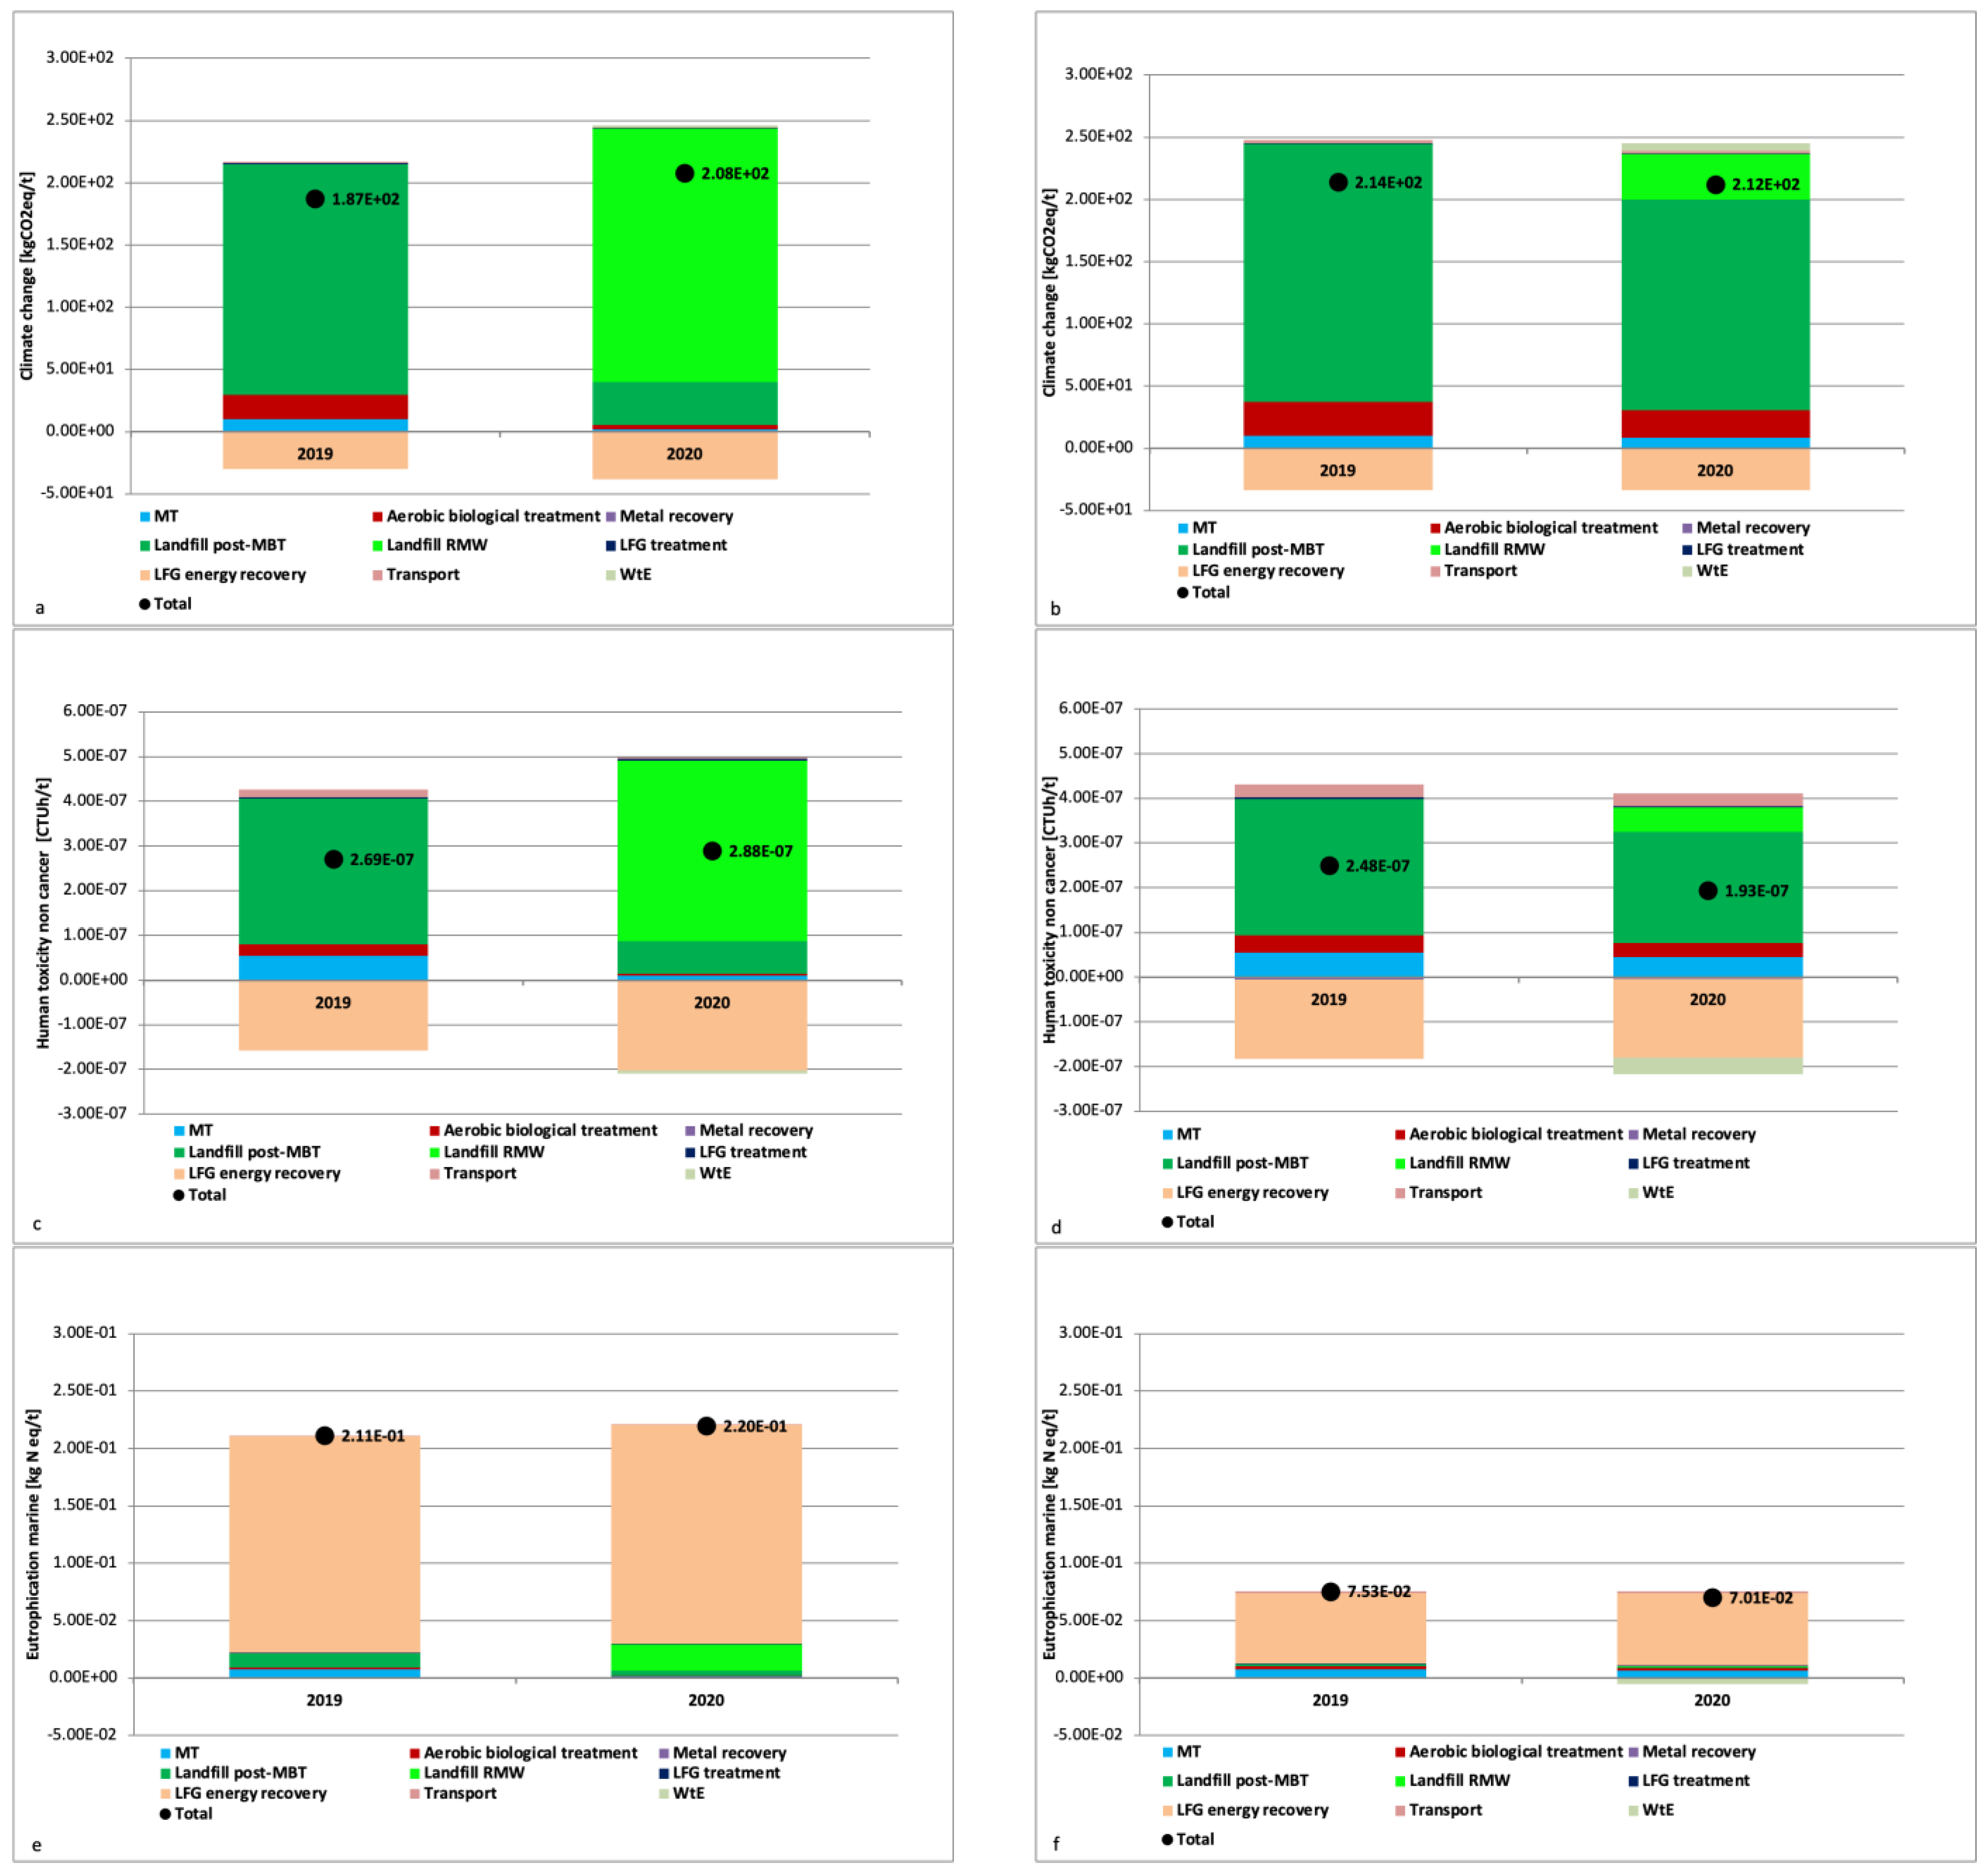

Disclaimer/Publisher’s Note: The statements, opinions and data contained in all publications are solely those of the individual author(s) and contributor(s) and not of MDPI and/or the editor(s). MDPI and/or the editor(s) disclaim responsibility for any injury to people or property resulting from any ideas, methods, instructions or products referred to in the content. |
© 2025 by the authors. Licensee MDPI, Basel, Switzerland. This article is an open access article distributed under the terms and conditions of the Creative Commons Attribution (CC BY) license (https://creativecommons.org/licenses/by/4.0/).