Abstract
Biomass ash is a byproduct of renewable energy generation that can be used in the cement and concrete industries as a supplementary cementitious material (SCM) to reduce their environmental impact. However, using biomass ashes as an SCM presents challenges, such as the distant location of crops and processing plants from cement and concrete plants, the absence of a supply chain to connect the biomass ash and cement/concrete producers, and the lack of a mechanism to set the price of the ash. We adopted a supply chain perspective to evaluate the environmental and economic impact of incorporating biomass ashes as an SCM in the cement and concrete industries. We developed a bilevel optimization model considering the strategic behavior of the two stakeholders of the supply chain: the biomass ash generator, which maximizes its profits by setting the price of the ash, and the cement/concrete manufacturer and minimizes its total operating costs, including the processes necessary to adapt its supply chain for the use of new raw material. We validated the model using data from the Colombian context at a nationwide industrial level. Our results indicate that introducing SCMs can potentially reduce CO2 emissions without increasing the cost of the supply chain.
1. Introduction
Cement and concrete production are major sources of carbon dioxide (CO2) emissions, one of the leading greenhouse gases responsible for climate change. The manufacturing process for cement, a key ingredient in concrete, produces large amounts of CO2 as a byproduct (0.58 t CO2 per t cement), according to the International Energy Agency [1]. Additionally, cement/concrete production requires a significant amount of energy, which also contributes to CO2 emissions. By reducing these emissions, we can help reduce greenhouse gases in the atmosphere and move closer to achieving net zero goals [2]. Indeed, many countries, agencies, and industrial consortiums worldwide are making efforts to tackle the challenges of decarbonizing cement [3,4].
Supplementary cementitious materials (SCMs) can be used to produce greener, more sustainable concrete. Several waste materials can be used as SCM. Industrial SCMs such as silica fume, fly ash, and blast furnace slag have pozzolanic properties that can partially replace cement in the concrete mix. SCMs can also be obtained from biomass ashes of agricultural wastes such as palm oil fuel, sugarcane bagasse, wood waste, bamboo leaves, wheat straw, corn cob, and rice husk [5,6,7,8,9]. The reader is referred to [9] for a comprehensive review of over 20 different SCMs available in India. The review analyzes their physical, chemical, mineral, and morphological properties, as well as their effects on concrete properties and environmental impact. Likewise, [10] presents a comprehensive review of the current state-of-the-art in future and emerging SCMs, including calcined clays, natural pozzolans, reclaimed coal fly ashes, biomass ashes, concrete recycling fines, and recycled glass.
SCMs help reduce CO2 emissions associated with cement production while improving the strength and durability of concrete, thereby extending its lifespan. Therefore, using SCMs is a promising approach to make concrete production more sustainable and eco-friendlier [5]. Nonetheless, the potential of carbon emission reduction offered by a given SCM is contingent on its environmental costs and technical viability [9]. While industrial byproducts are free of environmental cost at their origins, their main environmental added cost corresponds to their transportation and pre-processing.
Currently, a traditional SCM, such as concrete-grade fly ash generated from coal-fired electric generation, faces a decline in its availability due to environmental policies in the power industry [11]. Conversely, biomass ash production is growing thanks to the use of biomasses as renewable energy sources for heat and electricity generation [12]. Therefore, using biomass ashes as SCMs offers a synergetic solution that mitigates the cement/concrete industry’s environmental impact and provides a recycling alternative to the growing biomass ashes. However, the study of the valorization of the resulting biomass ashes from a circular supply chain perspective is seldom studied in the SCM literature [13].
As suggested in [9], combustible wastes should be prioritized over other SCMs because they have negative embodied energy and serve as fuel or energy sources. Under the Replace strategy of the circular economy [14], using biomass ashes as an SCM can be seen as a sort of industrial symbiosis, where by-products or waste materials from one industry are used in another, mainly as raw materials or secondary sources of energy [15]. A key feature of classical industrial symbiosis is the proximity of the different industries involved in the material/energy exchange [16]. By contrast, the main difficulty of using biomass ashes as an SCM is that relocating the industries that generate biomass or produce cement/concrete is not feasible due to logistical, market, natural, and geographic convenience factors. Hence, there are several challenges that may hinder the implementation of SCMs to produce greener concrete.
In addition, SCMs have been proven technically feasible and sustainable, but their supply chain implications require further study. For instance, the geographical dispersion of sources [17] and a fragmented supply chain make it difficult to coordinate stakeholders involved in material exchange. Furthermore, it is necessary for the existing cement/concrete supply chain to redesign its operation to incorporate this new raw material and for biomass ash producers to develop a pricing mechanism for its residue, adding complexity to the existing supply chains [18]. Therefore, in this paper, we focus on the incorporation of biomass ashes as SCMs from a supply chain perspective. We evaluate the environmental and economic impact of biomass ashes as SCMs while simultaneously addressing their pricing, considering the strategic behavior of the supply chain’s stakeholders through a bilevel optimization model—two aspects that have not been explored in the existing SCM literature.
The rest of this paper is organized as follows. Section 2 briefly reviews the relevant literature and summarizes the contribution of this paper to the extant literature. Section 3 presents the supply chain structure required for using biomasses as an SCM and describes the (bilevel) pricing problem used for its design and analysis. Section 4 presents a case study evaluating, from a supply chain perspective, two biomasses as possible SCMs in the Colombian context. Section 5 summarizes the paper’s main findings and suggests further research directions.
2. Literature Review
This paper addresses the redesign of the cement/concrete supply chain and the pricing of SCMs, integrating two types of optimization models: (i) facility location models for designing and planning the cement and concrete supply chain and (ii) bilevel optimization models for incorporating biomass into existing supply chains. Accordingly, a brief discussion of the relevant literature in these two fields, along with the paper’s contributions, follows.
2.1. Optimization Models for Supply Chains of Cement, Concrete, and SCMs
The studies reviewed highlight significant contributions to optimization models for cement/concrete supply chain design and planning [19], for reducing its environmental impact [20,21], and for improving its sustainability from a triple-bottom-line perspective [22]. However, they also reveal gaps in the inclusion of SCMs as new raw materials. Table 1 summarizes these studies, which will be further discussed below.

Table 1.
Optimization models and other tools used in the cement/concrete supply chain analysis.
Several studies have analyzed the economic, environmental, or social impact of SCMs using traditional GIS [23] and LCA analysis [24], as well as mono-objective [25] and multi-objective optimization models [26] and emerging machine learning tools [27]. However, none have examined these materials from the unique perspective presented in this paper, which combines supply chain (re)design modeling with SCM pricing through a bilevel optimization approach.
The planning and design of cement or concrete supply chains have been addressed recently in the optimization literature. For instance, Dikos and Spyropoulou [19] describe the use of mixed integer linear programming (MILP) models to optimize the supply chain of the largest Greek cement producer. Given the high environmental impact of the cement supply chain, Cadavid-Giraldo et al. [20] used a MILP model to decide on technology update projects in manufacturing process stages, fuels, and supplier’s selection, and optimal transport flows in an existing cement supply chain, aiming to minimize total cost and associated environmental impacts. The key results show that emissions and operating costs are reduced when most of the currently operating equipment is shut down, and technological upgrades are implemented, while the capacities of the equipment that remains in operation are increased. Recently, their model has been extended to include CO2 taxes and evaluate their environmental impact on the supply chain [21]. Another study [22] proposed a comprehensive framework for analyzing sustainability in cement supply chains using a triple-bottom-line approach that considers economic, environmental, and social factors under a multi-objective MILP model to provide decision-makers with balanced strategies. The authors used a customized algorithm called GoNDEF (Generator of Non-Dominated and Efficient Frontier) to generate Pareto-optimal solutions. However, SCMs were not included in this and other previous optimization studies. In contrast, the following studies analyze the impact of SCMs on cement/concrete supply chains using different tools.
Building on the analysis of SCMs in the concrete supply chains, Göswein et al. [24] conducted a supply chain study on the environmental impact of concrete mixes with recycled aggregates and fly ash as SCM. While the use of SCMs and recycled aggregates resulted in greener concrete, transportation emerged as a significant factor affecting the mix’s environmental impact. Despite the need for a supply chain perspective to analyze SCMs from biomass ashes [13], their study did not consider other stages of the supply chain, cost factors, and optimization models due to a lack of accurate information in the Portuguese context. In a similar study, Jamora [23] analyzed potential reductions in cost and CO2 emissions by using fly ash as an SCM in the Philippines. Their analysis revealed a positive reduction in CO2 emissions when critical transportation distances are not exceeded. These distances are calculated to ensure net GHG reductions. These authors assumed that coal ash price mainly depends on transportation, overlooking other supply chain processes required for the incorporation of SCMs into the concrete supply chain.
From a different analytical perspective, Komkova and Habert [25] utilized a MILP model, geospatial, and lifecycle analyses (LCA) to reduce the environmental impact of alkali-activated concrete supply chains. They identified optimal networks that incorporate solid waste ash and mineral wool waste, demonstrating that using both wastes can cut emissions by almost 55%. However, this reduction comes with an increase in costs ranging from 38% to 84%, mainly due to the need to invest in SCM pretreatment machinery. In addition, Luo et al. [26] assessed the utilization of alum sludge residues from drinking water treatment plants as SCM. The authors used a multi-objective optimization model to design the supply chain required to incorporate this high-volume urban residue into the cement and concrete supply chain as an SCM. Their model allows for the evaluation of different compromise solutions concerning economic, environmental, and social benefits.
More recently, Mahjoubi et al. [27] integrated new machine-learning tools with many-objective genetic algorithms that automate the discovery of low-carbon, cost-effective, ultra-high-performance concrete. This type of concrete includes SCMs in the admixture. Using these tools, the authors explored different scenarios, maximizing the compressive and flexural strengths and minimizing porosity. Additionally, their approach could minimize the life-cycle carbon footprint, embodied energy, and material cost alongside the objectives of the previous scenario. However, they did not include the supply chain perspective proposed in this work.
2.2. Bilevel Optimization of Biomass Supply Chain
The use of bilevel optimization in sustainable decision-making processes, including waste management and green supply chain design and management, has increased recently [28]. However, in spite of the inherent multi-stakeholder nature of circular supply chains [29], the use of a bilevel model in this context is scarce.
For instance, Li et al. [30] modeled an integrated biomass pricing and logistics network design problem for biofuel production. This study employed a Benders decomposition algorithm to solve the robust optimization model resulting from the single-level reformulation and uncertainty of biomass yield. Likewise, Yue and Yu [31] used a bilevel optimization problem to study forestry residue valorization in a biofuel supply chain. They found a single-level reformulation to be effective due to the convex structure of the lower level.
Similarly, Cheraghalipour and Roghanianused [32] proposed a bilevel optimization model to design an eight-echelon agricultural supply chain that includes biogas and compost as waste valorization alternatives. Due to its complexity, metaheuristic algorithms were used to solve the problem. In addition, Cobo et al. [33] proposed a game-theoretical model to balance the economic interests of stakeholders in a waste management system that valorizes municipal organic waste as organic fertilizers. In this system, setting the price is critical to improving the competitiveness of organic fertilizers in the market.
2.3. Contributions
Our study takes a similar approach to that presented in [26], using an optimization model to design an SCM supply chain. However, we explore a different type of SCMs derived from biomasses generated in rural areas. Additionally, instead of a multi-objective one, we use a bilevel optimization framework to model the strategic behavior of the supply chain’s stakeholders since considering the strategic decision-making of the agents in the circular economy is key to understanding competition and collaborative behaviors that may appear [34].
Likewise, in this paper, we follow an approach similar to that presented in [30] but applied to a different industry. Our aim is to model and analyze the supply chain required for incorporating biomass ashes as an SCM for cement/concrete production. Additionally, we model the pricing problem from the viewpoint of biomass ash producers and the network design decisions from the perspective of the cement/concrete company. This approach seems more realistic in a valorization setting since the seller, rather than the buyer, fixes the product’s price. Moreover, shifting the company responsible for the supply change design to the lower level of the bilevel model enables the use of a simple search algorithm as a solution method.
Similarly, Che et al. [35] also studied a two-level symbiotic supply chain system with one supplier and one manufacturer following a Stackelberg method to analyze the optimal price and revenue model of the supplier and manufacturer. Despite the similarities with [35], our work extends their model to a more complex situation in which the manufacturer (i.e., the cement/concrete producer) in the lower level has to adapt the supply chain to incorporate the new raw materials coming from circular inputs (i.e., cane bagasse or palm oil fuel ashes). This new feature makes it impossible to use the closed-form solutions typically employed in Stackelberg game analysis. Therefore, we propose a tailored solution method to address the pricing problem in the biomass ash-to-concrete supply chain studied in this paper.
In summary, this paper makes several key contributions. First, it introduces a realistic modeling approach for the supply chain design and pricing of biomass ashes as SCMs. Second, it provides a unique evaluation framework to assess the economic and environmental impact of biomass ashes as sustainable construction materials from a supply chain perspective. Third, it incorporates the strategic behavior of two key stakeholders in the supply chain: the biomass ash generator and the cement/concrete producer. Fourth, it applies a bilevel optimization model to analyze the impact of these materials in the cement/concrete industry. Fifth, it designs a tailored search method to solve the model, which can be applied to biomass/biomass ash valorization supply chains with a similar structure. Finally, it presents a case study based on Colombian data at a national scale, including two widely studied biomass ashes (cane bagasse ash and palm oil fuel ash) and the supply chain of a large Colombian cement/concrete producer.
3. Methods
The efficiency of the related supply chain is crucial for the economic viability of a biomass valorization process. As pointed out in [36], supply chains are inherently complex, making optimization techniques useful tools for decision-making in their design and operation. Moreover, supply chains have a pivotal role in facilitating biomass recovery operations to optimize biomass supply distances and cost while simultaneously reducing environmental impacts [37]. In this context, mathematical programming models have been commonly used for analyzing biomass valorization supply chains, as seen in recent reviews [36,37,38]. Accordingly, this section defines the structure of the supply chain linking biomass ash production to concrete production and describes the bilevel optimization framework used for simultaneously designing the required supply chain and pricing the biomass ash.
3.1. Biomass Ash-to-Concrete Supply Chain
Figure 1 depicts the supply chain for biomass ash-to-concrete under study. The decision variables (of the biomass producers and the cement/concrete producers) and the constraints used in the model are highlighted in this figure. This supply chain originates from various locations where the large-scale processing of agricultural products takes place and their corresponding wastes are produced. These locations can include rice and sugar cane mills, grain threshing plants, and vegetable oil extraction plants, among other similar sites. Then, the different biomasses are used for energy or heat production, generating ash as a by-product [12]. In Colombia, for example, sugar cane plants use biomass for energy and steam generation [39].
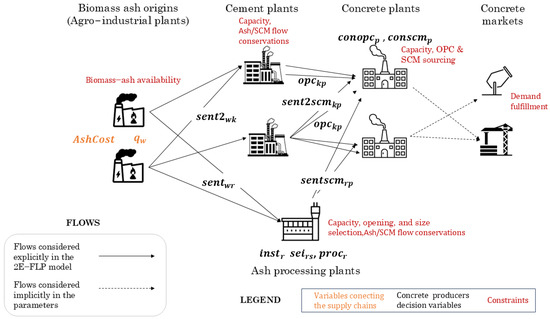
Figure 1.
Biomass ash-to-Concrete supply chain and schematic representation of the 2E-FLP optimization model for its analysis.
Furthermore, post-processing is necessary to ensure that the obtained SCM meets concrete mix specifications [12,37]. This process is carried out using specialized equipment that meets certain technical requirements. This post-processing ranges from simple and relatively inexpensive methods (such as drying, crushing, milling, screening, or size classification) to more energy- and chemical-intensive approaches (such as acid treatments, hydrothermal processing, calcination, and high-temperature remelting or vitrification) [10]. Herein, this equipment and its location will be called (biomass ash) processing plants. Unlike the first nodes (biomass ash sources), processing plants do not yet exist, making it necessary to determine their locations (instr) and processing capacities (). Moreover, (new) supply chain flows may emerge depending on the location of these facilities. Additionally, cement/concrete producers may be interested in utilizing their existing cement plants to process biomass ash, allowing them to leverage their current infrastructure and available capacity to mix biomass ash with cement on-site directly.
As shown in Figure 1, two additional flows passing through the cement plants emerge in the biomass ash-to-concrete supply chain. Note that no new opening decision variables are required if this second alternative is used, as the cement plants are already operational and will use existing infrastructure (machinery and equipment) to process the biomass ash.
In the first echelon of the supply chain, after the purchase of the biomass ash (), the sources are connected to processing plants () or to the cement plants (). Once the biomass ash is processed (), the second echelon connects to the main concrete supply chain flow to use the ash as SCM. In this echelon, the concrete plants obtain both cement () and SCMs () to supply markets’ demand with conventional concrete (), which uses only ordinary Portland cement (OPC) or concrete that partially replaces OPC with SCMs (). It is important to note that our analysis of the concrete supply chain did not explicitly consider the transportation of concrete from plants to markets located in the same urban areas. This assumption is in line with the findings of [24], which indicate that the transportation step, including its costs and environmental impact, from the concrete plant to the construction site should not be differentiated between OPC concrete and SCM concrete.
3.2. Bilevel Approach for the Ash Pricing Problem and Supply Chain Design
Biomass ash producers lack a fixed price for their residues due to the absence of a market. We propose a pricing solution using a Stackelberg game to model interactions between producers and the cement/concrete supply chain. Here, the leader sets prices for activities, and the followers minimize operating costs [40]. As pointed out in [28], this well-known bilevel optimization structure is very common in sustainability decision-making processes. In this framework, the leader/follower interaction is restricted to the cost coefficients of the follower imposed by the leader ( in orange in Figure 1). If the price is too high, the follower will avoid expensive activities, thereby reducing the leader’s revenues [28,40]. This last observation supports the tailored solution method presented below.
In Figure 2, the leader models a consortium of agro-industrial producers that sets the price for their biomass ashes and offers them to the follower, which is a cement/concrete producer, allowing the material to be incorporated into its supply chain. This figure illustrates the proposed Stackelberg game approach, where the consortium of ash producers determines the price () of the biomass ash based on its availability () while taking into account that the cement/concrete producer will respond optimally by determining the amount of biomass ash to be purchased () and adjusting the internal structure and operation of its supply chain ().
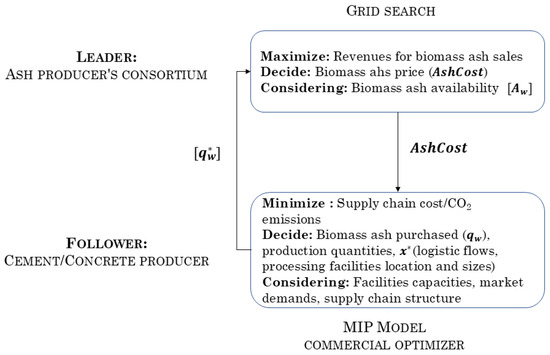
Figure 2.
Stackelberg structure for biomass price setting.
The proposed bilevel model has the following structure:
Subject to:
where:
represents the cost of the biomass ash.
: represents the optimal quantities purchased by the cement/concrete producer at each one of the biomass ash origins .
) represents the optimal decisions variables for the cement/concrete producer in its supply chain including: processing facilities location and capacities (), biomass ash processed (), cement () and concrete () produced, and flows of biomass ash ( and SCM () between facilities in the supply chain.
Represents the constraints of a two-echelon facility location problem (2E-FLP) solved by the cement/concrete producer to redesign and operate its supply chain.
The decision of the ash producers’ consortium is a standard pricing problem. The exact solution to bilevel optimization problems involves various mathematical programming approaches [41]. For instance, a single-level reformulation requires the convexity of the lower level, a property that the 2E-FLP does not exhibit. The mixed-integer structure of the 2E-FLP and the presence of continuous upper-level variables in the lower-level problem () hinders the use of the bilevel solvers by [42] or [43]. However, by leveraging the structural properties of the problem, a grid search can efficiently solve it with very few evaluations of the objective function. As demonstrated below, the pricing and supply optimization decisions can be effectively addressed using a tailored grid search.
3.3. Unidimensional Grid Search Algorithm for the Solution to the Pricing Problem
Figure 3 illustrates the behavior of the leader revenues and the quantity purchased by the follower for different prices of the biomass ash, which supports the simple grid search used to find the price ( that maximizes the revenues of the ash producers. The total revenue of the leader () can be defined as the product of the total quantity of biomass ash sold to the cement/concrete producer multiplied by the price (. The leader wants to maximize this value subject to the optimal reaction of the follower.
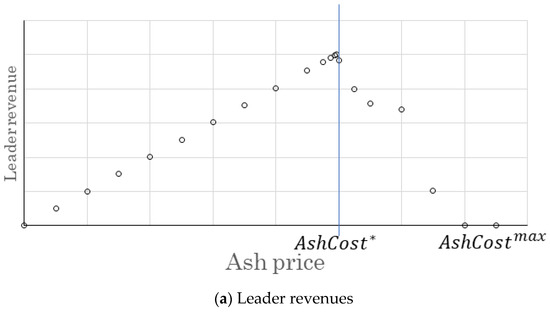
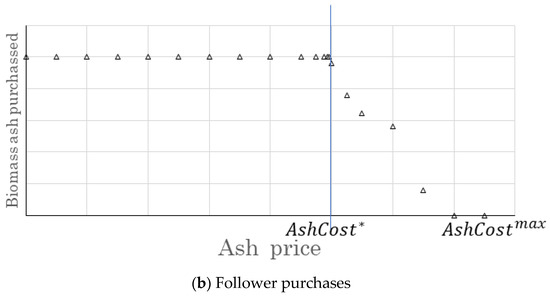
Figure 3.
Behavior of the leader revenues (a) and follower’s purchased quantities (b) for different biomass ash prices (AshCost).
The proposed grid search is based on two extreme values of the ash cost () with zero total revenue for the leader: 0 and . In the former case, the follower can purchase all the required biomass at no cost if it is optimal for its supply chain performance. Note that a degenerate case may exist even at no cost, where . This solution arises when the logistics and processing costs required to supply the concrete plants with the SCM do not provide savings compared to the current optimal cost of the system. In this case, the search ends, stating that the use of SCMs is not economically feasible for the cement/concrete supply chain. At the other extreme point, when exceeds the threshold , the follower does not purchase any SCMs since the savings in the system will not offset the total purchasing cost of the SCM. In this case, , and the concrete in the system is produced using OPC only. Given these two zeros for the total revenue in the interval 0, , the optimal revenue for the leader can be obtained with a simple grid search. This method embeds the solution of a MILP model to obtain the optimal response of the follower for a fixed cost of biomass. The details of the proposed unidimensional search follow.
As shown in Algorithm 1, beginning with 0, the search solves the MIP model for the follower iteratively for increasing values of . At each iteration (), if the total revenue of the leader is improved, the algorithm stores the best total revenue (), the best ash cost found so far () and the structure of the optimal solution for the leader and the follower . The search stops when the value of is surpassed (i.e., a value of that leads the concrete producer to avoid the purchase of biomass ash). This procedure returns the values stored for the best solution ().
| Algorithm 1. Unidimensional search for the solution to the pricing problem for the consortium of biomass ash producers | |
| 1. | Input: 2E-FLP data, |
| 2. | Output:, |
| 3. | , flagtrue |
| 4. | |
| 5. | While (flag) do |
| 6. | . |
| 7. | |
| 8. | ) then |
| 9. | |
| 10. | |
| 11. | |
| 12. | End-if |
| 13. | If then |
| 14. | flag false |
| 15. | |
| 16. | End-if |
| 17. | |
| 18. | |
| 19. | End-While |
| 20. | Return: |
Using data regarding the cement/concrete supply chain (2E-FLP data) and the biomass ash availability, this simple method obtains the ash price (), maximizing the revenue of the consortium of biomass ash producers. At each iteration, Line 6 of Algorithm 1 solves a 2E-FLP with a commercial optimizer for a fixed value of The 2E-FLP is a facility location problem commonly used in the design of classical supply chains [44]. A key characteristic of these problems is their integer-friendly structure, which allows for short solution times even for realistically sized instances. Despite the problems being NP-hard [45]), this structure enables the use of commercial optimizers, as demonstrated in the previous works reviewed in Table 1. This property allows the use of a very small value for Δ (COP$ 5000, approximately 1 US$ at the exchange rate of 2024). For instance, in the proposed industrial-sized case study, the solution of the 2E-FLP usually takes no longer than 3 s. Additionally, evaluating the pricing problem over the range between ] for this fine-grained step size only took 105 s in total to evaluate nearly 35 solutions. Maybe, a more sophisticated solution method could be envisaged, such as a metaheuristic algorithm. However, a typical metaheuristic for bilevel optimization (e.g., particle swarm optimization or evolutionary algorithms [46]) requires several tens or hundreds of solutions to initialize the swarm or the population.
Since multiple optimal solutions may exist in the solution of the 2E-FLP, we adopt an optimistic approach [47] to ensure a unique solution. In this manner, we select the alternate optima that first minimizes the cost () and then the total emissions () of the supply chain in a lexicographic manner [48]. Therefore, in the 2E-FLP, we use the following lexicographic objective function: where is a very small value.
3.4. Two-Echelon Facility Location Model (2E-FLP)
To model the reaction of the cement/concrete producer in the biomass-to-concrete supply chain, we resort to a 2E-FLP with an objective function that minimizes the total supply chain cost. These types of problems are widely used to model the (re)design of supply chains [49] and waste reverse supply chains [50].
The 2E-FLP model decides the quantities of biomass ash purchased () at each source and the quantity processed () in each processing plant. It also determines the location (), and size () of the processing plants required to produce an SCM, the quantity of OPC () and SCM (,) supplied to each concrete plant, and, finally, the amount of conventional concrete () and concrete with SCM () produced in each concrete plant. The model also considers the main transport flows required to connect the two levels of the supply chain, including the transportation of biomass ash to processing plants () and cement plants ().
By contrast, the transportation from concrete plants to markets (which are in the same urban areas) has not been explicitly considered, nor has the transport of crops to agro-industrial plants, the sourcing of other concrete components such as aggregates and additives, or the energy/steam flows, as they are beyond the control of the model.
For instance, the availability and geographical dispersion of biomasses depends on the agricultural/food supply chain. The volumes of biomass residues and their location are controlled by decisions within this supply chain and must be considered as given in the design and analysis of the concrete supply chain. This is a common feature of supply chains that use byproducts as raw materials for the production of goods [18].
For the sake of readership and self-containment, Table 2, Table 3 and Table 4 present the notation (sets, decision variables, and parameters) before introducing the detailed formulation of the 2E-FLP.
Table 2.
Indices and sets of the 2E-FLP.
Table 3.
Decision variables of the 2E-FLP.
Table 4.
Parameters of the 2E-FLP model.
Using the previous notation, we define the details of the objective function(s) of the 2E-FLP that can be used by the cement/concrete producer to adapt their supply chain for the incorporation of biomass ashes as SCM. The total cost of the supply chain includes twelve terms: the costs of acquiring the biomass ash (1), the costs of transporting the biomass ash from their origins to processing plants (2) or cement plants (3), the annualized costs of operating the processing plants (4), the cost of processing the biomass ash (5), the costs of transporting the SCMs from the processing plants to the concrete plants (6), the costs of producing cement in each plant (7), the costs of transporting the SCMs from the cement plants to the concrete plants (8), the costs of transporting cement from the cement plants to the concrete plants (9), the costs of manufacturing both the conventional concrete (10), and the concrete with SCM (11). Additionally, the value of the carbon bonds obtained by the emission reductions in the supply chain is subtracted from the total cost of the supply chain (12).
As mentioned above, the cement/concrete producer initially aims at minimizing the total cost or the supply chain. Equations (1)–(12) describe the cost terms. Therefore, includes the following terms:
The last term of the objective function corresponds to the income earned by the cement/concrete producer due to the CO2 bonds obtained as a result of emissions reductions in the supply chain through the use of SCMs. The term aggregates the CO2 emissions of the supply chain. This term includes the CO2 emissions generated in the following seven processes of the supply chain: biomass ash transport from the origins to the processing plants (13) or the cement plants (14), biomass ash processing (15), SCM transport from processing plants to concrete plants (16) or from cement plants to concrete plants (17), cement production emissions in each plant (18), and cement transport from cement plants to concrete plants (19). Therefore, includes the following terms:
The 2E-FLP has as its main objective the total cost of the supply chain but can also be used for total CO2 emissions minimization for a fixed ash cost. In this case, the objective function corresponds to . Some of the scenarios included in our analysis optimize this objective function while keeping the ash cost fixed using the unidimensional search algorithm found in the first execution of the algorithm to fix the ash price.
For the biomass ash-to-concrete supply chain to operate feasibly, it must meet several conditions. Therefore, the constraints of the 2E-FLP include biomass ash availability, processing plant’s location and capacities, cement and concrete plant capacities, demand fulfillment, SCM and OPC supply to concrete plants, and flow balance at each one of the nodes of the supply chain. A description of these constraints follows.
Biomass ash generation and transport. The total biomass ash purchased at each source cannot exceed the source generation (20), and the biomass ash purchased at the origins splits into two flows, one to the processing plants and the other to the cement plants (21). Moreover, it is only possible to send biomass ashes to operating processing plants (22).
Processing plant location and capacity. The size of the open processing plants must be selected (23). The total biomass ash processed cannot exceed the selected capacity of the processing plant (24). The total amount of biomass ash processed in each plant must be equal to the quantity received (25), and finally, the total quantity of SCM sent from each processing plant to the concrete plants must be equal to the total amount of SCM obtained after the processing of the biomass ash (26).
Cement and concrete plants capacities and supply. The total quantity of cement sent by each cement plant to the concrete plants cannot exceed its capacity, and the processing of SCMs now utilizes a portion of the available capacity of the cement plants (27). The total quantity of SCM sent from each cement plant to the concrete plants must equal the total amount of SCM obtained from processing the biomass ash received from the origins (28). The amount of cement received by each concrete plant must be sufficient to produce conventional concrete and concrete with SCM (29). The amount of SCM received by each concrete plant must be sufficient to manufacture concrete with SCM according to the substitution percentage of OPC (30). The total amount of concrete manufactured in each plant cannot exceed its maximum capacity (31), and the total quantity of concrete produced (in a mix of cement and SCM or only with OPC) by the plants must be sufficient to supply the demand of each market (32).
Domain of the decision variables. The quantities received, sent, and produced are non-negative variables (33)–(41), while the location and size of processing plants are binary variables (42)–(43).
The 2E-FLP and the grid search algorithm were implemented using the MOSEL modeling language and solved using the FICO-Xpress Optimization suite. Its use to analyze a specific biomass ash-to-concrete supply chain is presented next.
4. Case Study
In this case study, we analyze two SCMs obtained from biomasses that are available in the Colombian context at a large-scale industrial level. Following [13], we selected cane bagasse and palm oil fuel ashes to be analyzed as SCMs in the Colombian context.
The analysis considers the incorporation of SCMs from these biomasses in the supply chain of a large Colombian cement/concrete producer. We used mainly the information from this Colombian company for the cement plants, concrete plants, and markets. Figure 4 depicts the location of its seven cement plants and twelve concrete plants. The concrete plants are located near the main four cities of the country, whereas its cement plants are located close to limestone sources. The latter reflects the growth process through mergers and acquisitions of other smaller firms. Moreover, since some of the plants are over 50 years old, the company has carried out some adaptations to improve the environmental performance of its processes. The company’s information also included CO2 emissions from cement production and transportation, as well as their associated costs. For the calculation of transportation emissions in the two echelons, we resorted to the consumption factors presented in [51]. Finally, for the carbon bond price, we used the Colombian CO2 tax, which was approximately 3.5 US$/t in 2022.
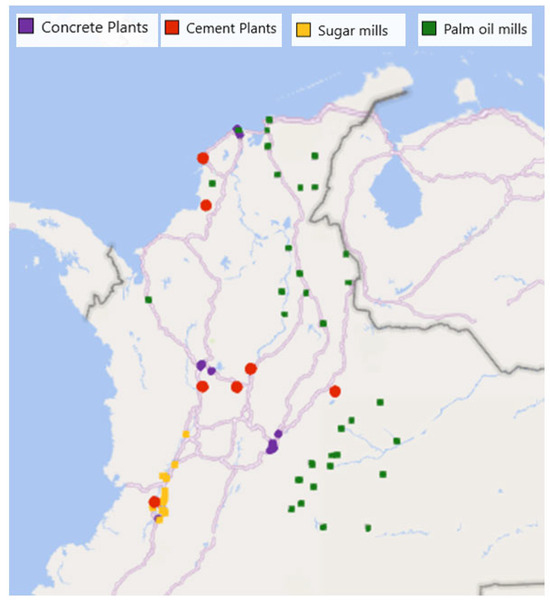
Figure 4.
Geographical distribution of the nodes of the biomass ash-to-concrete supply chain in Colombia.
As Figure 4 depicts, the 37 palm oil fuel mills are spread across the eastern region of the country, while the thirteen sugar mills are concentrated in a smaller southern region of the country. This difference in the geographical dispersion of the biomass ash sources enables a comparison of the effect of this factor on the resulting supply chain. For production data from the two biomass ashes, we used the official statistics of the Ministry of Agriculture and the National Department of Statistics in their agricultural censuses and annual statistics [52]. Finally, for the candidate sites for the processing plants, we selected the same locations of the biomass ash sources and also included the possibility of processing the biomass ashes in the seven existing cement plants.
4.1. Scenarios
Table 5 summarizes the six scenarios evaluated in this section, where we analyze the economic and environmental effects of using biomass ashes as SCMs in the cement/concrete supply chain. Additionally, we compare the impact of the two biomass ashes on the operation of the redesigned supply chain. The names of the scenarios indicate the SCM considered, cane bagasse ash (CBA) or palm oil fuel ash (POFA); both ashes assume a 20% replacement of OPC in the concrete mix. As in [25], we consider that the specific concrete designs only differ in the SCM. The second part of the names indicates the objective function for the solution of the 2E-FLP. Cost objective function scenarios (marked with a C in this table) were obtained using Algorithm 1 for the solution of the pricing problem with as the objective function. Once the optimal price () of the ash was obtained, we fixed this value and ran the 2E-FLP again with the total emissions of the supply chain () as the objective function to derive the scenarios marked with an E in this table. The baseline scenarios (BASE-C and BASE-E) were obtained by removing the SCM availability and solving lexicographically the 2E-FLP for the cement/concrete producer for the corresponding objective function.
Table 5.
Scenarios analyzed in the case study and their performance measures.
Table 5 reports several performance measures for the supply chains obtained in different scenarios. Due to confidentiality issues, absolute values for the objective functions (TotalCost and TotalEmissions) are not reported in the table. Rather, relative values with respect to the baseline scenario (Base-C) are reported. The table also reports the number of processing plants opened, the % of available ash used, the optimal and maximal ash cost for the producer’s consortium (in US$/t), the % of biomass ash processed at cement (CP) and processing plants (PP), the % of cement used with respect to the baseline scenario, and, finally, the percentage of concrete that is produced using SCM.
4.2. Discussion
The comparison of scenarios Base-C and Base-E reveals that it is possible to reduce the total emissions of the cement/concrete supply chain by 2.65% without considering SCMs. This reduction can be achieved by using cleaner plants that have smaller emission factors for cement production. However, achieving this reduction comes at an extra cost of 1.47%. This result is consistent with the findings in [20], which suggest that technological advancements and energy source changes are necessary for a significant reduction in the environmental impact of cement production.
In addition, the CBA-C and POFA-C scenarios reduce supply chain emissions by approximately 6% without increasing total costs, as their costs remain close to but slightly below 100% of the baseline cost. Between the two scenarios, POFA-C (6.83%) offers a more considerable emission reduction than CBA-C (5.82%) at almost the same cost. This emissions reduction is mainly due to the replacement of 12.64% (CBA-C) and 10.82% (POFA-C) of the total cement used in the baseline scenario. However, this replacement does not reach the theoretical 20%, as some concrete is still produced using only OPC in certain plants located farthest from the biomass ash sources. Notably, in both scenarios, a significant proportion of concrete is produced using biomass ashes, ranging from 54.08% in the POFA-C scenario to 63.22% in the CBA-C scenario.
CBA-E and POFA-E scenarios demonstrate that emissions can be further reduced by 8.26% and 10.42%, respectively. Additionally, although these scenarios require additional costs when compared to the baseline scenario (Base-C), their emission reductions are significantly greater than those of scenario Base-E at a comparable total cost. This result highlights the potential of SCMs as a viable alternative for greening the cement/concrete supply chain. These scenarios achieve this by avoiding transportation emissions from moving ash to processing plants and instead opening processing plants in almost all biomass ash origins (thirteen for CBA-E and 32 for POFA-E). Of the two, the POFA-E scenario offers the maximum emissions reduction by combining this strategy with the maximum usage of SCM in the concrete mix (i.e., the maximum replacement of OPC).
Furthermore, the share of SCM treated at the cement and processing plants reveals additional characteristics of the redesigned supply chain. When the objective function of the 2E-FLP is the total CO2 emissions, this share drops to 5.79% and 3.99%, respectively, for the cement plants. This behavior indicates that the possibility of opening new processing plants (different from cement plant locations) is key to obtaining further emissions reduction in this supply chain. Additionally, the preferred facilities to treat the biomass ash are the new processing plants. In all scenarios, these facilities process more than 70% of the purchased ash. On the other hand, apart from the CBA-C scenario (with 26.53%), the cement plants process a marginal portion of the available ash.
The results of the biomass ash pricing, illustrated in Figure 5a, indicate that POFA appears to be more resilient to potential fluctuations in availability and price. First, not all available POFA is utilized, leaving room for adjustments in production. Second, the price range in which POFA remains economically viable for cement/concrete producers is broader compared to CBA ( > } and in most cases, it also provides higher revenues for POFA producers.
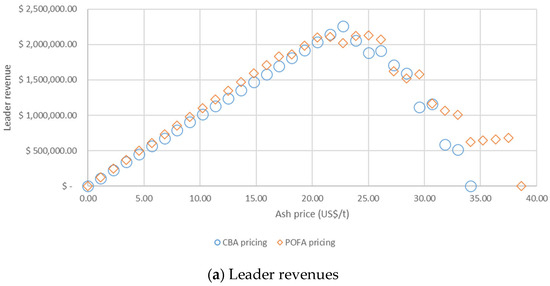
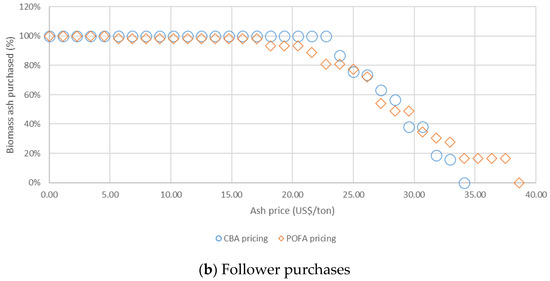
Figure 5.
Pricing results for the two biomass ashes. Biomass producers’ revenues (a) and cement/concrete purchased percentage of available biomass ashes (b).
However, the fact that the optimal price of ash is lower for CBA producers () gives them a certain bargaining advantage over POFA producers. Additionally, at its optimal price, CBA producers achieve higher total revenue than POFA producers, even though, at most other price points, POFA generates greater revenue than CBA. As expected, the amount of biomass ash purchased (depicted in Figure 5b) decreases monotonically as the price rises. Interestingly, however, producer revenues do not follow the same pattern. For instance, POFA and CBA producers’ revenues exhibit three local optima.
4.3. Sensitivity Analysis to Different Transportation Settings
As highlighted by several authors, transportation is a key factor in analyzing the environmental sustainability of SCMs [7,9,23,24]. Therefore, in this section, we examine the system’s sensitivity to two factors that impact the transportation of biomass ash and SCM along the supply chain. The first numerical analysis explores the supply chain’s response to increasing transportation costs, while the second structural analysis considers the impact of using only cement plants or processing plants as SCM processing facilities within the 2E-FLP model. In all these analyses, we use the total cost of the supply chain () as the primary objective in the 2E-FLP model and consider the BASE-C scenario as the baseline for the analysis. Additionally, we fixed the prices of CBA and POFA found in the previous analysis.
4.3.1. Transportation Cost Impact on the New SCM Supply Chain
Two new material flows are introduced due to the incorporation of SCMs as raw materials in the cement/concrete supply chain: one for sourcing biomass ashes from the origins (in ) and the other for transporting SCMs to the concrete plants (in ). In the previous analysis, we considered a value of 0.034 US$/(t × km) for the transportation costs parameters and . In a sensitivity analysis, we tested values between 0.034 and 0.101 US$/(t × km) (i.e., a threefold increase in the original transportation costs). We analyzed how the increase in the transportation cost across these echelons affects the amount of concrete with SCM produced, the number of processing plants established, and the global effect on the total cost and emissions of the supply chains. Figure 6 and Figure 7 present the results of the sensitivity analysis.
Figure 6.
Sensitivity analysis of transportation cost increase: Number of processing plants opened and % of concrete with SCM.
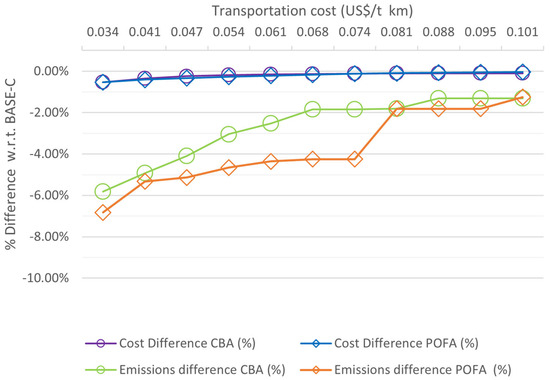
Figure 7.
Sensitivity analysis of transportation cost increase: Total cost and total emissions against BASE-C scenario.
As expected, Figure 6 shows a decrease in the share of concrete with SCM and, consequently, a reduction in the number of processing plants as transportation costs increase. The CBA and POFA supply chains maintain an SCM-based concrete share above 30% for transportation cost increases of up to 1.5 times the original value. Within this range, the number of new CBA processing plants even increased once to be near the sources. For transportation costs exceeding 1.5 times the original value, the number of open processing plants deeply declines, stabilizing at just one when transportation costs reach 2.5 times their original value for both types of ash. Additionally, the production of SCM-based concrete dropped below 10% when transportation costs increased threefold. Finally, this analysis reveals that the POFA supply chain is slightly more robust than the CBA supply chain to transport cost increments as the share of SCM-based concrete is larger for this ash.
Surprisingly, the changes in the use of SCMs and the number of processing plants do not have a significant impact on the total cost of the supply chain, as shown in Figure 7. For both SCMs, the total supply chain cost remained close to the baseline scenario, with negligible savings of −0.11% for CBA and −0.04% for POFA, but never resulting in an additional cost. Moreover, recalling the logic behind Algorithm 1, if the use of SCMs is not economically viable, the supply chain will produce all the concrete using OPC. However, this is not the case, as residual production of SCM-based concrete remains feasible (9% for CBA and 6% for POFA). Under these extreme conditions, where transportation costs increased threefold, the supply chain sources biomass ash from locations close to a few concrete plants, using a single processing plant for this purpose obtaining emissions reductions near −1.3%.
As shown in Figure 7, the increase in transportation costs has a greater impact on emissions reduction than on the cost savings achieved using SCMs. Although significant reductions—above 2% of total emissions—are still achieved when transportation costs reach 1.5 times its original value, SCM-based concrete is still produced with an important share. However, extreme cases result in CO₂ reductions of only around 1.3%, causing the expected environmental benefits to diminish. Finally, it is noteworthy that the POFA supply chain better absorbs the increase in transportation costs, achieving greater CO₂ emissions reductions. This characteristic can be explained by the geographical dispersion of its sources that allow processing plants to be closer to several concrete plants.
4.3.2. Alternative Supply Chain Structures
In the scenarios presented in Table 5, we consider both biomass ash origins (in ) and cement plants (in ) as potential locations for biomass ash processing. This structural analysis evaluates the impact of using only processing plants or only cement plants for this purpose. Table 6 presents three different scenarios and compares them with the BASE-C scenario. The OnlyPP scenario includes candidate processing plants only at biomass ash origins. The OnlyCP scenario considers only existing cement plants for biomass ash processing. Finally, the PP + CP scenario represents the initial setup, where both types of facilities are available as alternatives for processing biomass ash. Table 6 summarizes the results of these three scenarios for the two biomass ash types under analysis.
Table 6.
Structural Sensitivity Scenarios with only cement plants or processing plants for SCM processing. Percentage compared to BASE-C scenario.
The results of this analysis reveal two key findings. The first concerns the CBA scenarios. A comparison of the three alternatives (OnlyPP, OnlyCP, and PP + CP) indicates that these biomass ashes do not require the establishment of new processing plants to be a viable alternative for OPC substitution. Both total costs and emissions remain stable, even if only one type of facility is available. In particular, the OnlyCP scenario (without PPs) exhibits a similar utilization of available ashes to the scenario where both facility types are present, achieving a comparable emission reduction of approximately 5%.
Conversely, the POFA scenarios highlight a strong dependency on the availability of processing plants near biomass ash origins for OPC substitution in concrete production. In the OnlyCP scenario, biomass ash usage is reduced by half when PPs are unavailable. Specifically, in the absence of these facilities, SCM-based concrete production drops to only 21.85%, and the potential emission reductions seen in the OnlyPP or PP + CP scenarios (around 7%) decline drastically to just 1.4%.
Overall, the results of this section suggest a competitive advantage for CBA over POFA producers, as cement/concrete producers do not need to alter their supply chain structure to benefit from CBA as an SCM. Additionally, the lower optimal price of CBA compared to POFA provides an extra competitive edge in this context.
4.4. Managerial Insights
Two of the most promising scenarios for cement and concrete producers are CBA-C (OnlyCP) and POFA-C (PP+CP). These scenarios effectively balance emission reductions and cost minimization. Notably, both outperform the baseline scenario (BASE-C) by achieving lower costs and emissions.
Realizing these benefits requires establishing a small number of processing plants in the POFA-C (PP + CP) scenario, whereas the CBA-C (OnlyCP) scenario does not require any processing plants. Figure 8 illustrates the resulting supply chains for cement and concrete production in these scenarios. The pie charts represent the quantity and type of material processed at each location. For concrete plants that produce both SCM-based and conventional concrete, the pie charts indicate the proportion of each type. Meanwhile, for processing plants located at biomass ash origins, the charts show the share of ash received from nearby sources.
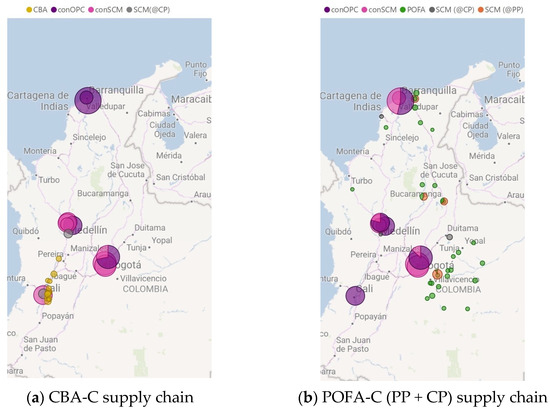
Figure 8.
Recommended supply chains for CBA and POFA as an SCM in Colombian concrete production.
As shown in Figure 8b, POFA production is more widely distributed, making it a suitable SCM in the northern and central regions of the country. In contrast, CBA production is more concentrated, primarily supporting its use as an SCM in the central region (Figure 8a).
Interestingly, for CBA, only two cement plants—one located near sugarcane mills—process all the ashes. In contrast, for POFA, four new processing plants have been established near the source locations to complement the processing capacity of two cement plants also used for SCM production.
Overall, the supply chain structure in the POFA-C scenario complements that of CBA-C, as each scenario leaves a portion of the country reliant on conventional concrete due to the unavailability of biomass ashes. Specifically, CBA is unavailable in the north, while POFA is unavailable in the south.
We now discuss the emissions and cost share in these scenarios. The cement/concrete company was particularly concerned about additional transportation costs due to the distance between biomass ash sources and their concrete plants. Therefore, we have analyzed each term of the 2E-FLP objective function to gain insights into the impact of this new raw material on the concrete supply chain.
Figure 9a shows all the terms in the cost of the supply chain, and it is evident that the cost is mainly dominated by three terms: (i) the cost of concrete production, (ii) the cost of cement production, and (iii) the cost of cement transportation, which represents at least 97% of the total cost. In Figure 9b, we focus on the cost terms introduced with the new raw material. We found that the transportation cost of ash and SCM never exceeded 1.0% of the total cost, which contradicts the company’s concerns about transportation costs. However, the ash purchasing cost is around 2.0 of the total cost, making it the most significant new cost. This indicates that the pricing problem of the ash producer is a critical factor in incorporating this new material into the concrete supply chain.
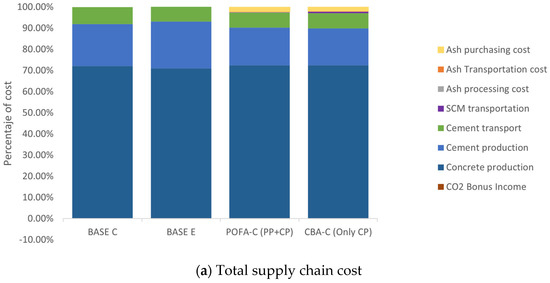
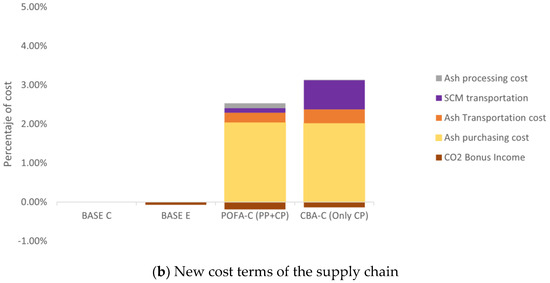
Figure 9.
Cost share of the different scenarios.
Last, we found that the CO2 bonds represent a very small portion (negative term) of the total cost, never exceeding 0.18% of it. This result shows that the decision to incorporate an SCM is not heavily influenced by this emission reduction incentive.
Finally, in our analysis, Figure 10 shows the percentage of the four main sources of emissions that we considered (biomass ash and SCM transportation, and OPC production and transportation). It is important to note that we did not consider the differences in the production process of OPC-only and with-SCM concretes. Hence, emissions for this stage of the supply chain are not considered. Moreover, the grinding process, which is needed to use biomass ash as SCM, has negligible emissions, and thus, it is not included in the figure.
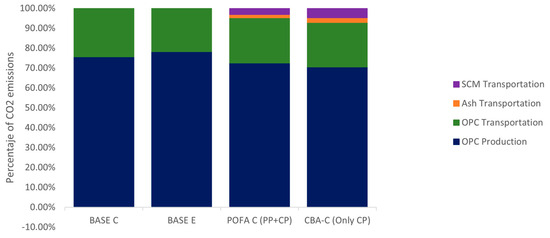
Figure 10.
Shares of emissions under different scenarios.
As depicted in Figure 10, the reduction in supply chain emissions results from the decrease in OPC usage (see Table 5). This reduction lowers emissions from cement production and transportation, which are partially offset by emissions from SCM and ash transportation. However, it is worth noting that ash transportation emissions are minimal since SCM processing occurs near ash sources. For example, in emissions minimization scenarios, almost all ash origins are selected as SCM processing plant locations, reducing these emissions to zero. In particular, the proximity to new processing plants further reduces these emissions in the POFA-C (PP + CP) scenario. In contrast, the CBA-C (OnlyCP) scenario shows a small but noticeable contribution of ash transportation to total emissions due to the immobility of cement plants.
5. Conclusions
Our work focuses on modeling the pricing of biomass ashes as SCMs to produce concrete, and on redesigning the supply change required to incorporate this new material. We evaluate both the environmental and economic impacts of this process. To develop the supply chain model, we use a bilevel approach that considers the interests of both stakeholders. The biomass ash producers aim to maximize their revenues, while the cement and concrete producers aim to minimize their costs and emissions. We validate our approach using data from a large cement and concrete producer and cane bagasse and palm oil fuel ashes available in Colombia.
The proposed SCM pricing mechanism (based on a Stackelberg game) offers a simple yet effective tool for analyzing the economic impact of incorporating this new material into the cement/concrete supply chain. For both stakeholders in the redesigned supply chain, this mechanism provides new insights into pricing the biomass ash, serving as a negotiation tool for both parties. It also enables biomass ash producers to anticipate the possible reactions of cement/concrete producers, forecast purchased quantities, and set an optimal price. Similarly, for cement/concrete producers, it helps evaluate price ranges in which the new SCM is economically viable for their supply chain.
Our results demonstrate the economic and environmental feasibility of using biomass ashes as an SCM in concrete production. Additionally, we show that our proposed supply-chain-based perspective is useful for reducing CO2 emissions by approximately 6% using CBA or POFA without affecting the supply chain cost. The proposed model can also be used to analyze biomass or biomass ash incorporation into concrete supply chains in other countries and with other biomasses.
Finally, future research directions could include studying uncertainties related to certain parameters, particularly biomass ash availability, and seasonality, which are among the most important sources of data uncertainty that should be incorporated into the proposed model. The emerging robust and stochastic bilevel optimization approaches present promising research directions for addressing this model extension, although several modeling decisions must be made beforehand. For instance, the timing of uncertainty realization is a key aspect of the modeling setup [53].
The analysis of the supply chain considering both types of biomass ash simultaneously is another interesting extension of our work. This new feature would introduce competition among different biomass ash producers, requiring more complex mathematical models at the upper level [54]. Cournot-like games appear to be a suitable analytical framework for this analysis. However, as demonstrated in this study, closed-form solutions typical of game theory are not feasible due to the complexity of the supply chain design problem at the lower level. Therefore, we believe that multi-agent reinforcement learning [55] could be a promising approach to address the uncertainty of biomass ash availability and competition among producers simultaneously.
Author Contributions
Conceptualization, J.G.V., G.Á.-L., L.Y.J. and M.R.-S.; methodology, J.G.V., G.Á.-L.; software, J.G.V.; validation, J.G.V., G.Á.-L., L.Y.J. and M.R.-S.; formal analysis, J.G.V. and G.Á.-L.; investigation, J.G.V. and G.Á.-L.; resources, L.Y.J. and M.R.-S.; data curation, J.G.V. and G.Á.-L.; writing—original draft preparation, J.G.V. and G.Á.-L.; writing—review and editing, J.G.V., G.Á.-L., L.Y.J. and M.R.-S.; visualization, J.G.V.; supervision, M.R.-S.; project administration, L.Y.J. and M.R.-S.; funding acquisition, J.G.V., G.Á.-L., L.Y.J. and M.R.-S. All authors have read and agreed to the published version of the manuscript.
Funding
This research was funded by the Colombian Ministry for Science, Technology, and Innovation, MinCiencias, via project 115080863589 (166—2019 contract).
Data Availability Statement
The datasets presented in this article are not readily available because of confidentiality agreements. Requests to access the datasets should be directed to the corresponding author.
Acknowledgments
Special thanks to the Center for Multiliteracies at the School of Languages, Universidad de Antioquia, for their assistance in proofreading and editing the manuscript. Additionally, the authors thank the anonymous referees for their insightful comments.
Conflicts of Interest
The authors declare no conflicts of interest.
References
- International Energy Agency. Cement; IEA: Paris, France, 2023; Available online: https://www.iea.org/energy-system/industry/cement (accessed on 2 September 2024).
- Miller, S.A.; Habert, G.; Myers, R.J.; Harvey, J.T. Achieving net zero greenhouse gas emissions in the cement industry via value chain mitigation strategies. One Earth 2021, 4, 1398–1411. [Google Scholar] [CrossRef]
- Busch, P.; Kendall, A.; Murphy, C.W.; Miller, S.A. Literature review on policies to mitigate GHG emissions for cement and concrete. Resour. Conserv. Recycl. 2022, 182, 106278. [Google Scholar] [CrossRef]
- Mission Possible Partnership. Concrete and Cement. Mission Possible Partnership. Available online: https://www.missionpossiblepartnership.org/action-sectors/concrete-cement/ (accessed on 2 September 2024).
- Thomas, B.S.; Yang, J.; Mo, K.H.; Abdalla, J.A.; Hawileh, R.A.; Ariyachandra, E. Biomass ashes from agricultural wastes as supplementary cementitious materials or aggregate replacement in cement/geopolymer concrete: A comprehensive review. J. Build. Eng. 2021, 40, 102332. [Google Scholar] [CrossRef]
- Blesson, S.; Rao, A.U. Agro-industrial-based wastes as supplementary cementitious or alkali-activated binder material: A comprehensive review. Innov. Infrastruct. Solut. 2023, 8, 125. [Google Scholar] [CrossRef]
- Olatoyan, O.J.; Kareem, M.A.; Adebanjo, A.U.; Olawale, S.; Alao, K.T. Potential use of biomass ash as a sustainable alternative for fly ash in concrete production: A review. Hybrid Adv. 2023, 4, 100076. [Google Scholar] [CrossRef]
- Osial, M.; Pregowska, A.; Wilczewski, S.; Urbańska, W.; Giersig, M. Waste Management for Green Concrete Solutions: A Concise Critical Review. Recycling 2022, 7, 37. [Google Scholar] [CrossRef]
- Gupta, S.; Chaudhary, S. State of the art review on supplementary cementitious materials in India—II: Characteristics of SCMs, effect on concrete and environmental impact. J. Clean. Prod. 2022, 357, 131945. [Google Scholar] [CrossRef]
- Snellings, R.; Suraneni, P.; Skibsted, J. Future and emerging supplementary cementitious materials. Cem. Concr. Res. 2023, 171, 107199. [Google Scholar] [CrossRef]
- Diaz-Loya, I.; Juenger, M.; Seraj, S.; Minkara, R. Extending supplementary cementitious material resources: Reclaimed and remediated fly ash and natural pozzolans. Cem. Concr. Compos. 2019, 101, 44–51. [Google Scholar] [CrossRef]
- Cruz, N.C.; Silva, F.C.; Tarelho, L.A.; Rodrigues, S.M. Critical review of key variables affecting potential recycling applications of ash produced at large-scale biomass combustion plants. Resour. Conserv. Recycl. 2019, 150, 104427. [Google Scholar] [CrossRef]
- Álvarez-López, G.; Múnera, A.M.; Villegas, J.G. Multicriteria Decision-Making Tools for the Selection of Biomasses as Supplementary Cementitious Materials. Sustainability 2023, 15, 10031. [Google Scholar] [CrossRef]
- Kochanski, M.; Lotz, M.T.; Korczak, K. Benchmarking circular economy measures in buildings along the 11R framework: A systematic review of quantified impacts on material use, energy consumption, GHG emissions, and costs. J. Clean. Prod. 2024, 485, 144337. [Google Scholar] [CrossRef]
- Kalmykova, Y.; Sadagopan, M.; Rosado, L. Circular economy—From review of theories and practices to development of implementation tools. Resour. Conserv. Recycl. 2018, 135, 190–201. [Google Scholar] [CrossRef]
- Jakobs, L.; Hofer, A.; Rauch, E. A Framework and Taxonomy for Categorizing Industrial Symbiosis in Manufacturing. J. Eng. Sci. 2025, 12, B1–B10. [Google Scholar] [CrossRef]
- Scrivener, K.L.; John, V.M.; Gartner, E.M. Eco-efficient cements: Potential economically viable solutions for a low-CO2 cement-based materials industry. Cem. Concr. Res. 2018, 114, 2–26. [Google Scholar] [CrossRef]
- Turken, N.; Geda, A. Supply chain implications of industrial symbiosis: A review and avenues for future research. Resour. Conserv. Recycl. 2020, 161, 104974. [Google Scholar] [CrossRef]
- Dikos, G.; Spyropoulou, S. Supply Chain Optimization and Planning in Heracles General Cement Company. Interfaces 2013, 43, 297–3123. [Google Scholar] [CrossRef]
- Cadavid-Giraldo, N.; Vélez-Gallego, M.C.; Guillén-Gosálbez, G. Technology Updating Decisions for Improving the Environmental Performance of an Operating Supply Chain: A Multiobjective Optimization Model for the Cement Industry. Ind. Eng. Chem. Res. 2016, 55, 12287–12300. [Google Scholar] [CrossRef]
- Cadavid-Giraldo, N.; Velez-Gallego, M.C.; Restrepo-Boland, A. Carbon emissions reduction and financial effects of a cap and tax system on an operating supply chain in the cement sector. J. Clean. Prod. 2020, 275, 122583. [Google Scholar] [CrossRef]
- Suhaib, S.A.B.; Rasmi, S.A.B.; Türkay, M. Sustainability analysis of cement supply chains considering economic, environmental and social effects. Clean. Logist. Supply Chain 2023, 8, 100112. [Google Scholar] [CrossRef]
- Jamora, J.B.; Gudia, S.E.L.; Go, A.W.; Giduquio, M.B.; Loretero, M.E. Potential CO2 reduction and cost evaluation in use and transport of coal ash as cement replacement: A case in the Philippines. Waste Manag. 2020, 103, 137–145. [Google Scholar] [CrossRef]
- Göswein, V.; Gonçalves, A.B.; Silvestre, J.D.; Freire, F.; Habert, G.; Kurda, R. Transportation matters—Does it? GIS-based comparative environmental assessment of concrete mixes with cement, fly ash, natural and recycled aggregates. Resour. Conserv. Recycl. 2018, 137, 1–10. [Google Scholar] [CrossRef]
- Komkova, A.; Habert, G. Optimal supply chain networks for waste materials used in alkali-activated concrete fostering circular economy. Resour. Conserv. Recycl. 2023, 193, 106949. [Google Scholar] [CrossRef]
- Luo, L.; Liu, Y.; Zhuge, Y.; Chow, C.W.; Clos, I.; Rameezdeen, R. A multi-objective optimization approach for supply chain design of alum sludge-derived supplementary cementitious material. Case Stud. Constr. Mater. 2022, 17, e01156. [Google Scholar] [CrossRef]
- Mahjoubi, S.; Barhemat, R.; Meng, W.; Bao, Y. AI-guided auto-discovery of low-carbon cost-effective ultra-high performance concrete (UHPC). Resour. Conserv. Recycl. 2022, 189, 106741. [Google Scholar] [CrossRef]
- Caselli, G.; Iori, M.; Ljubić, I. Bilevel optimization with sustainability perspective: A survey on applications. arXiv 2024, arXiv:2406.07184. [Google Scholar] [CrossRef]
- Geissdoerfer, M.; Morioka, S.N.; de Carvalho, M.M.; Evans, S. Business models and supply chains for the circular economy. J. Clean. Prod. 2018, 190, 712–721. [Google Scholar] [CrossRef]
- Li, Q.; Üster, H.; Zhang, Z.-H. A Bilevel Model for Robust Network Design and Biomass Pricing Under Farmers’ Risk Attitudes and Supply Uncertainty. Transp. Sci. 2023, 57, 1296–1320. [Google Scholar] [CrossRef]
- Yue, D.; You, F. Stackelberg-game-based modeling and optimization for supply chain design and operations: A mixed integer bilevel programming framework. Comput. Chem. Eng. 2017, 102, 81–95. [Google Scholar] [CrossRef]
- Cheraghalipour, A.; Roghanian, E. A bi-level model for a closed-loop agricultural supply chain considering biogas and compost. Environ. Dev. Sustain. 2022. [Google Scholar] [CrossRef]
- Cobo, S.; Fengqi, Y.; Dominguez-Ramos, A.; Irabien, A. Noncooperative Game Theory to Ensure the Marketability of Organic Fertilizers within a Sustainable Circular Economy. ACS Sustain. Chem. Eng. 2020, 8, 3809–3819. [Google Scholar] [CrossRef]
- Choi, T.-M.; Taleizadeh, A.A.; Yue, X. Game theory applications in production research in the sharing and circular economy era. Int. J. Prod. Res. 2019, 58, 118–127. [Google Scholar] [CrossRef]
- Che, C.; Zhang, X.; Chen, Y.; Zhao, L.; Zhang, Z. A Model of Waste Price in a Symbiotic Supply Chain Based on Stackelberg Algorithm. Sustainability 2021, 13, 1740. [Google Scholar] [CrossRef]
- Atashbar, N.Z.; Labadie, N.; Prins, C. Modelling and optimisation of biomass supply chains: A review. Int. J. Prod. Res. 2017, 56, 3482–3506. [Google Scholar] [CrossRef]
- Nunes, L.J.R. Exploring the present and future of biomass recovery units: Technological innovation, policy incentives and economic challenges. Biofuels 2023, 15, 375–387. [Google Scholar] [CrossRef]
- Lo, S.L.Y.; How, B.S.; Leong, W.D.; Teng, S.Y.; Rhamdhani, M.A.; Sunarso, J. Techno-economic analysis for biomass supply chain: A state-of-the-art review. Renew. Sustain. Energy Rev. 2020, 135, 110164. [Google Scholar] [CrossRef]
- Rivera-Cadavid, L.; Manyoma-Velásquez, P.C.; Manotas-Duque, D.F. Supply Chain Optimization for Energy Cogeneration Using Sugarcane Crop Residues (SCR). Sustainability 2019, 11, 6565. [Google Scholar] [CrossRef]
- Labbé, M.; Violin, A. Bilevel programming and price setting problems. Ann. Oper. Res. 2015, 240, 141–169. [Google Scholar] [CrossRef]
- Kleinert, T.; Labbé, M.; Ljubić, I.; Schmidt, M. A Survey on Mixed-Integer Programming Techniques in Bilevel Optimization. Euro J. Comput. Optim. 2021, 9, 100007. [Google Scholar] [CrossRef]
- DeNegre, S.T.; Ralphs, T.K. A Branch-and-cut Algorithm for Integer Bilevel Linear Programs. In Operations Research and Cyber-Infrastructure; Chinneck, J.W., Kristjansson, B., Saltzman, M.J., Eds.; Springer: Boston, MA, USA, 2009; pp. 65–78. [Google Scholar] [CrossRef]
- Fischetti, M.; Ljubić, I.; Monaci, M.; Sinnl, M. A New General-Purpose Algorithm for Mixed-Integer Bilevel Linear Programs. Oper. Res. 2017, 65, 1615–1637. [Google Scholar] [CrossRef]
- Location Science; Laporte, G., Nickel, S., Da Gama, F.S., Eds.; Springer: Cham, Switzerland, 2019. [Google Scholar] [CrossRef]
- Daskin, M.S. What you should know about location modeling. Nav. Res. Logist. 2008, 55, 283–294. [Google Scholar] [CrossRef]
- Camacho-Vallejo, J.-F.; Corpus, C.; Villegas, J.G. Metaheuristics for bilevel optimization: A comprehensive review. Comput. Oper. Res. 2023, 161, 106410. [Google Scholar] [CrossRef]
- Bilevel Optimization: Advances and Next Challenges. In Springer Optimization and Its Applications; Dempe, S., Zemkoho, A., Eds.; Springer: Cham, Switzerland, 2020; Volume 161. [Google Scholar] [CrossRef]
- Ehrgott, M. Multicriteria Optimization; Springer Science & Business Media: Berlin/Heidelberg, Germany, 2005. [Google Scholar]
- Costa, Y.; Melo, T. Facility Location Modeling in Supply Chain Network Design: Current State and Emerging Trends. In The Palgrave Handbook of Supply Chain Management; Springer: Berlin/Heidelberg, Germany, 2022; pp. 1–36. [Google Scholar]
- Van Engeland, J.; Beliën, J.; De Boeck, L.; De Jaeger, S. Literature review: Strategic network optimization models in waste reverse supply chains. Omega 2018, 91, 102012. [Google Scholar] [CrossRef]
- Díaz-Ramirez, J.; Giraldo-Peralta, N.; Flórez-Ceron, D.; Rangel, V.; Mejía-Argueta, C.; Huertas, J.I.; Bernal, M. Eco-driving key factors that influence fuel consumption in heavy-truck fleets: A Colombian case. Transp. Res. Part D Transp. Environ. 2017, 56, 258–270. [Google Scholar] [CrossRef]
- DANE-Departamento Administrativo Nacional de Estadística. Encuesta Nacional Agropecuaria (ENA). Available online: https://www.dane.gov.co/index.php/estadisticas-por-tema/agropecuario/encuesta-nacional-agropecuaria-ena (accessed on 2 September 2024).
- Beck, Y.; Ljubić, I.; Schmidt, M. A survey on bilevel optimization under uncertainty. Eur. J. Oper. Res. 2023, 311, 401–426. [Google Scholar] [CrossRef]
- Li, Y.; Lin, J.; Qian, Y.; Li, D. Feed-in tariff policy for biomass power generation: Incorporating the feedstock acquisition process. Eur. J. Oper. Res. 2022, 304, 1113–1132. [Google Scholar] [CrossRef]
- Nowé, A.; Vrancx, P.; De Hauwere, Y.-M. Game Theory and Multi-agent Reinforcement Learning. In Reinforcement Learning; Wiering, M., Van Otterlo, M., Eds.; Adaptation, Learning, and Optimization; Springer: Berlin/Heidelberg, Germany, 2012; Volume 12, pp. 441–470. [Google Scholar] [CrossRef]
Disclaimer/Publisher’s Note: The statements, opinions and data contained in all publications are solely those of the individual author(s) and contributor(s) and not of MDPI and/or the editor(s). MDPI and/or the editor(s) disclaim responsibility for any injury to people or property resulting from any ideas, methods, instructions or products referred to in the content. |
© 2025 by the authors. Licensee MDPI, Basel, Switzerland. This article is an open access article distributed under the terms and conditions of the Creative Commons Attribution (CC BY) license (https://creativecommons.org/licenses/by/4.0/).