Article

Technical Recyclability and Carbon Footprint of Packaging for Butter, Yogurt, and Spreads

1
Institute of Packaging and Resource Management, Department Applied Life Sciences, FH Campus Wien, University of Applied Sciences, 1100 Vienna, Austria
2
Circular Analytics TK GmbH, 1010 Vienna, Austria
*
Author to whom correspondence should be addressed.
Recycling 2025, 10(2), 31; https://doi.org/10.3390/recycling10020031
Submission received: 31 December 2024 / Revised: 19 February 2025 / Accepted: 20 February 2025 / Published: 21 February 2025

Abstract

:
The adoption of the PPWR by the Council of the European Union (EU/2025/40) in 2025 intensifies the regulatory pressure on packaging manufacturers and food producers. This necessitates their adaptation of packaging to the new standards and selection of materials by various sustainability criteria and minimum standards. The legal text places particular emphasis on recyclability and the carbon footprint. The dairy industry holds significant economic importance in the DACH region (Germany, Austria, and Switzerland); this study therefore analyzed and compared the recyclability and carbon footprint of selected product categories and diverse packaging options for butter, yogurt, spreads, curd cheese, and cottage cheese. This study found large differences within the product categories, and also between the assessed countries, due to differing waste management systems (collection, sorting, and recycling) and waste streams. A key finding is the substantial discrepancy in glass packaging, which significantly exceeds the emission values of other packaging systems. In terms of recyclability, glass packaging performs well due to the effectiveness of the recycling systems regarding the future effective PPWR. However, significant variations in recyclability were observed between Germany and Austria for tray and cup materials made of PP and PS. Notably, there is a preference for packaging systems without a cardboard sleeve over those with one. This study provides critical insights into the environmental performance of packaging materials in the dairy sector. It highlights the challenges posed by regulatory changes and the urgent need for region-specific strategies. By identifying key areas for improvement in packaging design and waste management, this work lays the foundation for achieving compliance with the PPWR and advancing the transition toward a circular economy in the DACH region.

1. Introduction

The diverse range of properties exhibited by polymers results in their suitability for many applications. However, this also gives rise to concerns surrounding the increasing consumption of these materials and their ultimate disposal at the end of their useful life [1]. In 2022, 400.3 Mt of plastics were produced globally. Of this total, approximately 90% are fossil-based, while only approximately 9% contain post-consumer recyclate (PCR). Globally, the most produced polymer is polypropylene (PP), which accounts for 18.9% of the total, while polystyrene (PS) is estimated to represent 5.2% of the overall polymer production. In Europe in 2022, 54 Mt of polymers were converted into plastic products, with the largest application accounting for 39% of this in the form of packaging material [2]. These produced masses make the recycling of packaging material economically and environmentally attractive. Data from Germany show that 36.3% of food packaging is made of PP [3].
The dairy industry represents the largest agricultural sector in German-speaking countries. Milk production accounts for approximately 18 to 20% of the agricultural sector in Germany, Austria, and Switzerland. In terms of production, Germany produced 33.1 million tons of milk in 2020, Switzerland produced 3.38 million tons in 2019, and Austria reached 3.9 million tons in the same year [4,5,6]. German markets offer a high variety of different yogurt products, such as desserts, skyr, cream cheese, and curd [7,8,9]. Yogurt is often sold in plastic packaging, due to consumer perception [10]. This packaging can either be cups, jars, bottles, pouches, or canisters for bigger quantities [7,11].
In light of the sector’s significance in the DACH region (Germany, Austria, and Switzerland) and the substantial quantities of dairy products requiring packaging, it is of critical importance to develop packaging solutions for dairy products that align with the principles of the circular economy and the Packaging and Packaging Waste Regulation EU/2025/40 (PPWR) [12].

1.1. Current State of Food Packaging Recycling

Austria, as well as other member states of the EU, is lagging behind on recycling targets. The target for 2030 is set to be 70% for packaging waste (including glass, metal, aluminum, plastic, and wood), and Austria performed with a recycling rate of 65.7% in 2020. Especially for plastic packaging, the rate is low at 24.5% in 2022 [13,14]. In Germany, the production of plastic waste in 2021 amounted to 5.67 million tons, of which a percentage of only 35% was recycled. The majority of this plastic waste, 19.7 million tons, was derived from plastic packaging. It is evident that the recycling rate of plastic packaging in Germany is significantly higher than in Austria, where 48.4% of plastic packaging was recycled. Other materials demonstrate higher recycling rates, including glass (80.3%), paper and cardboard (85.1%), and aluminum (62.4%) [15].
In 2023, Switzerland achieved the highest recycling quotas for glass (100%), paper and cardboard (86%), aluminum (91%), and PET bottles (84%). In contrast, 83% of plastic packaging was incinerated, with only 9% being recycled into secondary material [16]. A comparison of the waste management systems in Austria, Germany, and Switzerland reveals notable differences in the available collection services. While all three countries offer area-wide collections of paper and cardboard, aluminum, glass, and blow-molded and thermoformed PET, the availability of collection infrastructure for rigid PE, PP, and PET varies. In Germany and Austria, the collection infrastructure for rigid materials is present in several regions and municipalities, while in Switzerland, it is limited to specific areas. Notably, flexible PE material is collected in Germany and Austria, but not in Switzerland. Finally, no waste streams for flexible PS and PET are available in any of the three countries [17,18,19].
As defined in prEN 18120-1, plastics packaging recyclability refers to packaging designed in such a way “to be compatible with processes for plastics packaging waste recycling” including collection, sorting, and recycling processes [20]. This means that recyclability is not a packaging property but rather depends on the current waste infrastructure and processes, as well as the intended use of recyclates. The design of recycling tables and recyclability are therefore a function of collection, sorting, and recycling infrastructure and the intended recyclate quality. The design of recycling tables is increasing in complexity and detail and requires all participants of the packaging supply chain to share information about packaging composition and minor packaging components such as printing, coating, and adhesives along the supply chain because this information is necessary for recyclability assessments as required by PPWR.
To increase plastic recycling rates, several barriers need to be tackled [21]. One of the most significant challenges is the heterogeneous composition of plastic waste from household sources containing potential contaminants such as product residues. [21,22,23]. Furthermore, the considerable diversity of packaging types, materials, dimensions, shapes, manufacturing processes, and chemical compositions represents a significant challenge [21].
An important issue is the presence of contaminants in the waste stream that can impede the production of food-grade recyclate [24,25,26]. These NIAS (non-intentionally added substances) limit the potential use of recycled plastics [27,28]. Contaminants may arise during the collection and reprocessing of plastics, in addition to any substances already present in the raw materials [29,30]. Recent studies have identified the degradation of printing ink as a source of DNA-reactive substances [31]. DNA-reactive substances were also identified in polyolefins in another study [32].
Three measures to tackle the problem of low recycling rates are, therefore, the implementation of design-for-recycling standards incorporated into product design processes, the improvement of separate collection, and the improvement of the sorting and recovery of materials after collection [22,33,34,35,36,37,38,39,40,41,42,43,44,45,46]. Other additional measures that have been widely proposed are legal tools and deposit systems [44,45].

1.2. Regulatory Framework

The design of packaging with the objective of recycling once it becomes packaging waste represents one of the most efficient measures to improve the circularity of packaging and raise the rates of recycling and the use of recycled content in packaging [12]. Several packaging formats have been subject to voluntary industry schemes or the imposition of extended producer responsibility fees by certain Member States, intending to establish criteria for recyclable packaging design. To prevent barriers to the internal market, provide the industry with a level playing field, and promote the sustainability of packaging, it is important to set mandatory requirements regarding the recyclability of packaging. This should be achieved by harmonizing the criteria and methodology for assessing packaging recyclability based on a design-for-recycling methodology at the European Union level [12].
To achieve the objectives set out in the Circular Economy Action Plan (CEAP) [47], it is essential that all packaging is either recyclable or reusable in a financially viable manner. A system of recyclability performance grades should be established based on design-for-recycling criteria. Packaging that cannot be collected, sorted, or recycled due to its design, such as black plastics [48] or small packaging sizes [12], will be classified as unrecyclable. It is therefore imperative that design-for-recycling principles be applied in the development of new packaging [12].
The objective of the new PPWR is to establish a harmonized legal framework that will foster sustainable packaging and, ultimately, a functioning market for secondary raw materials. The new legislation addresses three major issues identified in a prior impact assessment: the growing volume of packaging waste, design barriers that prevent effective recycling and reuse, and the low quality of secondary raw materials [12].
With its focus on circularity, the PPWR does not explicitly address sustainability topics such as greenhouse gases or other emissions along the life cycle, but it stresses, in preamble Nr. 45, the need to ensure “a high level of protection of environment and human health, in particular with regard to the level of emissions into the air, water and soil…” [12].

1.3. Aim of This Work

The aim of this work is to assess the technical recyclability of packaging available on the market in the countries Germany, Austria, and Switzerland for the product categories of butter, yogurt, and spreads, as well as to determine the global warming potential exhibited by the packaging, using a streamlined LCA. Those results are then compared, to highlight differences in waste management in the three countries and discussed looking ahead to regulatory aspects in the newly instated Packaging and Packaging Waste Regulation.

2. Results

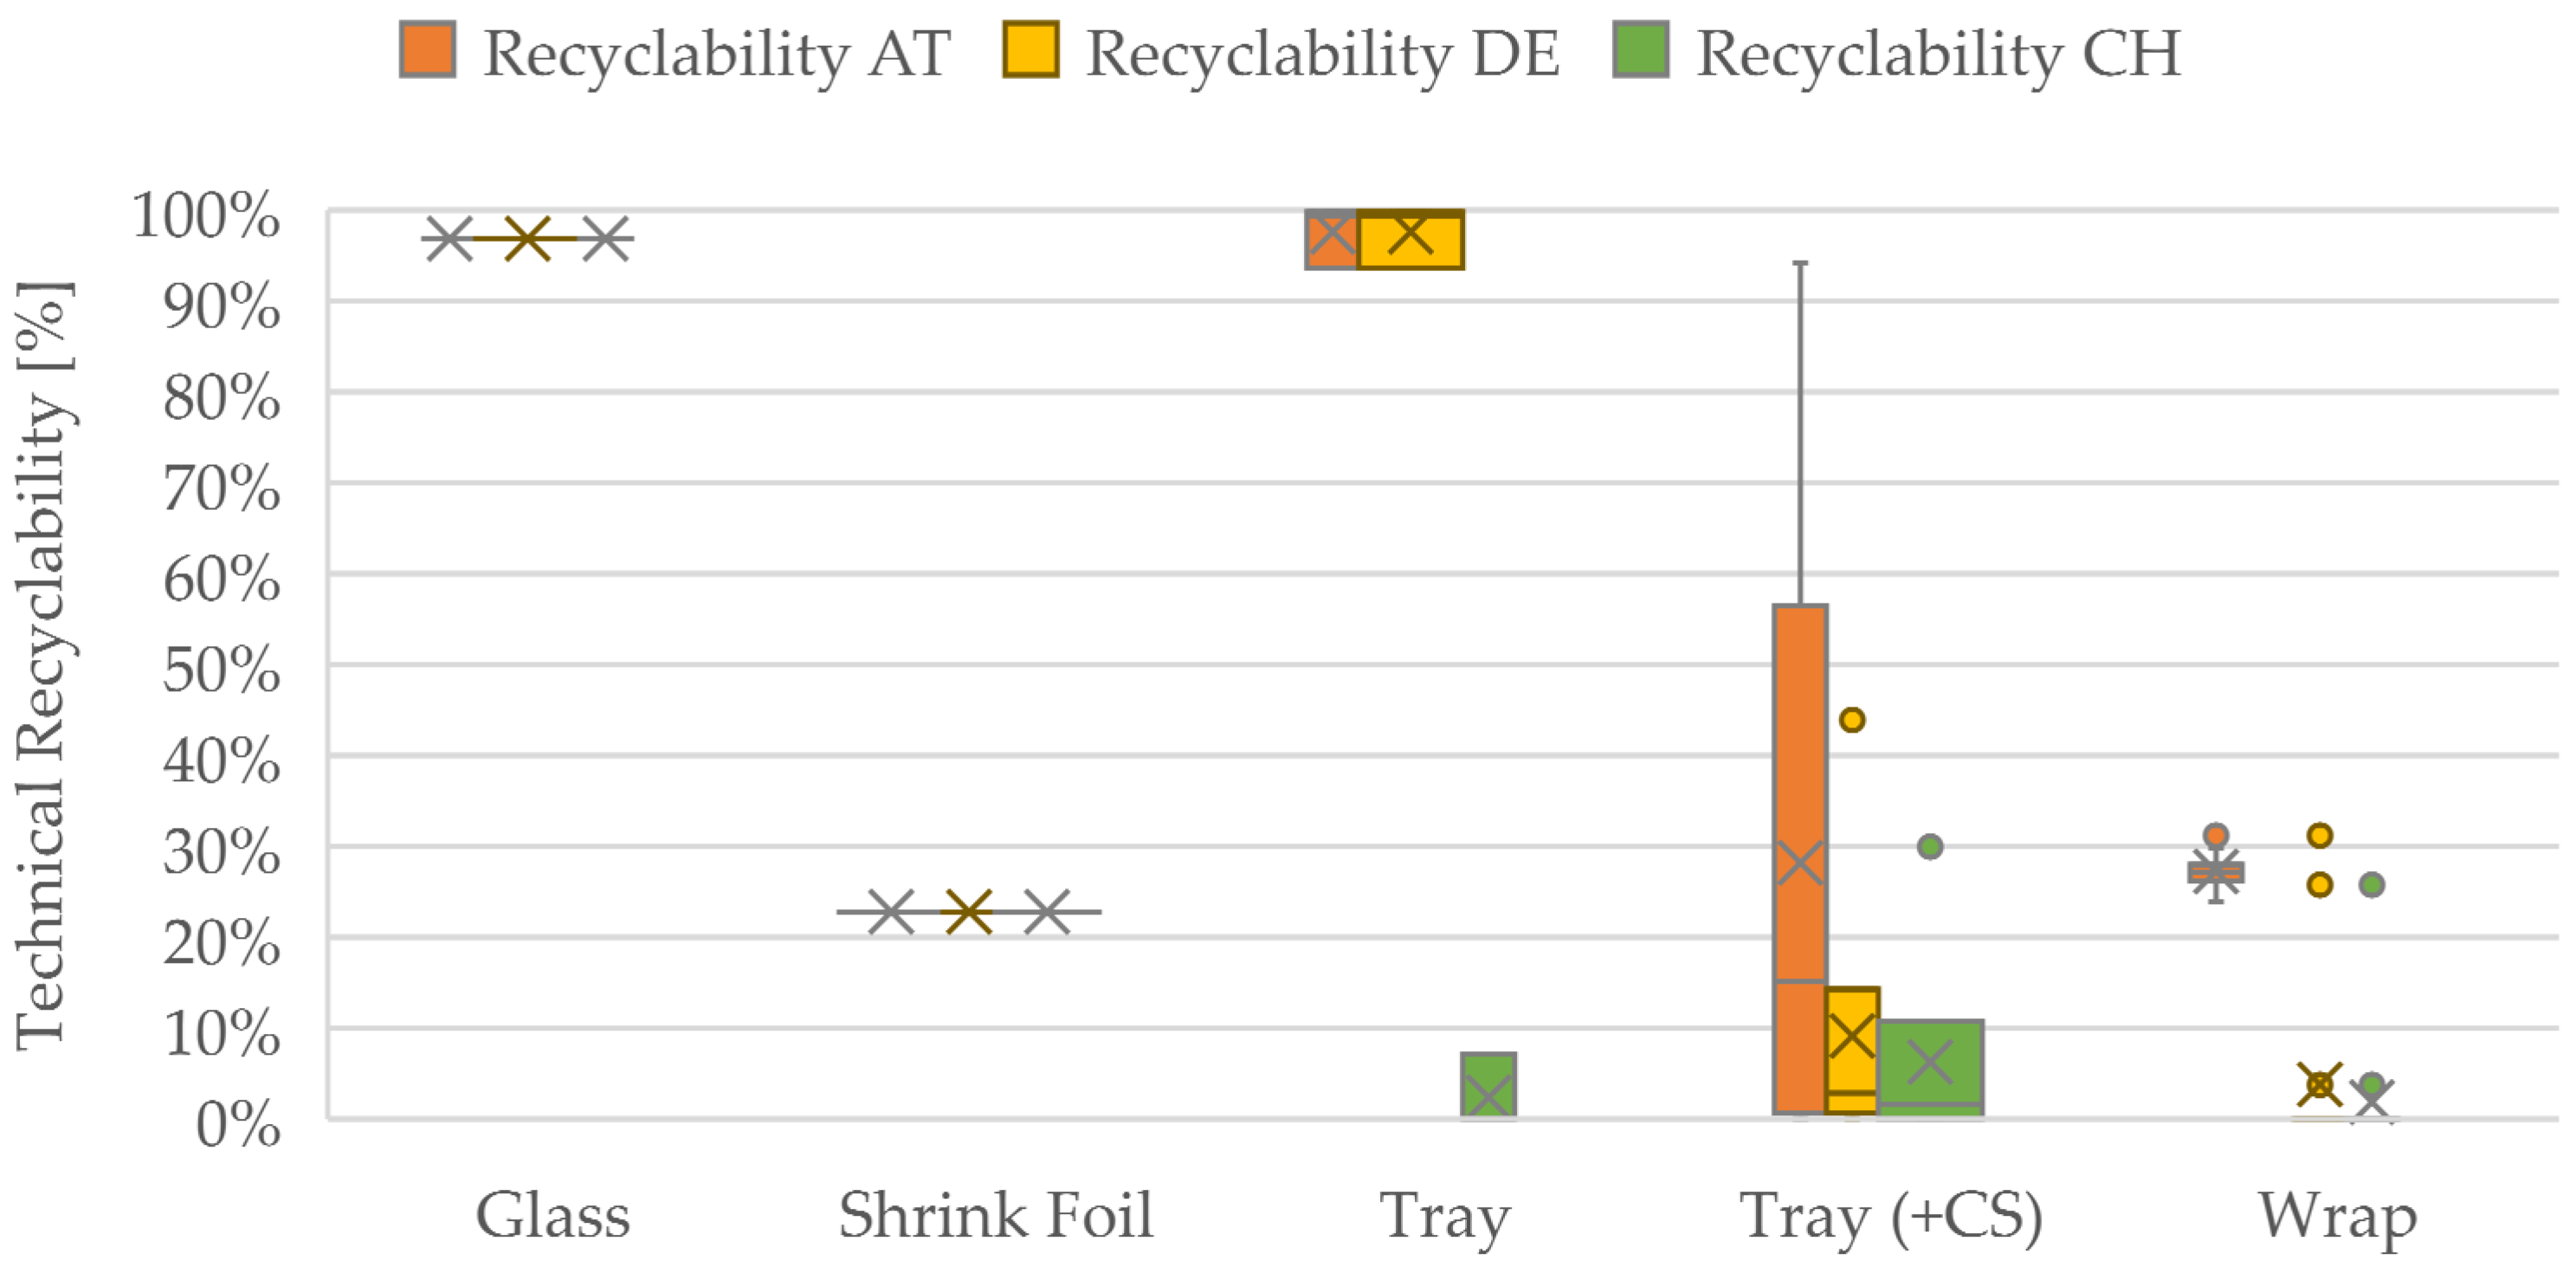
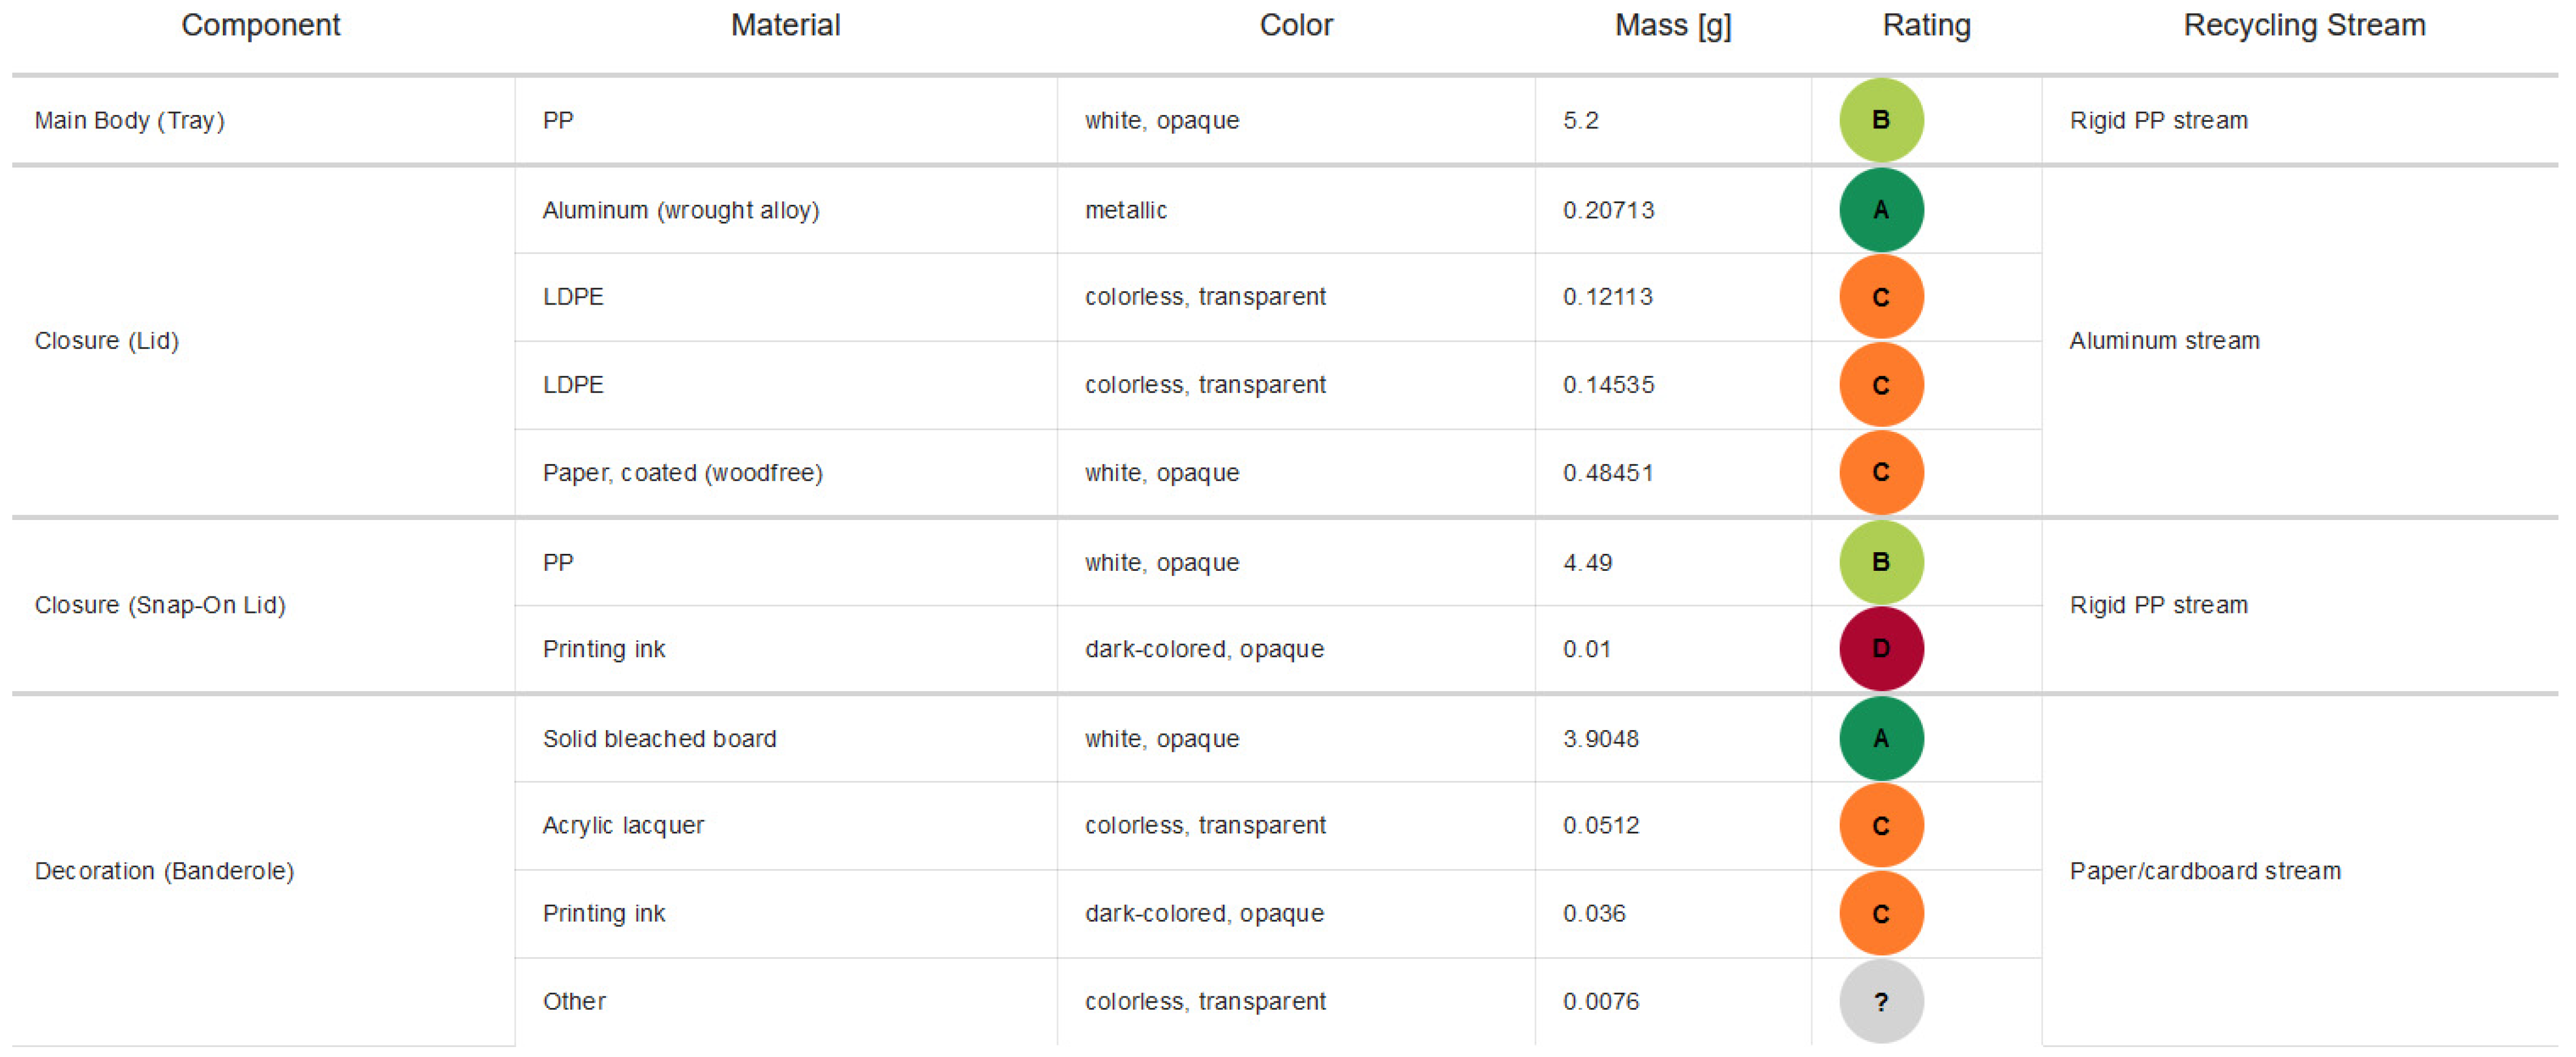
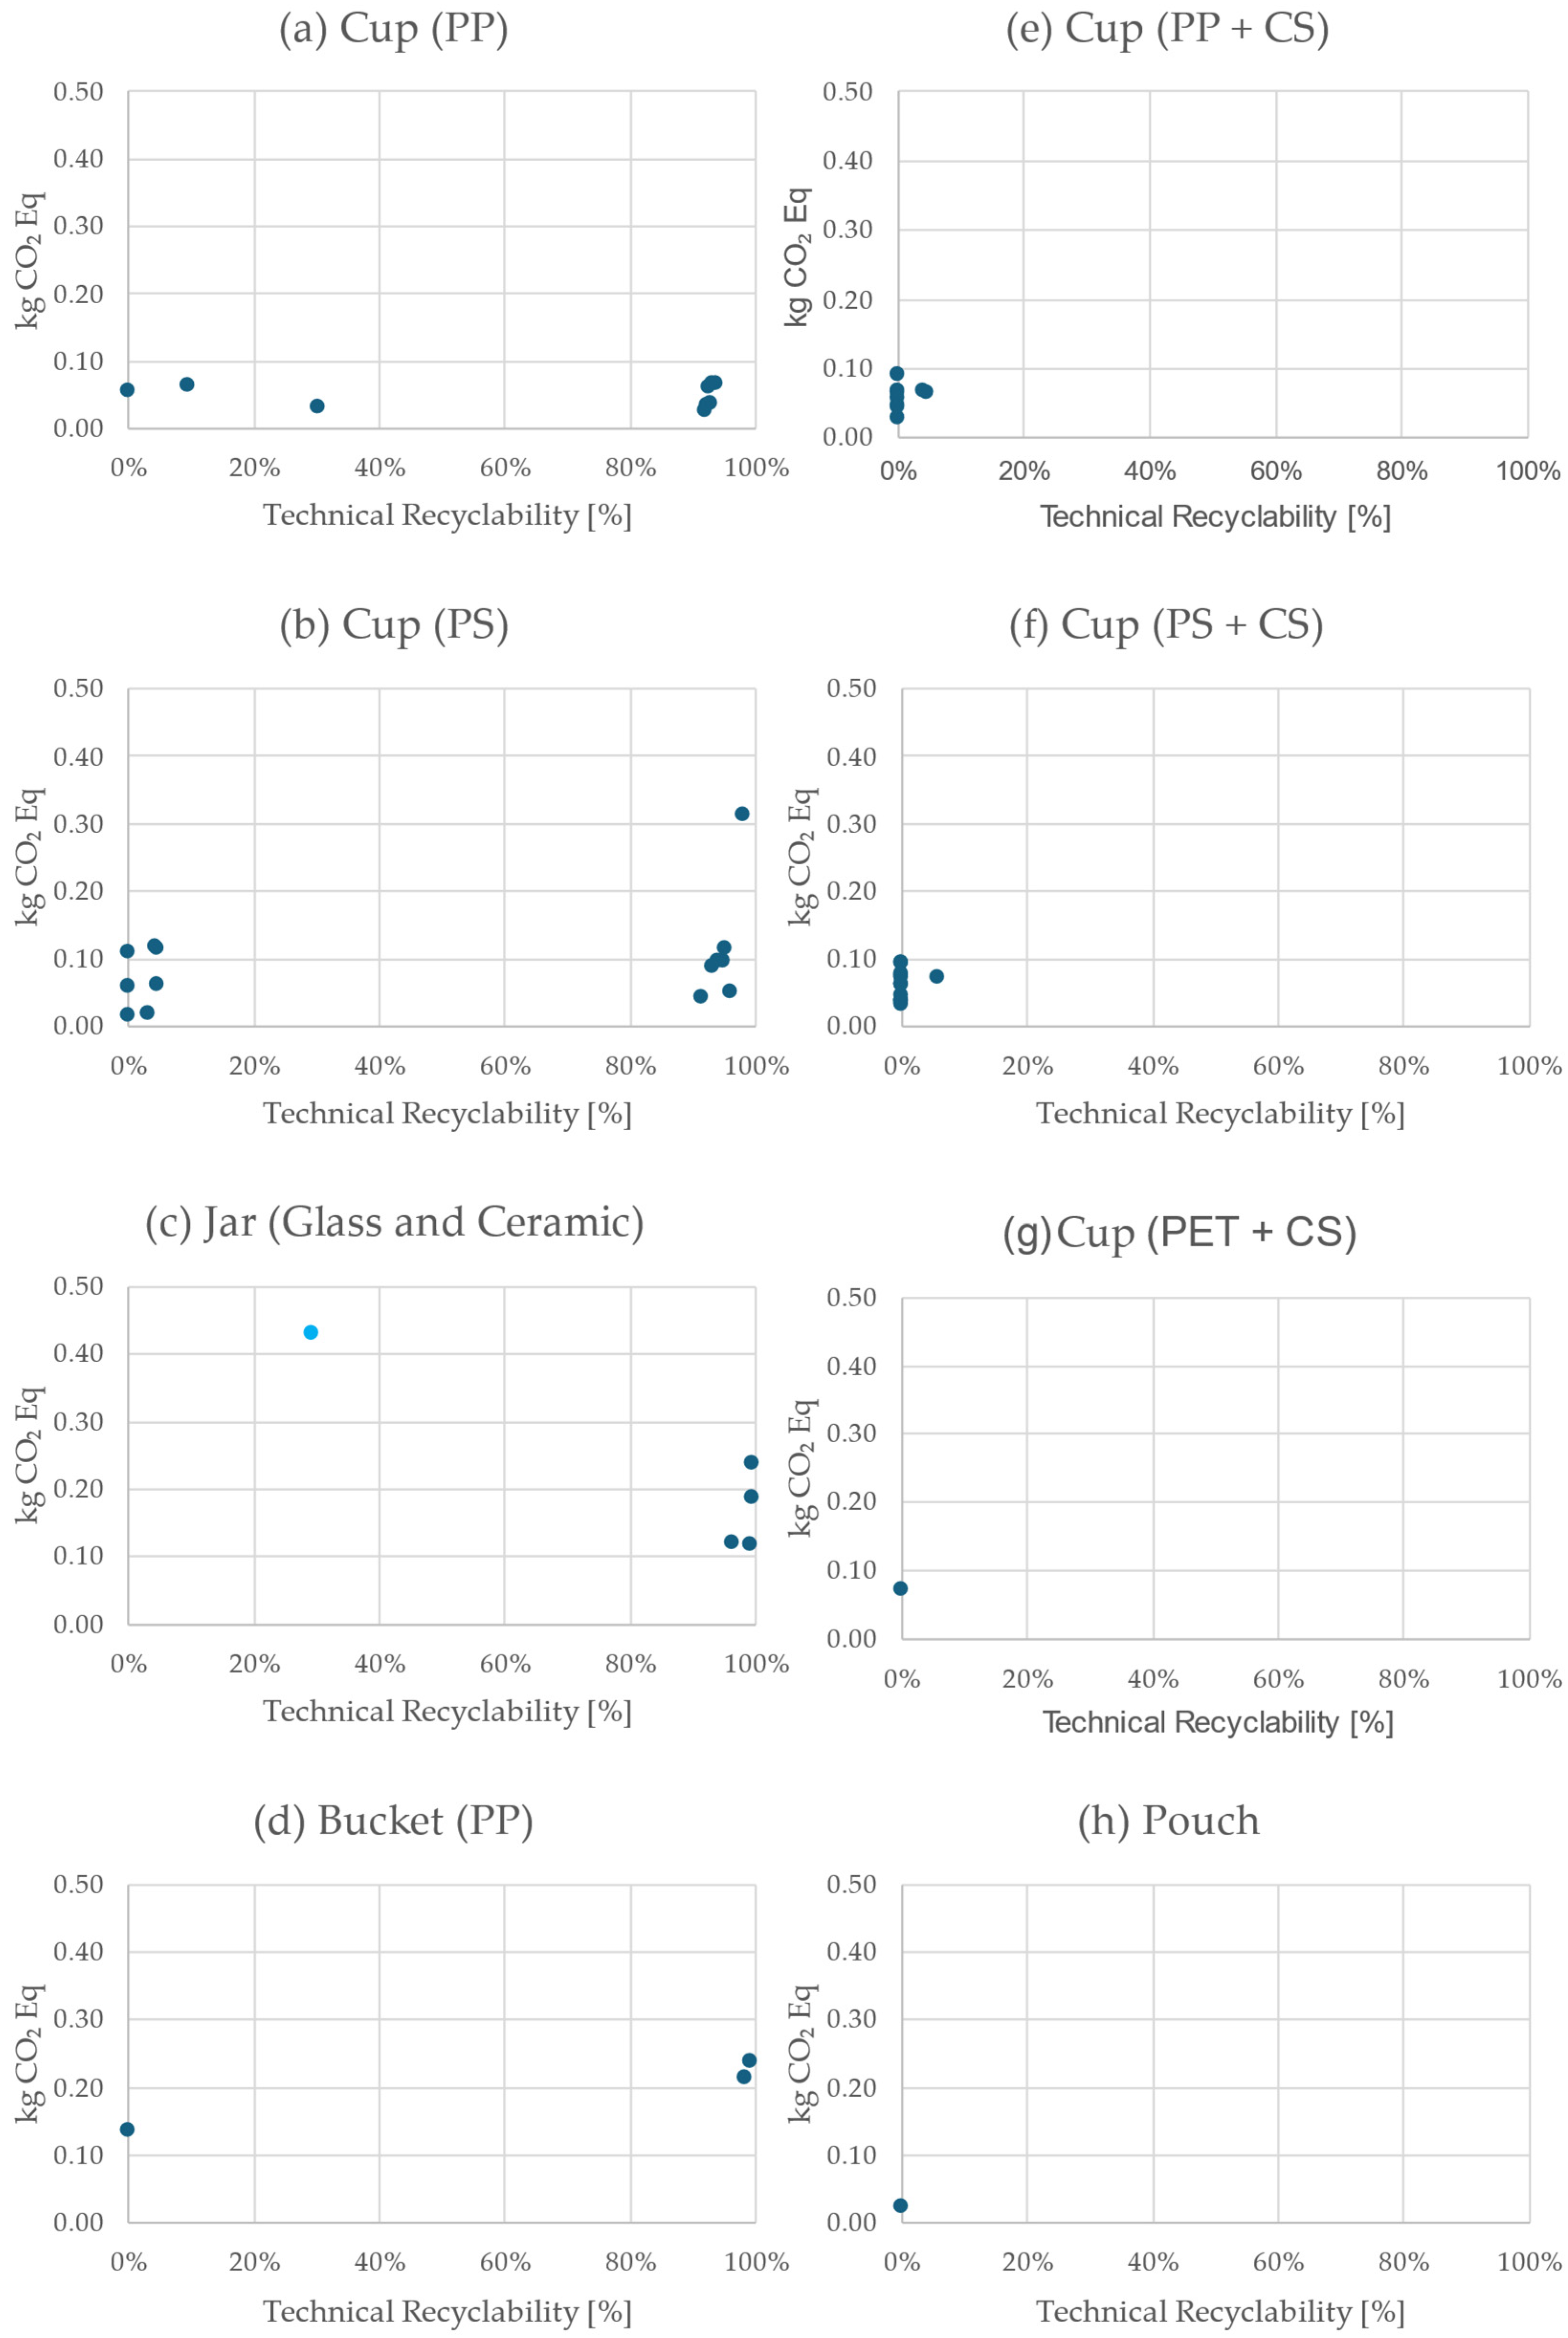
2.1. Recyclability Results for Butter Packaging

Of the 27 butter packaging samples assessed, sixteen products were packaged in a paper composite wrap, one sample was packaged in a glass and one in a shrink wrap, and nine were packaged in a tray (Figure 1). These trays included a cardboard sleeve in some cases. The market research concluded that 47% of butter sold in the DACH region is available in wraps, 43% is available in trays, and 4% is available in glass jars, and the same share accounts for shrink foils.
As illustrated in Figure 1, the recyclability of wraps comprising aluminum and paper composites is notably low in all three countries. The recyclability value in Austria ranges from 24% to 31%, with an average value of 27%. The values for Germany range from 0% to 31%, with an average of 4%, and in Switzerland, the maximum measured recyclability is 26%, with an average of 2%. Eight of the eleven assessed wraps are 0% recyclable in Germany and Switzerland. The analysis revealed that all wraps contained between 45% and 61% renewable resources. However, no correlation could be established between the content of renewable materials and their recyclability.
The recyclability of glass reaches 97% in the three countries. However, deductions were taken for silicon rings integrated into the closure mechanism, printing ink, and the presence of an acrylic layer wrapped around the glass and covering less than 50% of the packaging’s surface, which influences the recyclability of the cardboard banderole.
Regarding shrink-foiled packaging, it should be noted that the only component that can be recycled is the steel clip, which represents 23% of the total packaging weight. Upon recycling, this component enters the tin-plate waste stream. It is anticipated that the main body, comprising a polyvinyl chloride (PVC) film, and the label, consisting of coated paper and polyethylene terephthalate (PET), will be directed toward the paper waste stream. The PVC foil thus contaminates the waste stream and is lost for recycling, while the paper components are also not recyclable due to the material composition.
Three trays manufactured from PP were evaluated and demonstrated recyclability values ranging from 94% to 100% in Germany and Austria. However, in Switzerland, two trays were not recyclable, while the remaining sample achieved a recyclability of only 7%.
Six trays were found to contain a sleeve made of cardboard. In these instances, the recyclability in Austria ranged from 0% to 94%, while in Germany and Switzerland, it ranged between 0% and 4%, with one outlier at 44% and 30%, respectively.
The tray with the cardboard sleeve, which achieved a recycling rate of 94%, is composed of four elements: a primary body crafted from PP, a banderole created from a solid bleached board, and a dual-component closure comprising a PP lid and an aluminum–LDPE–paper composite foil. As a consequence, the main body is incorporated into the PP stream and is therefore recyclable, albeit with a reduced quality due to the white opaque material colorization. Consequently, it is rated as B by the software (Figure 2).
The PP lid is also included in the same recycling stream, with a B rating due to the use of coloring and dark printing ink, which contaminates the waste stream. The composite foil is directed to the aluminum recycling stream, where the LDPE and paper components of the composite are not recyclable and are therefore rated with a C. The decoration, made of bleached cardboard, is directed to the paper/cardboard waste stream and is recyclable while being only slightly limited due to the use of an acrylic lacquer and printing ink.

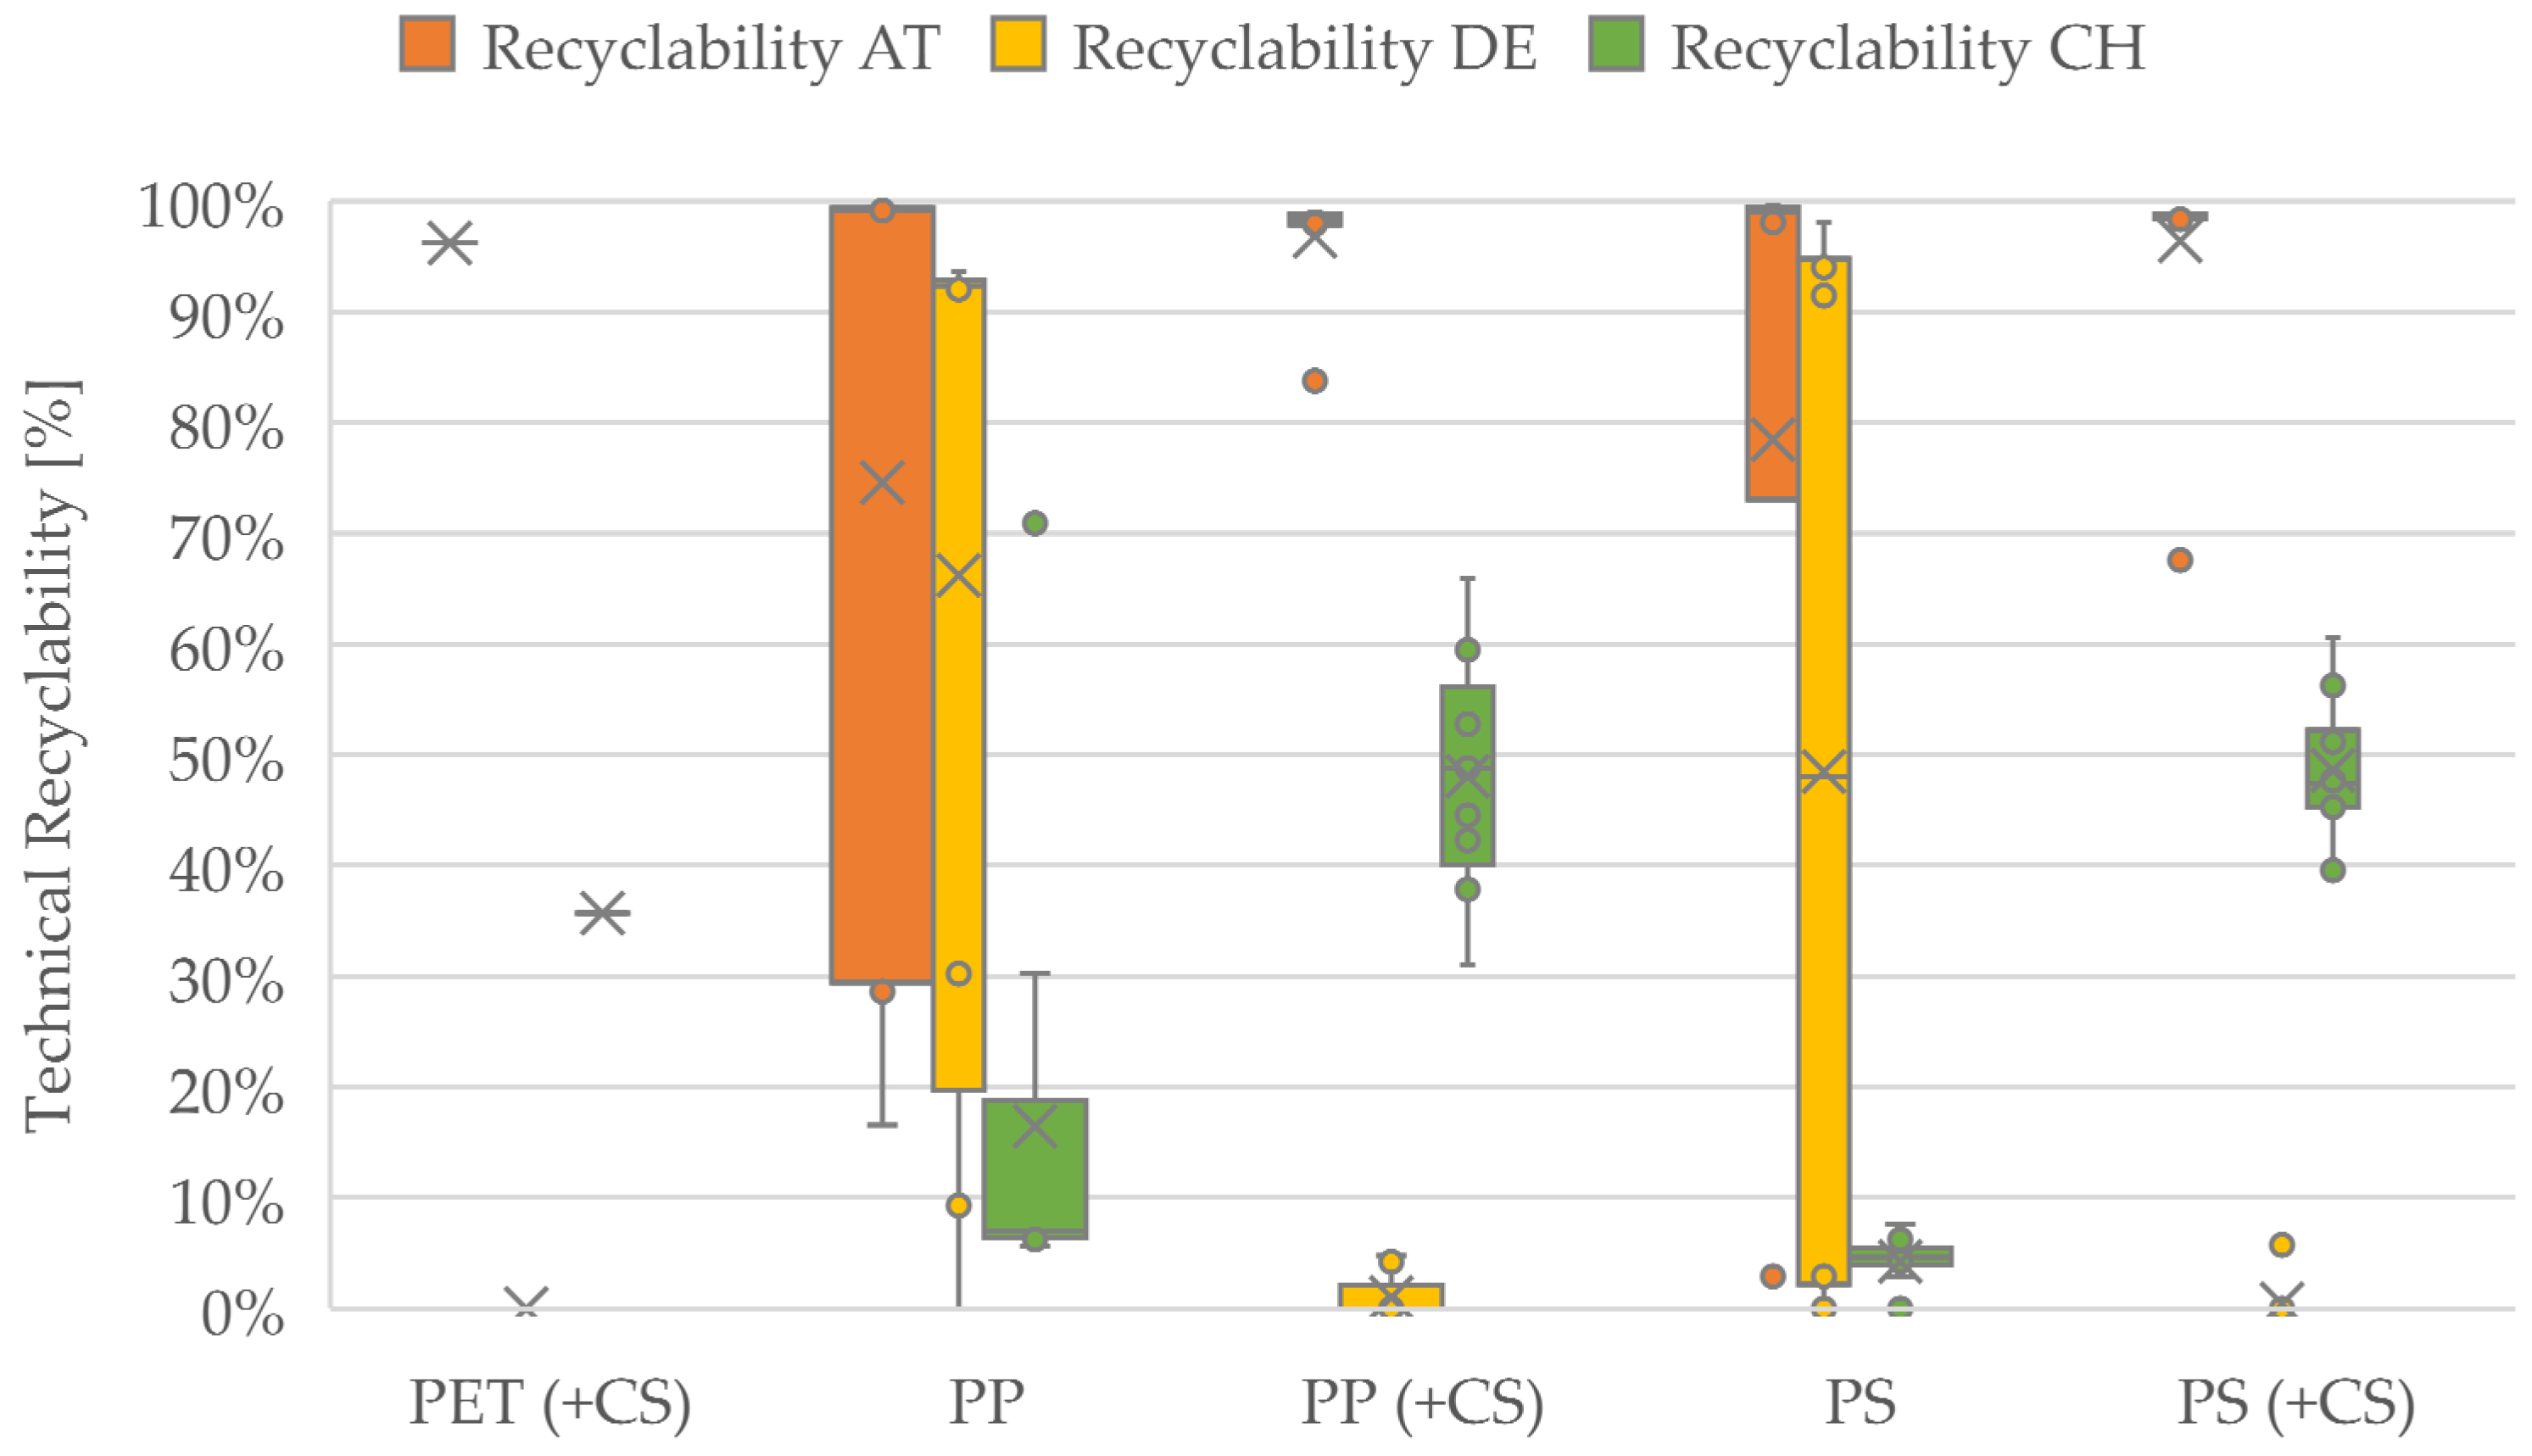
2.2. Recyclability Results for Yogurt Packaging

The yogurt packaging sampling consisted of four glass jars, one ceramic jar, and one LDPE/HDPE pouch with a screw cap made of PET. The majority of the samples were cups, comprising 47 of the total 56 samples. Three PP buckets with a filling volume of 1000 mL were also assessed. The majority of yogurts are sold in cups according to the market research conducted. Cups amount to 75% of the packaging used, buckets up to 5%, and glass jars up to 14%. The overall recyclability of this product category shows clear tendencies (Figure 3). In Austria, most samples show a high rate of recyclability, while in Germany, the average recyclability was measured to be 34%. In Switzerland, the recyclability of yogurt packaging is similarly low at 31%.
Yogurt cups are manufactured using a variety of materials and are available in a range of designs and with varying degrees of decoration (Figure 4). The sample was comprised of a cup constructed from PET and a cardboard sleeve. The sample demonstrated recycling rates of 96% in Austria, 36% in Switzerland, and 0% in Germany. For recyclability assessment, it is currently assumed that consumers in Austria and Switzerland actively separate the cardboard sleeve from the main body of the packaging if it is clearly labeled, but no empirical studies on actual consumer behavior are available.
In Germany, the German Mindeststandard does not allow us to take into account a separation step by the consumer. If no active separation by the consumer is assumed, then the recyclability of the paper–plastic cup would be 0% in Austria and Switzerland as well.
Consequently, in Austria, the PET cup and PET lid are included in the PET waste stream, while the cardboard sleeve is included in the waste stream for paper and cardboard. In Germany, the entire packaging is directed into the cardboard waste stream, where it is rendered unfit for recycling due to contamination. In Switzerland, the entire packaging is also directed into the waste stream for cardboard, where the cardboard sleeve can be recycled, while the PET component of the packaging is transferred to thermal processing.
The assessment of cups manufactured from PP or PS with the addition of a cardboard sleeve yielded comparable outcomes to those observed in the PET cup with a cardboard sleeve.
In the case of cups manufactured from PP or PS without banderoles composed of cardboard, the results demonstrate a more extensive bandwidth. The recyclability of PP cups in Austria ranges from 17% to 99%, with an average value of 75%. In Germany, the average recyclability is lower at 66%, with a maximum of 94% and a minimum of 0%. In Switzerland, the recyclability of the cups in question ranges between 6% and 71%, with an average of 16%.
The average recyclability of PS cups in Austria is 78%, in Germany, it is 48%, and in Switzerland, it is 4%.
The recyclability of one pouch was assessed and found to be non-recyclable in all three countries, while the glass jars demonstrated approximately 99% recyclability.

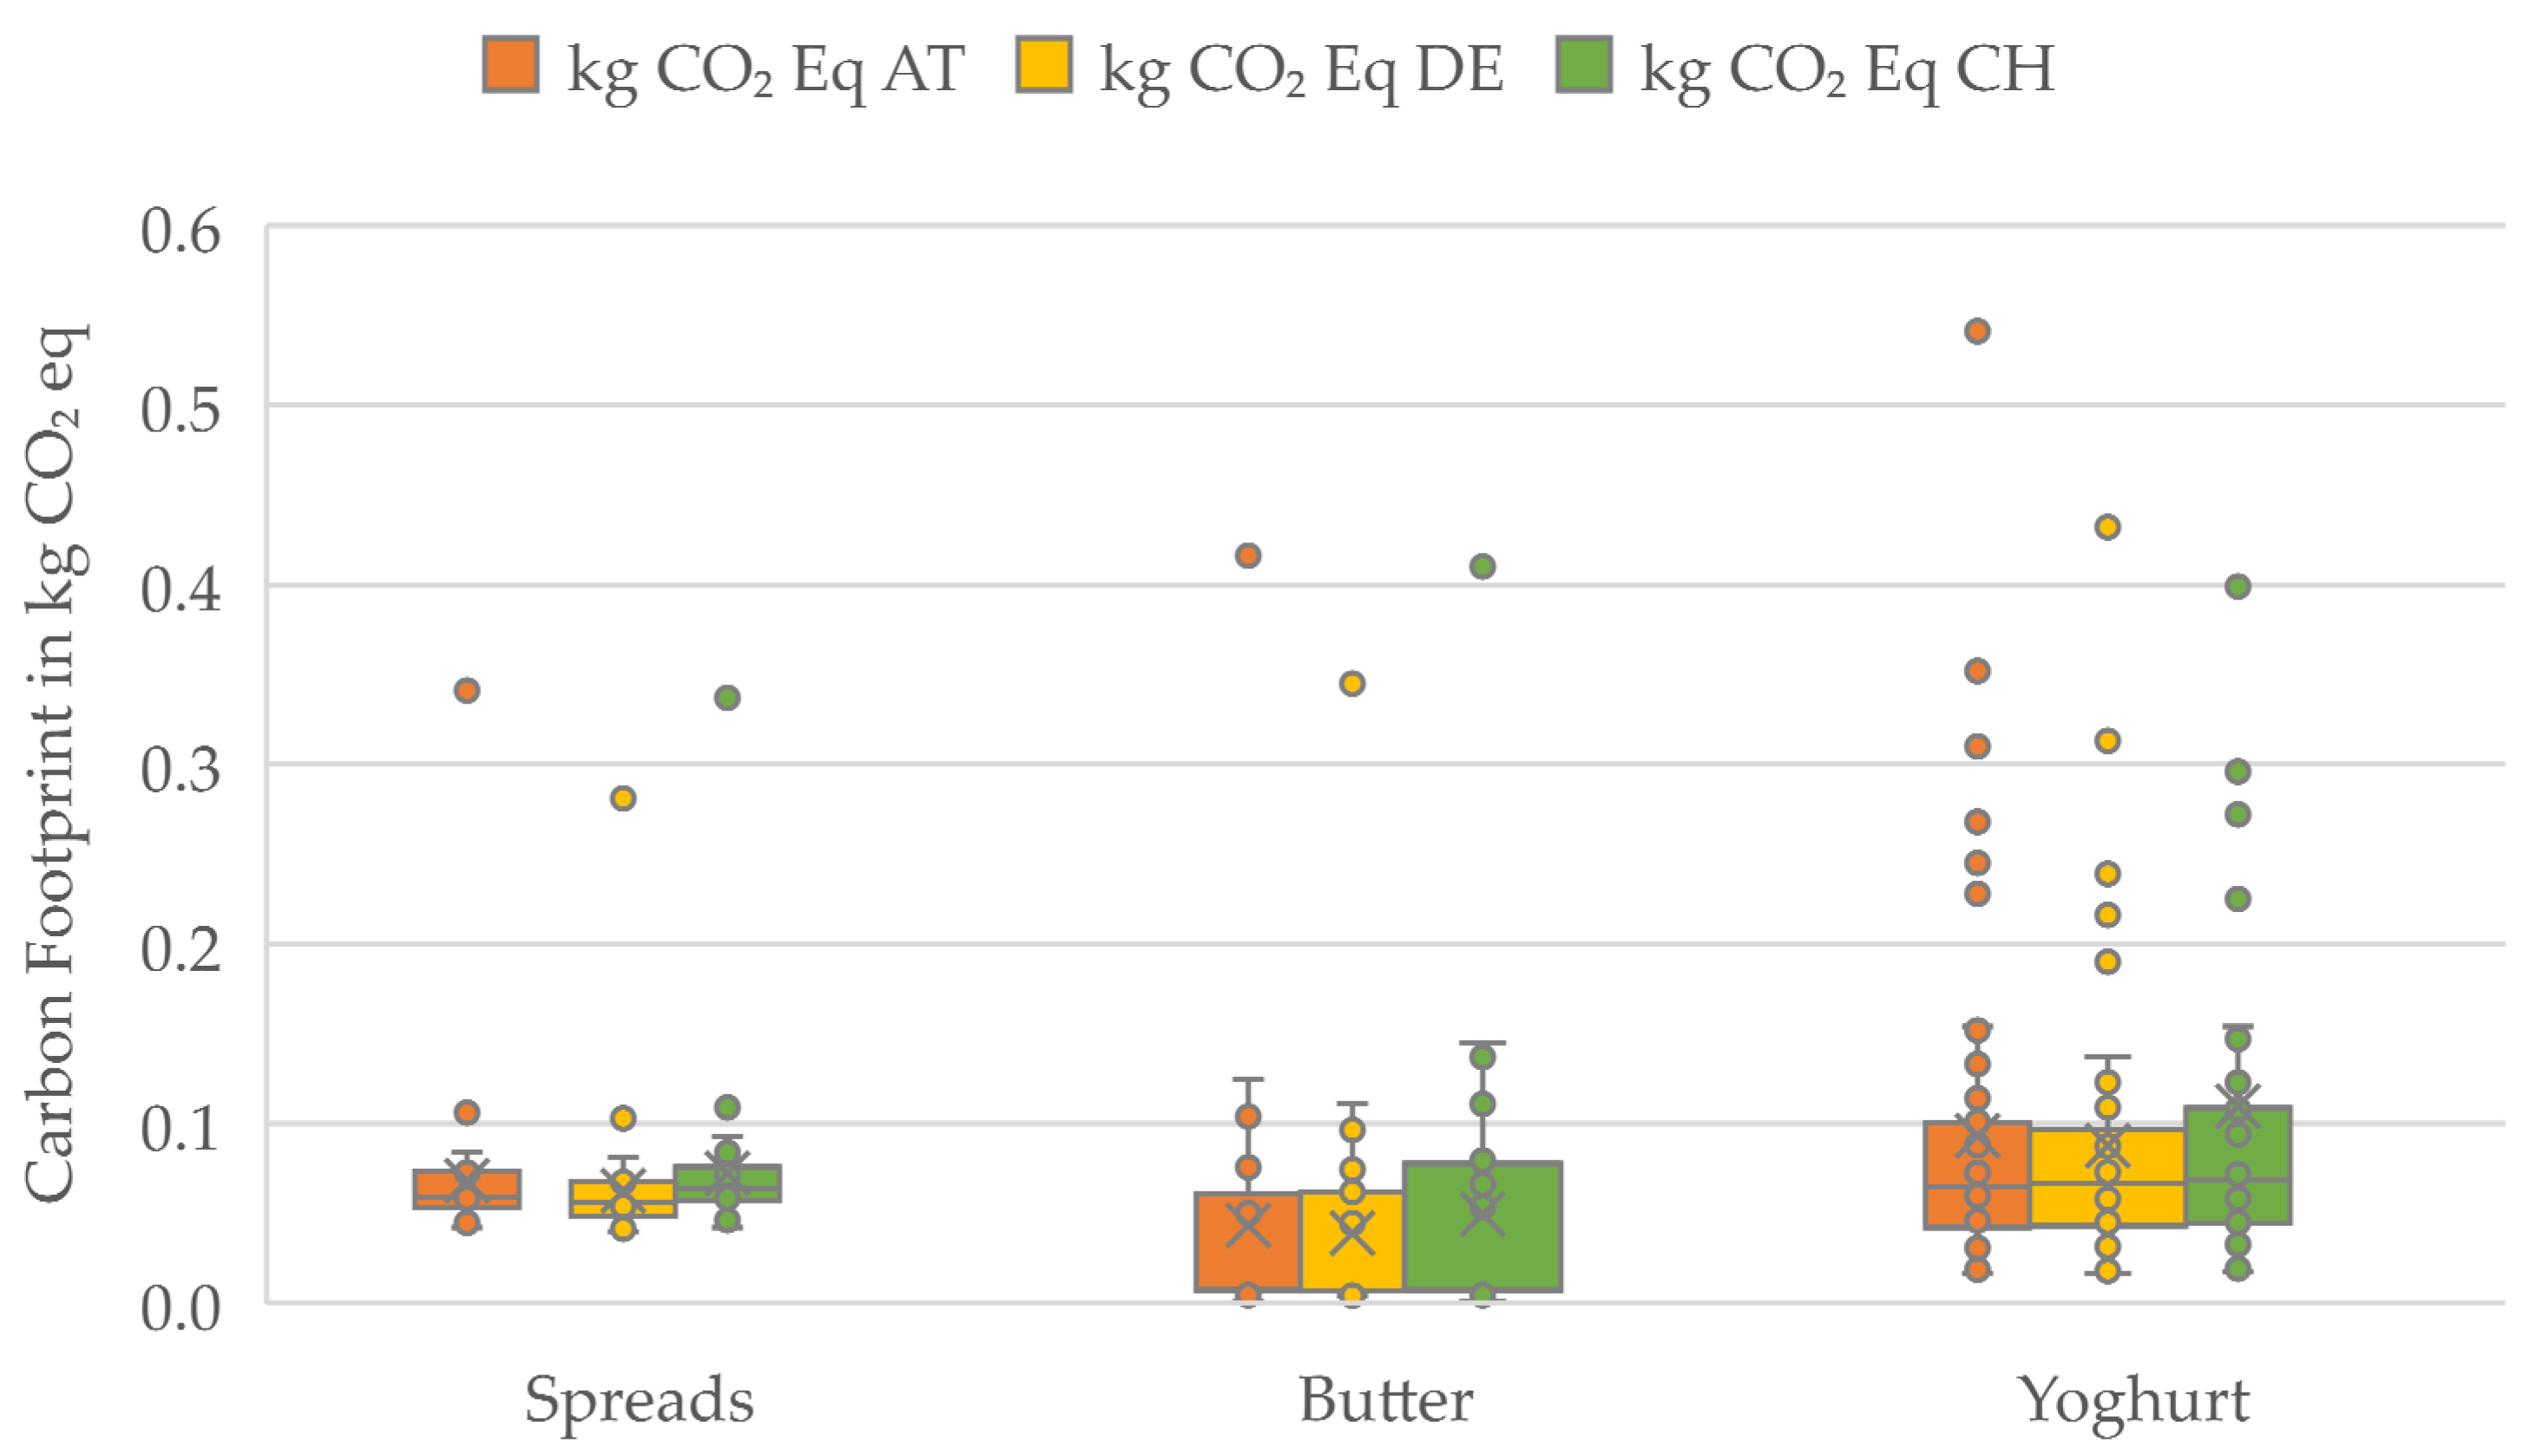
2.3. Recyclability Results for Spread Packaging

In this study, 46 samples containing spreads, cream cheese, and curd cheese were assessed. Only 1 sample was a glass jar, while the other 45 were cups or trays. Cups and trays are also dominant packaging options sold on the market, with 98% of spreads sold in cups or trays. Due to the similar packaging to yogurt, the results show similar tendencies in recyclability (Figure 3 and Figure 5). The best results overall for recyclability were reached for glass jars, as well as for PP and PS cups without cardboard sleeves, in Germany and Austria (see Supporting Information “Supporting Data—BYS”).

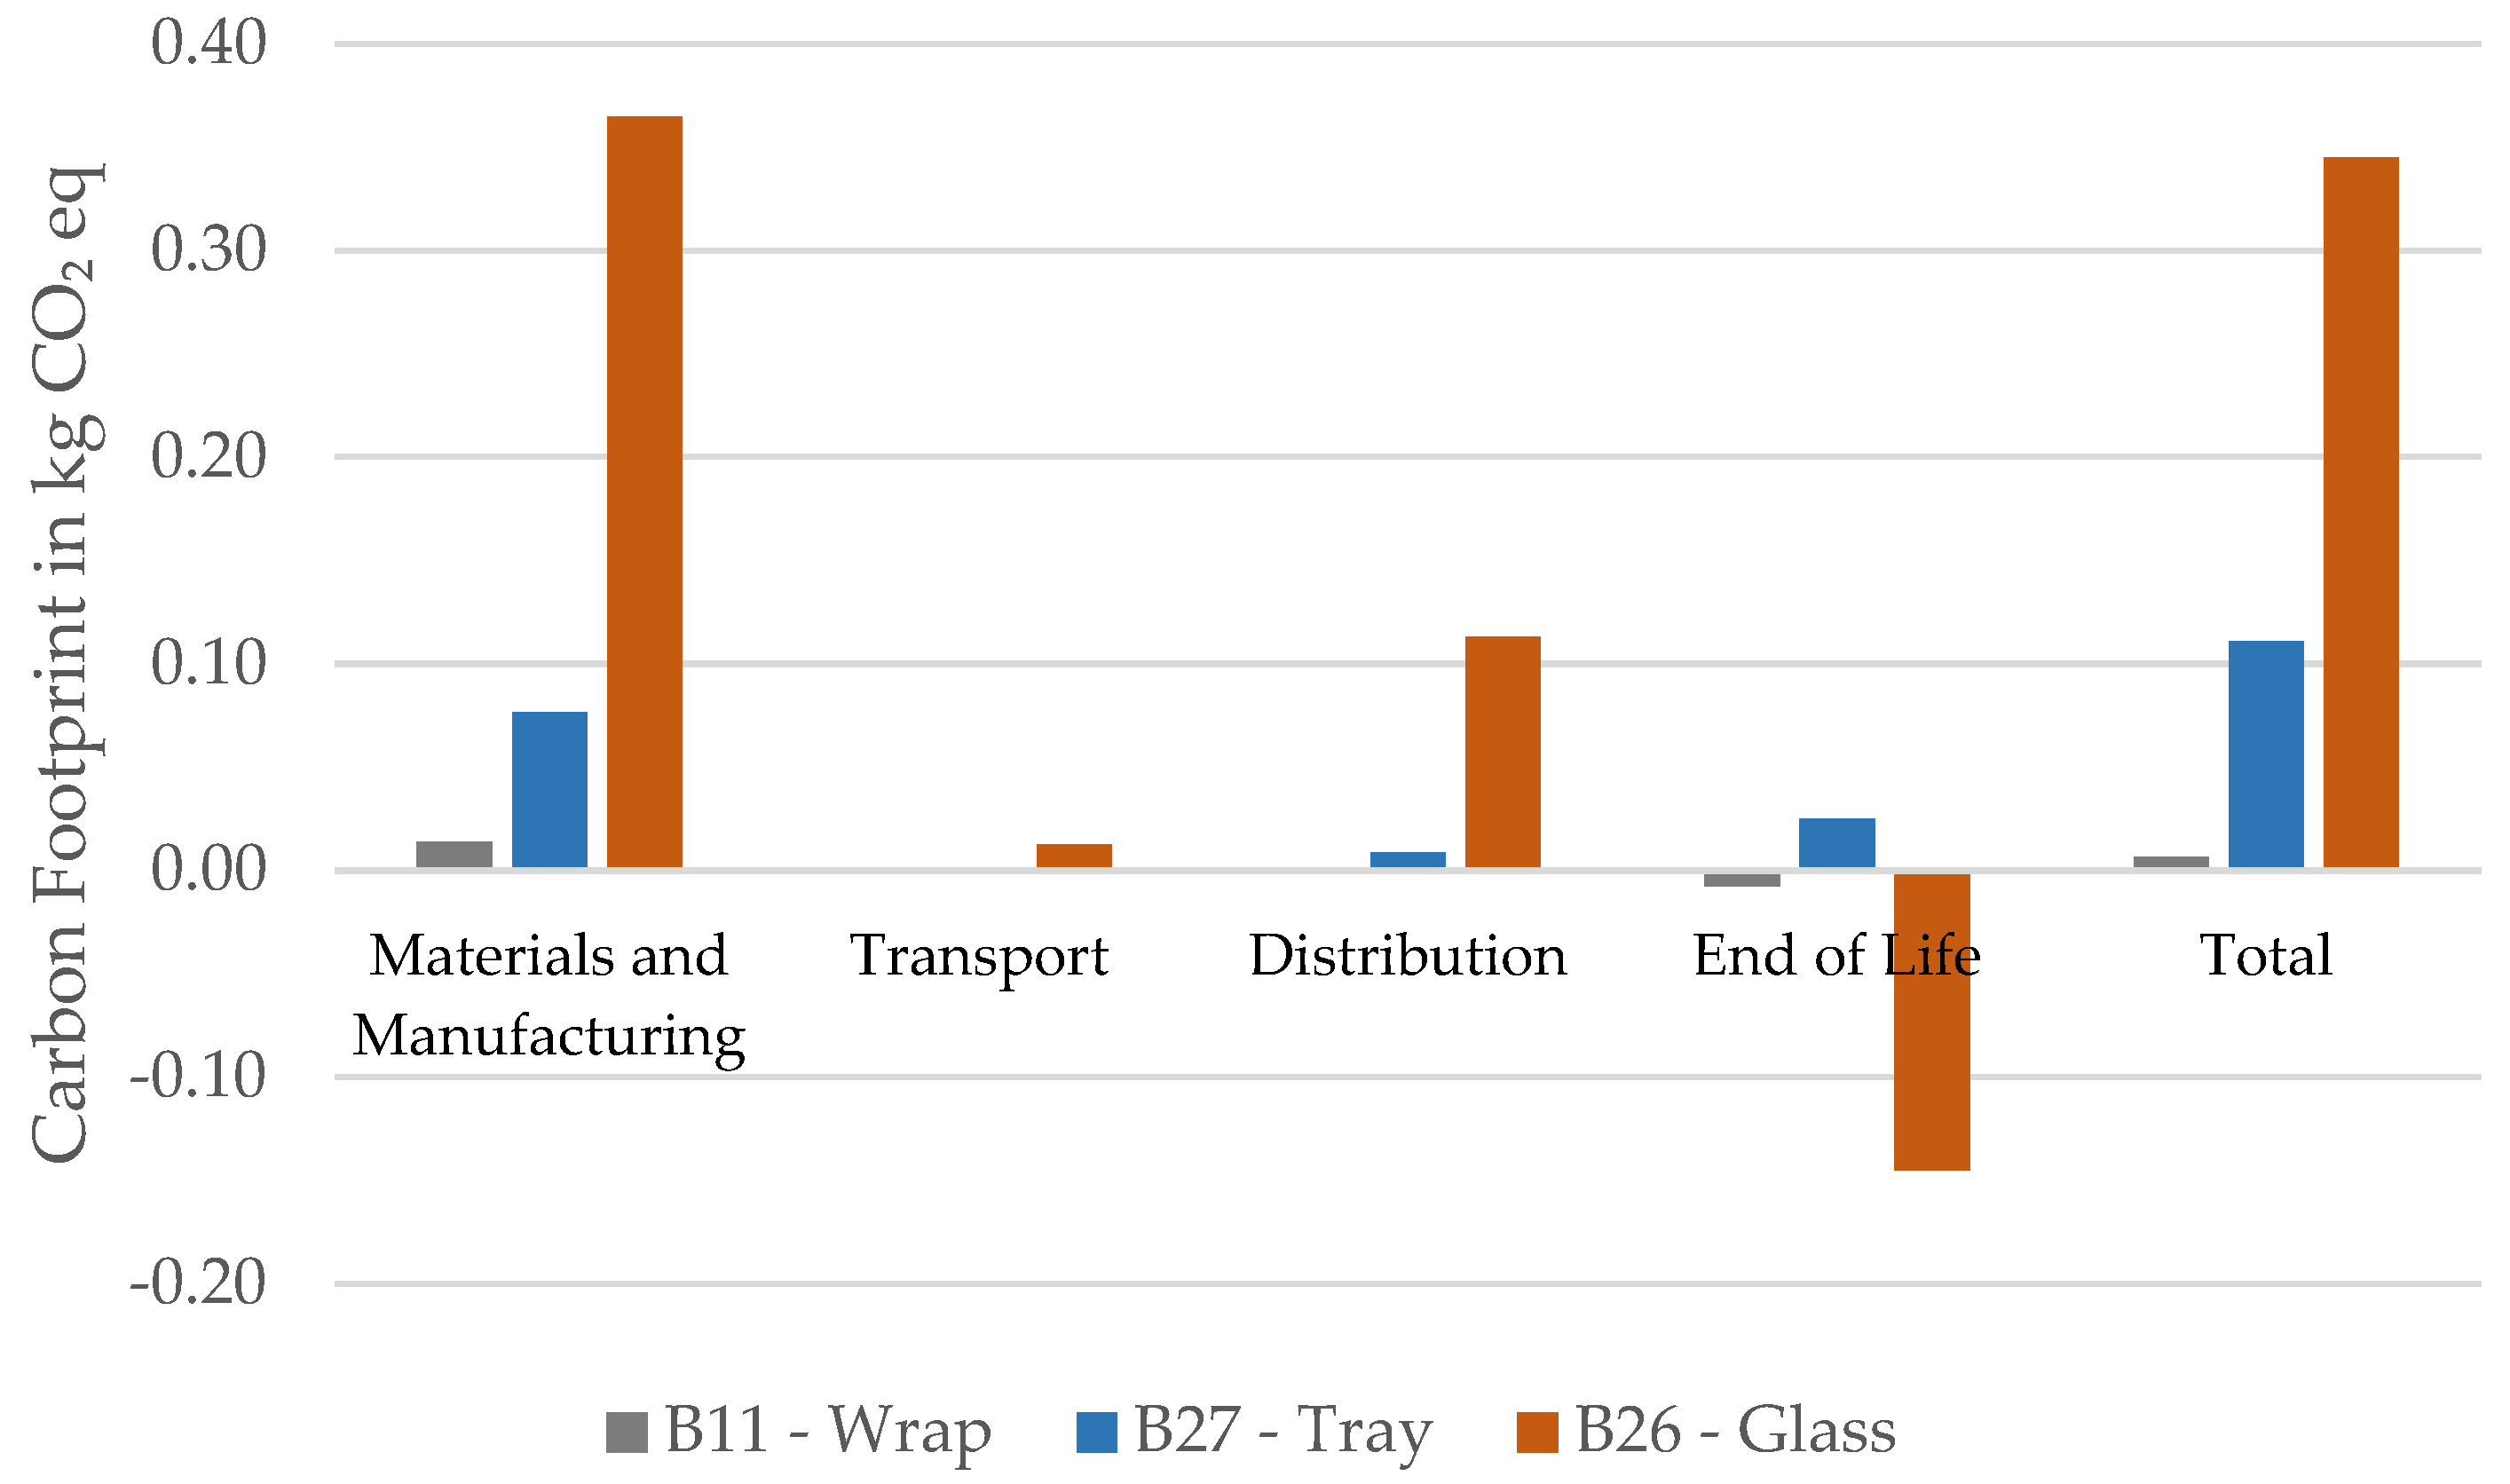
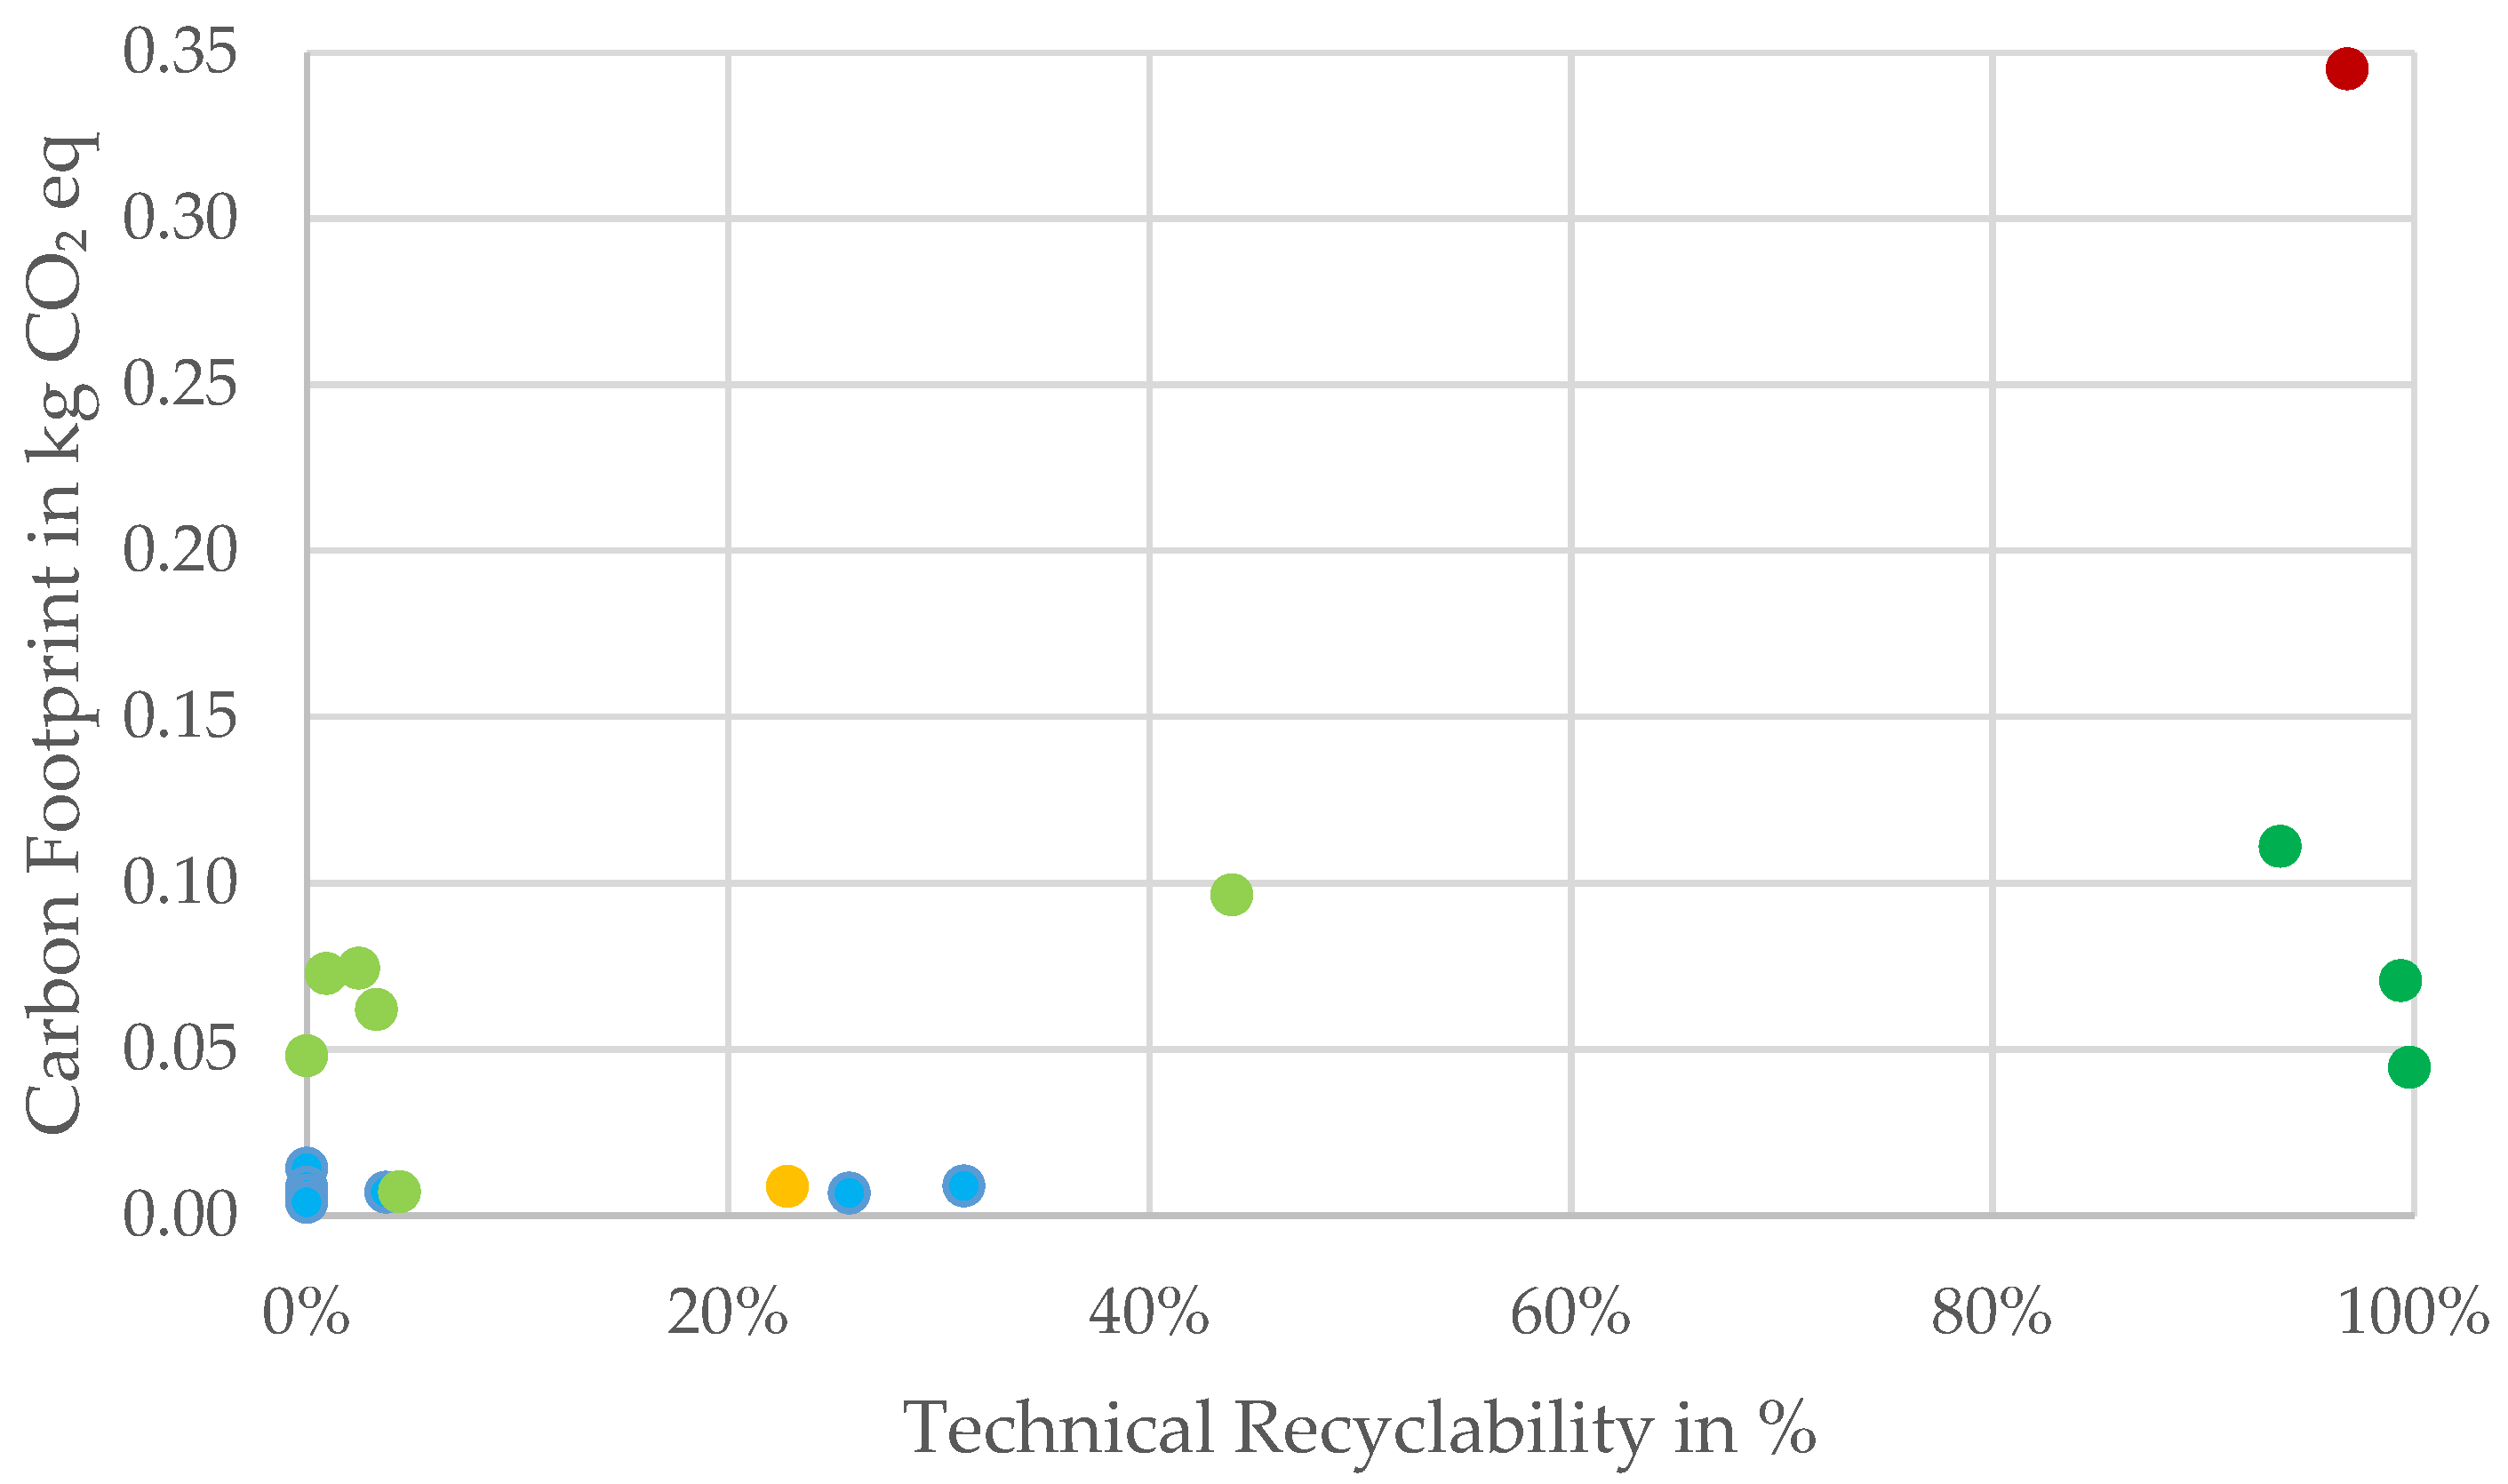
2.4. Carbon Footprint Results

The carbon footprint of the three product groups was evaluated utilizing the Packaging Cockpit Software. The calculation is based on primary data within the software, which are derived from Ecoinvent 3.10 and are evaluated using the LCIA method EF3.1, and secondary data from the packaging specifications submitted by the companies. The results are given for each of the four life cycle stages—material and manufacturing, transport, distribution, and end-of-life (EOL).
The results demonstrate a significant disparity between product groups, as well as within the product groups themselves in the case of yogurt (Figure 6). The discrepancies between countries are relatively minimal, predominantly originating from the variations in emissions from transportation and distribution and the energy mix employed for waste management. For spreads and butter, one packaging sample was a glass jar, which is indicated in Figure 6 as an outlier due to the comparably higher carbon footprint. For yogurt, the bandwidth is higher than for the other product groups, which is also caused by the higher diversity in filling volume and therefore packaging sizes and material usage. A PP cup for yogurt with a filling quantity of 250 g exhibits 0.035 kg CO2 eq, while a similarly designed cup with a filling quantity of 500 g exhibits 0.692 kg CO2 eq.
In the direct comparison of different packaging options for butter including a paper composite wrap, a tray made of PP, and a glass jar, the glass jar exhibits the highest emissions in total with 0.345 kg CO2 eq (Figure 7). The jar shows comparably high emissions in the manufacturing phase (0.365 kg CO2 eq) due to the high energy consumption in glass manufacturing. The emissions in transport and distribution are elevated due to the high weight of the packaging material compared to paper composites and plastics.

3. Materials and Methods

3.1. Material

A total of 27 samples of butter packaging were analyzed, along with 46 samples of packaging for spreads, cream cheese, and curd cheese, and 56 samples of packaging for yogurt and skyr (Table 1). The category of butter encompasses full-fat butter, as well as butter blends, which are mixtures of butter and margarine.
Prior to sampling, market research was conducted. The online stores of Coop, ALDI CH, and Migros in Switzerland, Spar, Hofer, and Billa in Austria, and Penny, Lidl, Kaufland, Rewe, and ALDI Süd in Germany were screened for the available packaging options for the product categories. The samples were procured from either in-store purchases or submissions from dairies, retail stores, brand owners, and packaging manufacturers. In the latter case, participants submitted packaging specifications that provided additional information relevant to data input into the Packaging Cockpit Software, Version 2.4.0 (https://packaging-cockpit.com/) (accessed on 31 October 2024), which are listed in Section 2.2. This software enables an automated calculation of the recyclability of packaging in various countries and conducts a streamlined life cycle assessment (LCA). For this study, only the Global Warming Potential (GWP) category was selected for packaging comparison. The calculation for the carbon footprint is performed based on data from Ecoinvent 3.10 and evaluated using the life cycle impact assessment (LCIA) method EF3.1.

3.2. Assessment Recyclability and Global Warming Potential

To enable the calculation of recyclability, the assessment tool in the software Packaging Cockpit requires a specific set of data.
The dataset comprised information about the filling, including the product category, quantity or volume, country of assembly and distribution, packaging dimensions, main packaging body type, and types of packaging aids.
To complete the assessment, the following information is required for the main body:
  • Printing coverage in %.
  • Flexible or rigid component.
  • Presence of an NIR-barrier.
  • Information on Material Layer (each layer needs to be entered, and a detection layer needs to be selected):
    Material.
    Material Manifestation.
    Manufacturing Type.
    Content of Recyclate in %.
    Color.
    Mass in g.
    Material density.
In the case that the packaging contains a closure, the following data are necessary:
  • Type of Closure.
  • Printing coverage in %.
  • Flexible or rigid component.
  • Presence of an NIR-barrier.
  • Dimensions.
  • Irreversible Removal through Consumption/Usage.
  • Removal for Disposal by Average Consumer.
  • Information on Material Layer (the same information as for the main body is relevant).
If the packaging has decoration, additional information is needed:
  • Type of Decoration.
  • Printing coverage in %.
  • Covered Surface Area of Main Body in %.
  • Presence of an NIR-barrier.
  • Dimensions.
  • Irreversible Removal through Consumption/Usage.
  • Removal for Disposal by Average Consumer.
  • Adhesion to Main Body.
  • Information on Material Layer (the same information as for the main body is relevant).
Upon entering the above information, an automatic calculation of the recyclability and GWP is performed.
For the assessment of technical recyclability, the singular packaging components are evaluated in five categories: A, B, C, D, and X (Table 2). Here, we must mention that those categories are not congruent with the assessment categories according to the PPWR.

4. Discussion

The objective of the study was to evaluate the recyclability and carbon footprint of various packaging options for dairy products, including butter, yogurt, spreads, cream cheese, and curd cheese, available on the market in Germany, Austria, and Switzerland. The findings indicate a significant degree of variability between the different packaging options in terms of their environmental impact, with minor design variations having a considerable impact, such as the choice of material for banderoles.
Glass packaging exhibited high recyclability across all three countries yet proved the least favorable option in terms of carbon footprint. The use of trays without a cardboard sleeve result sin a reduction in the carbon footprint. The assessment of recyclability yielded favorable results in Germany and Austria; however, in Switzerland, the necessary waste management infrastructure is lacking. The recyclability of shrink foils, paper composite wraps, and trays with a cardboard sleeve is found to be severely limited.
The precise results for the recyclability of cups manufactured from PP or PS, with or without a cardboard sleeve, are found to be highly variable for products such as spreads and yogurt. The absence of a cardboard sleeve is found to significantly enhance the recyclability in Germany, as the German Minimum Standard [49] does not assume any separation of the different components, in contrast to RecyClass [50], which is the adopted standard in Austria.
To the best of the authors’ knowledge, no previous studies have been conducted on the recyclability of packaging options for these product groups. In our previous study, we investigated the recyclability of liquid dairy product packaging. We found overall recyclability in Germany and Austria to be below 70%, and, as was also found here, even lower recyclability in Switzerland due to the non-existence of waste streams [51].

4.1. Carbon Footprint and Recyclability Comparison for Butter Packaging

For butter, four main different packaging options were assessed (Figure 8). Of those, the highest carbon emissions were found for glass jars (red) with 0.345 kg CO2 eq in Germany but a recyclability of 97% of the whole packaging. Another option was shrink foil (orange) with a low recyclability of 23% but one of the best carbon footprints in the butter product category with 0.0087 kg CO2 eq in Germany. Similar low carbon emissions are found in samples of paper composite wraps (blue), as well as low recyclability, which does not perform adequately according to the standard set in the new PPWR of 70% recyclability [12]. This threshold is reached by three trays without cardboard sleeves (dark green), which reach over 90% in technical recyclability and exhibit carbon emissions between 0.0445 and 0.111 kg CO2 eq in Germany. Trays with sleeves (light green) show similar emissions but insufficient recyclability.
Ultimately, for the aspects of recyclability and carbon emissions, the preferred packaging options for butter in Germany are found to be trays without cardboard sleeves, as those performed with high recyclability and low emissions. Other trays and shrink foil did not perform in accordance with future legislative standards in the recyclability assessment.

4.2. Carbon Footprint and Recyclability Comparison for Yogurt Packaging in Germany

An assessment of nine different packaging types for yogurt was conducted, with a focus on the carbon footprint and recyclability of each option. The study revealed that while PP cups exhibited a slightly lower carbon footprint compared to PS cups, significant disparities in recyclability were observed. Specifically, PP and PS cups with cardboard sleeves, as well as PET cups with cardboard sleeves, demonstrated recyclability outcomes below 10%. Glass jars, while offering superior recyclability, exhibit a carbon footprint that is up to four times higher than that of PP cups. Ceramic jars, on the other hand, demonstrate the highest carbon footprint of all the assessed packaging options and exhibit a lack of recyclability. Pouches, while exhibiting favorable LCA results, are not recyclable. PP buckets demonstrate a high recyclability of 99% in two out of three cases and a carbon footprint of over 0.2 kg CO2 eq (Figure 9).

4.3. Limitations

Whilst the present study provides valuable insights into the environmental performance of packaging materials within the dairy sector in the DACH region, several limitations must be acknowledged. These limitations stem from methodological constraints, data availability, and the complexity of the regulatory and waste management landscape.
  • Data Availability and Accuracy: Data from packaging manufacturers and food producers were limited, potentially affecting the depth of the analysis.
  • Variability in Waste Management Systems and Recyclability Assessment Methodology: A key finding of the study was the impact of variations in waste management infrastructure on the recyclability of packaging materials. However, the study was unable to fully account for all local and regional variations in waste collection, sorting, and recycling processes within each country. As a result, the recyclability assessments are based on national frameworks rather than on detailed local practices, which may differ significantly within each country.
    Additionally, there is currently no harmonized methodology available for recyclability assessments on a European level. Ongoing work in the standardization of recyclability assessments of packaging at the European Committee for Standardisation (CEN), which will be part of the upcoming delegated act of the EU Commission due on 1.1.2028, will provide a harmonized standard.
  • Scope of Packaging Materials: This research focused on selected packaging formats for butter, yogurt, spreads, curd cheese, and cottage cheese. While acknowledging that these represent a significant share of dairy packaging, it must be noted that they do not cover the full spectrum of packaging solutions available on the global market. Other materials such as bio-based plastics, multilayer composites, and innovative alternative packaging solutions were not extensively analyzed, which may limit the comprehensiveness of the findings. Methodology of Carbon Footprint Assessment: This study assesses the carbon footprint of various packaging alternatives. However, it is important to note that variations in LCA methodologies and assumptions can introduce uncertainties. Factors such as energy sources, transportation distances, and end-of-life scenarios differ across regions and were estimated using available industry data. While these estimations are based on best practices, potential margins of error should be considered when interpreting the results.
  • Consumer Behavior and Market Dynamics: This study acknowledges the pivotal role of consumer preferences and purchasing behaviors in determining packaging adoption. However, it does not provide a comprehensive analysis of consumer perceptions of sustainability or the market dynamics influencing packaging choices. While industry trends indicate a shift toward recyclable and lower-carbon packaging, the adoption rates of such packaging will be influenced by economic feasibility, retailer preferences, and consumer acceptance.
  • Focus on the DACH Region: The geographical scope of the study is confined to the DACH region, implying that the findings might not be universally applicable to other EU member states with disparate waste management systems and consumer behaviors. The execution of comparative studies in other European regions could potentially offer further insights and enhance the generalizability of the conclusions.

4.4. Implications for Future Legislation

According to the PPWR, the design, manufacture, and commercialization of packaging should be conducted in a manner that facilitates its reuse or high-quality recycling, while also minimizing its environmental impact throughout the packaging’s entire life cycle and the life cycle of the products for which it was designed [12].
As the design-for-recycling assessment does not guarantee that packaging will be recycled in practice, it is essential to develop a consistent methodology and set of criteria for assessing recyclability. This should be based on the most advanced separate collection, sorting, and recycling processes and infrastructure currently available in the European Union [12]. Furthermore, related reporting from Member States and, where relevant, economic operators should be used to establish the thresholds for recyclability on a larger scale and update the grades of recyclability performance concerning specific packaging materials and categories [12].
The results presented here show a great need for improved design-for-recycling principles applied to dairy product packaging. While glass packaging already meets recycling targets and is designed to fit the available collection, sorting, and recycling infrastructure, this is not the case for most other packaging options in Germany and Austria, as both countries need to perform under the PPWR.
Furthermore, the carbon footprint must be considered when evaluating the viability of various packaging options. While glass may be optimal for recycling due to the presence of the necessary infrastructure in the assessed countries, it is associated with significantly higher carbon emissions compared to other packaging materials. Consequently, when selecting packaging for dairy products, it is essential to take into account the transportation and distribution distances involved.

5. Conclusions

This assessment demonstrated a notable degree of variability in recyclability, predominantly attributable to discrepancies in packaging design and material composition. This variability underscores the critical need for targeted improvements in packaging systems to align with the forthcoming regulatory framework, which places significant emphasis on recyclability and carbon footprint reduction.
In light of these findings, there is a compelling necessity for enhancement in the recyclability of these product categories, while simultaneously addressing the carbon footprint. Key measures must be implemented to ensure the effective management of recyclable materials. Such measures include the removal of barriers to recycling, such as incompatible materials and non-recyclable packaging designs. In addition, robust waste management systems must be established, with these systems being tailored to the unique requirements of each country. Legislative actions must also be implemented to ensure the production of food-grade recyclates that meet the new sustainability standards.
This study highlights several directions for further research in recycling. This includes exploring the development of mono-material packaging alternatives that simplify sorting and recycling processes. Understanding the role of consumer behavior in waste segregation and its impact on recycling efficiency is another critical area. Studies should also investigate the harmonization of waste management infrastructure across countries to reduce regional disparities and ensure consistent recyclability outcomes.
Continued cross-country analyses will be vital to understanding regional discrepancies and devising scalable solutions that promote sustainable packaging practices across the DACH region and beyond.

Supplementary Materials

The following supporting information can be downloaded at: www.mdpi.com/article/10.3390/recycling10020031/s1, File S1: Supporting Data—BYS.

Author Contributions

Conceptualization, M.K.; methodology, M.K.; validation, M.K., S.A. and M.T.; formal analysis, M.K.; investigation, M.K.; resources, M.K. and C.N.; data curation, M.K.; writing—original draft preparation, M.K.; writing—review and editing, M.K., S.A. and M.T.; visualization, M.K.; supervision, S.A. and M.T.; project administration, M.K. and C.N.; funding acquisition, S.A. and M.T. All authors have read and agreed to the published version of the manuscript.

Funding

This work was created within a research project of the Austrian Competence Centre for Feed and Food Quality, Safety. and Innovation (FFoQSI). The COMET-K1 competence center FFoQSI is funded by the Austrian federal ministries BMK, BMDW, and the Austrian provinces Lower Austria, Upper Austria, and Vienna within the scope of COMET—Competence Centers for Excellent Technologies. The COMET program is handled by the Austrian Research Promotion Agency FFG.

Data Availability Statement

The data presented in this study are available in the Supplementary Materials.

Acknowledgments

The authors would like to express their gratitude to all project participants who provided product samples. Special thanks are directed to all students and interns who were involved in data collection, as well as to the team members of the Institute of Packaging and Resource Management at FH Campus Wien and Circular Analytics. In particular, the authors would like to thank Mary Grace Wallis for her invaluable contribution to reviewing and providing comments on the manuscript.

Conflicts of Interest

Author Manfred Tacker and Charlotte Neumair were employed by the company Circular Analytics TK GmbH. The remaining authors declare that the research was conducted in the absence of any commercial or financial relationships that could be construed as a potential conflict of interest.

References

  1. Lebreton, L.; Andrady, A. Future scenarios of global plastic waste generation and disposal. Palgrave Commun. 2019, 5, 6. [Google Scholar] [CrossRef]
  2. PlasticsEurope. Plastics—The Fast Facts; Plastics Europe: Brussels, Belgium, 2023. [Google Scholar]
  3. Jakobs, M.; Kroell, N. Influence of plastic packaging design on the sensor-based sortability in lightweight packaging waste sorting plants. Resour. Conserv. Recycl. 2024, 207, 107599. [Google Scholar] [CrossRef]
  4. Bundeministerium für Ernährung und Landwirtschaft. Entwicklungen am Deutschen Milchmarkt—Ein Überblick. Available online: https://www.bmel.de/DE/themen/landwirtschaft/agrarmaerkte/entwicklungen-milchmarkt-de.html (accessed on 11 June 2024).
  5. Bundesamt für Landwirtschaft BLW. Milch und Milchprodukte. Available online: https://www.blw.admin.ch/blw/de/home/nachhaltige-produktion/tierische-produktion/milch-und-milchprodukte.html (accessed on 11 June 2024).
  6. Bundesministerium für Land- und Forstwirtschaft, Regionen und Wasserwirtschaft. Milchwirtschaft in Österreich. Available online: https://info.bml.gv.at/themen/landwirtschaft/landwirtschaft-in-oesterreich/tierische-produktion/milch/milchwirtschaft.html (accessed on 11 June 2024).
  7. Aryana, K.J.; Olson, D.W. A 100-Year Review: Yogurt and other cultured dairy products. J. Dairy Sci. 2017, 100, 9987–10013. [Google Scholar] [CrossRef] [PubMed]
  8. Chandan, R.C.; Kilara, A. Manufacturing Yogurt and Fermented Milks, 2nd ed.; Wiley-Blackwell: Hoboken, NJ, USA, 2013; ISBN 9781119967088. [Google Scholar]
  9. Verriet, J.; Leroy, F. Yogurt’s flexible image during its rise in popularity in post-war Belgium. Appetite 2017, 108, 132–140. [Google Scholar] [CrossRef] [PubMed]
  10. Heidbreder, L.M.; Bablok, I.; Drews, S.; Menzel, C. Tackling the plastic problem: A review on perceptions, behaviors, and interventions. Sci. Total Environ. 2019, 668, 1077–1093. [Google Scholar] [CrossRef] [PubMed]
  11. Wohner, B.; Schwarzinger, N.; Gürlich, U.; Heinrich, V.; Tacker, M. Technical emptiability of dairy product packaging and its environmental implications in Austria. PeerJ 2019, 7, e7578. [Google Scholar] [CrossRef]
  12. European Commission. Regulation (EU) 2025/40 of the European Parliament and of the Council of 19 December 2024 on Packaging and Packaging Waste, Amending Regulation (EU) 2019/1020 and Directive (EU) 2019/904, and Repealing Directive 94/62/EC 2025; European Commission: Brussel, Belgium, 2025. [Google Scholar]
  13. BMK. Die Bestandsaufnahme der Abfallwirtschaft in Österreich; Bundesministerium: Berlin, Germany, 2024.
  14. European Environmenal Agency. Early Warning Assessment Related to the 2025 Targets for Municipal Waste and Packaging Waste; European Environmenal Agency: Copenhagen, Denmark, 2022. [Google Scholar]
  15. Umweltbundesamt. Weltrecyclingtag: Wieviel Recyceln wir Wirklich? Available online: https://www.umweltbundesamt.de/themen/weltrecyclingtag-wieviel-recyceln-wir-wirklich (accessed on 3 February 2025).
  16. Bundesrat. Kunststoffe in der Umwelt—Bericht des Bundesrates in Erfüllung der Postulate Thorens, Munz, Flach, CVP-Fraktion; Der Bundesrat: Berlin, Germany, 2022.
  17. World Packaging Organisation. Waste Stream Mapping Guides: Packaging Waste Streams Austria; World Packaging Organisation: Wien, Austria, 2022. [Google Scholar]
  18. World Packaging Organisation. Waste Stream Mapping Guides: Packaging Waste Streams Germany; World Packaging Organisation: Wien, Austria, 2022. [Google Scholar]
  19. World Packaging Organisation. Waste Stream Mapping Guides: Packaging Waste Streams Switzerland; World Packaging Organisation: Wien, Austria, 2022. [Google Scholar]
  20. prEN 18120-1:2024; Packaging—Design for Recycling of Plastic Packaging—Part 1: Definitions and Principles for Design-for-Recycling of Plastic Packaging. Austrian Standards International—Standardisierung und Innovation: Vienna, Austria, 2024.
  21. Eriksen, M.K.; Astrup, T.F. Characterisation of source-separated, rigid plastic waste and evaluation of recycling initiatives: Effects of product design and source-separation system. Waste Manag. 2019, 87, 161–172. [Google Scholar] [CrossRef] [PubMed]
  22. Ragaert, K.; Delva, L.; van Geem, K. Mechanical and chemical recycling of solid plastic waste. Waste Manag. 2017, 69, 24–58. [Google Scholar] [CrossRef] [PubMed]
  23. Brouwer, M.T.; van Thoden Velzen, E.U.; Augustinus, A.; Soethoudt, H.; de Meester, S.; Ragaert, K. Predictive model for the Dutch post-consumer plastic packaging recycling system and implications for the circular economy. Waste Manag. 2018, 71, 62–85. [Google Scholar] [CrossRef] [PubMed]
  24. Welle, F. Twenty years of PET bottle to bottle recycling—An overview. Resour. Conserv. Recycl. 2011, 55, 865–875. [Google Scholar] [CrossRef]
  25. Hahladakis, J.N.; Iacovidou, E. Closing the loop on plastic packaging materials: What is quality and how does it affect their circularity? Sci. Total Environ. 2018, 630, 1394–1400. [Google Scholar] [CrossRef]
  26. Eriksen, M.K.; Christiansen, J.D.; Daugaard, A.E.; Astrup, T.F. Closing the loop for PET, PE and PP waste from households: Influence of material properties and product design for plastic recycling. Waste Manag. 2019, 96, 75–85. [Google Scholar] [CrossRef] [PubMed]
  27. Jung, H.; Shin, G.; Kwak, H.; Hao, L.T.; Jegal, J.; Kim, H.J.; Jeon, H.; Park, J.; Oh, D.X. Review of polymer technologies for improving the recycling and upcycling efficiency of plastic waste. Chemosphere 2023, 320, 138089. [Google Scholar] [CrossRef] [PubMed]
  28. Prielinger, L.; Bandyopadhyay, S.; Ortner, E.; Novak, M.; Radusin, T.; Annfinsen, S.; Sharmin, N.; Rainer, B.; Pettersen, M.K. Investigation of the Effectiveness of Barrier Layers to Inhibit Mutagenic Effects of Recycled LDPE Films, Using a Miniaturized Ames Test and GC-MS Analysis. Recycling 2024, 9, 57. [Google Scholar] [CrossRef]
  29. Horodytska, O.; Cabanes, A.; Fullana, A. Non-intentionally added substances (NIAS) in recycled plastics. Chemosphere 2020, 251, 126373. [Google Scholar] [CrossRef]
  30. Kato, L.S.; Conte-Junior, C.A. Safety of Plastic Food Packaging: The Challenges about Non-Intentionally Added Substances (NIAS) Discovery, Identification and Risk Assessment. Polymers 2021, 13, 2077. [Google Scholar] [CrossRef] [PubMed]
  31. Nguyen, T.L.; Saleh, M.A. Thermal degradation of azobenzene dyes. Results Chem. 2020, 2, 100085. [Google Scholar] [CrossRef]
  32. Mayrhofer, E.; Prielinger, L.; Sharp, V.; Rainer, B.; Kirchnawy, C.; Rung, C.; Gruner, A.; Juric, M.; Springer, A. Safety Assessment of Recycled Plastics from Post-Consumer Waste with a Combination of a Miniaturized Ames Test and Chromatographic Analysis. Recycling 2023, 8, 87. [Google Scholar] [CrossRef]
  33. Andreasi Bassi, S.; Boldrin, A.; Faraca, G.; Astrup, T.F. Extended producer responsibility: How to unlock the environmental and economic potential of plastic packaging waste? Resour. Conserv. Recycl. 2020, 162, 105030. [Google Scholar] [CrossRef]
  34. Antonopoulos, I.; Faraca, G.; Tonini, D. Recycling of post-consumer plastic packaging waste in the EU: Recovery rates, material flows, and barriers. Waste Manag. 2021, 126, 694–705. [Google Scholar] [CrossRef] [PubMed]
  35. Feil, A.; Pretz, T.; Jansen, M.; van Thoden Velzen, E.U. Separate collection of plastic waste, better than technical sorting from municipal solid waste? Waste Manag. Res. 2017, 35, 172–180. [Google Scholar] [CrossRef] [PubMed]
  36. Gritsch, L.; Lederer, J. A historical-technical analysis of packaging waste flows in Vienna. Resour. Conserv. Recycl. 2023, 194, 106975. [Google Scholar] [CrossRef]
  37. Horodytska, O.; Valdés, F.J.; Fullana, A. Plastic flexible films waste management—A state of art review. Waste Manag. 2018, 77, 413–425. [Google Scholar] [CrossRef] [PubMed]
  38. Lederer, J.; Bartl, A.; Blasenbauer, D.; Breslmayer, G.; Gritsch, L.; Hofer, S.; Lipp, A.-M.; Mühl, J. A review of recent trends to increase the share of post-consumer packaging waste to recycling in Europe. Detritus 2022, 19, 3–17. [Google Scholar] [CrossRef]
  39. Picuno, C.; Alassali, A.; Chong, Z.K.; Kuchta, K. Flows of post-consumer plastic packaging in Germany: An MFA-aided case study. Resour. Conserv. Recycl. 2021, 169, 105515. [Google Scholar] [CrossRef]
  40. Roosen, M.; Mys, N.; Kleinhans, K.; Lase, I.S.; Huysveld, S.; Brouwer, M.; van Thoden Velzen, E.U.; van Geem, K.M.; Dewulf, J.; Ragaert, K.; et al. Expanding the collection portfolio of plastic packaging: Impact on quantity and quality of sorted plastic waste fractions. Resour. Conserv. Recycl. 2022, 178, 106025. [Google Scholar] [CrossRef]
  41. Schuch, D.; Lederer, J.; Fellner, J.; Scharff, C. Separate collection rates for plastic packaging in Austria—A regional analysis taking collection systems and urbanization into account. Waste Manag. 2023, 155, 211–219. [Google Scholar] [CrossRef] [PubMed]
  42. Stotz, P.M.; Niero, M.; Bey, N.; Paraskevas, D. Environmental screening of novel technologies to increase material circularity: A case study on aluminium cans. Resour. Conserv. Recycl. 2017, 127, 96–106. [Google Scholar] [CrossRef]
  43. Tallentire, C.W.; Steubing, B. The environmental benefits of improving packaging waste collection in Europe. Waste Manag. 2020, 103, 426–436. [Google Scholar] [CrossRef] [PubMed]
  44. Schmidt, S.; Laner, D. The multidimensional effects of single-use and packaging plastic strategies on German household waste management. Waste Manag. 2021, 131, 187–200. [Google Scholar] [CrossRef] [PubMed]
  45. Viscusi, W.K.; Huber, J.; Bell, J. Changes in household recycling behavior: Evidence from panel data. Ecol. Econ. 2023, 208, 107819. [Google Scholar] [CrossRef]
  46. Warrings, R.; Fellner, J. How to increase recycling rates. The case of aluminium packaging in Austria. Waste Manag. Res. 2021, 39, 53–62. [Google Scholar] [CrossRef] [PubMed]
  47. European Commission. A New Circular Economy Action Plan for a Cleaner and More Competetive Europe; European Commission: Brussel, Belgium, 2020. [Google Scholar]
  48. Turner, A. Black plastics: Linear and circular economies, hazardous additives and marine pollution. Environ. Int. 2018, 117, 308–318. [Google Scholar] [CrossRef] [PubMed]
  49. Stiftung Zentrale Stelle Verpackungsregister. Mindeststandard für die Bemessung der Recyclingfähigkeit von Systembeteiligungspflichtigen Verpackungen gemäß § 21 Abs. 3 VerpackG; Stiftung Zentrale Stelle Verpackungsregister: Osnabrück, Germany, 2024. [Google Scholar]
  50. RecyClass. Recyclability & Sorting Evaluation Protocols. Available online: https://recyclass.eu/recyclability/test-methods/ (accessed on 31 December 2024).
  51. Klein, M.; Neumair, C.; Primoceri, M.; Tacker, M.; Apprich, S. Fit for the Future: An Assessment of the Sustainability Parameters of Liquid Dairy Product Packaging in the DACH Region and the Implications of Upcoming Regulatory Changes. Foods 2025, 14, 195. [Google Scholar] [CrossRef] [PubMed]
Figure 1. Technical recyclability of butter packaging in Austria (AT), Germany (DE), and Switzerland (CH) by packaging type. Trays with and without Cardboard Sleeves (+CS) are shown separately.
Recycling 10 00031 g001
Figure 2. Results from the packaging cockpit for the recyclability in Austria of a tray made of PP with a cardboard sleeve containing butter (Sample B10 in the Supporting Information “Supporting Data—BYS”). The rating categories range from A to D, in addition to an “?”, in which case no clear categorization could be performed based on the entered data. A indicates that the material can be recycled without loss, while material rated D can not be recycled and additionally contaminates the quality of recyclate of other recycling streams. Detailed information about the rating can be found in Section 3.2.
Recycling 10 00031 g002
Figure 3. Technical recyclability of yogurt packaging in Austria (AT), Germany (DE), and Switzerland (CH).
Recycling 10 00031 g003
Figure 4. Comparison of technical recyclability for different material compositions of cups containing yogurt in Austria (AT), Germany (DE), and Switzerland (CH). Packaging options with cardboard sleeves (+CS) have been displayed separately.
Recycling 10 00031 g004
Figure 5. Technical recyclability of packaging for spreads, curd cheese, and cream cheese in Austria (AT), Germany (DE), and Switzerland (CH).
Recycling 10 00031 g005
Figure 6. Carbon footprint of packaging for spreads, butter, and yogurt in Austria (AT), Germany (DE), and Switzerland (CH).
Recycling 10 00031 g006
Figure 7. Carbon footprints of three different packaging options for butter (paper composite wrap, PP tray, and glass jar) in Germany. The calculated emissions of different life stages are displayed from the Software Package Cockpit.
Recycling 10 00031 g007
Figure 8. Technical recyclability and carbon footprint of butter packaging in Germany. Samples are colorized according to their packaging type: glass Jar (red), shrink foil (orange), trays without cardboard sleeves (dark green) and with cardboard sleeves (light green), and paper composite wrap (blue).
Recycling 10 00031 g008
Figure 9. Assessment of the recyclability in Germany of different packaging options. (c) the light blue dot represents the ceramic jar and the dark blue dots represent glass jars.
Recycling 10 00031 g009
Table 1. Composition of the sampling for the assessment. For each product category, different packaging types and material combinations were available. These include trays and cups made of PP, PS, or PET with or without cardboard sleeves (CS).
Packaging TypeMaterialButterYogurtSpreads
BucketPP 3
CupPP 96
CupPS 146
Cup + CSPP + Cardboard 92
Cup + CSPS + Cardboard 145
Cup + CSPET + Cardboard 11
JarGlass141
JarCeramic 1
Shrink Foil 1
TrayPP3 15
TrayPS 4
TrayPET 1
Tray + CSPP + Cardboard6 3
Tray + CSPS + Cardboard 1
Tray + CSPET + Cardboard 1
PouchLDPE/HDPE 1
WrapFiber Composite16
Table 2. Categories for the recyclability assessment.
Assessment CategoryDefinition
AThe material can be recycled within the designated material stream, and the resulting recyclate can be used for applications requiring materials of identical or superior quality.
BThe material can be recycled within the designated material stream; however, the resulting recycled material is of inferior quality. Furthermore, the quality of the recycled material for other materials in the same disposal unit is also negatively impacted.
CIt is not possible to recycle the material within the designated material stream. Nevertheless, the material does not affect the recyclability or quality of the recyclate of other materials in the same disposal unit to the same extent as other materials.
DThe material in question cannot be recycled within the assigned material stream. Furthermore, it is negatively affecting the recyclability and quality of the recyclate of other materials in the same disposal unit.
XThe material in question cannot be recycled within the assigned material stream. Furthermore, the material in question contaminates the disposal unit. All other materials in the disposal unit, which are processed with this material during the recycling process, are considered to be non-recyclable.
Disclaimer/Publisher’s Note: The statements, opinions and data contained in all publications are solely those of the individual author(s) and contributor(s) and not of MDPI and/or the editor(s). MDPI and/or the editor(s) disclaim responsibility for any injury to people or property resulting from any ideas, methods, instructions or products referred to in the content.

