Article

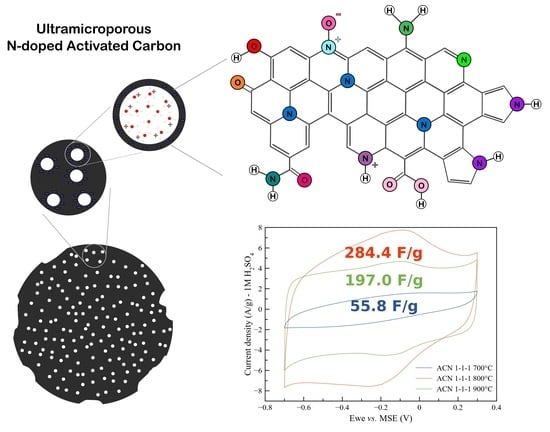
Ultramicroporous N-Doped Activated Carbon Materials for High Performance Supercapacitors

Institute of Chemistry and Processes for Energy, Environment and Health (ICPEES)—UMR-7515-25 Rue Becquerel, CEDEX 2, 67087 Strasbourg, France
*
Authors to whom correspondence should be addressed.
Batteries 2023, 9(9), 436; https://doi.org/10.3390/batteries9090436
Submission received: 18 July 2023 / Revised: 10 August 2023 / Accepted: 19 August 2023 / Published: 24 August 2023
(This article belongs to the Special Issue Emerging Materials and Technologies for Post-Lithium-Ion Batteries)

Abstract

:
Porous carbon electrode materials are utilized in supercapacitors with very fast charge/discharge and high stability upon cycling thanks to their electrostatic charge storage mechanism. Further enhancement of the performance of such materials can be achieved by doping them with heteroatoms which alter the kinetics of charge/discharge of the adsorbed species and result in pseudocapacitance phenomena. Here, microporous N-doped activated carbons were synthesized by thermochemical activation process. The structure and composition of the final material were adjusted by tuning the synthesis conditions and the choice of precursor molecules. In particular, N-doped activated carbons with a controlled specific surface area in the range of 270–1380 m2/g have been prepared by KOH-activation of sucrose/ammonium citrate mixture. By adjusting the composition of precursors, N-doping was varied from ca. 1.5 to 7.3 at%. The role of the components and synthesis conditions on the composition and structure of final products has been evaluated. The N-doped activated carbon with optimized structure and composition has demonstrated an outstanding performance as electrode material for aqueous electrolyte supercapacitors. The specific capacitance measured in a 3-electrode cell with 0.75 mg/cm2 loading of optimized activated carbon in 1M H2SO4 changed from 359 F/g at 0.5 A/g charging rate to 243 F/g at 20 A/g. Less than 0.01% of capacitance loss has been detected after 1000 charging/discharging cycles.

Graphical Abstract

1. Introduction

Supercapacitors are one of electrochemical energy storage devices (EESD), with performance characteristics complementary to batteries. Namely, in comparison to Li-ion batteries, supercapacitors are characterized by high power density and charging cyclability, but lower energy density [1,2]. Carbon materials are among the most commonly used electrode materials for supercapacitors, in particular in electrical double layer capacitors (EDLC), relying on the charging of an interfacial electrical double layer as a mechanism of charge storage [3,4]. The advantages of carbon materials are their high electrical conductivity, electrochemical stability, and controlled variability of materials structure and composition [3,5]. Carbon materials can be synthesized with wide variety of structures [6,7]: from 0D (carbon nanodots and carbon quantum dots [8]), to 1D (carbon nanotubes and nanofibres), 2D (graphene-type carbons [9]), to numerous porous 3D carbons, for example, activated carbons (AC). For EDLC electrodes, the carbon materials with high specific surface area (SSA) are of high interest, AC in particular [10].
AC is the group of carbon materials with outstandingly high SSA, close to the theoretical maximum for a closely packed sp2-carbon sheet (single graphene layer) of 2680 m2/g. Considering the typical value of the surface-specific interfacial capacitance of carbon materials Cs ≈ 5–10 μF/cm2 [11], one may expect the mass specific capacitance of carbon electrodes in the range Cg ≈ 150–300 F/g.
High SSA is provided by the open porous structure of AC with a predominant contribution of micropores (diameter d < 2 nm). The porous structure is formed by thermal or thermochemical activation of carbon precursors at high temperature (600–900 °C) under inert atmosphere.
As it has been thoroughly discussed in a number of reviews from the last decade [3,12,13,14,15,16], AC materials can be prepared from the wide range of carbon-rich precursors, including relatively cheap and abundant bio-wastes (domestic, agricultural, or agro-industrial). The electrochemical characteristics of AC materials, in particular their specific capacitance and stability, are influenced by the properties of AC, namely its chemical composition, SSA and porosity, and electrical conductivity. These properties are strongly varied depending on the choice of precursor and preparation conditions, which have to be optimized for the case of each particular type of precursor. The bio-sourced precursors have a complex composition, mostly containing sugars (sucrose and polysaccharides), cellulose, hemicellulose, and lignin [12,17]. In order to understand the correlation between the properties of AC and the conditions of its preparation, a simple chemically pure precursor model is used, such as glucose, sucrose, or cellulose. In particular, sucrose has been used as a precursor for the AC electrode materials for electrocatalysis [18] and EDLC supercapacitors [15]. It has been demonstrated [19] that AC materials with high SSA > 2000 m2/g can be prepared by the KOH thermochemical activation of sucrose under inert atmosphere.
This work presents a two-step synthesis of N-doped activated carbon (AC-N) prepared by the conventional approach with thermochemical activation by KOH as the final step. We intended to study the influence of the addition of ammonium citrate to the sucrose precursor on the properties of a final AC material. Citric acid is known to efficiently catalyze the hydrothermal carbonization of bio-waste precursors [20,21,22] through an esterification reaction with carbohydrates [23]. By using ammonium salt of citric acid, we intended to introduce N-heteroatoms into the carbon matrix of the final AC material. N-doped carbon materials are intensively studied as electrode materials for energy storage devices, namely Li-S and Li-ion batteries [24]. A systematic increase of the capacitance of carbon electrodes of supercapacitors with an increase in N-content (in the range 2–7 at.%) in various electrolytes has been demonstrated [25,26]. Outstanding mass specific capacitance above 800 F/g has been reported for N-doped mesoporous carbon prepared by the hard template method [27]. However, the variety of the nature of N-heteroatoms imbedded into the carbon structure complicates the general prediction of an optimal composition of N-doped carbon.
In the present work, we demonstrate that by using ammonium citrate and sucrose as initial precursors, N-doped AC materials with high SSA and performance as EDLC electrodes can be obtained. The origins of high capacitance and the role of different components of the synthesis are evaluated and discussed.

2. Materials and Methods

2.1. Synthesis of AC-N

First, 10 g of D(+)-Sucrose C12H22O11 (Acros Organics, 99+% purity for analysis, CAS: 57-50-1) was mixed with 10 g of anhydrous ammonium citrate (NH4)3Cit (Sigma, ≥97% purity, CAS: 3458-72-8), and finely grinded in a coffee grinder. The solid powder was then put into an oven at 160 °C in air for 4 h. The resulting solid intermediate was grinded once again and mixed with a concentrated aqueous solution containing 10 g of KOH (Acros Organics, extra pure, ca. 85%, flakes, CAS: 1310-58-3). The slurry mixture was dried again at 160 °C for 4 h. Dried KOH-impregnated intermediate was loaded into a tubular reactor kept under Ar flow (10 ccm. min−1). The temperature was raised to the annealing temperature of 700 °C/800 °C/900 °C within 3 h, and then kept at the set temperature for 1 h. The product was then left to cool down under the flow of Ar. The final product was washed with 2M HCl and ultrapure water, filtered, and dried in the oven overnight at 80 °C.
The reference samples were also synthesized by using 10 g of pure sucrose without any other additive, and 10 g of sucrose and 10 g of citric acid (Chem-Lab, 99.5–101%, CAS: 5949-29-1). All other conditions of synthesis were the same as described above.
All aqueous solutions in this work were prepared by using ultrapure water (18.2 Mohm.cm, TOC < 2 ppb) produced by the Ultra PureLab Chorus (Veolia) device.

2.2. Physicochemical Characterization of AC-N

Scanning electron microscopy (SEM) measurements were done in ICPEES by using a Zeiss 2600F microscope with a resolution of 5 nm. The carbon samples were deposited on a conductive carbon tape. X-ray diffraction (XRD) measurements were performed by a Bruker D-8 Advance diffractometer with Cu Kα source (λ = 1.54184 Å). Attenuated total reflection Fourier-transformed IR (ATR-FTIR) measurements were done by a Thermoscientific Nivolet iS10 IR spectrometer equipped by an ATR Smart Orbit setup. Surface area determination by Brunauer-Emmett-Teller theory (BET) measurements were done using an ASAP 2420 Micrometric analyzer measuring N2 physisorption isotherm at 77 K after degassing the samples at 150 °C for 12 h. Raman spectra were recorded using a LabRAM HORIBA ARAMIS spectrometer with a CDD detector and laser line from 532 nm/100 mW (YAG) Laser Quantum MPC600 PSU. X-ray photoelectrons spectroscopy (XPS) measurements were done using a Multilab 2000 Thermoelectron spectrometer with Al Kα source (λ = 1486.6 eV).
For 2-point conductivity measurements, a controlled amount of power was placed in a vertical narrow calibrated glass tube (inner diameter d = 0.61 cm). The lower end of the tube was blocked by Cu foil. The powder was blocked in the tube from above by another glass rod with Cu contact at the end (d ≈ 0.61 cm). Thus, the cross-section of the contact was A = ¼ πd2 = 0.29 cm2. No extra pressure was applied on the power except the weight of the glass rod (8.1 g). The volume of the powder V between 2 contacts was precisely measured. Conductivity of the powder was measured by Ohm’s law by passing a constant current and measuring voltage between 2 Cu contacts. The dependence of conductivity on frequency was measured by measuring impedance between 2 contacts by applying 7 mV voltage modulation with frequencies f from 106 to 10−1 Hz.

2.3. Electrochemical Measurements

2.3.1. Preparation of Electrodes

Ink Preparation

Inks were prepared by adding a desired amount of active material in a glass vial and the required volume of MilliQ water (resistivity of 18.2 MΩ·cm at 25 °C, Total of organic compound (TOC) ≤ 1 ppb) to obtain a 2 g/L concentrated ink. All the inks were prepared by usually weighting 10.0 mg of activated carbon powder in the vial and adding 5000 µL of MilliQ water with a 0.5–5.0 mL micropipette. The ink was then shaken and sonicated in an ultrasonication bath for 20 min.

Ink Deposition on Glassy Carbon Rod

The active material was deposited by drop casting onto the surface of a glassy carbon rod electrode of 6 mm radius. The total deposited volume of ink was 75 µL divided by 5 deposition steps of 15 µL, in which the electrode was dried for 10 min in an oven programmed at 80 °C between each step. The loading of active material was approximated to 0.75 mg/cm2. A final deposition of 15 µL Nafion 0.5 wt. % in a mixture of lower aliphatic alcohols and water was added and dried to act as a binder.

2.3.2. Electrochemical Measurements

A 3-electrode cell inside a Faraday cage was used for the electrochemical tests. A 100 mL 1M H2SO4 electrolyte was poured in the cell, followed by the addition of a platinum wire with a coil end counter electrode in the compartment separated by a fritted and a mercury/mercurous sulfate electrode (MSE) in saturated K2SO4 in the compartment separated by Luggin capillary. The solution in the cell was then purged for at least 30 min under N2 gas. The glassy carbon rod electrode with active material—the working electrode—was placed in a holder and then placed inside the electrochemical cell in order to only have contact with the surface of the electrode. The N2 gas was flushing above the electrolyte to keep a controlled atmosphere without O2. The electrodes were connected to a SP-300 Potentiostat from BioLogic (Grenoble, France).

3. Results

3.1. Synthesis of AC-N Samples

Figure 1 summarizes the different synthesis steps, i.e., precursors nature and temperature, for the preparation of AC-N samples. The synthesis was carried out through a two-step process: polycondensation at 160 °C in air for 4 h, and thermochemical activation by KOH at various temperatures under Ar for 1 h. The samples synthesized by this process are denoted as AC-N-xxx, where xxx is the temperature of the activation step. For comparison, two other samples were synthesized, differentiating from AC-N samples only by the composition of the precursors. Namely, the AC-800 sample was synthesized from pure sucrose, and the AC-C-800 sample was synthesized from sucrose and citric acid with a 1:1 molar mixture. Both these samples were activated by KOH at 800 °C under inert atmosphere.
Polycondensation of precursors results in foam-like dark solid intermediate product. The ATR-FTIR spectra of solid intermediates prepared are shown in Figure 2. The proposed compositions of polycondensation intermediates are given in Figure 3.
The thermal transformation of sucrose close to its melting temperature (186 °C) results in its partial decomposition with the formation of glucose and fructose, and its polycondensation with formation of a mixture of oligo- and polysaccharides [28]. Indeed, the IR spectra of the product of sucrose polycondensation (first step of the synthesis), Figure 2, shows a strong νOH band centered at around 3340 cm−1, a doubled peak of νC-H at around 2930 cm−1, and a set of peaks in the 1200–1400 cm−1 range, which are attributed to νC-O-C stretching. The set of peaks in the range 1600–1780 cm−1 can be attributed to νC=O and νC=C stretching and associated to the formation of 5-hydroxymethylfurfural (5-HMF), one of the byproducts of sucrose polycondensation [29].
The addition of citric acid to sucrose during its thermal treatment has a strong influence on the process of sucrose decomposition and polycondensation. It has been proposed [30,31] that citric acid acts as a catalyst of sucrose hydrolysis at temperatures close to 100 °C, accelerating the formation of glucose and fructose, as well as 5-HMF, which, in turn, triggers the formation of oligosaccharides already at 100 °C. Further increase of the synthesis temperature to 170 °C results in an esterification reaction between the alcohol group of saccharides and the carboxylic group of citric acid. This process results in cross-linking of polysaccharides chains and the formation of a strong adhesive solid [30,31]. In the IR spectrum (Figure 2), one can observe a strong band at 1720 cm−1, which can be attributed to νC=O stretching in ester and, perhaps, carbonyl fragments. A strong band that appears at 1165 cm−1 is attributed to νRC-O-CR stretching in aliphatic ether fragments, while peaks related to the presence of alcohol groups (νOH at 3400 cm−1 and νC-OH at 1020 cm−1) are significantly weaker than in the case of the product of pure sucrose polycondensation.
The IR spectra of polycondensation intermediate produced from sucrose and ammonium citrate mixture show several differences compared to one from sucrose and citric acid intermediate. The peaks related to alcohol groups (νOH at 3400 cm−1 and νC-OH at 1020 cm−1) are much weaker in the case of sucrose—ammonium citrate mixture. Also, in this case, new IR bands are observed: a strong and broad band centered at 3210 cm−1, and a peak at 1350 cm−1, as well as a broad shoulder at 1580 cm−1. These bands can be attributed to νN-H and νC-N, and δH-N-H in primary amines/amides, respectively, indicating that ammonium is at least partially transformed to amine/amides (primary or secondary) in polycondensation products (Figure 3C). We note that the vibrations νN-H and δH-N-H in ammonium citrate are also detected close to the peaks observed in the polycondensation product, and, thus, the presence of ammonium in the product cannot be excluded.
After thorough grounding of the polycondensation product, it was mixed with KOH solution and then dried at 160 °C in air. This procedure is expected to eliminate any remaining ammonium salt within the polycondensation product via the formation of gaseous ammoniac. The dried product was again grounded and then pyrolyzed at 700 °C, 800 °C, or 900 °C in argon for thermochemical activation of the carbon.
The structure and composition of these prepared samples was characterized as described in the next section. The synthesis conditions and some characteristics of the studied samples are summarized in Table 1.

3.2. Physicochemical Characterization of AC Samples

Typical SEM images of the AC-N samples are given in Figure S1. The SEM images demonstrate irregular porous structure typical for AC materials. No clear difference in the structure of samples activated at different temperatures was detected. Also, we did not detect any visible difference in terms of structures between AC-N and AC-C-800 samples, prepared from sucrose and citric acid mixtures. The SEM resolution allows only evidencing the presence of macropores. For more detailed understanding of the porosity of the sample, a BET study has been done (see Figure 4).
The increase in the activation temperature results in an increase in SSA of the as-synthesized AC-N samples. High SSA values and diameter distribution demonstrates the formation of a large contribution of micropores with d ≤ 2 nm, that is confirmed by the Type I of observed isotherm. In the case of AC-N-800, we also observed the formation of a small amount of mesopores with d ≈ 10–20 nm, while for the AC-N-900 sample, the distribution of the sizes of mesopores is much broader. However, the contribution of mesopores is very low, as attested by the absence of hysteresis of the isotherms.
In general, these results are in agreement with studies of the porous structure of bio-char-derived activated carbon on activation temperature [19,32]: an increase in activation temperature at least up to 800 °C results in a higher BET surface area of the sample due to the opening of micropores formed at lower temperature. An increase of activation temperature above 700 °C results in the general widening of pores: the relative contribution of ultramicropores (diameter d ≈ 0.3–0.4 nm) decreases with higher temperature and longer activation time, while the relative contribution of micropores with d ≈ 0.8–2.0 nm increases [32]. The BET surface area of the AC-N-800 sample is significantly higher than that of AC-C-800. It shows that thermal decomposition of the cross-linked product of polycondensation of sucrose and ammonium citrate addition results in a more porous structure than in the case of sucrose and citric acid, demonstrating the effect of the presence of N-containing groups in polycondensation intermediate.
Figure 5 shows N1s XPS spectra of AC-N samples after KOH activation. Deconvolution of N1s XPS spectra of AC-N samples demonstrates that N-heteroatoms are incorporated to the carbon structure in various forms: pyrrolic N, pyridinic, amines/amides, quaternary N (Q-N), and NOx. Due to the variety of the types of N-heteroatoms, there is certain incertitude in peaks deconvolution, making difficult the precise analysis of the ratio of different types. However, certain qualitative conclusions can be drawn, as described below.
N-pyrrolic is the predominant type of N-heteroatom, and its ratio slightly decreases with an increase in activation temperature. Also, the ratio of remaining amine/amide-N slightly decreases, while the ratio of more thermally stable N-pyridinic and, perhaps Q-N, increases. In general, as the activation temperature increases, the concentration of heteroatoms (N and O) decreases. The pyrolysis of polycondensation intermediate results in a decomposition of N- and O-containing functional groups, which starts at ca. 600 °C [33]. The decomposition results in the formation of gaseous products, such as CO2 and NH3 and/or NOx. The formation of gaseous products is one of the processes responsible for the development of the open porous structure of the final carbon product. In particular, the formation of ammonia via decomposition of amine/amide groups of polycondensation intermediate results in higher BET surface area due to chemical etching of carbon by gaseous ammonia, which above 700 °C, reacts with carboxylic groups and the carbon skeleton, forming more thermally stable pyrrolic, pyridinic, and Q-nitrogen groups [34,35]. Indeed, XPS results show that the AC-N-800 sample is more reduced (contains less oxygen) compared to AC-800 and AC-C-800 prepared without using N-containing precursors. The certain ratio of amine/amide N-heteroatoms remains, even at 900 °C, even though this ratio, as expected, decreases with temperature due to transformation of amines and amides to more stable forms of N-heteroatoms.
The decomposition of N- and O-containing functional groups results in the formation of unsaturated C-C bonds, i.e., an increase in the relative population of sp2-carbon, and in graphitization of the remaining carbon structure. The Raman spectra of AC-N and AC-C-800 and AC-800 samples show D- and G-band at 1344 and 1593 cm−1, respectively (Figure S2), which is usual for disordered graphitic structures. The full width at half maximum (FWHM) values of G-band for AC-N-700, AC-N-800, and AC-N-900 samples are accounted for 117, 103, and 81 cm−1, demonstrating a systematic decrease in the FWHM with an increase in activation temperature. It has been shown that G-band FWHM is inversely proportional to the average size of ordered sp2-domain La, [36,37]. Using the empirical correlation equation for pyrolyzed nanographites [37], the La of AC-N-700, AC-N-800, and AC-N-900 can be estimated as 4.2 nm, 4.9 nm, and 6.4 nm, respectively, i.e., 10–20 graphitic layers. Thus, one can conclude that the La of AC-N samples is slightly increasing with an increase in activation temperature. The values of FWHM of AC-800, AC-C-800, and AC-N-800 samples are close, indicating that the activation temperature is a determining factor for the size of sp2-domains.
Two-point conductivity of AC-N samples increases approximately by two orders of magnitude with every 100 °C increase of activation temperature. The resistivity of the AC-N-700 sample ρ ≈ 19.5 kOhm.cm is close to the typical one for activated carbons. The resistivity of samples AC-N-800 and AC-N-900 are 194 and 9.2 Ohm.cm, respectively. For all three samples, the value of resistivity was found to be frequency-independent in the range 10−2–106 Hz. It suggests that for the AC-N-700 sample, the electron transport via direct continuous pathway is the predominant conductivity mechanism, while the contributions of other mechanisms (electrons hopping and tunneling between carbon clusters, interfacial polarization) are negligible [33]. The relatively high resistivity of the AC-N-700 sample can be explained by the small concentration and narrow size of continuous electron pathways, which is in agreement with the above assumption of smaller La of the AC-N-700 sample. Considering that the estimated size of sp2 domains in the AC-N-800 sample is only slightly larger than that of AC-N-700, the strong increase of conductivity with activation temperature could be related to the strong increase in the concentration of ordered sp2 domains.
The conductivity of AC-800, AC-C-800, and AC-N-800 samples is in good correlation with the reduction state of the carbon, as characterized by x(O) at.%. One may argue that the decomposition of O-containing fragments of polycondensation intermediates and the formation of C-C unsaturated bonds is the main mechanism of appearance of sp2-domains, which are, in turn, responsible for electronic conductivity. The transformation of N-amine/amide and N-pyrollic to N-pyridinic and Q-N may also be expected to increase conductivity, as in the last two forms, N-heteroatoms are included to the π-electrons conjugated network. Also, the thermal decomposition of an intermediate with N-heteroatoms results in a more reduced carbon state, and, as a result, a higher conductivity.

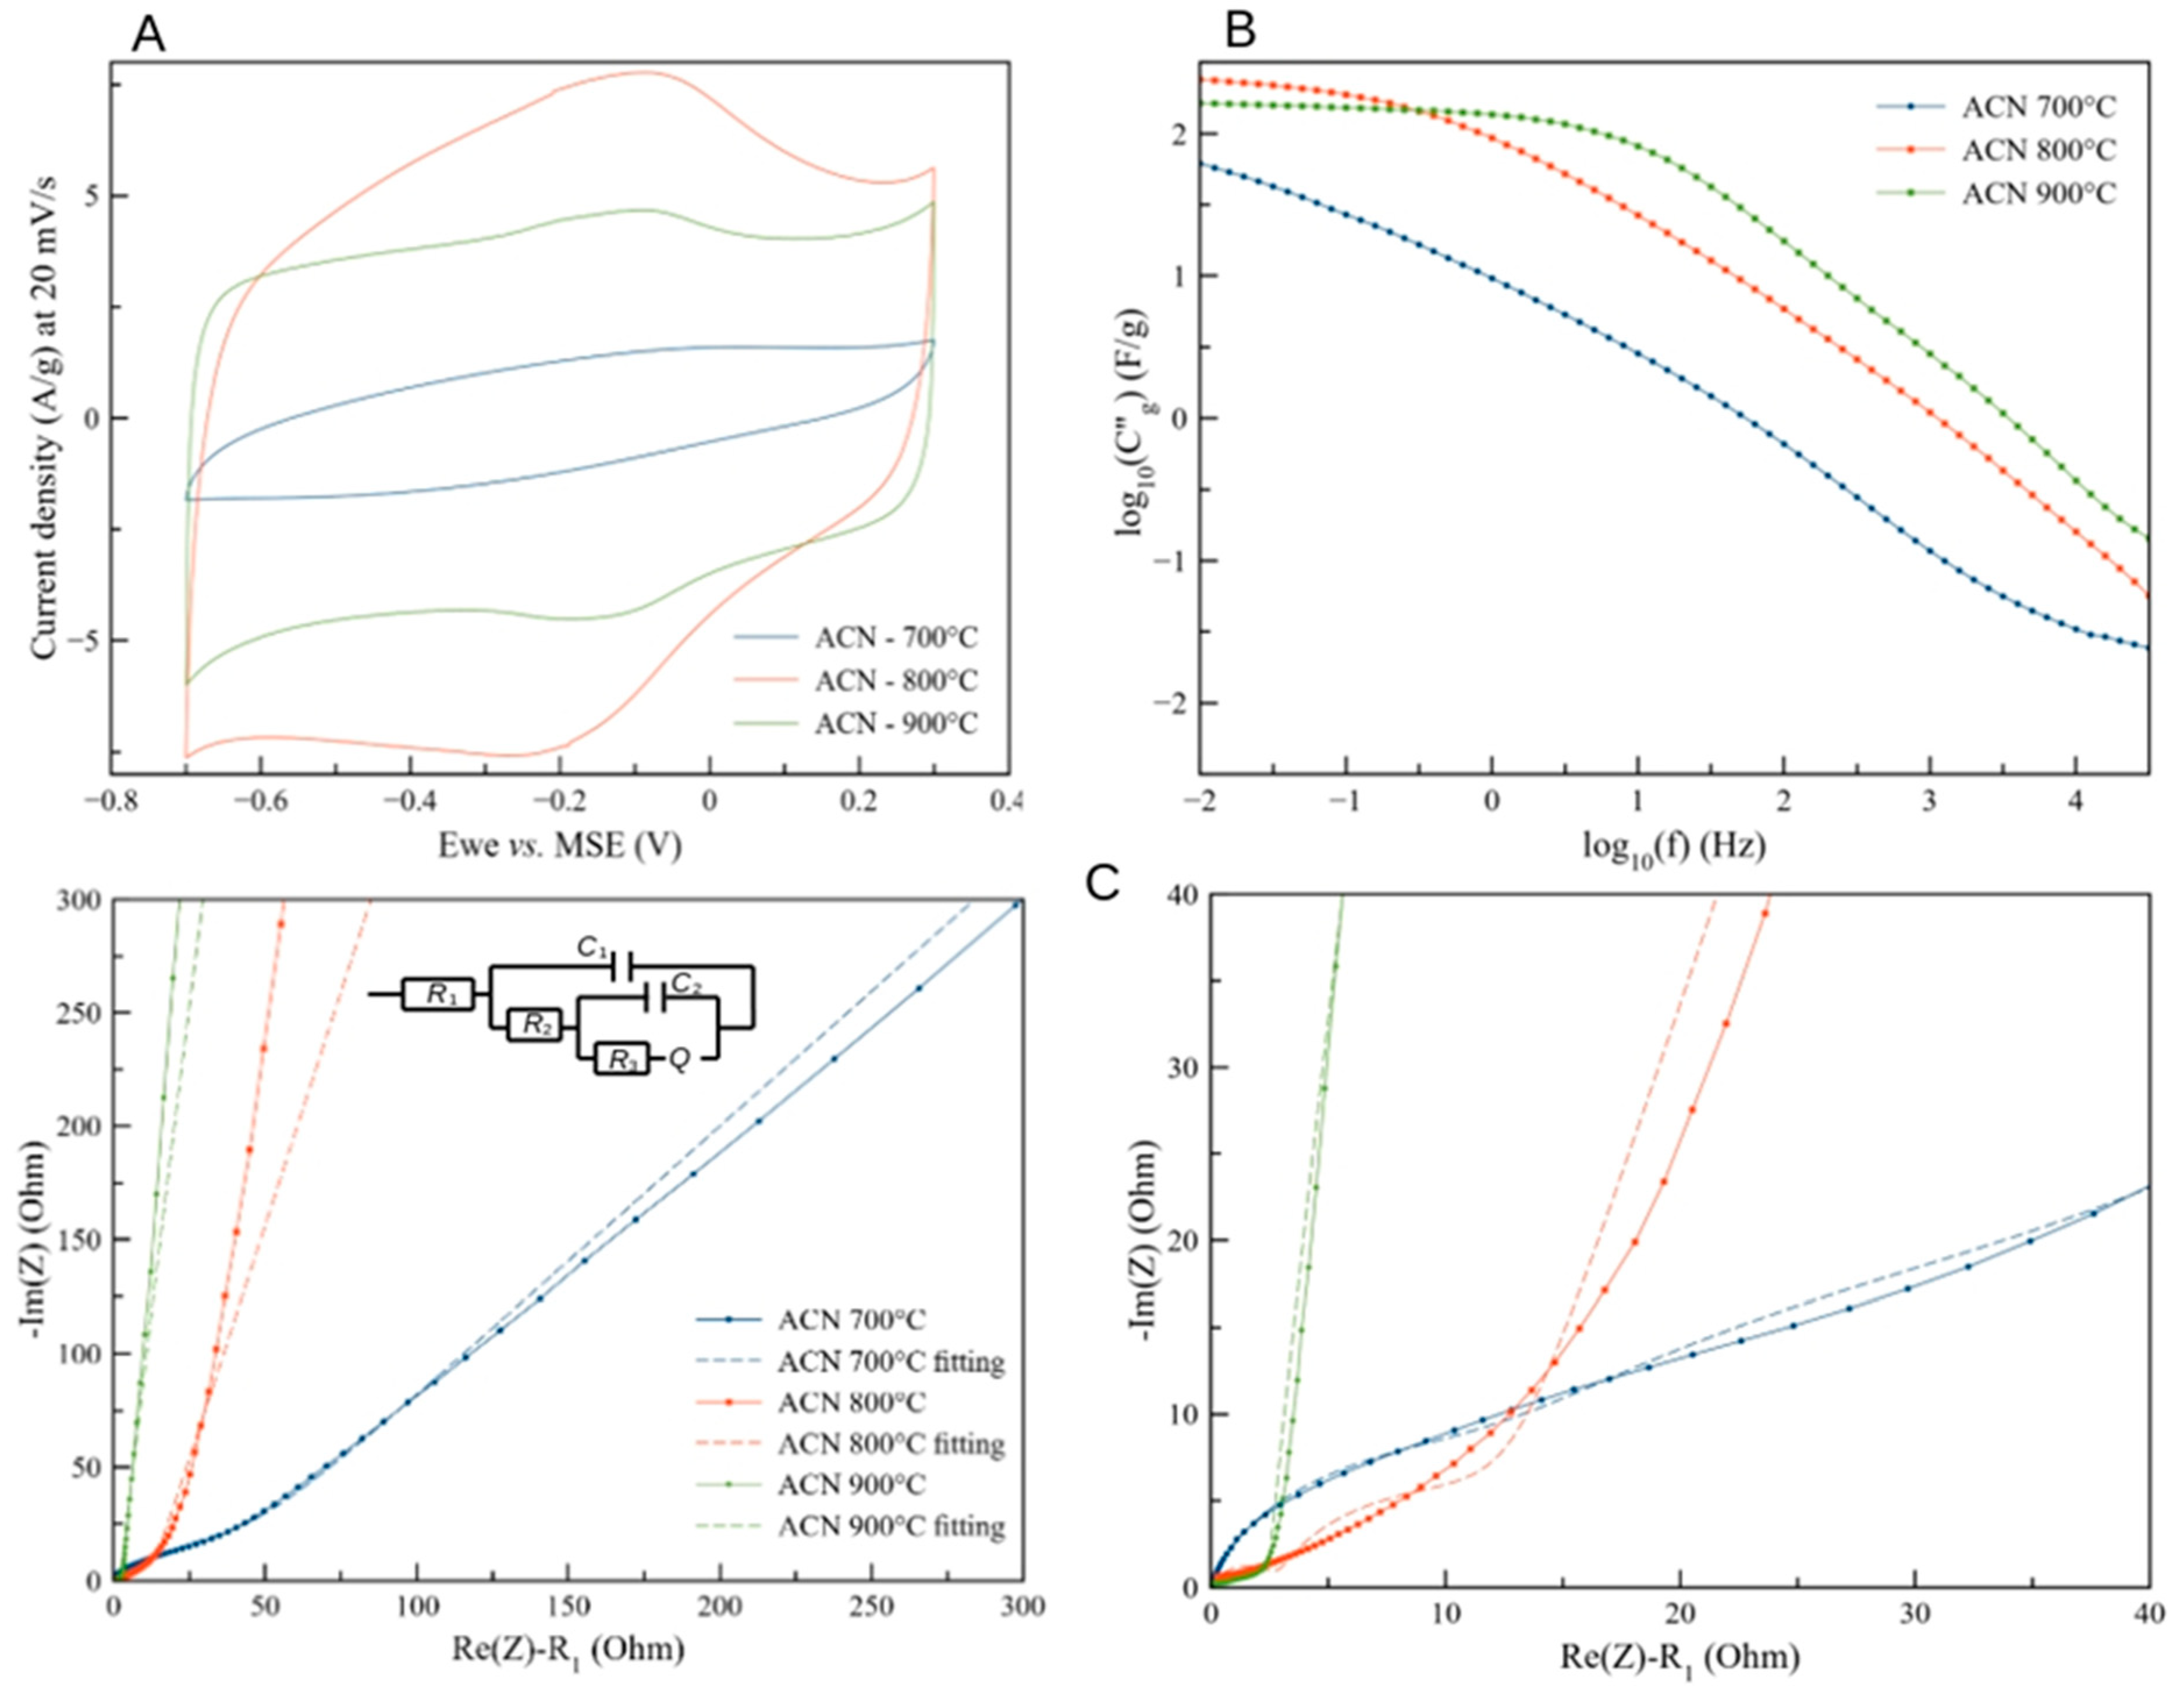
3.3. Electrochemical Properties of AC Samples

Figure 6A shows the stable CV curves of AC-N samples measured in 1 M H2SO4 at 20 mV/s. The CV curves of AC-N-800 and AC-N-900 samples contain a pair of broad reversible redox peaks centered around 0.70–0.80 V RHE, conventionally attributed to the reversible surface redox transition of O-containing groups (quinone-hydroquinone type [10]), and/or N-containing groups (for example N-pyrrolic) (Figure 7). The integral mass specific capacitance calculated from the CV curves measured at 20 mV/s is 55 F/g, 284 F/g, and 197 F/g for AC-N-700, AC-N-800, and AC-N-900 samples, respectively.
It is most surprising to observe that the capacitance of the AC-N-900 sample is ca. 30% smaller compared to the AC-N-800 sample, despite the nearly twice as high SSA of the former. The SSA of the carbon samples can be used to estimate the corresponding specific surface capacitance Cs, which for the studied samples was 16, 41, and 15 μF/cm2 for AC-N-700, AC-N-800, and AC-N-900. The values of Cs for AC-N-700 and AC-N-900 are just slightly higher than Cs ≈ 10–12 μF/cm2, expected for 3D carbon electrodes with high SSA [11], while the value of Cs of the AC-N-800 sample is a few times higher; one would expect the value Cg ≈ 95 F/g for pure double-layer capacitance for carbon electrode with SSA = 776 m2/g and with a corresponding Cs ≈ 10–12 μF/cm2.
The difference in the electrochemical properties of AC-N samples can be correlated to their different surface and bulk composition. It has been previously reported that the capacitance of various carbon electrode materials can be significantly improved by their surface functionalization [38], resulting in better wettability of pores. In the case of N-doped carbons, the additional contribution to interfacial capacitance can be attributed to pseudocapacitance related to the redox transitions of N-heteroatoms. As mentioned earlier, a nearly linear increase of Cg with x(N)%at. was reported for PAN-derived carbons [26], and attributed to a pseudocapacitance reaction involving N-pyridinic. Outstandingly high mass specific capacitance Cg > 800 F/g (in H2SO4 at 1 A/g) was reported for N-doped mesoporous carbon, and explained by redox reactions involving pyrrolic and pyridinic N-heteroatoms [27]. These redox reactions result in the exchange of 1 H+ between carbon electrode and electrolyte, and, thus, contribute the charge of 1e- per one N-heteroatom (Figure 8B). The additional mass specific capacitance contribution related to the pseudocapacitance reaction involving N-heteroatoms CN-PS (in F/g) for 1 V range can be estimated as:
C N PS = F   · x N M C = x N · 8041
where xN is an atomic ratio of N-heteroatoms active in the pseudocapacitance reaction.
In order to evaluate the nature of active N-heteroatoms, it is useful to compare the oxidation potentials of various N-containing organic aromatic molecules; see Table 2. The comparison of oxidation potential of aniline, pyrrole, and pyridine shows that N-amine and N-pyrrolic heteroatoms can be oxidized at lower potentials and thus, are more likely to contribute to pseudocapacitance than N-pyridinic.
Considering that for the AC-N-800 sample, the total ratio of N-heteroatoms is 3.3 at.% and ca. 71% of these atoms are N-amine or N-pyrrolic, xN = 2.34%, and CN-PS = 188 F/g for this sample, which can well account for the difference between Cg (284 F/g) and the expected double layer capacitance (95 F/g). On the other hand, AC-N-900 contains 1.5 at.% of N-heteroatoms, only 58% of which are N-amine or N-pyrrolic, and, thus, xN = 0.87%, and CN-PS = 70 F/g are significantly lower compared to AC-N-800.
However, one still has to explain the low capacitance of the AC-N-700 sample, which has more than double total x(N) compared to AC-N-800, 74% of which are N-amine and N-pyrrolic, and yet a lower Cs value. According the measurements of conductivity, the AC-N-700 sample has significantly lower concentration of ordered graphitic domains. We may speculate that only N-heteroatoms incorporated to graphitic domains are capable to contribute to pseudocapacitance phenomena. N-heteroatoms of disordered carbon structure are arguably inactive too, due to the lack of the possibility of stabilizing the extra charge added by redox transition. Indeed, comparison of oxidation potentials of aniline, 1-naphtylamine, and 1-aminoantracene (Table 2) clearly shows that the addition of an aromatic ring to the conjugated π-electron network facilitates the oxidation of amine. The same trend can be seen by comparison of oxidation potentials of pyrrole and 1H-indole, and pyridine and quinoline. Thus, it is reasonable to suggest that N-heteroatoms included into the extended conjugated π-electron network (conductive graphitic domain) are more active in the pseudocapacitance phenomenon than isolated N-heteroatoms.
In summary, we suggest that the high pseudocapacitance of carbon requires simultaneous high content of both graphitic domains and N-pyrrolic heteroatoms, like N-doped mesoporous carbons in Ref. [27], or, in a lesser extent, sample AC-N-800 in the present study. For the preparation of N-doped AC materials, 800 °C appears to be an optimal activation temperature, as in the products of activation at lower temperature, the majority of N-heteratoms are not linked to the conductive graphitic domains, and at higher temperature, N-heteroatoms are gradually transformed to less active N-pyridinic and Q-N heteroatoms.
Impedance spectroscopy is a valuable tool to have a deeper insight on the dependence of interfacial capacitance on the rate of charging of the interface. The Nyquist plots of AC-N samples are shown in Figure 6C. The observed curves can be qualitatively fitted by an equivalent circuit depicted in the inset. It must be noted that this equivalent circuit serves only for qualitative explanation of the impedance behavior and for the comparison between similar carbon materials. The impedance of the complex porous system is properly described by models based on the transmission line concept [41].
This circuit in Figure 6C can be interpreted as follows: R1 is a resistance of the electrolyte, C1 is the interfacial capacitance of the outer surface of carbon deposit, C2 is the interfacial capacitance of the surface of large open pores easily accessible for the electrolyte, R2 is the resistance of the electrolyte inside of these pores, R3-Q is an impedance of smaller pores, which are the branches of the bigger open pores. Q is a constant phase element (CPE) with a as the CPE constant. In the case of the impedance of a pore, the value of a depends on the relative values of the length of small pores lp and AC penetration depth λ, namely a = 0.5 for lp > λ, and a ≈ 1 for lp < λ. The value of λ can be estimated by Equation (2) [42]:
λ = 1 2 σ d p 2 ω   C s
where σ is the conductivity of the electrolyte, dp is the pore diameter, ω = 2πf is the angular frequency, and Cs is the surface specific capacitance. According to Equation (3), for thinner pores, the modulation penetration depth is shorter, and the pore-specific impedance (i.e., a = 0.5) is observed already at lower modulation frequencies.
The parameters of the fitting of experimental Nyquist diagrams are given in Table S1. The EIS diagrams of AC-N-900 can be well fitted by the circuit depicted in Figure 7 with a = 0.9. It demonstrates the open porous structure of the sample with wide and short pores, easily accessible for electrolytes for a whole range of utilized frequencies. Also, the value of capacitive component of total impedance C”:
C = 1 I m ( Z ) · ω
where Z is a total impedance, which remains nearly constant up to the intermediate range of frequencies f ≈ 10 Hz (Figure 6B). At higher frequencies, the decrease with the slope −1 of log C”—log f is observed, which is an indication of the influence of resistance of the electrolyte in pores.
In contrast to AC-N-900, the EIS diagrams of AC-N-700 can be fitted only with a = 0.5, demonstrating that the narrow pores are longer, and lp > λ even for low frequency (0.1 Hz). In the case of AC-N-800, the best fit was obtained with a = 0.90; However, it appears that the fit is not correct at a low frequencies range, as AC penetration depth becomes deeper, and narrower and longer pores are engaged to the charge storage. The fit for the AC-N-800 sample is only possible assuming the value of a varying with applied frequency, which is an indication of the non-uniform size of the pores. The C” component decrease observed already at low frequencies with the slope ca. −0.75 indicates the limitation related to both resistance of the electrolyte, and the AC penetration depth dependence of frequency.
In summary, EIS analysis confirms the assumption of the fact that the diameter of the pores is increasing as activation temperature increases (from AC-N-700 to AC-N-900), and thus, the pores are getting more open, facilitating the accessibility of the electrolyte (lower R2 and R3), and penetration of the AC-signal.
Figure 8A shows the dependence of mass specific capacitance of AC-N samples on the number of charge/discharge cycles applied at 2 A/g. All samples demonstrated excellent stability within the 1000 cycles. It is important to note that the capacitance of the AC-N-900 sample significantly increased in the first hundred charging cycles. This increase in capacitance can be attributed to improving the accessibility of inner pore volumes of AC-N-900 by potential cycling. Indeed, the surface AC-N-900 sample is most reduced, compared to other AC-N samples, and, arguably, less hydrophilic. Also, the surface of ordered graphitic domains, of which AC-N-900 has the highest content, is hydrophobic. Thus, originally the volume of micropores of AC-N-900 can be less accessible compared to other AC-N samples, despite a larger average diameter, suggested earlier. However, periodic oxidative polarization of the carbon electrode results in the partial oxidation of the carbon surface, its improved hydrophilicity, and better accessibility of pores. We note that the impedance measurements discussed above were performed after the stability tests completed by 1000 charge/discharge cycles.
Figure 8B shows the dependence of specific capacitance on the charging rate. These measurements were also performed after 1000 charging cycles. As expected, all samples demonstrated a decrease in specific capacitance, as the charging rate increases from 0.5 A/g to 20 A/g. However, the loss of capacitance systematically depends on the activation temperature: it is 93%, 32%, and 19.5% for AC-N-700, AC-N-800, and AC-N-900, respectively. This observation is in agreement with the assumption of wider pores of the AC-N-900 sample, and their easier accessibility for electrolyte species, compared to AC-N-800 and AC-N-700 samples.

4. Discussion

The addition of ammonium citrate to sucrose precursor for the synthesis of activated carbon results in a significant change in the structure and properties of the final product. The cross-linked polycondensation intermediate formed from ammonium citrate and sucrose (Figure 2C) contains amide and imide groups, which are decomposed above 600 °C [43] nitrogen groups and the formation of more stable aromatic N-containing fragments of the carbon matrix. These phenomena result in a significantly higher surface area of AC-N-800 synthesized with ammonium citrate compared to AC-C-800, synthesized with citric acid additive. Moreover, AC-N-800 has lower oxygen content x(O), and higher electrical conductivity. An increase in activation temperature results in a decrease in the remaining content of N-heteroatoms.
All synthesized AC samples are electrically conductive, demonstrating constant electrical resistance in the frequency range 10−1–106 Hz. This is an indication that, already after activation at 700 °C, the continuous network of conductive sp2-carbon domains is developed. An increase in the activation temperature from 700 to 800 and to 900 °C results in ca. 100-times increase in the conductivity of carbon samples. The FWHM of Raman spectra G-band of these samples indicates a slight increase in the average size of ordered graphitic domains; however, the main factor responsible for the strong increase in conductivity is assumed to be a strong increase in the concentration of ordered graphitic domains with activation temperature. It is important to note that the estimated size of these domains remains relatively small, so that no graphitic domains are detected by XRD, and thus, even after activation at 900 °C, the final structure can be characterized as a disordered graphitic structure.
The samples prepared from the sucrose and ammonium citrate mixture after activation at 800 and 900 °C (AC-N-800 and AC-N-900) demonstrate excellent properties as EDLC electrode materials. In particular, the AC-N-800 sample demonstrates very high mass- and surface-specific capacitances, Cg = 320 F/g and Cs = 41.4 μF/cm2, respectively, in 1M H2SO4 at 2A/g. Such an unusually high Cs value is arguably related to the combination of two factors: the presence of a relatively high surface concentration of N-pyrrolic heteroatoms, responsible for fast redox surface transitions (Figure 8), and the high concentration of ordered small graphitic domains, facilitating the redox reactions. The lower content of both graphitic domains (AC-N-700 sample) and N-pyrollic heteroatoms (AC-N-900 sample) resulted in lower specific capacitance.
It has to be mentioned that outstandingly high capacitance (≈ 600 F/g) in concentrated H2SO4 has been observed for commercial AC CH900-20 (Kuraray Co., Tokyo, Japan), with no N-heteroatoms and predominantly amorphous structure [44]. The observed capacitance was attributed to the intercalation of H+ to the extent of the formation of a stoichiometric C6H composition. However, this process was strongly limited by the kinetic of charge transfer and solid-state diffusion of H+, and high intercalation extent required several hours of charging.
In order to evaluate the contribution of mass transport-controlled processes into the charge capacitance, the CVs of AC-N-800 were measured with different potential sweep rates w from 1000 to 0.5 mV/s (Figure S3A,B). The dependence of CV currents on the sweep rate is close to linear, at least for rates not very high w < 200 mVs/(Figure S3C), demonstrating a negligible contribution of mass transport-controlled processes to the charge of CV curves at these conditions. At higher sweep rates, the dependence deviates from linear as the time of single sweep becomes comparable with the RC constant of the cell (ca. 0.5 s). Following the deconvolution method suggested earlier [27], the fast charging contribution to capacitance CDL was estimated by extrapolating C(w) vs. w−1/2 dependence to w→ ∞ (w−1/2 → 0); see Figure S3D:
C(w) = CDL + kw−1/2
Thus, by estimating that the capacitance related to fast charging is ca. 93% of the total capacitance measured at 20 mV/s, this confirms negligible contribution of any mass transport-controlled process to charge capacitance at these conditions. We can conclude that the kinetics of pseudocapacitance reaction involving H+ addition/elimination from the carbon network is strongly facilitated by the presence of N-heteroatoms.
An increase in the activation temperature from 800 to 900 °C results in the widening of the pores and better accessibility of the pores for electrolyte species, and lower pores resistance. The full accessibility of pores inner volume requires a few hundreds of potential cycling in order to improve the hydrophilicity of the carbon surface, which is too reduced and too hydrophobic after thermochemical activation at 900 °C. After the cycling, the easy accessibility of pores inner volume of AC-N-900 is indicated by the lower decrease of capacitance when the charging rate is increased from 0.5 A/g to 20 A/g, and by the results of the fitting of EIS spectra. For the AC-N-900 sample, the EIS diagram was qualitatively described by the model, assuming that all pores are available for charge storage even at high charging rates (high modulation frequencies f). On the other hand, the AC-N-700 sample demonstrated the strongest decrease in capacitance with an increase in charging rate, and the capacitance is limited by the depth of penetration of potential modulation, even at low charging rates (low frequencies). The AC-N-800 sample also shows a stronger dependence of capacitance on the charging rate. Nevertheless, this sample demonstrates the highest specific capacitance in the wide range of charging currents due to the simultaneously relatively high content of N-pyrrolitic heteroatoms and ordered graphitic domains.

5. Conclusions

We have demonstrated that the addition of ammonium citrate to sucrose has a strong influence on the structure and composition of resulting AC material, and on its electrochemical properties. The N-doped AC with electrochemical properties offering high performance as an EDLC electrode material has been synthesized. In particular, the AC-N-800 sample, prepared by activation at 800 °C, demonstrated mass specific capacitance of 320 F/g at 2 A/g in 1M H2SO4. We attributed the higher capacitance of the AC-N-800 sample to the higher content of N-heteroatoms, in particular N-pyrrolic and N-amine heteroatoms, which are arguably more active in the redox pseudocapacitive reaction than N-pyridinic and Q-N heteroatoms. The ratio of N-pyridinic and Q-N heteratoms increases with the activation temperature increase, resulting in lower capacitance of the AC-N-900 sample, despite its higher SSA compared to AC-N-800. On the other hand, the low capacitance of the AC-N-700 sample, which also contains a high ratio of N-pyrrolic and N-amine heteroatoms, shows that only N-heteroatoms included in the ordered graphitic domains are active in the pseudocapacitance phenomena. The latter can be explained by the facilitated stabilization of an extra charge by the conjugated π-electrons network of the graphitic domain.
The improvement of the performance of N-doped AC electrode materials, prepared by the described two-step thermal activation method, can arguably be achieved by further optimization of the synthesis conditions. In particular, the ratio between ammonium citrate and sucrose precursor is expected to have an influence on the atomic ratio of N-heteroatoms in the resulting AC material. The study of electrochemical properties of AC-N materials in organic electrolytes is expected to demonstrate the influence of the hydrophilicity/hydrophobicity of the materials on their electrochemical properties. Finally, a detailed analysis of electrochemical impedance of AC-N electrode materials with variable electrode loading will provide a better understanding of the influence of carbon porosity on its electrochemical performance. These studies are currently being performed as a follow-up of the present work.

Supplementary Materials

The following supporting information can be downloaded at: https://www.mdpi.com/article/10.3390/batteries9090436/s1, Figure S1: Typical SEM images of AC-N-700 (A), AC-N-800 (B) and AC-N-900 (C) samples; Table S1: Parameters of the fit of Nyquist diagrams by equivalent circuit in Figure 6; Figure S2: Raman spectra of AC-N samples (A) and AC-N-800, AC-C-800, and AC-800 samples (B); Figure S3: CV curves of AC-N-800 sample in 1M H2SO4 measured at different sweep rates (A,B); dependence of CV current at direct sweep at −0.15 V MSE on sweep rate (C); dependence of integrated mass specific capacitance on w−1/2.

Author Contributions

Conceptualization, C.P.-H. and S.N.P.; methodology H.B., L.T.P.; experimental work T.K. (vast majority of the work), D.B., L.T.P. and S.N.P.; data analysis, T.K., D.B. and S.N.P. project administration and funding C.P.-H., S.N.P. and D.B.; manuscript preparation T.K., S.N.P. and C.P.-H. All authors have read and agreed to the published version of the manuscript.

Funding

This work is funded by the INFINE ANR (France) project ANR-21-CE08-0025-01.

Data Availability Statement

The raw experimental data for the results discussed in the present paper can be provided by the authors of the manuscript on demand.

Acknowledgments

The authors are grateful to the staff of ICPEES for performing and assisting in the materials characterization: Sécou Sall helped with ATR-FTIR experiments, Fabrice Vigneron helped with BET measurements, Thierry Dintzer performed SEM imaging, Vasiliki Papaefthymiou performed XPS measurements and guided data analysis. Fréderic Antoni (ICube, Strasbourg) guided Raman experiments.

Conflicts of Interest

The authors declare no conflict of interest.

References

  1. Lin, Z.; Goikolea, E.; Balducci, A.; Naoi, K.; Taberna, P.; Salanne, M.; Yushin, G.; Simon, P. Materials for supercapacitors: When Li-ion battery power is not enough. Mater. Today 2018, 21, 419–436. [Google Scholar] [CrossRef]
  2. Libich, J.; Maca, J.; Vondrak, J.; Cech, O.; Sedlarikova, M. Supercapacitors: Properties and applications. J. Energy Storage 2018, 17, 224–227. [Google Scholar] [CrossRef]
  3. Pan, Z.; Yu, S.; Wang, L.; Li, C.; Meng, F.; Wang, N.; Zhou, S.; Xiong, Y.; Wang, Z.; Wu, Y.; et al. Recent Advances in Porous Carbon Materials as Electrodes for Supercapacitors. Nanomaterials 2023, 13, 1744. [Google Scholar] [CrossRef]
  4. Zallouz, S.; Pronkin, S.; Le Meins, J.-M.; Pham-Huu, C.; Ghimbeau, C.M. New development in carbon-based electrodes and electrolytes for enhancement of supercapacitor performance and safety. In Renewable Energy Production and Distribution Solutions and Opportunities; Elsevier Academic Press: Amsterdam, The Netherlands, 2023; pp. 353–408. [Google Scholar]
  5. Borenstein, A.; Hanna, O.; Attias, R.; Luski, S.; Brousse, T.; Aurbach, D. Carbon-based composite materials for supercapacitor electrodes: A review. J. Mater. Chem. A 2017, 5, 12653–12672. [Google Scholar] [CrossRef]
  6. Simon, P.; Gogotsi, Y. Capacitive energy storage in nanostructured carbon-electrolyte systems. Acc. Chem. Res. 2013, 46, 1094. [Google Scholar] [CrossRef] [PubMed]
  7. Lv, S.; Ma, L.; Shen, X.; Tong, H. Recent design and control of carbon materials for supercapacitors. J. Mater. Sci. 2021, 56, 1919–1942. [Google Scholar] [CrossRef]
  8. Zahir, N.; Magri, P.; Luo, W.; Gaumet, J.J.; Pierrat, P. Recent Advances on Graphene Quantum Dots for Electrochemical Energy Storage Devices. Energy Environ. Mater. 2022, 5, 201–214. [Google Scholar] [CrossRef]
  9. Ke, Q.; Wang, J. Graphene-based Materials for Supercapacitor Electrodes—A Review. J. Mater. 2016, 2, 37–54. [Google Scholar] [CrossRef]
  10. Noked, M.; Soffer, A.; Aurbach, D.; Noked, M.; Soffer, A.; Aurbach, D. The electrochemistry of activated carbonaceous materials: Past, present, and future. J. Solid State Electrochem. 2011, 15, 1563–1578. [Google Scholar] [CrossRef]
  11. Ji, H.; Zhao, X.; Qiao, Z.; Jung, J.; Zhu, Y.; Lu, Y.; Zhang, L.L.; MacDonald, A.H.; Ruoff, R.S. Capacitance of carbon-based electrical double-layer capacitors. Nat. Commun. 2014, 5, 3317. [Google Scholar] [CrossRef]
  12. Ukanwa, K.S.; Patchigolla, K.; Sakrabani, R.; Anthony, E.; Mandavgane, S. A review of chemicals to produce activated carbon from agricultural waste biomass. Sustainability 2019, 11, 6204. [Google Scholar] [CrossRef]
  13. Köseoğlu, E.; Akmil-Başar, C. Preparation, structural evaluation and adsorptive properties of activated carbon from agricultural waste biomass. Adv. Powder Technol. 2015, 26, 811–818. [Google Scholar] [CrossRef]
  14. Abioye, A.M.; Ani, F.N. Recent development in the production of activated carbon electrodes from agricultural waste biomass for supercapacitors: A review. Renew. Sustain. Energy Rev. 2015, 52, 1282–1293. [Google Scholar] [CrossRef]
  15. Wei, L.; Yushin, G. Nanostructured activated carbons from natural precursors for electrical double layer capacitors. Nano Energy 2012, 1, 552–565. [Google Scholar] [CrossRef]
  16. Jain, A.; Balasubramanian, R.; Srinivasan, M.P. Hydrothermal conversion of biomass waste to activated carbon with high porosity: A review. Chem. Eng. J. 2016, 283, 789–805. [Google Scholar] [CrossRef]
  17. Lu, H.; Zhao, X.S. Biomass-derived carbon electrode materials for supercapacitors. Sustain. Energy Fuels 2017, 1, 1265–1281. [Google Scholar] [CrossRef]
  18. Nunes, M.; Rocha, I.M.; Fernandes, D.M.; Mestre, A.S.; Moura, C.N.; Carvalho, A.P.; Pereira, M.F.R.; Freire, C. Sucrose-derived activated carbons: Electron transfer properties and application as oxygen reduction electrocatalysts. RSC Adv. 2015, 5, 102919–102931. [Google Scholar] [CrossRef]
  19. Evans, M.J.B.; Halliop, E.; MacDonald, J.A.F. The production of chemically-activated carbon. Carbon 1999, 37, 269–274. [Google Scholar] [CrossRef]
  20. Susanti, R.F.; Arie, A.A.; Kristianto, H.; Erico, M.; Kevin, G.; Devianto, H. Activated carbon from citric acid catalyzed hydrothermal carbonization and chemical activation of salacca peel as potential electrode for lithium ion capacitor’s cathode. Ionics 2019, 25, 3915–3925. [Google Scholar] [CrossRef]
  21. Lei, Q.; Kannan, S.; Raghavan, V. Uncatalyzed and acid-aided microwave hydrothermal carbonization of orange peel waste. Waste Manag. 2021, 126, 106–118. [Google Scholar] [CrossRef]
  22. Chen, F.; Zhang, Y.; Zheng, M.; Xiao, Y.; Hu, H.; Liang, Y.; Liu, Y.; Dong, H. Preparation of High-Performance Porous Carbon Materials by Citric Acid-Assisted Hydrothermal Carbonization of Bamboo and Their Application in Electrode Materials. Energy Fuels 2022, 36, 9303–9312. [Google Scholar] [CrossRef]
  23. Del Menezzi, C.; Amirou, S.; Pizzi, A.; Xi, X.; Delmotte, L. Reactions with Wood Carbohydrates and Lignin of Citric Acid as a Bond Promoter of Wood Veneer Panels. Polymers 2018, 10, 833. [Google Scholar] [CrossRef]
  24. Inagaki, M.; Toyoda, M.; Soneda, Y.; Morishita, T. Nitrogen-doped carbon materials. Carbon 2018, 132, 104–140. [Google Scholar] [CrossRef]
  25. Frackowiak, E.; Lota, G.; Machnikowski, J.; Vix-Guterl, C.; Béguin, F. Optimisation of supercapacitors using carbons with controlled nanotexture and nitrogen content. Electrochim. Acta 2006, 51, 2209–2214. [Google Scholar] [CrossRef]
  26. Béguin, F.; Presser, V.; Balducci, A.; Frackowiak, E. Carbons and electrolytes for advanced supercapacitors. Adv. Mater. 2014, 26, 2219–2251. [Google Scholar] [CrossRef]
  27. Lin, T.; Chen, I.-W.; Liu, F.; Yang, C.; Bi, H.; Xu, F.; Huang, F. Nitrogen-doped mesoporous carbon of extraordinary capacitance for electrochemical energy storage. Science. 2015, 350, 1508–1513. [Google Scholar] [CrossRef] [PubMed]
  28. Richards, G.; Shafizadeh, F. Mechanism of thermal degradation of sucrose. A preliminary study. Aust. J. Chem. 1978, 31, 1825. [Google Scholar] [CrossRef]
  29. Lee, J.W.; Thomas, L.C.; Jerrell, J.; Feng, H.; Cadwallader, K.R.; Schmidt, S.J. Investigation of Thermal Decomposition as the Kinetic Process That Causes the Loss of Crystalline Structure in Sucrose Using a Chemical Analysis Approach (Part II). J. Agric. Food Chem. 2011, 59, 702–712. [Google Scholar] [CrossRef]
  30. Sun, S.; Zhao, Z.; Umemura, K. Further Exploration of Sucrose-Citric Acid Adhesive: Synthesis and Application on Plywood. Polymers 2019, 11, 1875. [Google Scholar] [CrossRef]
  31. Wibowo, E.S.; Kusumah, S.S.; Subyakto; Umemura, K. Modification of novel bio-based adhesive made from citric acid and sucrose by ZnCl2. Int. J. Adhes. Adhes. 2021, 108, 102866. [Google Scholar] [CrossRef]
  32. Illingworth, J.M.; Rand, B.; Williams, P.T. Understanding the mechanism of two-step, pyrolysis-alkali chemical activation of fibrous biomass for the production of activated carbon fibre matting. Fuel Process. Technol. 2022, 235, 107348. [Google Scholar] [CrossRef]
  33. Bogeat, A.B. Understanding and Tuning the Electrical Conductivity of Activated Carbon: A State-of-the-Art Review. Crit. Rev. Solid State Mater. Sci. 2021, 46, 1–37. [Google Scholar] [CrossRef]
  34. Biniak, S.; Szymański, G.; Siedlewski, J.; Świątkowski, A. The characterization of activated carbons with oxygen and nitrogen surface groups. Carbon 1997, 35, 1799–1810. [Google Scholar] [CrossRef]
  35. Shafeeyan, M.S.; Daud, W.M.A.W.; Houshmand, A.; Shamiri, A. A review on surface modification of activated carbon for carbon dioxide adsorption. J. Anal. Appl. Pyrolysis 2010, 89, 143–151. [Google Scholar] [CrossRef]
  36. Ferrari, A.C.; Meyer, J.C.; Scardaci, V.; Casiraghi, C.; Lazzeri, M.; Mauri, F.; Piscanec, S.; Jiang, D.; Novoselov, K.S.; Roth, S.; et al. Raman spectrum of graphene and graphene layers. Phys. Rev. Lett. 2006, 97, 187401. [Google Scholar] [CrossRef]
  37. Maslova, O.A.; Ammar, M.R.; Guimbretière, G.; Rouzaud, J.-N.; Simon, P. Determination of crystallite size in polished graphitized carbon by Raman spectroscopy. Phys. Rev. B 2012, 86, 134205. [Google Scholar] [CrossRef]
  38. Fang, B.; Wei, Y.-Z.; Suzuki, K.; Kumagai, M. Surface modification of carbonaceous materials for EDLCs application. Electrochim. Acta 2005, 50, 3616–3621. [Google Scholar] [CrossRef]
  39. Weinberg, N.L.; Weinberg, H.R. Electrochemical oxidation of organic compounds. Chem. Rev. 1968, 68, 449–523. [Google Scholar] [CrossRef]
  40. Roth, H.G.; Romero, N.A.; Nicewicz, D.A. Experimental and Calculated Electrochemical Potentials of Common Organic Molecules for Applications to Single-Electron Redox Chemistry. Synlett 2016, 27, 714–723. [Google Scholar] [CrossRef]
  41. Pronkin, S.N.; Shokina, N.Y.; Pham-Huu, C. Redox transitions in pseudocapacitor materials: Critera and ruling factors. In Redox Chemistry—From Molecules to Energy Storage; Intech Open: London, UK, 2022; pp. 1–22. Available online: https://cdn.intechopen.com/pdfs/81487.pdf (accessed on 22 August 2023).
  42. Keiser, H.; Beccu, K.D.; Gutjahr, M.A. Abschätzung der porenstruktur poröser elektroden aus impedanzmessungen. Electrochim. Acta 1976, 21, 539–543. [Google Scholar] [CrossRef]
  43. Volfkovich, Y.M.; Bograchev, D.A.; Rychagov, A.Y.; Sosenkin, V.E.; Chaika, M.Y. Supercapacitors with carbon electrodes. Energy efficiency: Modeling and experimental verification. J. Solid State Electrochem. 2015, 19, 2771–2779. [Google Scholar] [CrossRef]
  44. Volfkovich, Y.M.; Bograchev, D.A.; Mikhalin, A.A.; Bagotsky, V.S. Supercapacitor carbon electrodes with high capacitance. J. Solid State Electrochem. 2014, 18, 1351–1363. [Google Scholar] [CrossRef]
Figure 1. The scheme of 2-step synthesis of AC-N samples.
Batteries 09 00436 g001
Figure 2. ATR-FTIR spectra of intermediate products prepared by polycondensation of precursors mixture at 160 °C: pure sucrose (black spectrum), sucrose + citric acid mixture (red spectrum), sucrose + ammonium citrate mixture (green spectrum).
Batteries 09 00436 g002
Figure 3. Proposed structure of intermediates formed by polycondensation of sucrose (A), sucrose-citric acid (B), and sucrose-ammonium citrate (C).
Batteries 09 00436 g003
Figure 4. BET isotherms (A) and pore diameter distribution (B) of AC-N samples.
Batteries 09 00436 g004
Figure 5. N1s−XPS spectra of AC−N samples (in red) with peak deconvolution (in corresponding colors). The results of deconvolution are given in the table insert.
Batteries 09 00436 g005
Figure 6. Electrochemical characterization of AC−N samples in 1M H2SO4. Stable CVs at 20 mV/s (A); frequency dependence of a capacitive component of total impedance C” (B); Nyquist plots of impedance (C) (right side graph is a zoom of the left side plots).
Batteries 09 00436 g006
Figure 7. Surface redox reactions responsible for surface fast pseudocapacitance phenomena in AC-N-800 and AC-N-900 samples.
Batteries 09 00436 g007
Figure 8. Evolution of specific capacitance with cycling at 2 A/g (A); dependence of specific capacitance on the rate of charge/discharge, measured in 1M H2SO4 (B).
Batteries 09 00436 g008
Table 1. Summary of the conditions of samples AC samples studied in the work, and some of their characteristics.
Sample NamePrecursorsActivation Temperature, °CSSA, m2/gx(O), x(N), at.%ρ,
kOhm.
cm
Cg, F/g (2 A/g,
1 M H2SO4)
AC-800Sucrose8001030.4/-0.613.2
AC-C-800Sucrose +
Citric acid
80013015.9/-0.3075
AC-N-700Sucrose + (NH4)3Cit60027111.8/7.319.544.2
AC-N-800Sucrose + (NH4)3Cit70077610.8/3.30.19320.9
AC-N-900Sucrose + (NH4)3Cit80013798.6/1.50.009208.4
Table 2. Selected N-containing aromatic organic molecules and the redox potential of their oxidation (in bold red), estimated as E1/2 of oxidation wave, V SCE [39,40].
Aniline1.14 V1-Naphtalamine0.88 V1-Aminoantharcene0.75 V
Batteries 09 00436 i001Batteries 09 00436 i002Batteries 09 00436 i003
Pyrrole1.24 V1H-Indole1.16 V
Batteries 09 00436 i004Batteries 09 00436 i005
Pyridine2.26 VQuinoline2.14 V
Batteries 09 00436 i006Batteries 09 00436 i007
Disclaimer/Publisher’s Note: The statements, opinions and data contained in all publications are solely those of the individual author(s) and contributor(s) and not of MDPI and/or the editor(s). MDPI and/or the editor(s) disclaim responsibility for any injury to people or property resulting from any ideas, methods, instructions or products referred to in the content.

