3.2. Analysis of Synthesized Material
Figure 3 shows an X-ray diffractogram of the synthesized cathode material of the NCM111 obtained based on the extracted cobalt, and for comparison, a diffractogram of commercial NCM111 material is also added. The patterns of the synthesized NCM material were indexed to layered oxide with an R-3m space group without any peaks of the impurity phase. The peaks were consistent with the standard card of Li(Ni
1/3Co
1/3Mn
1/3)O
2 (PDF#01-075-9200). The distinct peak split corresponding to the (006)/(102) planes suggests a well-ordered, layered structure.
Additionally, it is highly recommended for cathode materials to be analyzed according to the following parameters [
39,
40,
41]:
The split of the peaks I006/I102 (2θ~36°)—this parameter indicates a good ordering of the hexagonal lattice, and peak separation was present both in the synthesized and commercial NCM111.
R-factor, R = (I006 + I102)/I101—the lower the value of this parameter, the higher the ordering of the structure (for good materials < 0.5); for both materials, this parameter was higher than it should have been: for commercial, it was 0.597, and for synthesized, it was 0.866.
The ratio I003/I104 (2θ 003~20°, 2θ 104~45°). The smaller this ratio, the closer the lattice is to cubic. In the context of these materials, this parameter characterizes cationic mixing and, for good materials, should be >1.2. For the commercial material, it was a little bit higher than that for the obtained (1543 and 1442, respectively).
Obviously, the R-factor of the obtained NCM materials after the cobalt extraction was extremely high for these types of materials. Probably, this could have been a result of the influence of the sol-gel synthesis on the powder structure. The ratio of the 003 and 104 peaks was lower than the ratio of the commercial material, but still more than 1.2; hence, the crystal lattice was hexagonal. The structural parameters of both materials are presented in the
Supplementary Materials.
Figure 4 demonstrates the results of the morphology study of the synthesized sample obtained using scanning electron microscopy in the secondary electron mode. Apparently, the powder had rounded particles with an average particle size of 300 nm
−1 microns, with a uniform particle size distribution. In addition, the agglomeration of particles in the sample was quite high. It is well known that a small particle size and uniform size distribution contribute to the rapid migration of Li
+ ions, which can contribute to obtaining excellent electrochemical characteristics [
42].
In
Table 3, the particle size distribution is presented. The material was prepared before the analysis of the particle size distribution via grinding in an agate mortar.
The chemical composition of the obtained material was analyzed using energy dispersive X-ray spectroscopy. The results are presented in
Table 4.
Thus, the atomic ratio of the transition metals in the synthesized material was Li(Ni
0.35Co
0.3Mn
0.35)O
2, which is quite close to the theoretically calculated NCM111. In the synthesized material, the amount of cobalt was slightly less than that theoretically calculated, which resulted in a shift in the atomic ratio towards the added nickel and manganese. The cobalt in the composition of layered cathode materials of the NCM type is responsible for increasing their kinetics, low-temperature properties, initial discharge capacity, and thermal stability [
43]. A low cobalt content is likely to degrade these characteristics.
3.3. Electrochemical Characteristics of Obtained Material
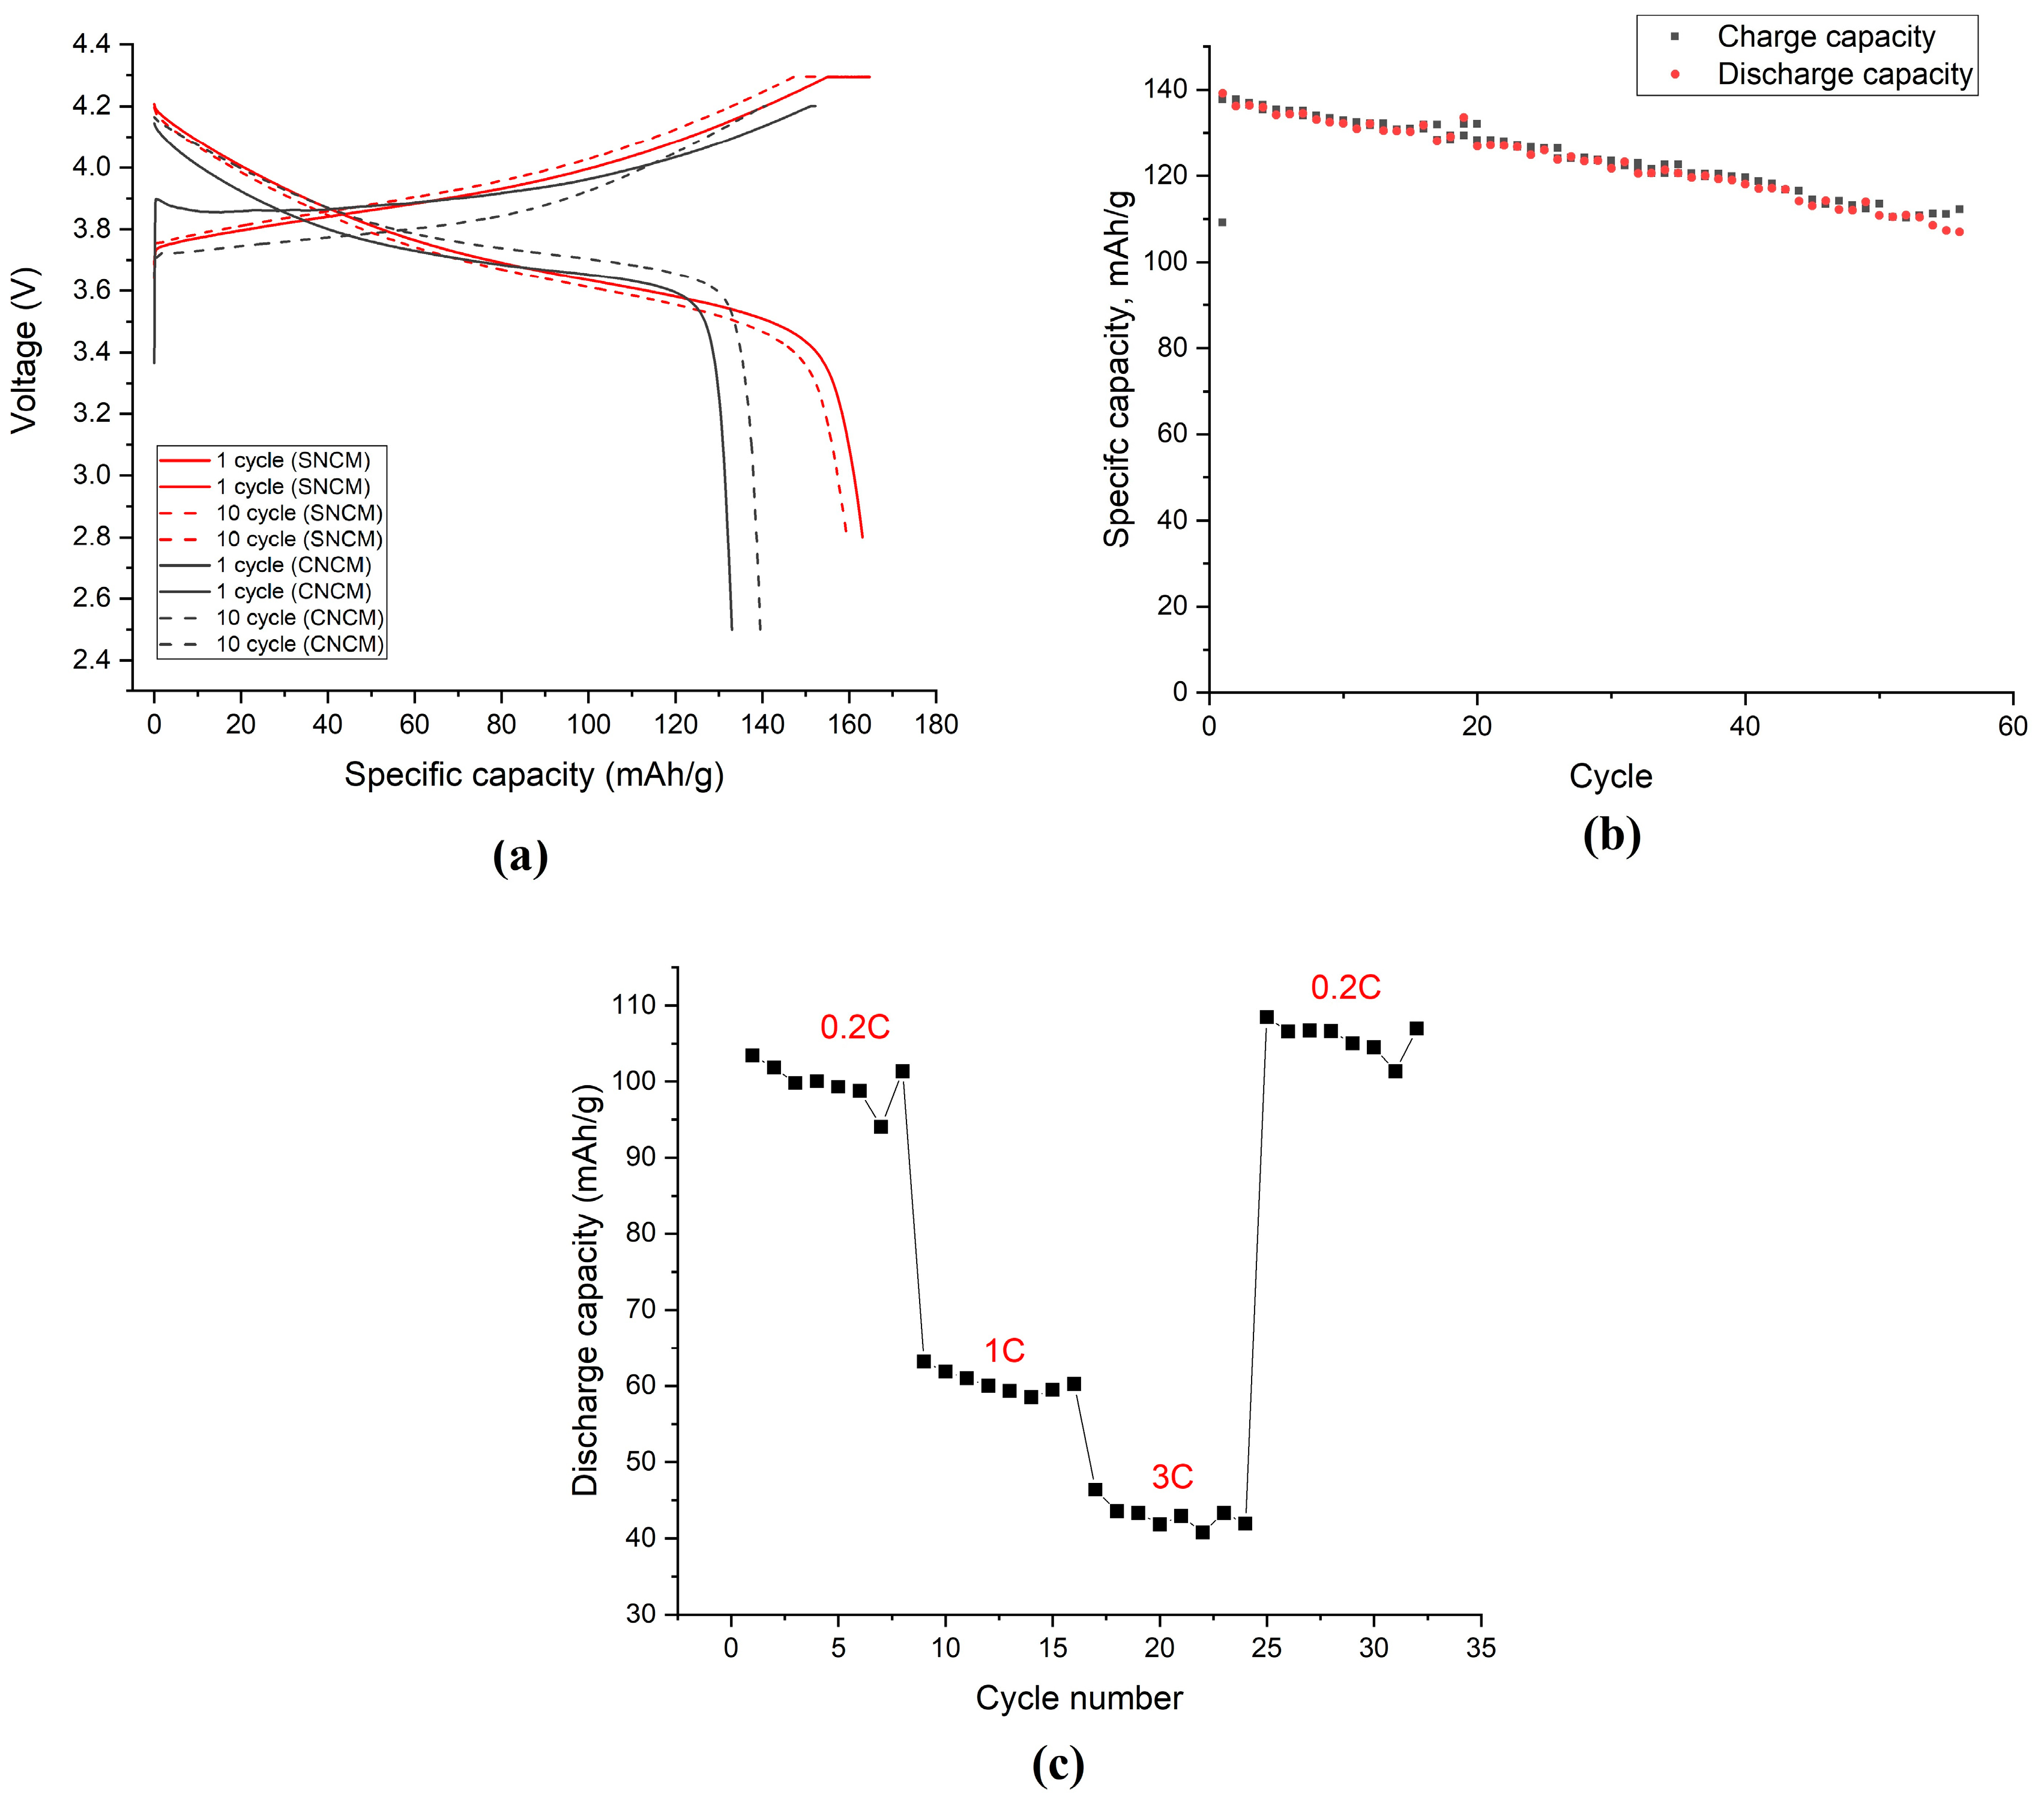
The electrochemical characteristics of the obtained material are illustrated in
Figure 5.
Figure 5a shows the charge/discharge curves at the 1st and 10th cycles at a current rate of 0.1 C and in the voltage range of 2.8–4.3 V for the synthesized (SNCM) and 2.6–4.3 V for the commercial (CNCM) materials. The synthesized material at the 1st cycle demonstrated a charging capacity of 164.7 mAh/g, a discharge capacity of 163.7 mAh/g, and the Coulomb efficiency for the 1st cycle was 99%, while the capacities for the 10th cycle were 158.2 and 159.4, respectively. The Coulomb efficiency of the material being close to 100% at all 10 cycles indicated a reversible intercalation/deintercalation of the lithium. A slight drop in the capacity during the cycling indicated a sufficient stability of the structure. The shape of the charge–discharge curves was typical for layered cathode materials and there was no clearly defined discharge area. The commercial material at the 1st cycle demonstrated a charging capacity of 153.0 mAh/g, a discharge capacity of 133.0 mAh/g, and the Coulomb efficiency for the 1st cycle was 87%, while for the 10th cycle, the capacities were 140.9 and 139.6, respectively, and the Coulomb efficiency was 99%. Hence, the synthesized NCM111 was not inferior in terms of its electrochemical characteristics compared to the commercially available material of such a type.
The cyclic resource of the material was also investigated and the results are illustrated in
Figure 5b. At the 1st cycle, the charge and discharge capacities were 137.73 and 136.16 mAh/g, and at the 60th cycle, the charging and discharging capacities were 112.21 and 107.0 mAh/g, respectively. The capacity loss over 60 cycles was 21.5%. This drop in capacity during the cycling can be explained by the sufficiently high value of the R-factor (0.866), since this parameter indicates that the structure in the sample was not ordered.
In addition, for the obtained material, a current load study was carried out with subsequent relaxation to determine the stability of the material structure, and the results are demonstrated in
Figure 5c. The material was tested with discharge currents corresponding to five-hour, one-hour, and twenty-minute discharges. The discharge was carried out with a current of 0.2 C for the first eight cycles. The drop in capacity relative to the five-hour discharge cycle, for discharge with a current of 1 C, was 61%, and with a current of 3 C, it was 43%. When discharged with a current of 0.2 C after 24 cycles of current load, the material was close to the initial capacity values, which meant that the material was quite stable.
3.4. Comparison of 2 NCM Materials of Different Chemistry Type, Synthesized Using Developed Methodology
To analyze the possibility of using the developed methodology for the cobalt extraction in a consequent synthesis of perspective NCM material, two comparative iterations were carried out: syntheses of NCM622 and NCM811. The chemical and phase compositions, morphology, structure, and electrochemical characteristics of the obtained materials were investigated.
The synthesis method was the same as that described in
Section 2.1, except with regard to NCM811. The heat treatment of this precursor was carried out in a tube furnace in oxygen flow, with a flow rate of 20 mL/min. The necessity of heat treatment in oxygen ambiance is explained by the fact that, with a lack of oxygen (in air atmosphere), nonstoichiometric oxide lithium–nickel is formed (Li
(1−z)Ni
(1+z)O
2) [
44]. If this phase is present in synthesized material, at the 1st cycle of charge–discharge, the additional Ni
2+ ions (1 + z) will cause structure destruction, which leads to poor electrochemical behavior of the material. The effect of nonstoichiometric lithium–nickel oxide forming was investigated, and it was found that Ni
2+ is formed in a lack of oxygen, instead of Ni
3+, and the Ni
2+ is stable. Based on this fact, to decrease the forming of such undesired oxides, the synthesis of Ni-rich cathode materials should be carried out in oxygen flow.
The synthesized NCM622 and NCM811 cathodes’ powders were analyzed in terms of particle size distribution and the results are presented in
Table 5. The materials were prepared before the analysis of the particle size distribution via grinding in an agate mortar. In total, 90% of the particles were less than 35.3 mkm for NCM622 and less than 29.1 mkm for the NCM811 material. These values were greater than those of the commercial materials, but the following treatment, such as milling and granulation, will probably increase the characteristics.
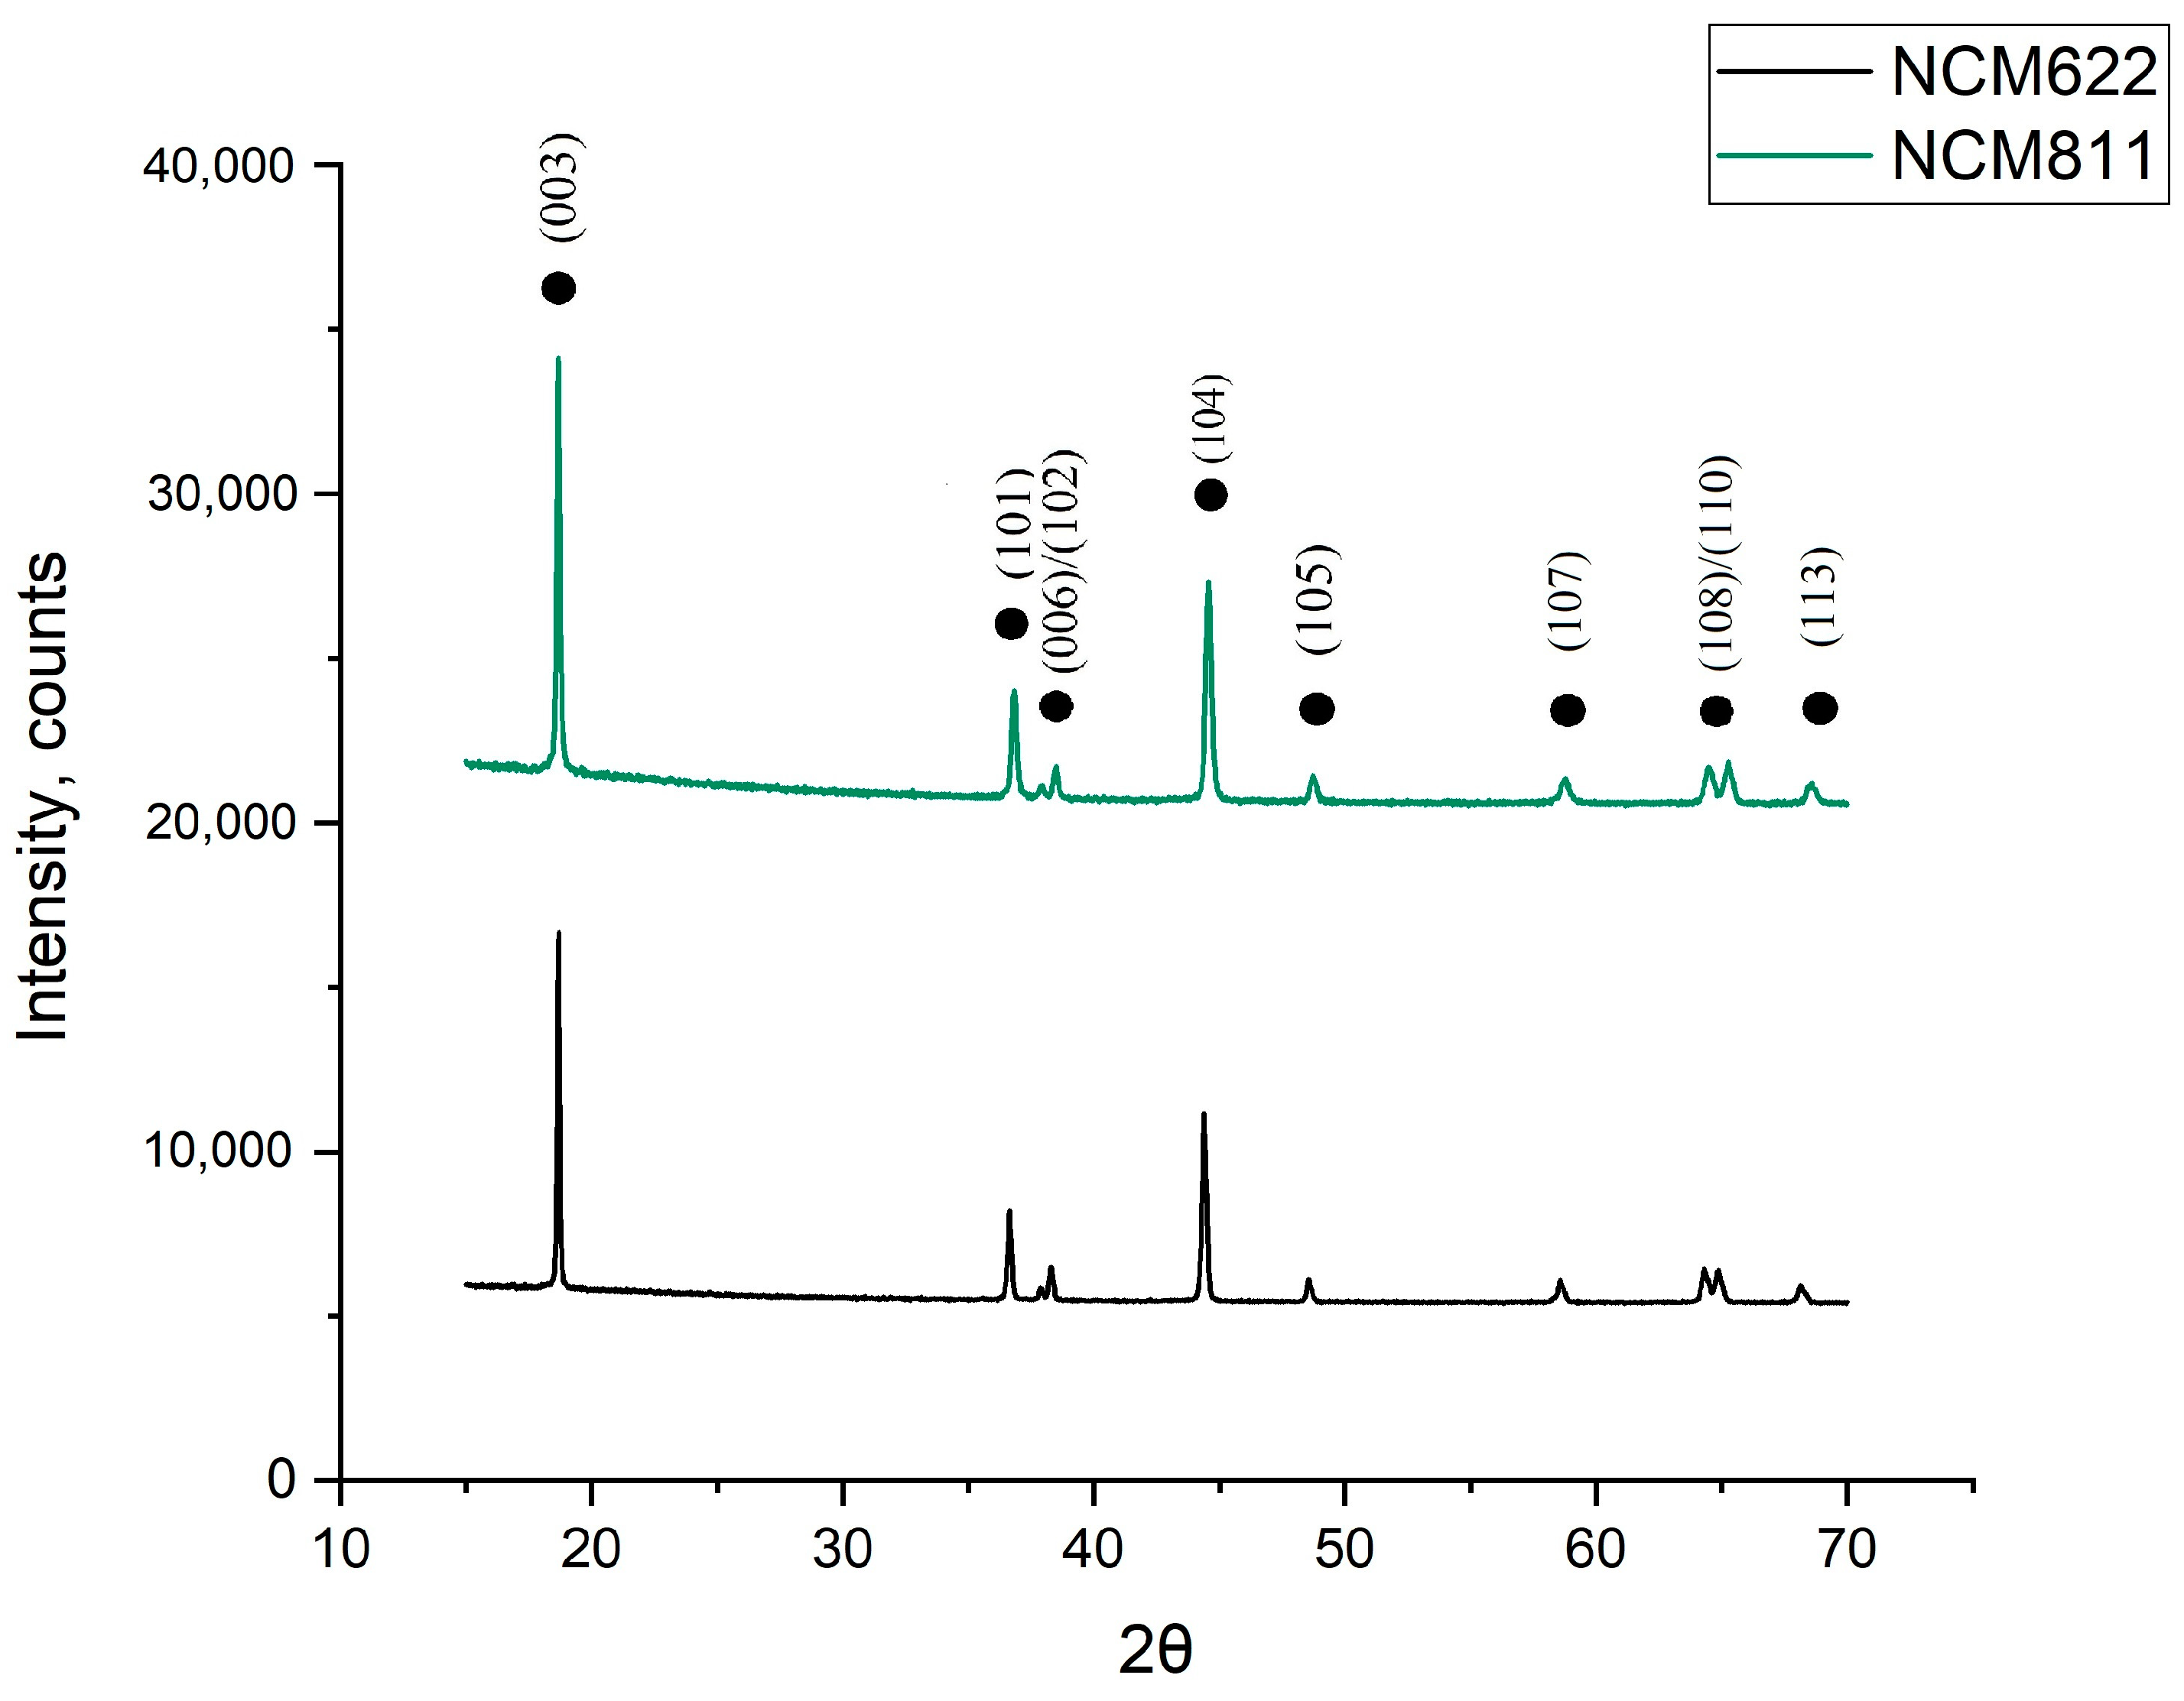
A comparative diffractogram of the synthesized materials is presented in
Figure 6. Obviously, typical peaks of the phase of triple-lithiated transition metal oxide NCM are observed in the two synthesized materials. All the materials had a separation of peaks 006/102 and 108/110, which indicates a good ordering of the layered structure of the materials. Due to the heat treatment of the precursor for the synthesis of the NCM811 material in oxygen flow, it was possible to obtain a material with a good crystallinity.
The values of the R-factor for all the materials turned out to be lower than that of the material described in
Section 3.3; for NCM622, it was 0.739, and for NCM811, it was 0.685. At the same time, the ratio of peaks 003/104 in the NCM811 material was significantly lower than that in the other cathode material, at 1.896 vs. 1.372. This phenomenon is explained by the fact that the amount of nickel relative to the amount of lithium in 811 was greater than that in the other cathode materials, as a result of which, the cationic mixing of nickel and lithium ions was more expressed, the layered structure was less ordered, and it could be assumed that the capacitance characteristics of this material would be worse. The structural parameters of both materials are presented in the
Supplementary Materials.
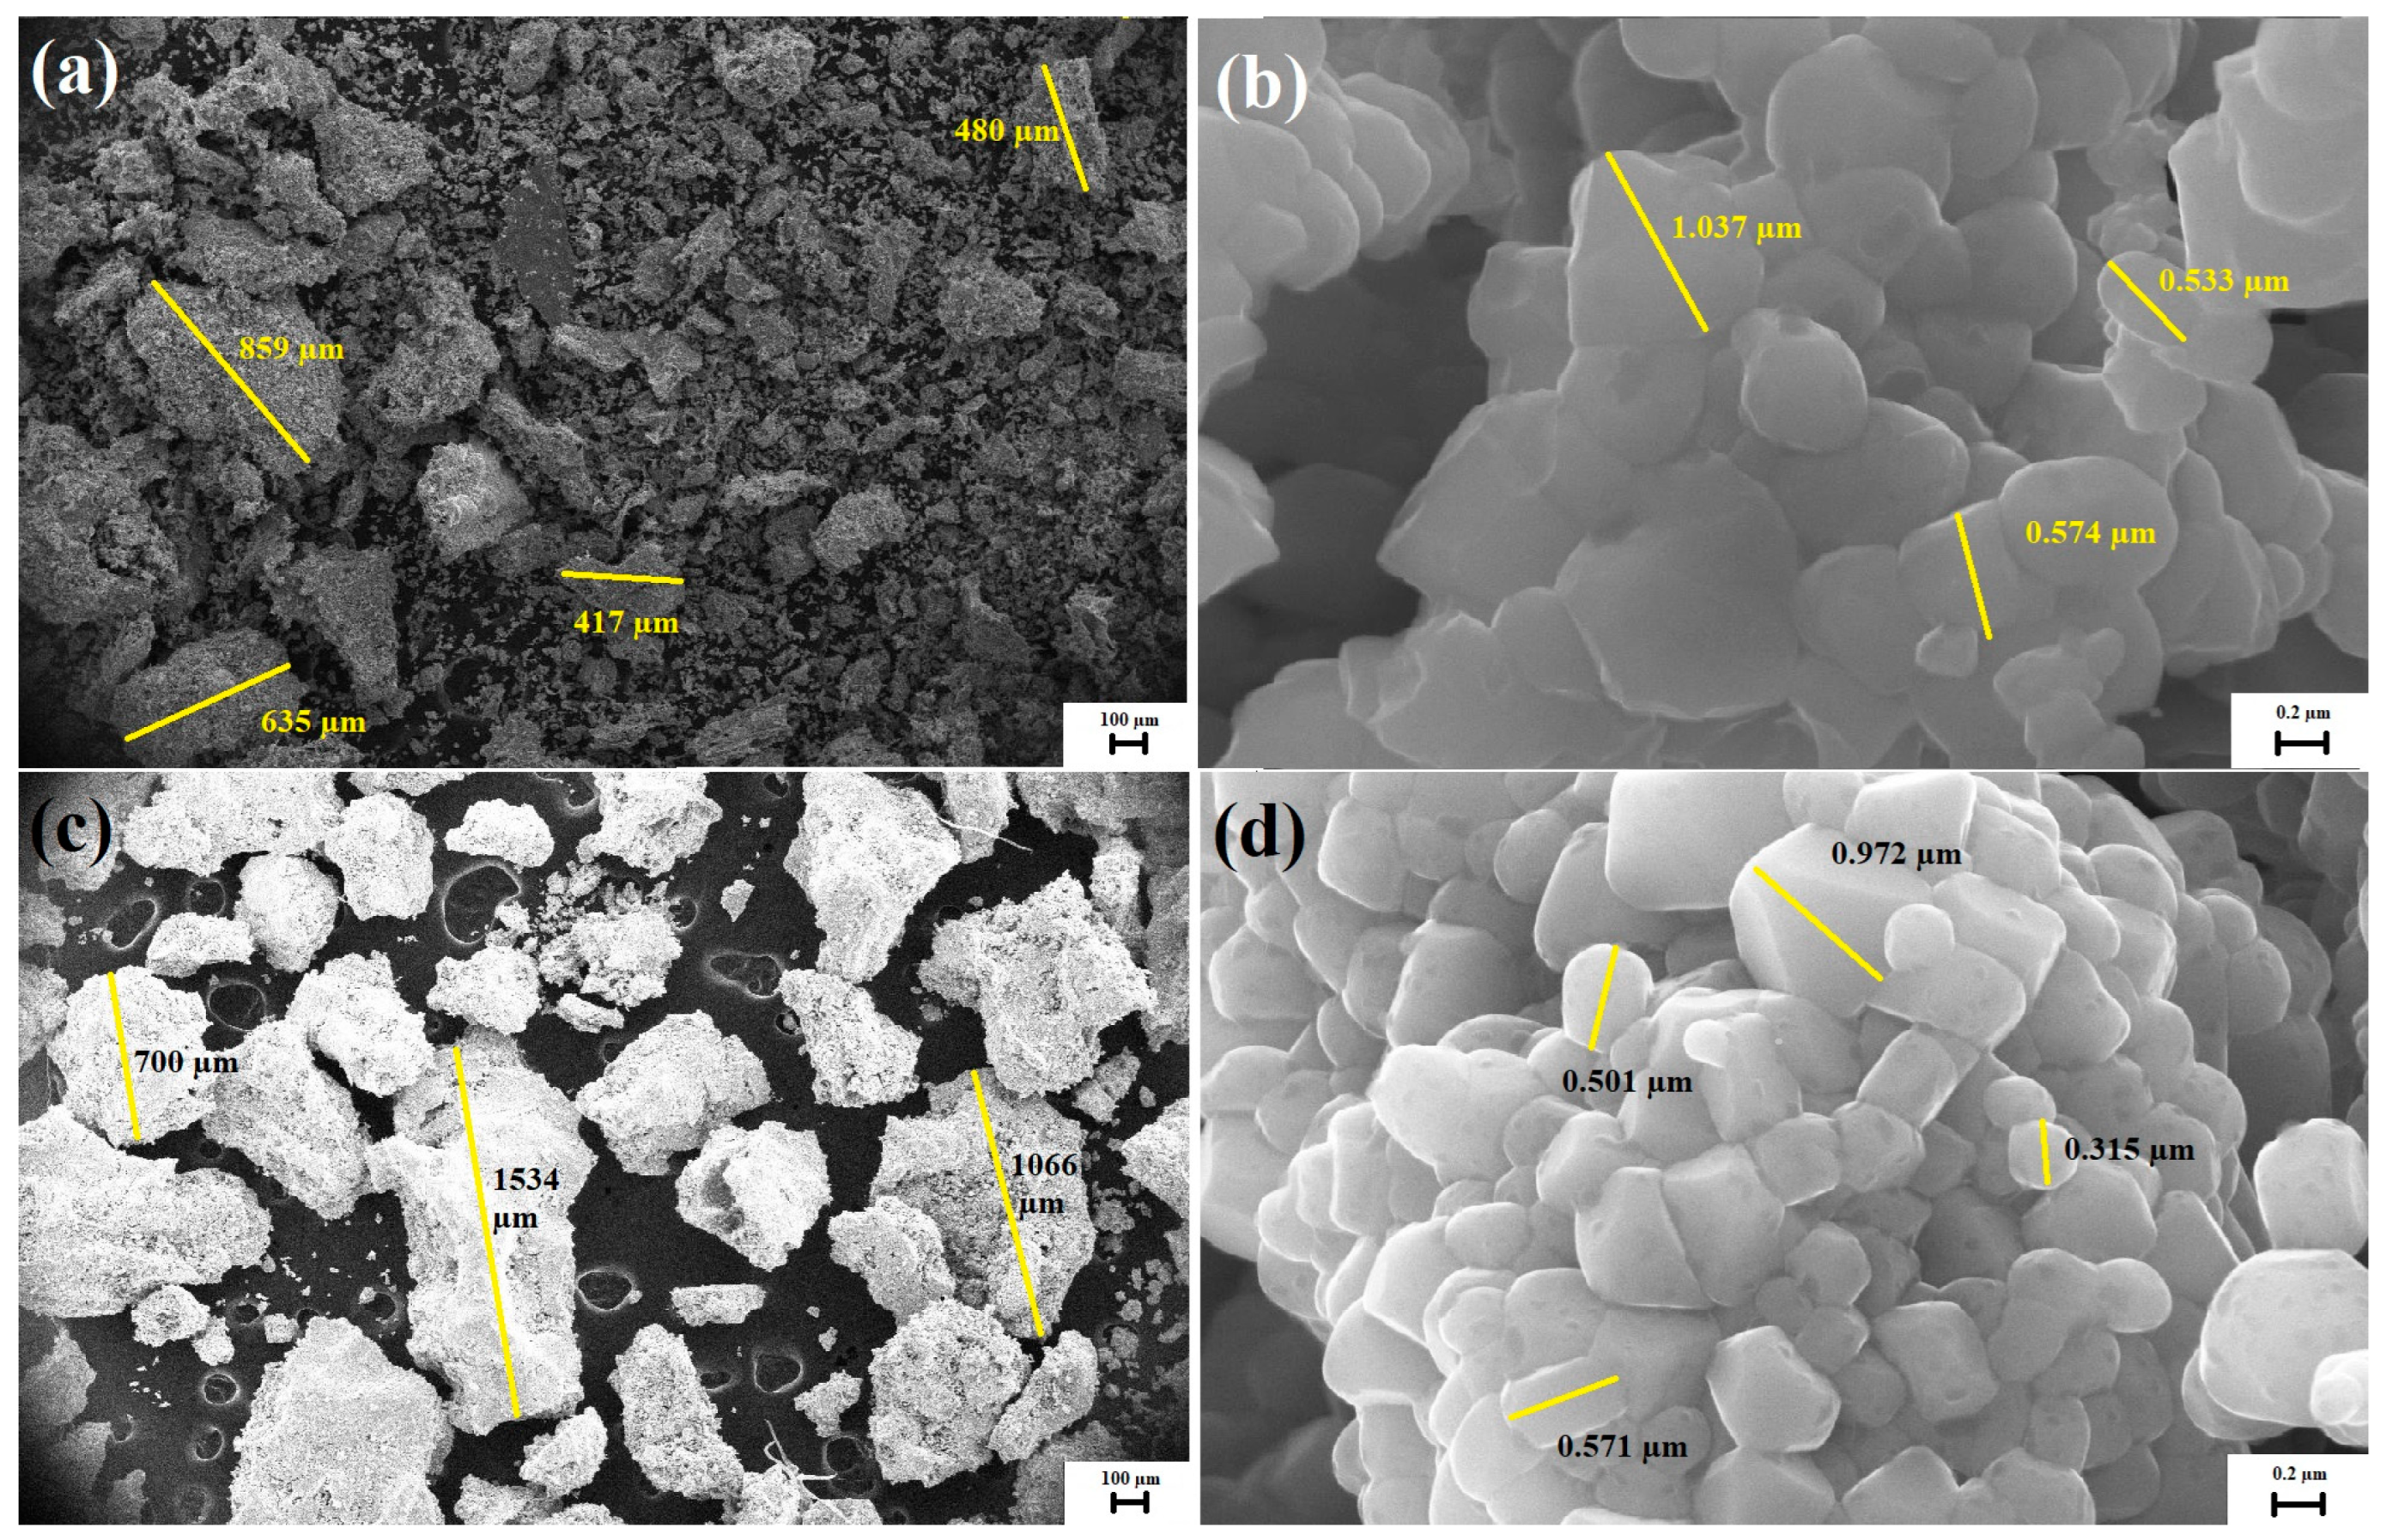
The scanning electron microphotographs of the obtained NCM622 and NCM811 materials in the secondary electron mode are illustrated in
Figure 7.
Figure 7a,b illustrate NCM622. It is apparent that the material consisted of rounded particles with a size of 0.5–1 microns, and also that the particles were agglomerated. The NCM811 microphotographs are presented in
Figure 7c,d. The particles of this material were fragmented, and this fact can be explained by the bigger amount of nickel in its composition. At a high magnification, it can be observed that the sintered fragmented particles consisted of small particles of the same f shape, with sizes ranging from 0.5 to 1 microns.
The chemical composition of the synthesized materials in terms of atomic percentage is presented in
Table 6.
Thus, the atomic ratio of the transition metals in the obtained materials for the calculated NCM622 was LiNi
0.60Co
0.17Mn
0.22O
2, and for the calculated NCM811, was LiNi
0.80Co
0.10Mn
0.10O
2. The obtained results were close to the theoretically calculated ratios, and there was a slightly reduced cobalt content relative to that theoretically calculated, which was likely to affect the initial capacitance characteristics. There was also the presence of more than 1% aluminum, which probably got into the precursor during the extraction of the cobalt from the aluminum current collector. The introduction of an Al
3+ ion increased the Ni
3+ ratio and limited the mixing of cations. Compared to the unmodified samples, the cathode material NCM811 doped with Al
3+ demonstrated an excellent cycling performance with a capacity retention of 70% at 10 °C after 1000 charge–discharge cycles [
45]. In addition, doping in the precursor was useful for reducing the energy potential, which led to a more uniform distribution of elements and a reduction in binding deficiencies during the subsequent calcination process. It is noteworthy that the alloying of Al could suppress the effect of cationic mixing and reduce the destruction of the structure of the material during charging [
46].
3.5. Electrochemical Behavior of NCM622 and NCM811
Figure 8 illustrates the electrochemical behavior of the synthesized NCM622 and NCM811. In
Figure 8a, charge–discharge curves at a current rate of 0.1 C and in a voltage range of 2.8–4.3 V at the 1st and 5th cycles are presented. The initial charging and discharge capacities of the NCM622 were 169 and 168 mAh/g, and those of the NCM811 were 235 and 187 mAh/g, respectively. The Coulomb efficiency for 622 was 99%, and for 811, was 80%. At cycle 5, the charging and discharging capacities for NCM622 were 180 and 179, and for NCM811, were 146 and 141 mAh/g, respectively. The Coulomb efficiency for NCM622 was 99.3%, and for NCM811, it was 96.5%. The unsatisfactory capacitance characteristics of material 811 after five cycles were explained by the low ordering of the structure and the high cationic mixing. The increase in capacity on cycle 5 for material 622 may have been because of working out the active mass.
The Coulomb efficiency of the material being close to 100% indicates a reversible intercalation/deintercalation of the lithium, indicating a sufficient stability of the structure. The shape of the charge–discharge curves was typical for layered cathode materials and there was no clearly defined discharge area. The medium-discharge voltage of the material NCM622 was higher than that of NCM811, which indicates that the material had higher energy intensity values. At the same time, the charging curve of 622 was lower than that of 811, which indicates a low internal resistance of the material.
Both synthesized materials were analyzed for a cyclic resource and the resulting graph is presented in
Figure 8b. The capacity drop in NCM622 for 28 cycles was 13% and in NCM811 it was 55%. The large drop in the capacity of the NCM811 was due to the high cationic mixing, which had an extremely negative effect on the capacitance characteristics of the material.
The synthesized materials were also investigated using cyclic voltammetry and the polarization curves are shown in
Figure 8c. This method for analyzing the electrochemical characteristics of a material allows for the reversibility of the electrode reactions to be analyzed, whether side reactions are present on the electrode to be determined, and also allows for the kinetics of the electrode reactions in different materials to be compared. The peak of the cathode potential was 3.94 V, and that of the anode potential was 3.58 V. According to the literature [
47], those peaks refer to a reversible intercalation of the Li
+ ions. In the cathode and anode regions for the NCM622 material, the peaks of the potentials of the reversible process of the deintercalation/intercalation of the lithium ions are clearly observed. The peak of the cathode potential was 3.94 V and that of the anode potential was 3.58 V. Peaks of side electrode reactions were not observed.
Peaks of reversible intercalation/deintercalation potentials were also observed for the material NCM811. The cathode peak was present at 3.79 V, and the anode peak at 3.69 V. In addition to these, there were also less obvious redox peaks at 4.03/3.95 V and 4.26/4.18 V, which appeared during the charge due to multiphase transitions from hexagonal to monoclinic (H1/M), from monoclinic to hexagonal (M/H2), and from hexagonal to hexagonal (H2/H3) [
48]. The absence of an H2/H3 phase transition with a lower Ni content in the material NCM622 indicated a good reversibility of the electrode and significantly affected the stability of the material structure, which also explained the lower loss of capacitance during charge/discharge of the material NCM622.
3.6. Electrochemical Impedance Spectroscopy Investigation
The impedance of the cathode materials obtained was investigated in a two-electrode cell, which was a CR2032 tablet layout, where lithium foil was used as an antielectrode. The impedance measurement was carried out on the Correct CS310 installation in the frequency range from 1.5 × 10⁵ Hz to 0.01 Hz. The measurements were carried out in the infected state up to a potential of 4.3 V and the amplitude of the oscillations was 10 mV. The modeling of the impedance spectra was carried out using the ZView program. The impedance hodographs of the studied samples are presented in
Figure 9. It is worth noting that usually when modeling impedance, an equivalent circuit is used, as shown in
Figure 10. In this diagram, R1 is the resistance of the cell elements: the housing, spacers, and other components, R2 is the resistance of the CEI film (cathode electrolyte interface), and R3 is the charge transfer resistance. Each block of elements is characterized by a semicircle on the impedance hodograph.
It is worth noting that, for samples NCM 111 and 622, there was no semicircle in the high-frequency region of the spectrum associated with the CEI response. For NCM 811, three semicircles can be observed, instead of two classic ones. Taking into account the corresponding forms of impedance hodographs, the simulation was carried out according to the schemes shown in
Figure 11. It can be assumed that a different shape of the hodograph for NCM 811 is associated with phase transitions, which were also noticeable on the CVA graphs. Since the equivalent circuits were used differently, it is proposed to compare the total resistance of the samples, minus R1, since it did not relate to the material under study (
Table 7).
From the presented data, the sample NCM622 had the highest total resistance. The other two samples were comparable, but the sample NCM811 had the least resistance. In addition, since the “tail” of diffusion was the largest in this sample, this also indicates better kinetics for this material. Sample modeling parameters are presented in the
Supplementary Materials.
