Article

AlCl3-NaCl-ZnCl2 Secondary Electrolyte in Next-Generation ZEBRA (Na-ZnCl2) Battery

1
Institute of Engineering Thermodynamics, German Aerospace Center (DLR), 70569 Stuttgart, Germany
2
Empa, Swiss Federal Laboratories for Materials Science and Technology, 8600 Dübendorf, Switzerland
3
Helmholtz-Zentrum Dresden-Rossendorf (HZDR), 01328 Dresden, Germany
*
Authors to whom correspondence should be addressed.
These authors contributed equally to this work.
Batteries 2023, 9(8), 401; https://doi.org/10.3390/batteries9080401
Submission received: 30 June 2023 / Revised: 26 July 2023 / Accepted: 29 July 2023 / Published: 1 August 2023
(This article belongs to the Special Issue High Performance Sodium Rechargeable Batteries and Beyond)

Abstract

:
Increasing demand to store intermittent renewable electricity from, e.g., photovoltaic and wind energy, has led to much research and development in large-scale stationary energy storage, for example, ZEBRA batteries (Na-NiCl2 solid electrolyte batteries). Replacing Ni with abundant and low-cost Zn makes the ZEBRA battery more cost-effective. However, few studies were performed on this next-generation ZEBRA (Na-ZnCl2) battery system, particularly on its AlCl3-NaCl-ZnCl2 secondary electrolyte. Its properties such as phase diagrams and vapor pressures are vital for the cell design and optimization. In our previous work, a simulation-assisted method for molten salt electrolyte selection has shown its successful application in development of molten salt batteries. The same method is used here to in-depth study the AlCl3-NaCl-ZnCl2 salt electrolyte in terms of its phase diagrams and vapor pressures via FactSageTM and thermo-analytical techniques (Differential Scanning Calorimetry (DSC) and OptiMeltTM), and their effects on battery performance such as operation safety and charging/discharging reaction mechanism. The DSC and OptiMelt results show that the experimental data such as melting temperatures and phase changes agree well with the simulated phase diagrams. Moreover, the FactSageTM simulation shows that the salt vapor pressure increases significantly with increasing temperature and molar fraction of AlCl3. The obtained phase diagrams and vapor pressures will be used in the secondary electrolyte selection, cell design and battery operation.

1. Introduction

With fast-growing population in the world, the global energy consumption increases every year [1]. To cope with the challenges in rising energy demand and considering climate change by greenhouse gas emission, it is important to realize the energy transition by increasing the use of renewable clean energy from, e.g., photovoltaic (PV) and wind energy. Increasing share of these intermittent renewable energy resources in the energy system has promoted new research and development in batteries for large-scale stationary energy storage, such as ZEBRA battery (Na-NiCl2 solid electrolyte battery) [2]. This commercial ZEBRA battery uses commonly available materials and safe reagents, and therefore has several advantages (e.g., higher safety, longer lifetime) over other batteries such as the lithium (Li)-ion battery [3] and Na-S battery [4].
The ZEBRA battery is a kind of high temperature molten salt battery, having an operating temperature around 300 °C, a voltage of approx. 2.58 V and an energy efficiency of >80% [3,4,5]. It has a high energy and power density of about 90 Wh/kg and 150 W/kg, respectively, and can withstand a high number of charging and discharging cycles (>5000 cycles), making it an attractive option in various energy storage applications including stationary energy storage [6]. FZSoNick, which is the global leading ZEBRA battery manufacturer and also one R&D partner in the EU project funding this work, reports that more than 40,000 ZEBRA battery systems with >500 MWh have today been installed globally for telecom, railways, energy storage, electrical mobility, etc. [7]. The electrochemical reaction in the ZEBRA battery is shown as follows:
2 Na + NiCl 2 Ni + 2 NaCl
In this battery (see Figure 1 left), a porous NiCl2/Ni+NaCl electrode infiltrated with NaAlCl4 is used as a positive electrode (cathode) and liquid Na produced during charging as a negative electrode (anode). The mixture of AlCl3-NaCl (50-50 mol%), i.e., NaAlCl4, is used as the main part of the secondary salt electrolyte in the positive electrode, which has a low melting point of about 156 °C and acts as a good Na+ conductor. A beta’’-alumina solid electrolyte (BASE) is employed as the primary electrolyte, which has a good Na+ conductivity of around 0.5 S cm−1 at operating temperature. The primary BASE electrolyte is also used to physically separate the anode and cathode compartment to achieve low self-discharge for high energy efficiency [8].
In order to further improve the competitiveness of the ZEBRA battery on the energy storage market, much R&D effort was made in the past decades on next-generation ZEBRA battery to further increase its storage performance (e.g., efficiency, lifetime) and also to reduce its costs. The limited reserves and high costs of nickel are major factors impeding the widespread and large-scale adoption of ZEBRA technology [9]. In the material unit storage cost of the final cell (28 USD/kWh), Ni cost (18 USD/kWh) has the highest share with about 63%, and constitutes about 25% of the overall battery cost (73 USD/kWh) [10]. Replacing Ni with abundant and low-cost Zn, the material cost share of the cathode metal (4 USD/kWh) can be significantly reduced to about 23%, which can cut down the cell material and overall battery costs by around 46 and 20%, respectively. In addition, ZnCl2 has a much lower melting temperature than NiCl2 (290 °C, compared to about 1000 °C) [11]. While the electrochemical reactions in nickel electrodes take place via dissolved metal ions in the secondary electrolyte despite the high melting temperature of NiCl2 [12], significant differences in the reaction mechanism and kinetics are expected in zinc electrodes. Bones et al. [13] previously reported that the Na-NiCl2 ZEBRA battery operating at 300 °C experienced premature capacity loss due to the undesirable growth of Ni particles in the cathode. In contrast, Lu et al. [9] demonstrated that the Na-ZnCl2 based battery, with its lower melting point of 240 °C, exhibited the formation of a liquid phase at 280 °C. This liquid phase effectively suppressed the growth of Zn and NaCl particles, presenting a distinct advantage for Na-ZnCl2-based batteries. Furthermore, this battery showed excellent cycling stability for the Na-ZnCl2 cell at 280 °C, displaying a four-step charging and discharging behavior. The conducted cycling tests at a C/2 rate (30 mA) between 48% and 90% state of charge (SOC) (65 mA h) for 56 cycles, revealing promising short-term cycling performance. However, it is essential to acknowledge that the long-term cycling performance of the Na-ZnCl2 battery remains an area that has not been extensively explored in the literature. Another important factor is the vapor pressure, which might potentially affect the pressure management in solid-electrolyte batteries such as the ZEBRA batteries [14].
Lu, et al. [9,10,11,12,13,14,15] have studied next-generation Na-ZnCl2 ZEBRA cells and their reaction mechanism, applying a porous Zn/NaCl cathode with AlCl3-NaCl-ZnCl2 secondary electrolyte (see schematic representation in Figure 1, right). The electrochemical reaction in the Na-ZnCl2 ZEBRA battery is shown in Equation (2). These cells showed a voltage of round 2.1 V at 280 °C, and more stable cycling at 280 °C, compared to 240 °C, which was ascribed to formation of a liquid phase (Na2ZnCl4) in the binary NaCl-ZnCl2 system above 250 °C [9]. The NaCl-ZnCl2 phase diagram was further used to identify four stages occurring during reversible charge/discharge cycling—but in these explanations ignoring the presence of AlCl3 [9]. The cathode is a key component for the performance of ZEBRA and Na-ZnCl2 cells, as its microstructure largely determines the electronic and ionic cell resistance as well as life-time of the battery. With this in mind, Lee et al. [16] improved the cell performance significantly by using a carbon felt to reduce cathodic resistance. To analyze and optimize the influence of the microstructural properties of the cathodic region at different State of Charges (SOC) of the Na-ZnCl2 battery, Godinez-Brizuela et al. [17] developed a synthetic geometric model for the cathodic region for microstructural analysis of its effective conductivity, which could be used to assist the cathode improvement.
2 Na + ZnCl 2 Zn + 2 NaCl
All the previous works above suggest that the phase content, in particular the presence of ZnCl2-containing molten phases, has a significant effect on the cell performance of the Na-ZnCl2 battery. In this context, it is important to note that the presence of AlCl3 in the AlCl3-NaCl-ZnCl2 secondary electrolyte has significant effect on the battery behaviors. This affects phase formation, melting temperature, vapor pressure, and reaction mechanisms in this system, which can affect battery performance and safety significantly.
In our previous work, a simulation-assisted method based on thermodynamic simulation via FactSageTM and thermal analysis via Differential Scanning Calorimetry (DSC), and a melting point apparatus (OptiMeltTM) was successfully applied for selection of a molten salt electrolyte for Na-based liquid metal battery (Na-LMB), which is another type of molten salt battery without BASE solid electrolyte and uses the molten salt electrolyte as the primary electrolyte [18,19,20,21]. A low-melting-point NaCl-LiCl-KCl molten salt electrolyte was selected based on phase diagram and other experimental data. The Na-LMB test cell with the selected molten salt electrolyte shows an energy efficiency of about 80% and a coulombic efficiency of >97% [20,21]. Moreover, the Levelized Cost of Storage (LCOS) of the Na-LMB with the selected NaCl-LiCl-KCl molten salt electrolyte was estimated to be 0.027~0.029 USD/kWh for scaled application conditions, based on a 1MW/5MWh demo energy storage plant made of 100 Ah battery monomers [18].
In this study, the AlCl3-NaCl-ZnCl2 salt system (secondary salt electrolyte of Na-ZnCl2 battery) was in-depth investigated with thermodynamic simulation via FactSageTM, thermal analysis via Differential Scanning Calorimetry (DSC) and a melting point apparatus (OptiMeltTM), used in our previous work. Formation of different phases at different compositions (i.e., variable SOC and AlCl3 content) and their melting points were simulated and/or measured. Moreover, thermodynamic simulation on the salt vapor pressures in the operating temperature range was used to find the safety limit of the composition. Overall, this paper presents both simulated and measured data pertaining to the key thermal properties of the AlCl3-NaCl-ZnCl2 salt system, along with their application for battery design and enhancement. Notably, our study employs simulated phase diagrams to conduct a unique analysis of the phase formation within the battery during charging and discharging processes. This analysis offers insights into the battery’s composition and behavior at different states of charge (SOC), representing a novel contribution that has not been previously documented in existing studies.

2. Materials and Methods

2.1. FactSageTM Thermodynamic Simulation

FactSageTM 8.1 was used to simulate phase diagrams of the NaCl-ZnCl2-AlCl3 secondary salt electrolyte in the novel ZEBRA battery. The simulation was performed in the Phase Diagram mode of the FactSageTM. In the simulation, two moles of NaCl and the other salt species (i.e., ZnCl2, AlCl3) as one mole were used for better use of the phase diagrams for battery design and optimization, because the charging and discharging reversible reaction involves two moles of NaCl to react with one mole of Zn as shown in Equation (2). Firstly, the ternary phase diagram of (NaCl)2-ZnCl2-AlCl3 was simulated and studied. Moreover, after simulation of the ternary phase diagram, binary phase diagrams at some selected constant concentrations of AlCl3 were plotted in the same module to achieve a better understanding of the ternary phase diagram. Additionally, the vapor pressures for different salt mixtures at different temperatures were also studied for the analysis of the maximum allowable temperature for the battery.

2.2. Sample Preparation

For the experimental studies, pure chloride salts including AlCl3 (99% purity, anhydrous, Alfa Aesar, Kandel, Germany), ZnCl2 (99% purity, anhydrous, Alfa Aesar, Kandel, Germany) and NaCl (99% purity, anhydrous, Alfa Aesar, Kandel, Germany) were used to synthesize the AlCl3-NaCl-ZnCl2 salt mixtures. Due to the hygroscopicity of chloride salts (particularly AlCl3 and ZnCl2), the storage, weighing, mixing and sample preparation of the salts were carried out in a glovebox (GS Glovebox System technik GmbH, Glovebox Mega 2, O2 < 0.5 ppm, H2O < 1 ppm, Malsch, Germany) swept with ultra-high-purity argon gas (Ar 5.0, purity > 99.999%). All salt mixtures (~5 g) for thermal analysis were grinded in a ceramic mortar for at least 30 min by hand, so that they were mixed well with acceptable small salt particle size for thermal analysis.

2.3. Differential Scanning Calorimetry (DSC) for Thermal Analysis

Differential Scanning Calorimetry (DSC) was used to determine exact melting points of the studied salt mixtures with different compositions. The measurements were carried out with a commercial equipment of DSC 204 F1 Phoenix® (NETZSCH, Germany). The temperature calibration of the DSC equipment was conducted with standard materials (In, Sn, Zn, Bi, CsCl, Benzoic Acid, Biphenyl and KClO4).
Sealed gold platted stainless steel crucibles were used for the DSC measurements due to high vapor pressure of AlCl3 [19] and strong corrosiveness of the salt mixtures at high temperatures. About 10 mg of each prepared salt mixture was put into the crucible in the glovebox. Next, the crucible with the salt mixture was sealed with the gold platted steel lid by a toolkit in the glove box. Afterwards, all the crucibles were transferred out of the glovebox in sealed bottles with argon gas, then weighed and put into the DSC equipment (exposure time in air of <5 min).
The following parameters were set in the DSC measurements: Heating and cooling rates were 10 K/min, while protective gas flow around the furnace was N2 (purity > 99.999%, Linde gas, Germany) at 20 mL/min. The reference crucible for the DSC measurement was an empty gold platted stainless steel crucible, which is identical to the test crucible with the salt. Three cycles of DSC (heating and cooling) between 30 °C to 410 °C were performed for each salt sample. The first cycle was not generally considered for the melting temperature determination because the salt mixture is non-homogeneous in the first cycle. One of the second and third cycles was selected to determine the melting temperature, when these two cycle curves were very close to each other.
In total, 11 salt compositions were selected for the DSC measurements as shown in Table 1. Among them, samples No. 1–6 represent the salt compositions with different AlCl3 concentrations (15, 25 and 35 mol% in AlCl3-ZnCl2-(NaCl)2) at 100% SOC and a representative SOC. As NaAlCl4 in the secondary salt electrolyte must not be consumed, 100% SOC of the battery is defined as 1:1 mol% of NaCl and AlCl3 to maintain the basicity of the overall salt for compatibility with the BASE electrolyte [5]. Samples No. 7–11 (34.9 mol% AlCl3 in AlCl3-ZnCl2-(NaCl)2) correspond to realistic Na-ZnCl2 cathode compositions with 30% active metal content (e.g., 65.1 wt% Zn, 34.9 wt% NaCl at 0% SOC) and ~50 vol% NaAlCl4 at 280 °C (→ 45.9 wt% Zn, 24.6 wt% NaCl, 29.5 wt% NaAlCl4 at 0% SOC). As sample No. 7 (0% SOC) and sample No. 11 (100% SOC) contain 0 mol% and 47.7 mol% ZnCl2, respectively, the salt composition (i.e., mol% ZnCl2 and (NaCl)2) at various SOCs can be easily calculated from the SOC value and the constant AlCl3 content x A l C l 3 :
x Z n C l 2 ( m o l % ) = ( x Z n C l 2 ,   100 % S O C x Z n C l 2 ,   0 % S O C ) · S O C = 47.7 · S O C ,
x ( N a C l ) 2 ( m o l % ) = 100 x A l C l 3 ( 34.9   m o l % ) x Z n C l 2 ( m o l % ) .
x Z n C l 2 ,   100 % S O C and x Z n C l 2 ,   0 % S O C is the molar fraction of ZnCl2 in the salt mixture of the fully charged (100% SOC) and discharged (0% SOC) battery, respectively.

2.4. Melting Point Measurement Apparatus (OptiMeltTM)

The Automated Melting Point System—OptiMeltTM (MPA 100, Stanford Research Systems) is a melting point measurement apparatus, which records the melting process using a camera. The melting can be observed from the camera and is recorded for further analysis. The salt mixture samples No. 1–6 were filled 3 mm high inside the capillary tube with about 1.5 mm inner diameter and finally inserted in the OptiMeltTM. The following parameters were set: the temperature range was 30–400 °C, heating rate of 10 K/min was applied, which was consistent with the DSC measurements. For every experiment, two cycles were performed. In the same way as for the DSC measurements, the first cycle was used to homogenize the salt mixture and remove air bubbles in the salt. The images of the second cycle from the built-in camera were used to determine the melting temperature of the studied salt sample and to further study its melting process. The temperature at which melting starts in the salt is defined as the melting temperature of the salt. Since the results were obtained from visual inspection, the accuracy of measured melting temperatures is not as good as in the case of DSC. However, the OptiMeltTM experiment is still a good supplement to determine/confirm the melting point and study the melting process of the salt.

3. Results and Discussion

3.1. Simulated Phase Diagrams

In order to in-depth investigate the equilibrium phases in the NaCl-ZnCl2-AlCl3 system, the phase diagrams were simulated with FactSageTM. Since the overall charging and discharging reaction of Na-ZnCl2 batteries involves the reversible consumption of two moles of NaCl to form one mole of ZnCl2, as shown in Equation (2), all phase diagrams in this work were simulated for (NaCl)2 instead of NaCl to ease their interpretation in terms of cell SOC.
The simulated ternary phase diagram of AlCl3-ZnCl2-(NaCl)2 (1 atm, 300 °C) in Figure 2 shows that at a high concentration of AlCl3 (>50 mol %) the melting point is <300 °C, and much salt vapor is present. However, this is not the case during normal operation of ZEBRA-type batteries, whose cycling is restricted to a content of (NaCl)2:AlCl3 > 1:2 (to avoid decomposition of NaAlCl4 at 0% SOC). The salt contents of a realistic cathode composition with 30% active metal content and 50 vol% NaAlCl4 in a test cell are marked exemplarily in Figure 2. As AlCl3 does not participate in the battery charging and discharging reaction, the molar fraction of AlCl3 is constant in the AlCl3-ZnCl2-(NaCl)2 phase diagram at various SOC (0–100%). As assembled in the discharged state (0% SOC), the cell contains 34.9 mol% AlCl3, 65.1 mol% (NaCl)2, and Zn metal powder (not shown here); this corresponds to molten NaAlCl4 and NaCl, with the latter being present as solid particles. Upon charge, the ZnCl2 content increases and the NaCl content decreases. At 100% SOC, 34.9 mol% AlCl3, 47.7 mol% ZnCl2 and 17.4 mol% (NaCl)2 is reached, and the salt mixture is liquid completely. From this phase diagram it is safe to conclude that sufficient AlCl3 is needed to be present in the secondary salt electrolyte to avoid the high melting point of the salt mixture, since the high resistance of the secondary salt electrolyte due to large vol% of solid salts leads to bad battery performance. To display the influence of temperature, we present binary phase diagrams at different AlCl3 contents (0–55 mol%) below.
The binary phase diagram of ZnCl2-(NaCl)2 (Figure 3a), i.e., absence of AlCl3 (0 mol%) in the AlCl3-ZnCl2-(NaCl)2 mixture, displays a eutectic point with a melting temperature of 254 °C at about 81 mol% ZnCl2, which is in agreement with the literature [11]. As shown in Figure 3b–f, pseudo-binary phase diagrams were simulated with a stepwise increase in 10 mol% of AlCl3 from 15 to 55 mol % in the salt mixture of AlCl3-ZnCl2-(NaCl)2, corresponding to Na-ZnCl2 cells with variable NaAlCl4 contents between ~20 and 80 vol.% at the cathode. When the molar fraction of AlCl3 increases, the salt mixture can be kept in the fully liquid state (i.e., very low resistance for better battery operation) over a wider compositional and SOC range. For instance, at 300 °C and for 15 mol% AlCl3, a minimum 52 mol% of ZnCl2 is required to keep the melt in liquid state as shown in Figure 3b, while for 55 mol% AlCl3 only a minimum of 8 mol% ZnCl2 is required (see Figure 3f). Thus, the AlCl3 content (i.e., NaAlCl4) at the cathode significantly influences the phase content of active Zn-species (i.e., ZnCl2) at the cathode, and thus the reaction mechanism and kinetics of corresponding cells.
However, with the increasing content of AlCl3, the cost of the secondary salt electrolyte (i.e., the battery) could increase, since AlCl3 (about 0.9 USD/kg) has much higher price (more than ten times) than NaCl (about 0.06 USD/kg) [22]. Moreover, it is also evident in Figure 3a–f that the gas phase starts to form at lower temperatures with the increasing molar fraction of AlCl3. It is defined in FactSageTM that the gas phase starts to form when the vapor pressure of the salt mixture reaches 1 atm. For example, at 0 mol% AlCl3, the gas pressure is above 1 atm at approximately 750 °C, i.e., much gas formation starts at this temperature. With the increase in the concentration of AlCl3, the gas phase starts to form at lower temperatures, which is about 300 °C at 55 mol% of AlCl3 in the salt mixture. From Figure 3, it can be stated that increasing molar fraction of AlCl3 has both positive and negative effect on the salt electrolyte, on one hand it can decrease the melting point and could reduce the resistance with more existing liquid phase, but on other hand it can increase the vapor pressure and could affect the battery life span and safety. Moreover, increasing AlCl3 can lead to more challenges such as materials corrosion [23]. Thus, it is suggested in future work to determine the optimal concentration of AlCl3 in the secondary salt electrolyte regarding the performance and storage cost of the battery, based on phase diagrams, vapor pressure, charging/discharging range, compatibility with other materials in the battery, etc.

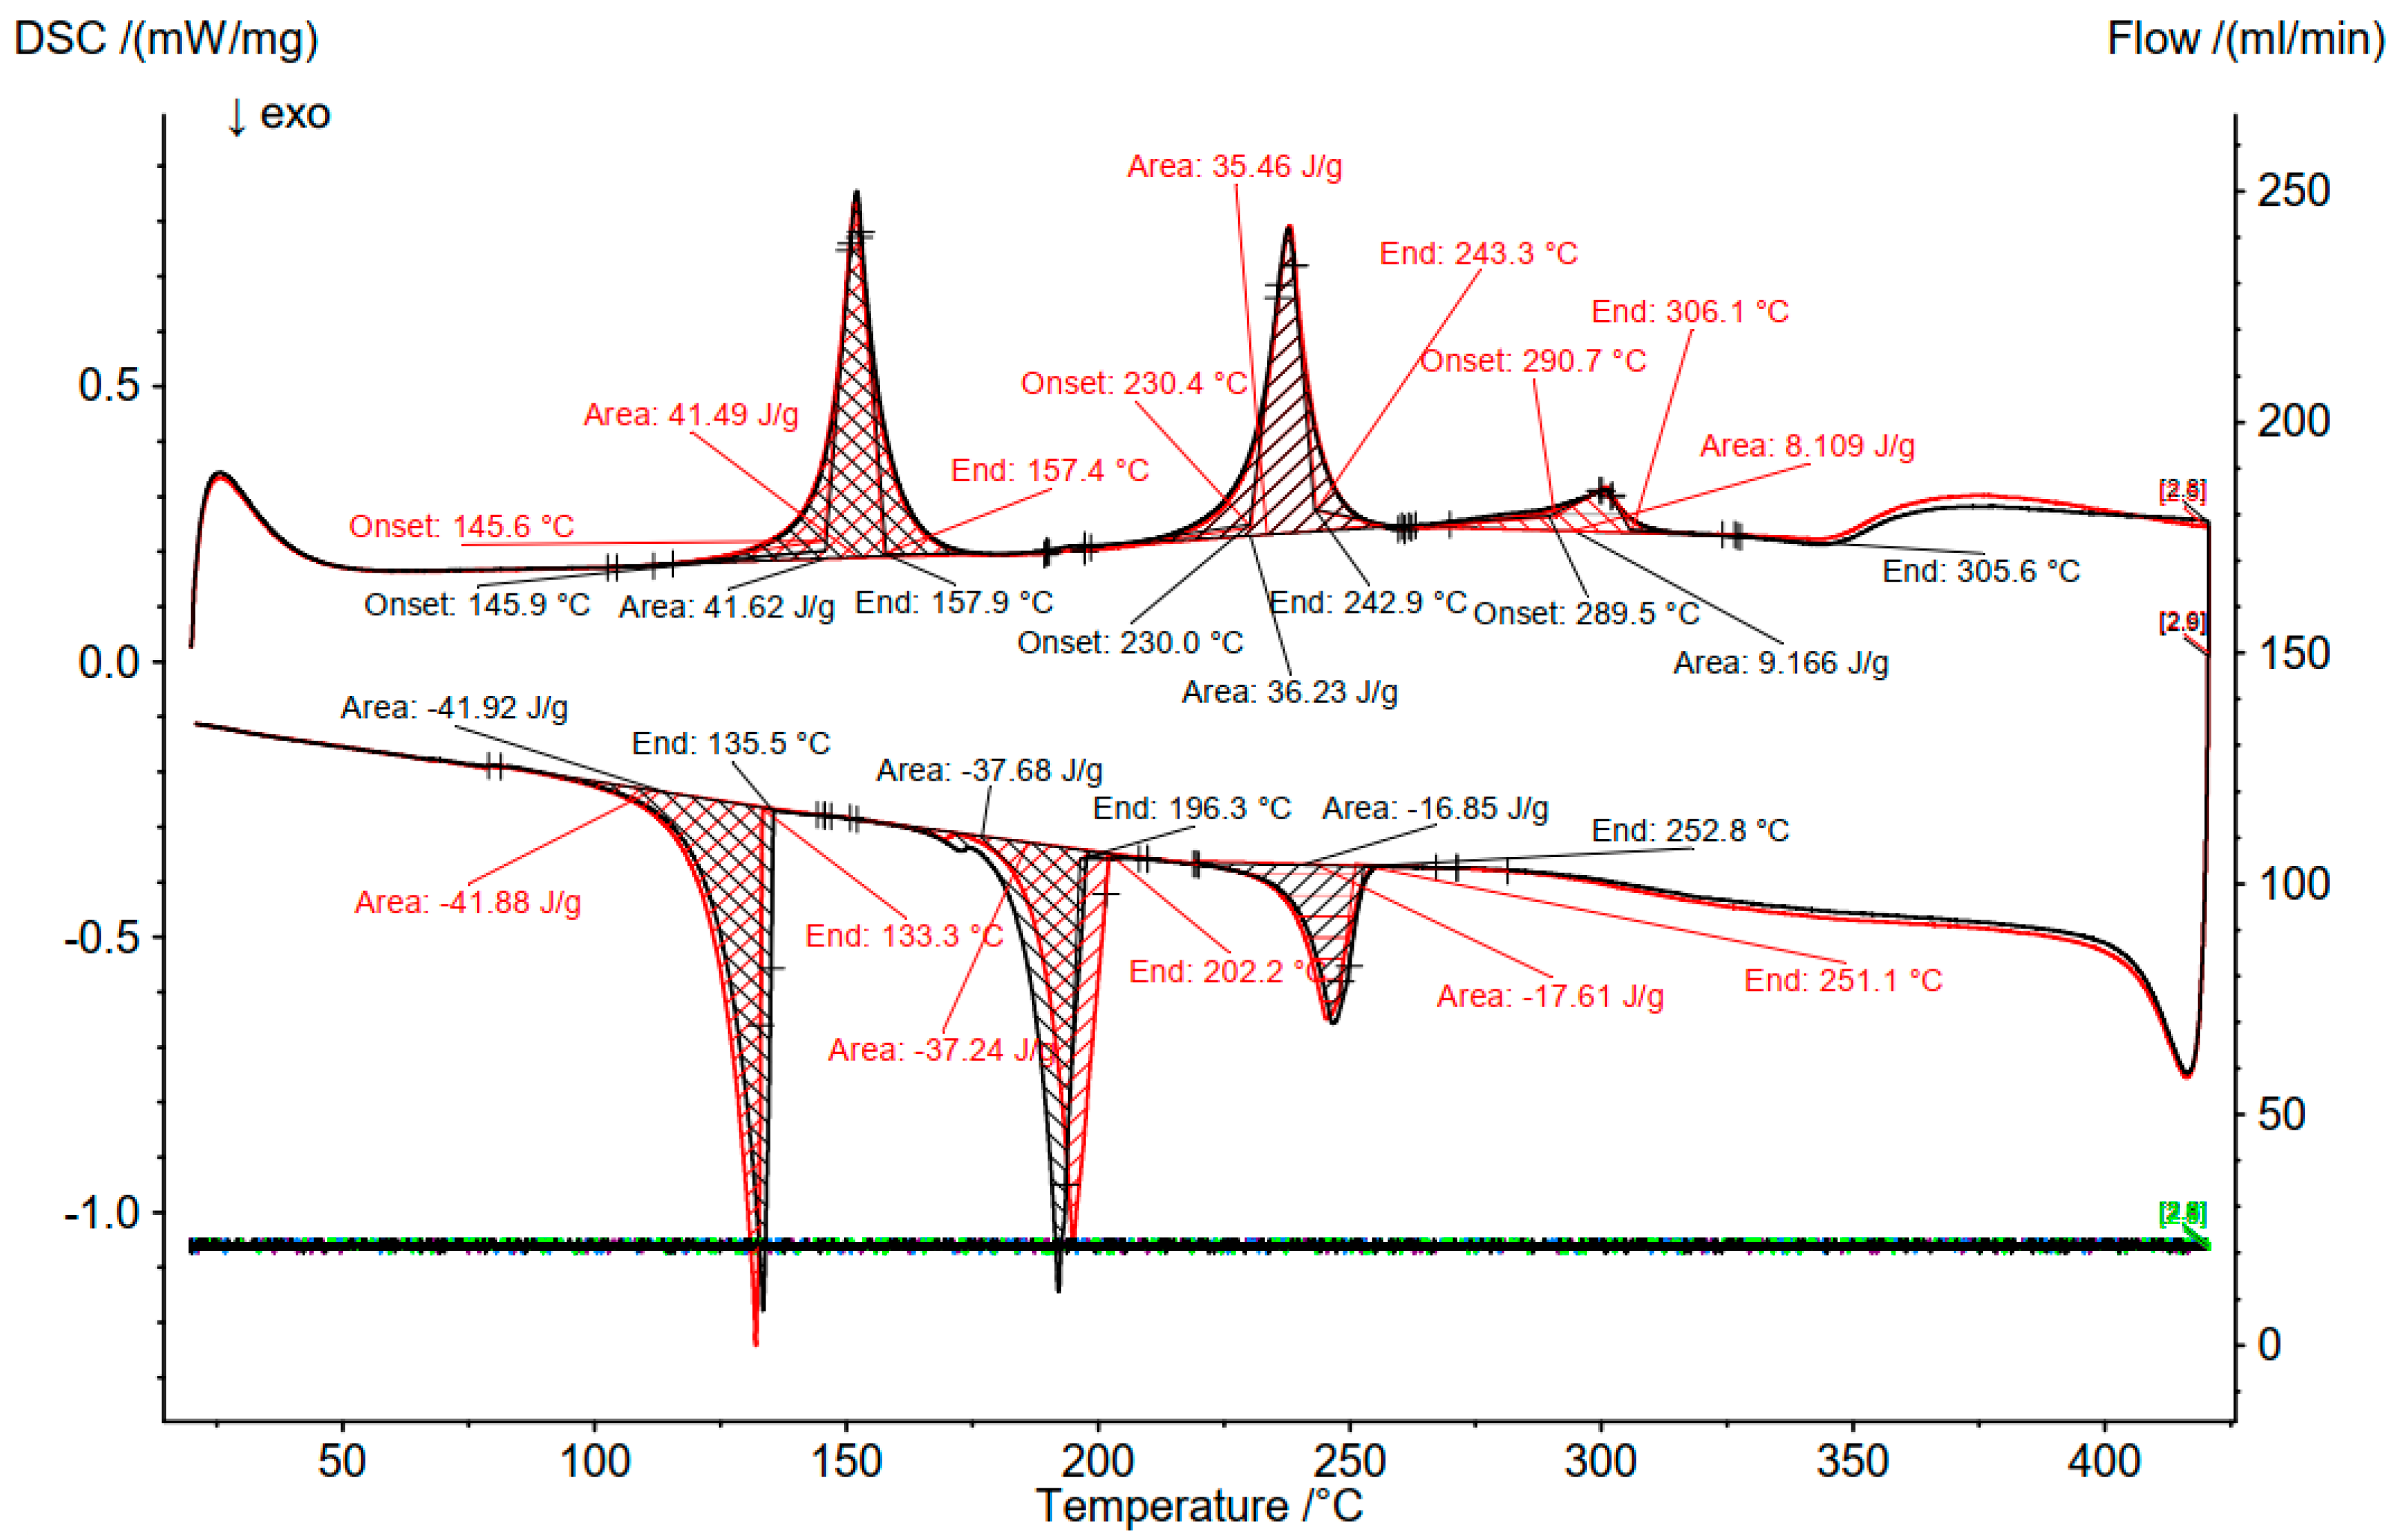
3.2. Differential Scanning Calorimetry (DSC)

To further check the simulated phase diagrams from FactSageTM, DSC is used to determine the phase change temperatures at different salt compositions in Table 1. Some representative DSC curves are shown in Figure 4, Figure A2, Figure A3, Figure A4, Figure A5 and Figure A6. Performing three heating-cooling cycles, the second and third cycles of all the DSC curves were found to be almost identical with ±1.5 °C difference. The DSC curves for Salt Sample No. 1 in Table 1 is shown in Figure 4b. The red curves in the figures are showing the second cycle and the black curves represent the third cycle of DSC. The onset temperatures of heat adsorption peaks are recorded to be the starting temperatures of the phase change (i.e., melting temperatures). The DSC results of all the salt compositions in Table 1 are summarized in Table 2 for comparison. The DSC results are presented after taking the average of the 2nd and 3rd cycle.
Moreover, the simulated results on the melting process obtained by FactSageTM for sample No. 1 and 2 are shown in Figure 4a. FactSageTM simulation shows that for high ZnCl2 concentration (sample No. 1: 15.0-77.5-7.5 mol% AlCl3-ZnCl2-(NaCl)2), the first compound melting is NaAlCl4 at 155 °C followed by the melting of Na2ZnCl4 at 239 °C, ZnCl2 at 299 °C, and finally mix of the two salt liquids (NaAlCl4 and Na2ZnCl4) at 395 °C. The DSC diagram in Figure 4b (sample No. 1) shows four main peaks with the onset temperatures of 152, 223, 304 and 348.9 °C (FactSageTM overestimates the last temperature) in the heating curve, which is in good agreement with the simulation.
Similarly, in Figure 4a for lower ZnCl2 concentration (sample No. 2: 15-55-30 mol% AlCl3-ZnCl2-(NaCl)2), the first compound melting is NaAlCl4 at 154 °C followed by the melting of Na2ZnCl4 at around 239 °C and the mixing of liquid NaAlCl4 and Na2ZnCl4 at around 290 °C. Figure 4c shows three main peaks with the onset temperatures of 152, 216 and 362 °C (FactSageTM underestimates the last temperature) in the heating curve. Unlike in the case of the Na-NiCl2 ZEBRA cell, the presence of multiple phases (some salts such as Na2ZnCl4 with melting temperatures <300 °C) creates different reaction products and leads to different reaction mechanism during charging and discharging cycles at 300 °C, as also shown by the earlier studies [9,10,11,12,13,14,15]. In Table 2, the results of OptiMeltTM for samples No. 1–6 are summarized and compared with the DSC results. For all the salt compositions, the DSC results are in good agreement with the thermodynamic simulations. The deviation of the melting temperatures of the main species such as NaAlCl4 and Na2ZnCl4 is smaller than 10 °C.

3.3. Comparison of DSC and OptiMeltTM

In order to validate the results obtained from DSC, OptiMeltTM analysis was conducted at three different AlCl3 concentrations, i.e., samples No. 1–6. As OptiMeltTM is a visual analysis technique (not as accurate as DSC) and samples No. 7–11 exhibit compositions similar to samples No. 5 and 6 (all contain about 35 mol% AlCl3), the OptiMeltTM analysis was performed on samples No. 1–6 only in this work. The results of the thermodynamic simulation and DSC show that the melting process of NaAlCl4 starts at approx. 154 °C at different AlCl3 mol% in the tested salt mixtures. Figure 5a,b show the solid salt mixtures below first transition temperature (154 °C). As soon as the temperature reached 154 °C, the salt mixture started to melt (see Figure 5c,d). Moreover, it can also be noticed at 160 °C (Figure 5c) that the amount of the solid salts decreased with the increase in AlCl3 mol%. This can be explained with a larger amount of NaAlCl4 formed when more AlCl3 is present in the salt mixture. NaAlCl4 has a low melting point of 150 °C as also confirmed by the phase diagram (see Figure 3). It can also be seen that samples No. 1, 3 and 5 in Table 1 have a large amount of ZnCl2 present in the mixture and hence the solid salts are also in lower quantity at 300 °C (OptiMeltTM images are not shown here) because of the lower melting point at a higher ZnCl2 concentration (melting of Na2ZnCl4 at about 240 °C), similar to what we observe in the pseudo-binary phase diagrams in Figure 3. Overall, as summarized in Table 2, although the results of OptiMeltTM experiments are not as accurate as DSC due to visual inspection, the results are comparable to those of DSC, and can give valuable information on, e.g., the amount of the remaining solid salt particles.

3.4. Vapor Pressure Simulation

First, to know how accurately the thermodynamic simulation of FactSageTM can predict the vapor pressure of the AlCl3-NaCl-ZnCl2 system, the vapor pressures of AlCl3-NaCl (58–42 mol%) mixture and pure AlCl3 from the literature [19] were compared with the vapor pressures simulated with FactSageTM (see Figure A1 in the Appendix A). The thermodynamic simulation shows a good correlation, with only a marginal difference of ±1.5% error for pure AlCl3. Moreover, the vapor pressures of AlCl3-NaCl and pure AlCl3 increase significantly with increasing temperature, e.g., from 0.06 atm at 200 °C to about 0.2 atm at 250 °C for AlCl3-NaCl.
For the AlCl3-ZnCl2-NaCl salt mixture, increasing AlCl3 and ZnCl2 content, and the temperature can significantly increase the vapor pressure of the salt mixture [24]. For safe operation of the Na-ZnCl2 battery, a maximum allowed vapor pressure of 1 atm is assumed in this work for a preliminary study with the simulation. To estimate the maximum amount of AlCl3 that can be used inside the battery at different temperatures, a worst-case scenario of overcharging is considered inside the cathode such that NaCl will be fully consumed (i.e., only AlCl3 and ZnCl2 will remain in the salt mixture). Figure 6 illustrates that increasing the AlCl3 concentration in the electrolyte leads to a substantial increase in vapor pressure. This can be explained with the lower melting temperature and thus faster vapor pressure increase in AlCl3-containing species such as NaAlCl4 than other species (See Table 2 and Figure A1) [22]. It is also important to note that for 35 mol% AlCl3 at a SOC of 137%, the salt vapor pressure exceeds the 1 atm limit at >500 °C. Moreover, when the secondary salt electrolyte contains 40 mol% AlCl3, the simulated salt vapor pressure at 400 °C is about 0.9 atm, not exceeding 1 atm. This means that if only considering the salt vapor pressure, the battery with <40 mol% AlCl3 in the salt electrolyte could safely work below 400 °C. Please note that due to strong hygroscopicity of the NaAlCl4 salt, some hydrated water could exist in the secondary salt electrolyte. The hydrated water can lead to a higher vapor pressure than the simulated salt vapor pressure in Figure 6, and also corrosion problem. Thus, it is strongly suggested to consider the effect of the salt vapor pressure and presence of water in the salt on the battery safety and lifetime.

4. Conclusions

In this work, thermodynamic simulation of the phase diagrams with FactSageTM and thermal analysis methods such as differential scanning calorimetry (DSC) and OptiMeltTM were used to in-depth investigate the AlCl3-NaCl-ZnCl2 secondary salt electrolyte in the Na-ZnCl2 solid electrolyte battery. The main results are summurized below:
  • The simulation results (e.g., phase diagrams and vapor pressures of salt mixtures) via FactSageTM are in good agreement with the experimental results from DSC and OptiMeltTM in this work and from the literature. The deviation of the melting temperatures of the main species such as NaAlCl4 and Na2ZnCl4 between simulations and experiments is smaller than 10 °C.
  • From the phase diagrams it is concluded that AlCl3 is needed to be present in the secondary salt electrolyte to ensure enough liquid salt existing during charging/discharging for low resistance of the battery, since the high resistance due to the secondary salt electrolyte leads to bad battery performance.
  • With increasing concentration of ZnCl2 at higher SOC, the melting temperature of the secondary salt electrolyte decreases significantly, since Na2ZnCl4 (about 240 °C) has much lower melting temperature than NiCl2. As a result of replacement of Ni with Zn, active materials (ZnCl2 and NaCl) should be present in the liquid state over a wider SOC range during battery cell cycling compared to classical Na-NiCl2 ZEBRA cells.
  • Increasing molar fraction of AlCl3 has both positive and negative effect on the salt electrolyte. On one hand it can decrease the melting point and increase the ionic conductivity at lower temperatures, which could improve the battery performance, but on other hand it can increase the vapor pressure and could affect the battery costs, life span and safety (e.g., mechanical stability of the BASE electrolyte, cell pressure management). Moreover, increasing AlCl3 can lead to more challenges such as corrosion of sealing.
  • It is suggested in future work to determine the optimal concentration of AlCl3 in the secondary salt electrolyte regarding the performance and storage cost of the battery, based on phase diagrams, vapor pressure, charging/discharging range, compatibility with other materials in the battery, etc.
  • The salt vapor pressures vs. temperature and mol% AlCl3 in AlCl3-ZnCl2-NaCl were simulated. Considering the rapid increase in salt vapor pressure at high temperatures and AlCl3 content, it is strongly recommended to consider the impact of salt vapor pressure on battery safety and pressure management. The maximum allowable temperature is suggested to 400 °C for safe operation of the cell with the secondary salt electrolyte (AlCl3 < 40 mol%).
  • The reliable simulation results in this study, including phase diagrams and vapor pressures, show promise in assisting battery cell design and enhancement. Tests on a Na-ZnCl2 test cell, based on the suggested electrolyte composition, reveal a three-step charging and discharging behavior consistent with our predicted phase diagram. Further insights into the Na-ZnCl2 battery system’s performance will be published in an upcoming paper.

Author Contributions

Conceptualization, S.K. and W.D.; methodology, S.K.; validation, S.K. and R.H.; investigation, S.K. and R.H.; data curation, S.K.; writing—original draft preparation, S.K. and W.D.; writing—review and editing, R.H., L.S., M.V.F.H., N.W. and A.B.; supervision, W.D.; project administration, W.D.; funding acquisition, W.D. and A.B. All authors have read and agreed to the published version of the manuscript.

Funding

This work is part of the ‘Solstice’ project which received funding from the European Union’s Horizon 2020 research and innovation programme under grant agreement No 963599.

Data Availability Statement

Data is available on request.

Conflicts of Interest

The authors declare no conflict of interest.

Appendix A

Figure A1. Comparison between the simulated and the literature vapor pressures: AlCl3-NaCl (58–42 mol%) (top), pure AlCl3 (bottom) [18].
Batteries 09 00401 g0a1aBatteries 09 00401 g0a1b
Figure A2. DSC curve of the 0% SOC salt electrolyte (S. No. 7 in Table 2) of the EMPA test cell. Red curve: second cycle; Black curve: third cycle.
Batteries 09 00401 g0a2
Figure A3. DSC curve of the 50% SOC salt electrolyte (S. No. 8 in Table 2) of the EMPA test cell. Red curve: second cycle; Black curve: third cycle.
Batteries 09 00401 g0a3
Figure A4. DSC curve of the 76.5% SOC salt electrolyte (S. No. 9 in Table 2) of the EMPA test cell. Red curve: second cycle; Black curve: third cycle.
Batteries 09 00401 g0a4
Figure A5. DSC curve of the 87.6% SOC salt electrolyte (S. No. 10 in Table 2) of the EMPA battery cell. Red curve: second cycle; Black curve: third cycle.
Batteries 09 00401 g0a5
Figure A6. DSC curve of the 100% SOC salt electrolyte (S. No. 11 in Table 2) of the EMPA battery cell. Red curve: second cycle; Black curve: third cycle.
Batteries 09 00401 g0a6

References

  1. IEA. World Energy Outlook 2022; IEA: Paris, France, 2022; Available online: https://www.iea.org/reports/world-energy-outlook-2022 (accessed on 20 July 2021).
  2. Sudworth, J.L. High-temperature battery systems. Philos. Trans. R. Soc. Lond. Ser. A Math. Phys. Eng. Sci. 1996, 354, 1595–1612. [Google Scholar]
  3. Shamim, N.; Thomsen, E.C.; Viswanathan, V.V.; Reed, D.M.; Sprenkle, V.L.; Li, G. Evaluating ZEBRA Battery Module under the Peak-Shaving Duty Cycles. Materials 2021, 14, 2280. [Google Scholar] [CrossRef] [PubMed]
  4. Wang, Y.; Zhou, D.; Palomares, V.; Shanmukaraj, D.; Sun, B.; Tang, X.; Wang, C.; Armand, M.; Rojo, T.; Wang, G. Revitalising sodium–sulfur batteries for non-high-temperature operation: A crucial review. Energy Environ. Sci. 2020, 13, 3848–3879. [Google Scholar] [CrossRef]
  5. Sudworth, J.L. The sodium/nickel chloride (ZEBRA) battery. J. Power Sources 2001, 100, 149–163. [Google Scholar] [CrossRef]
  6. Böhm, H.; Beyermann, G. ZEBRA batteries, enhanced power by doping. J. Power Sources 1999, 84, 270–274. [Google Scholar] [CrossRef]
  7. 2023 Company Profile of FZSoNick. Available online: https://drive.google.com/file/d/1yrmnzXKIolegXySwIu9-E5thOUHtb72k/view (accessed on 15 June 2023).
  8. Van Zyl, A. Review of the zebra battery system development. Solid State Ion. 1996, 86, 883–889. [Google Scholar] [CrossRef]
  9. Lu, X.; Li, G.; Kim, J.Y.; Lemmon, J.P.; Sprenkle, V.L.; Yang, Z. A novel low-cost sodium–zinc chloride battery. Energy Environ. Sci. 2013, 6, 1837–1843. [Google Scholar] [CrossRef]
  10. Galloway, R.C.; Dustmann, C.H. ZEBRA battery-material cost availability and recycling. In Proceeding of the International Electric Vehicle Symposium (EVS-20), Long Beach, CA, USA, 15–19 November 2003. [Google Scholar]
  11. Shaw, S.J.; George, S.P. NaCl-ZnCl2 phase diagram. Thermochim. Acta 1990, 157, 329–333. [Google Scholar] [CrossRef]
  12. Landmann, D.; Svaluto-Ferro, E.; Heinz, M.V.; Schmutz, P.; Battaglia, C. Elucidating the rate-limiting processes in high-temperature sodium-metal chloride batteries. Adv. Sci. 2022, 9, 2201019. [Google Scholar] [CrossRef]
  13. Bones, R.J.; Teagle, D.A.; Brooker, S.D.; Cullen, F.L. Development of a Ni, NiCl2 positive electrode for a liquid sodium (ZEBRA) battery cell. J. Electrochem. Soc. 1989, 136, 1274. [Google Scholar] [CrossRef]
  14. Heinz, M.V.; Graeber, G.; Landmann, D.; Battaglia, C. Pressure management and cell design in solid-electrolyte batteries, at the example of a sodium-nickel chloride battery. J. Power Sources 2020, 465, 228268. [Google Scholar] [CrossRef]
  15. Lu, X.; Chang, H.J.; Bonnett, J.F.; Canfield, N.L.; Jung, K.; Sprenkle, V.L.; Li, G. An intermediate-temperature high-performance Na–ZnCl2 battery. ACS Omega 2018, 3, 15702–15708. [Google Scholar] [CrossRef] [PubMed] [Green Version]
  16. Lee, Y.; Kim, H.-J.; Byun, D.-J.; Cho, K.-K.; Ahn, J.-H.; Kim, C.-S. Electrochemically activated Na–ZnCl2 battery using a carbon matrix in the cathode compartment. J. Power Sources 2019, 440, 227110. [Google Scholar] [CrossRef]
  17. Godinez-Brizuela, O.E.; Niblett, D.; Einarsrud, K.E. Microstructural Analysis of Effective Electrode Conductivity in Molten Salt, Na-ZnCl2 Batteries. J. Electrochem. Soc. 2022, 169, 090510. [Google Scholar] [CrossRef]
  18. Ding, W.; Gong, Q.; Liang, S.; Hoffmann, R.; Zhou, H.; Li, H.; Wang, K.; Zhang, T.; Weisenburger, A.; Müller, G.; et al. Multi-cationic molten salt electrolyte of high-performance sodium liquid metal battery for grid storage. J. Power Sources 2023, 553, 232254. [Google Scholar] [CrossRef]
  19. Li, C.J.; Li, P.; Wang, K.; Molina, E.E. Survey of properties of key single and mixture halide salts for potential application as high temperature heat transfer fluids for concentrated solar thermal power systems. AIMS Energy 2014, 2, 133–157. [Google Scholar] [CrossRef]
  20. Zhou, H.; Li, H.; Gong, Q.; Yan, S.; Zhou, X.; Liang, S.; Ding, W.; He, Y.; Jiang, K.; Wang, K. A sodium liquid metal battery based on the multi-cationic electrolyte for grid energy storage. Energy Storage Mater. 2022, 50, 572–579. [Google Scholar] [CrossRef]
  21. Gong, Q.; Ding, W.; Bonk, A.; Li, H.; Wang, K.; Jianu, A.; Weisenburger, A.; Bund, A.; Bauer, T. Molten iodide salt electrolyte for low-temperature low-cost sodium-based liquid metal battery. J. Power Sources 2020, 475, 228674. [Google Scholar] [CrossRef]
  22. Ding, W.; Bonk, A.; Bauer, T. Molten chloride salts for next generation CSP plants: Selection of promising chloride salts & study on corrosion of alloys in molten chloride salts. AIP Conf. Proc. 2019, 2126, 200014. [Google Scholar]
  23. Ding, W.; Bonk, A.; Bauer, T. Corrosion behavior of metallic alloys in molten chloride salts for thermal energy storage in concentrated solar power plants: A review. Front. Chem. Sci. Eng. 2018, 12, 564–576. [Google Scholar] [CrossRef] [Green Version]
  24. Vignarooban, K.; Xu, X.; Wang, K.; Molina, E.; Li, P.; Gervasio, D.; Kannan, A. Vapor pressure and corrosivity of ternary metal-chloride molten-salt based heat transfer fluids for use in concentrating solar power systems. Appl. Energy 2015, 159, 206–213. [Google Scholar] [CrossRef] [Green Version]
Figure 1. Schematic of state-of-thee-art (Na-NiCl2, (left)) and next-generation (Na-ZnCl2, (right)) ZEBRA battery with solid electrolyte in charging. Multi-phase cathode region contains cathode metal (Ni or Zn) and secondary salt electrolyte (liquid and solid salts).
Batteries 09 00401 g001
Figure 2. Ternary phase diagram of AlCl3-ZnCl2-(NaCl)2 at 300 °C. The points on the phase diagram represents the salt compositions of DSC (SOC: 0–100%, Samples No. 7–11 in Table 1).
Batteries 09 00401 g002
Figure 3. Pseudo-binary ZnCl2–(NaCl)2 phase diagrams with increasing AlCl3 from 0 to 55 mol%: (a) without AlCl3 (0 mol%); (bf): with a stepwise increase in 10 mol% of AlCl3 from 15 to 55 mol%. The minimum molar fraction of ZnCl2 for the fully liquid state (i.e., the salt mixture is completely liquid) at 300 °C is pointed out with a red point in the phase diagram.
Batteries 09 00401 g003aBatteries 09 00401 g003b
Figure 4. (a) Pseudo-binary ZnCl2–(NaCl)2 phase diagram with 15 mol% AlCl3, in which samples No. 1 and 2 of DSC tests and their phase change temperatures are shown; (b) DSC curve of 15.0-77.5–7.5 mol% AlCl3–ZnCl2–(NaCl)2. (c) DSC curve of 15-55-30 mol% AlCl3–ZnCl2–(NaCl)2. Red curve: second cycle; Black curve: third cycle.
Batteries 09 00401 g004aBatteries 09 00401 g004b
Figure 5. OptiMeltTM images for sample No. 1 to 6 (left to right). (a,b): before melting; (c,d): start of melting.
Batteries 09 00401 g005
Figure 6. Effect of increasing AlCl3 content (5–45 mol%) and temperature on vapor pressure of secondary electrolyte in the worst-case scenario (without NaCl in the AlCl3-ZnCl2-NaCl). The red line represents the maximum allowed vapor pressure of the salt electrolyte (1 atm) assumed in this work for a preliminary study.
Batteries 09 00401 g006
Table 1. Salt mixtures with selected compositions analyzed by DSC.
Sample No.SOC (%)AlCl3-ZnCl2-(NaCl)2 (mol%)
110015:77.5:7.5
27115:55:30
310025:62.5:12.5
44825:30:45
510035:47.5:17.5
64235:20:45
7 034.9:0:65.1
85034.9:23.8:41.3
976.534.9:36.5:28.6
1087.634.9:41.8:23.4
1110034.9:47.7:17.4
Table 2. Table comparing the FactSageTM and DSC results for 11 salt samples.
Sample No.AlCl3ZnCl2(NaCl)2FactsageTMDSCOptiMelt
mol%mol%mol%TTransition (°C)TOnset (°C)TStart (°C)
11577.57.5155 (Solidus), melting of NaAlCl4152about 150
239 (Transition), melting of Na2ZnCl4 225about 230
299 (Transition), melting of ZnCl2303-
395 (liquidus), mixing of NaAlCl4 and Na2ZnCl4349-
2155530154 (Solidus)152about 150
239 (Transition)216Continue melting
290 (liquidus)362
32562.512.5155 (Solidus)151about 150
200 (Transition)200about 230
260 (Transition)- Cont. melting
300 (liquidus)303
4253045154 (Solidus)153about 152
379 (liquidus)360Cont. melting
53547.517.5155 (Solidus)152about 150
200–260 (Transition)204about 230
300 (liquidus)303.7Cont. melting
6352045154 (Solidus)153about 152
379 (liquidus)341.5Cont. melting
7 (SOC 0%)34.890 65.11155 (Solidus)152.6Not measured
8 (SOC 50%)34.8923.83 41.28155 (Solidus)150.7
230 (Transition)204.5
345 (liquidus)349.5
9 (SOC 76.5%)34.8936.4728.65155 (Solidus)145.3
230–245 (Transition)232.5
345 (liquidus)349.5
10 (SOC 87.6%)34.8941.7623.35155 (Solidus)145.8
235–260 (Transition)230.2
295 (liquidus)290.1
11 (SOC 100%)34.8947.6717.44155 (Solidus)152
200 (Transition)204
300 (liquidus)303.7
Disclaimer/Publisher’s Note: The statements, opinions and data contained in all publications are solely those of the individual author(s) and contributor(s) and not of MDPI and/or the editor(s). MDPI and/or the editor(s) disclaim responsibility for any injury to people or property resulting from any ideas, methods, instructions or products referred to in the content.

