
Composition and Explosibility of Gas Emissions from Lithium-Ion Batteries Undergoing Thermal Runaway

 ,
,  , ,
, ,
Abstract
1. Introduction
2. Materials and Methods
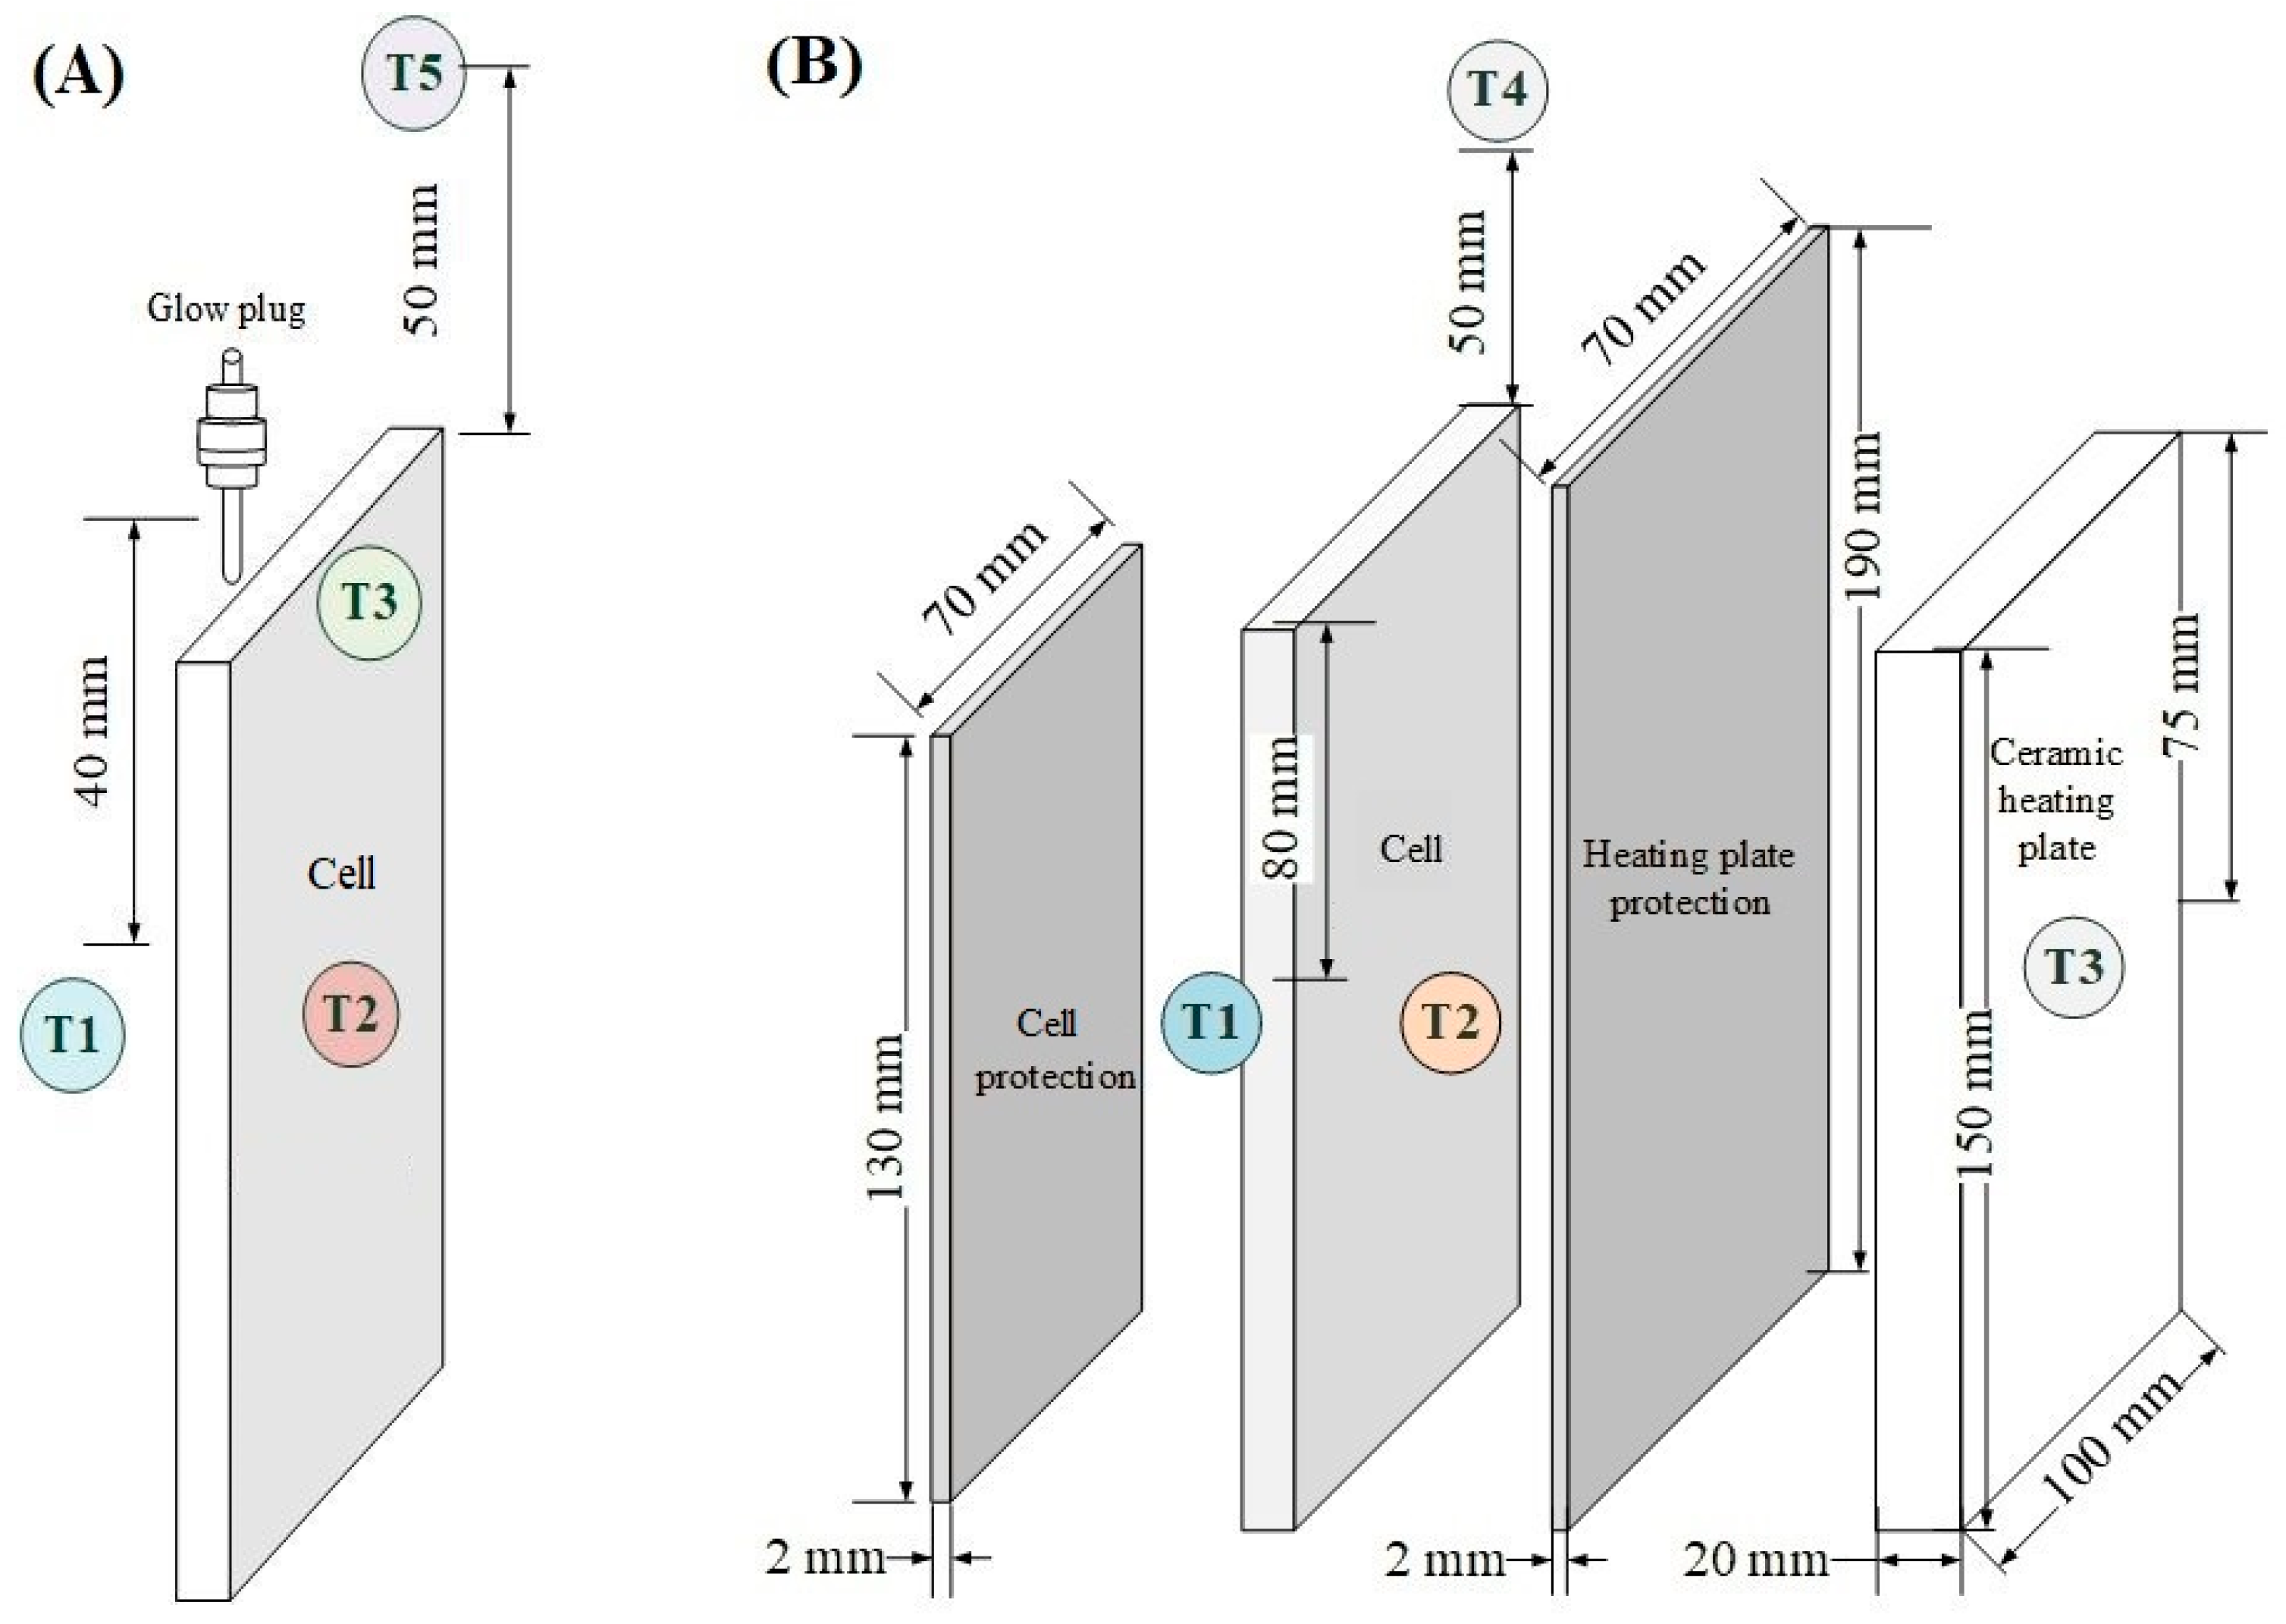
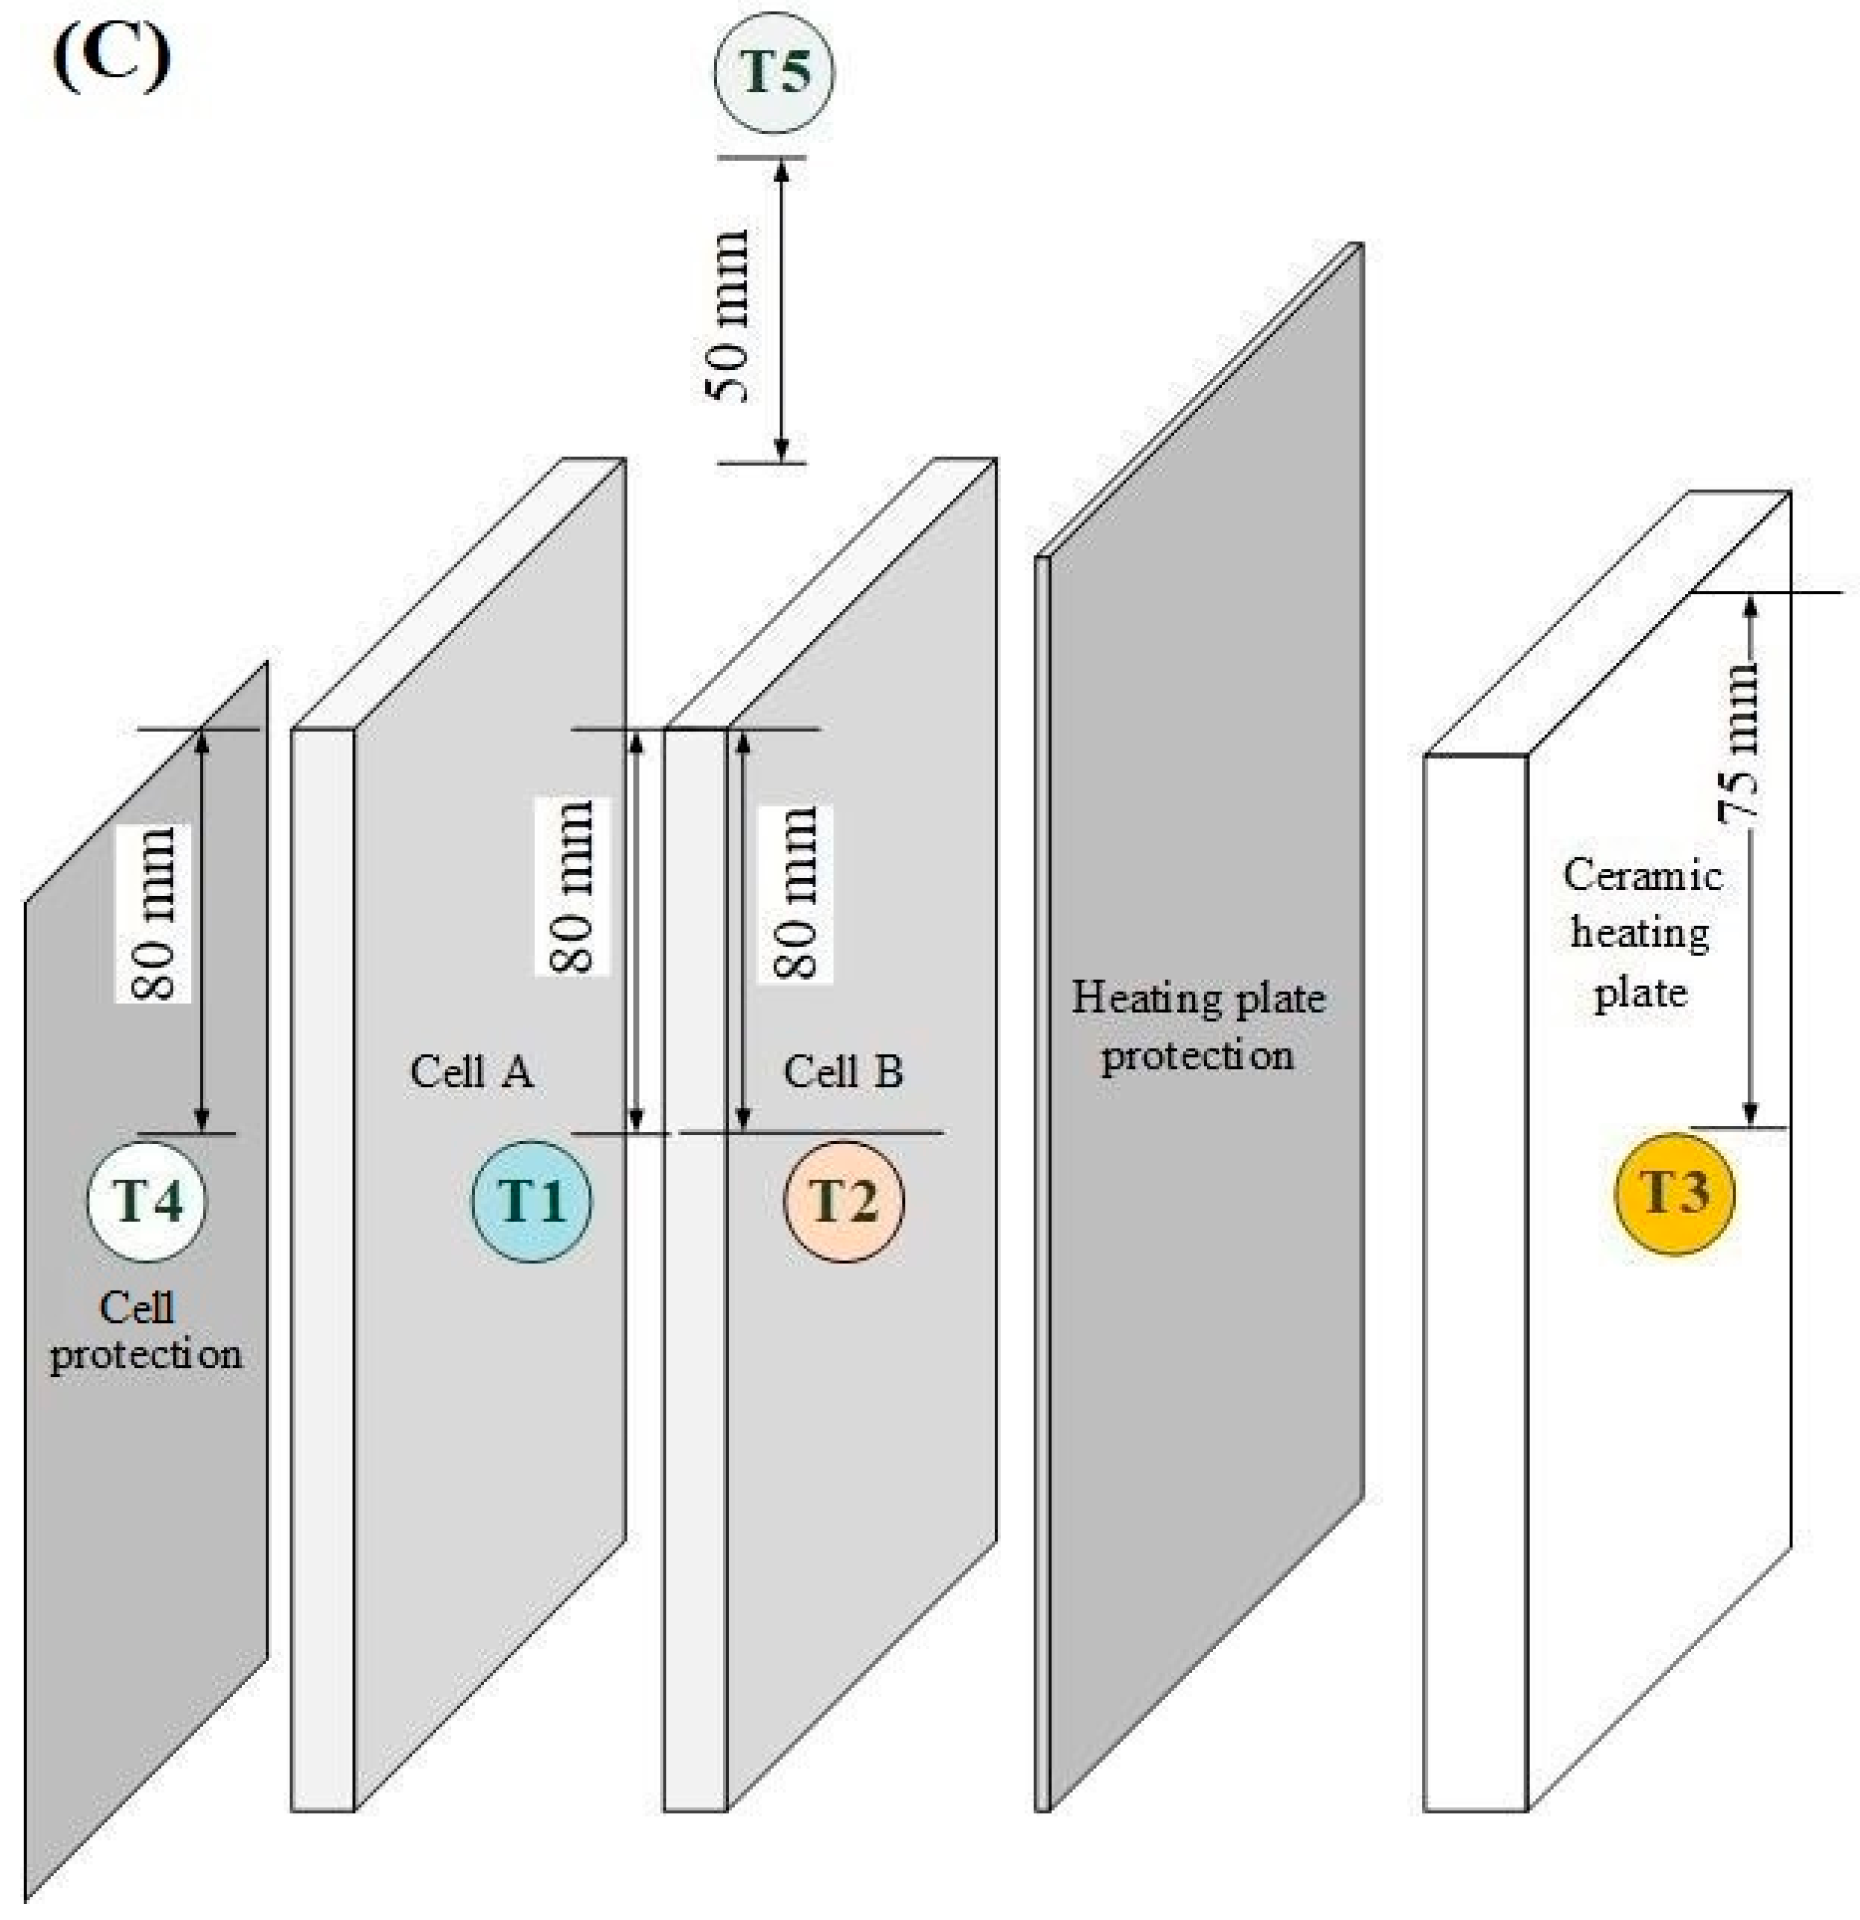
2.1. Cells
2.2. Hollo-Sphere Glass Granulate Filter
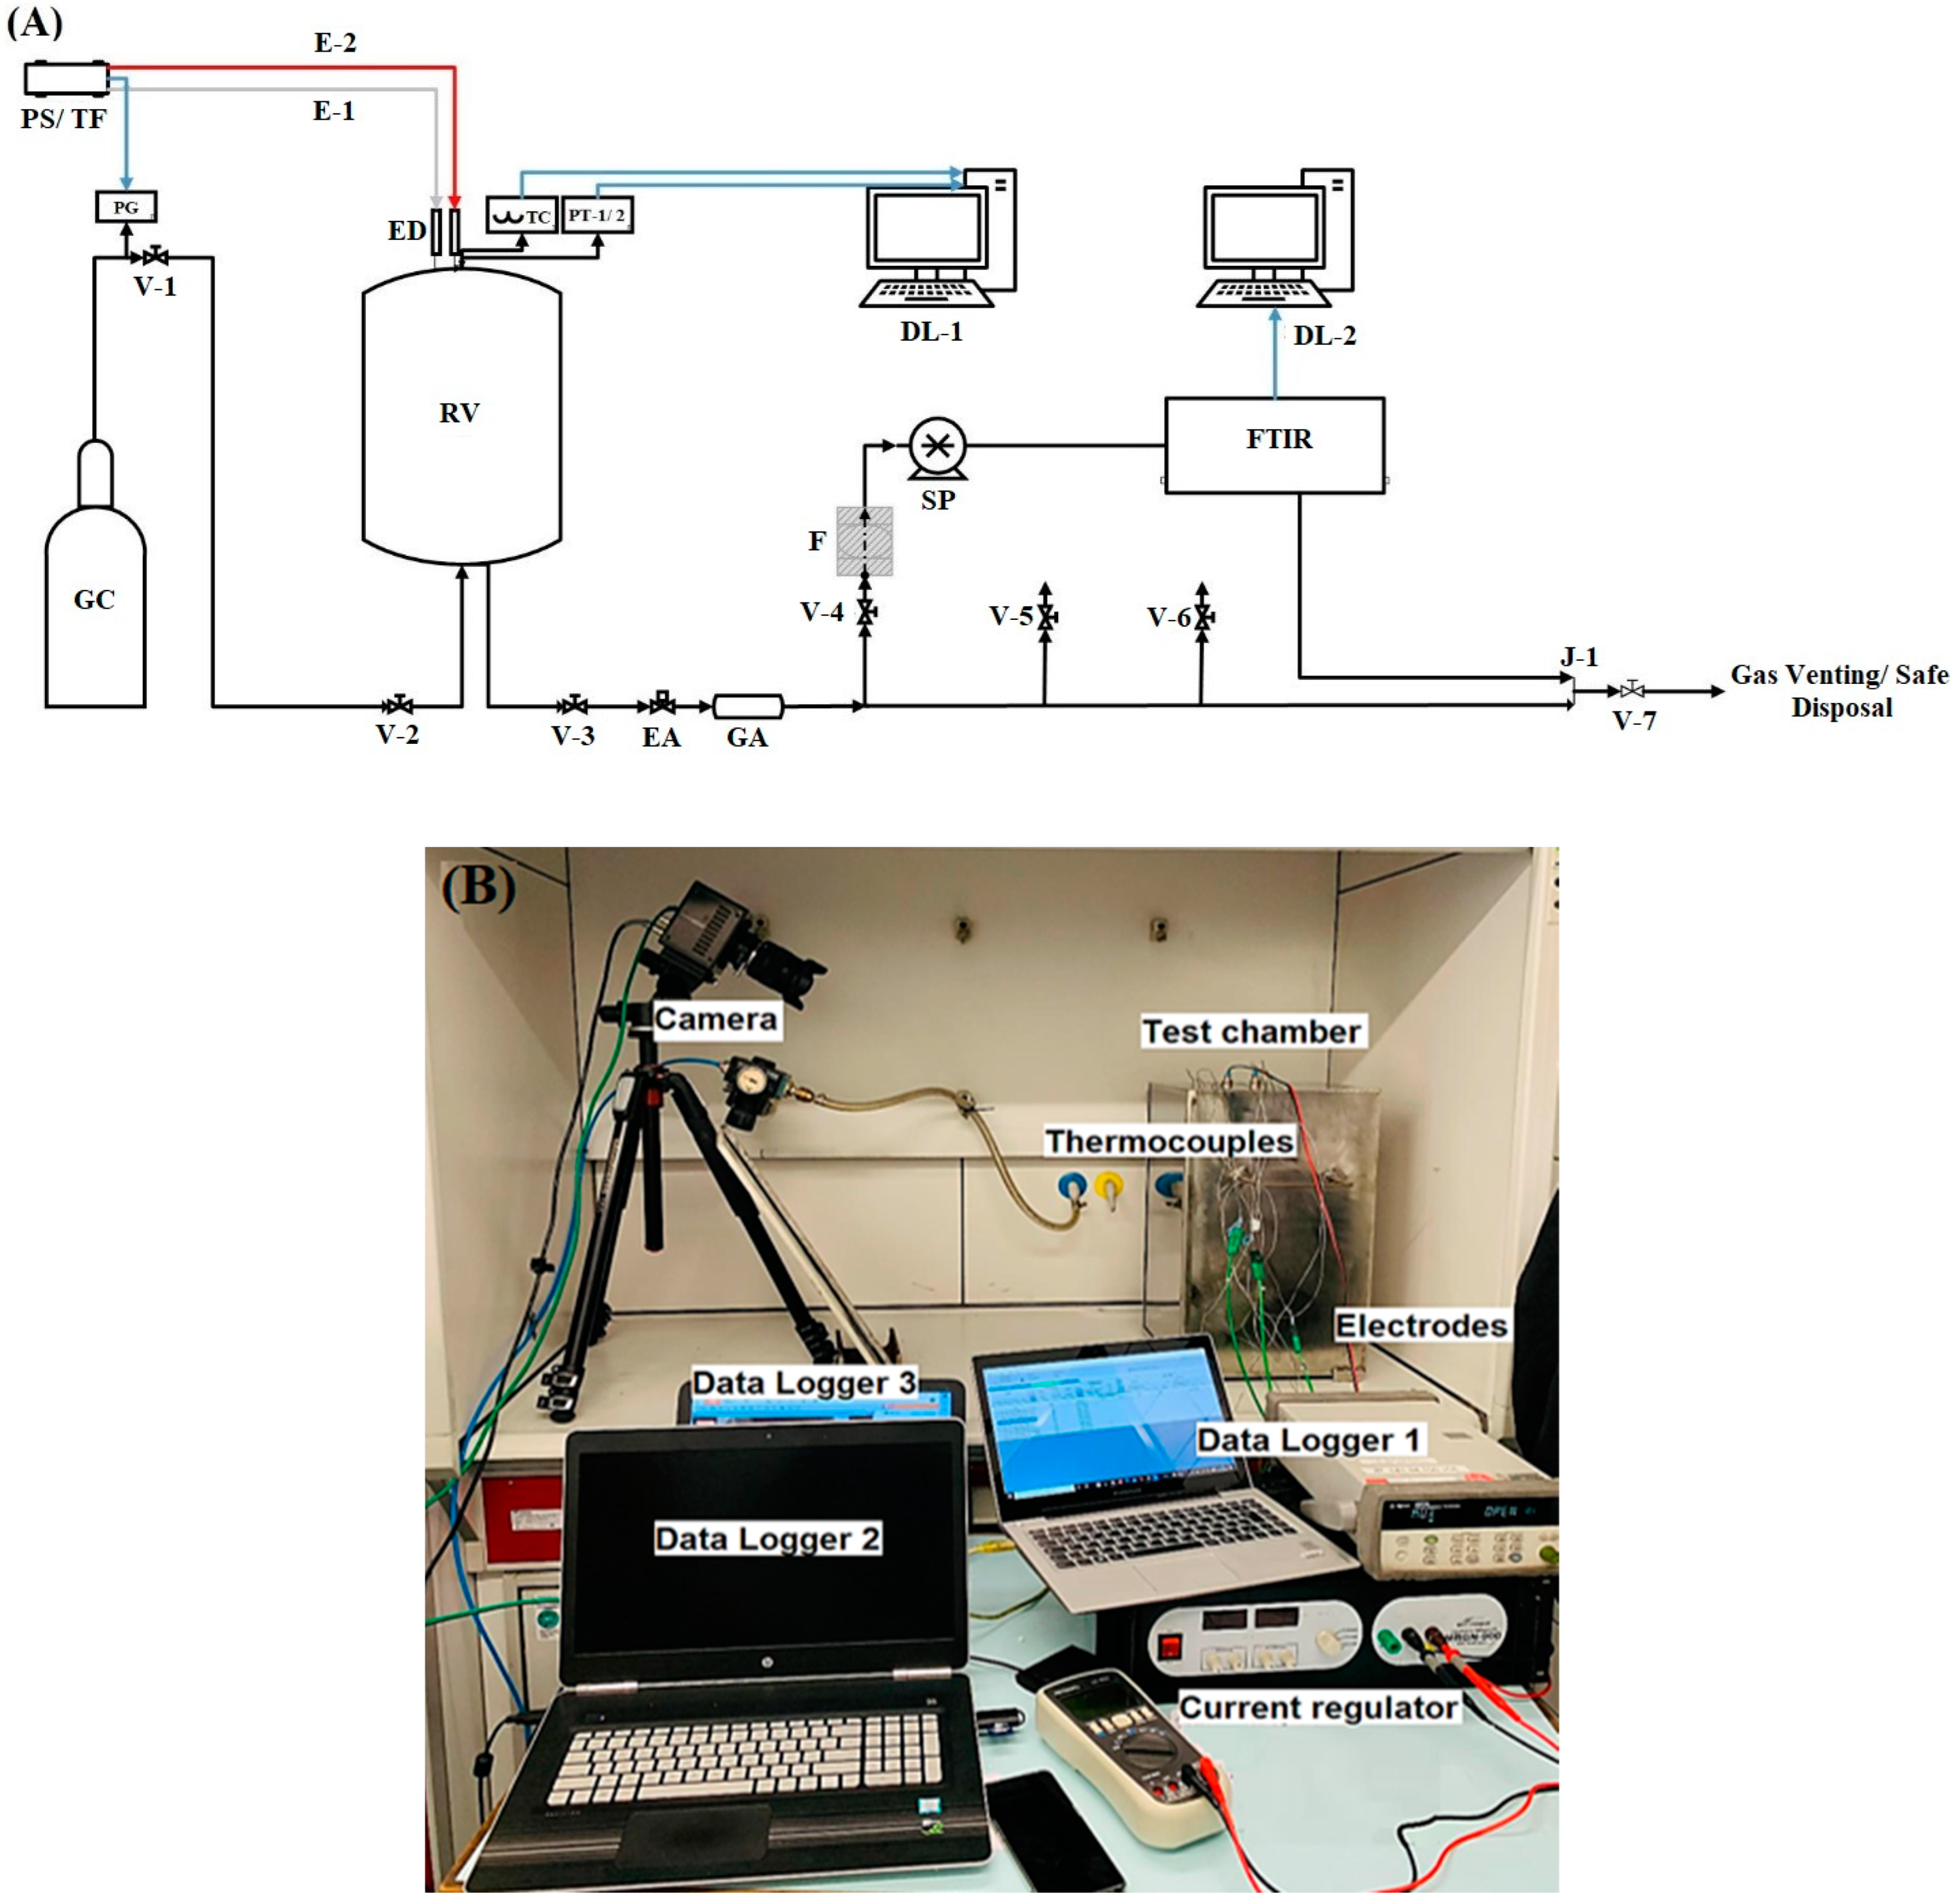
2.3. Experimental Setup
2.4. Experimental Procedure
3. Results
3.1. Thermal Runaway Behavior
3.2. Released Gases
3.3. Composition of Released Gases
3.4. Explosibility of Released Gases
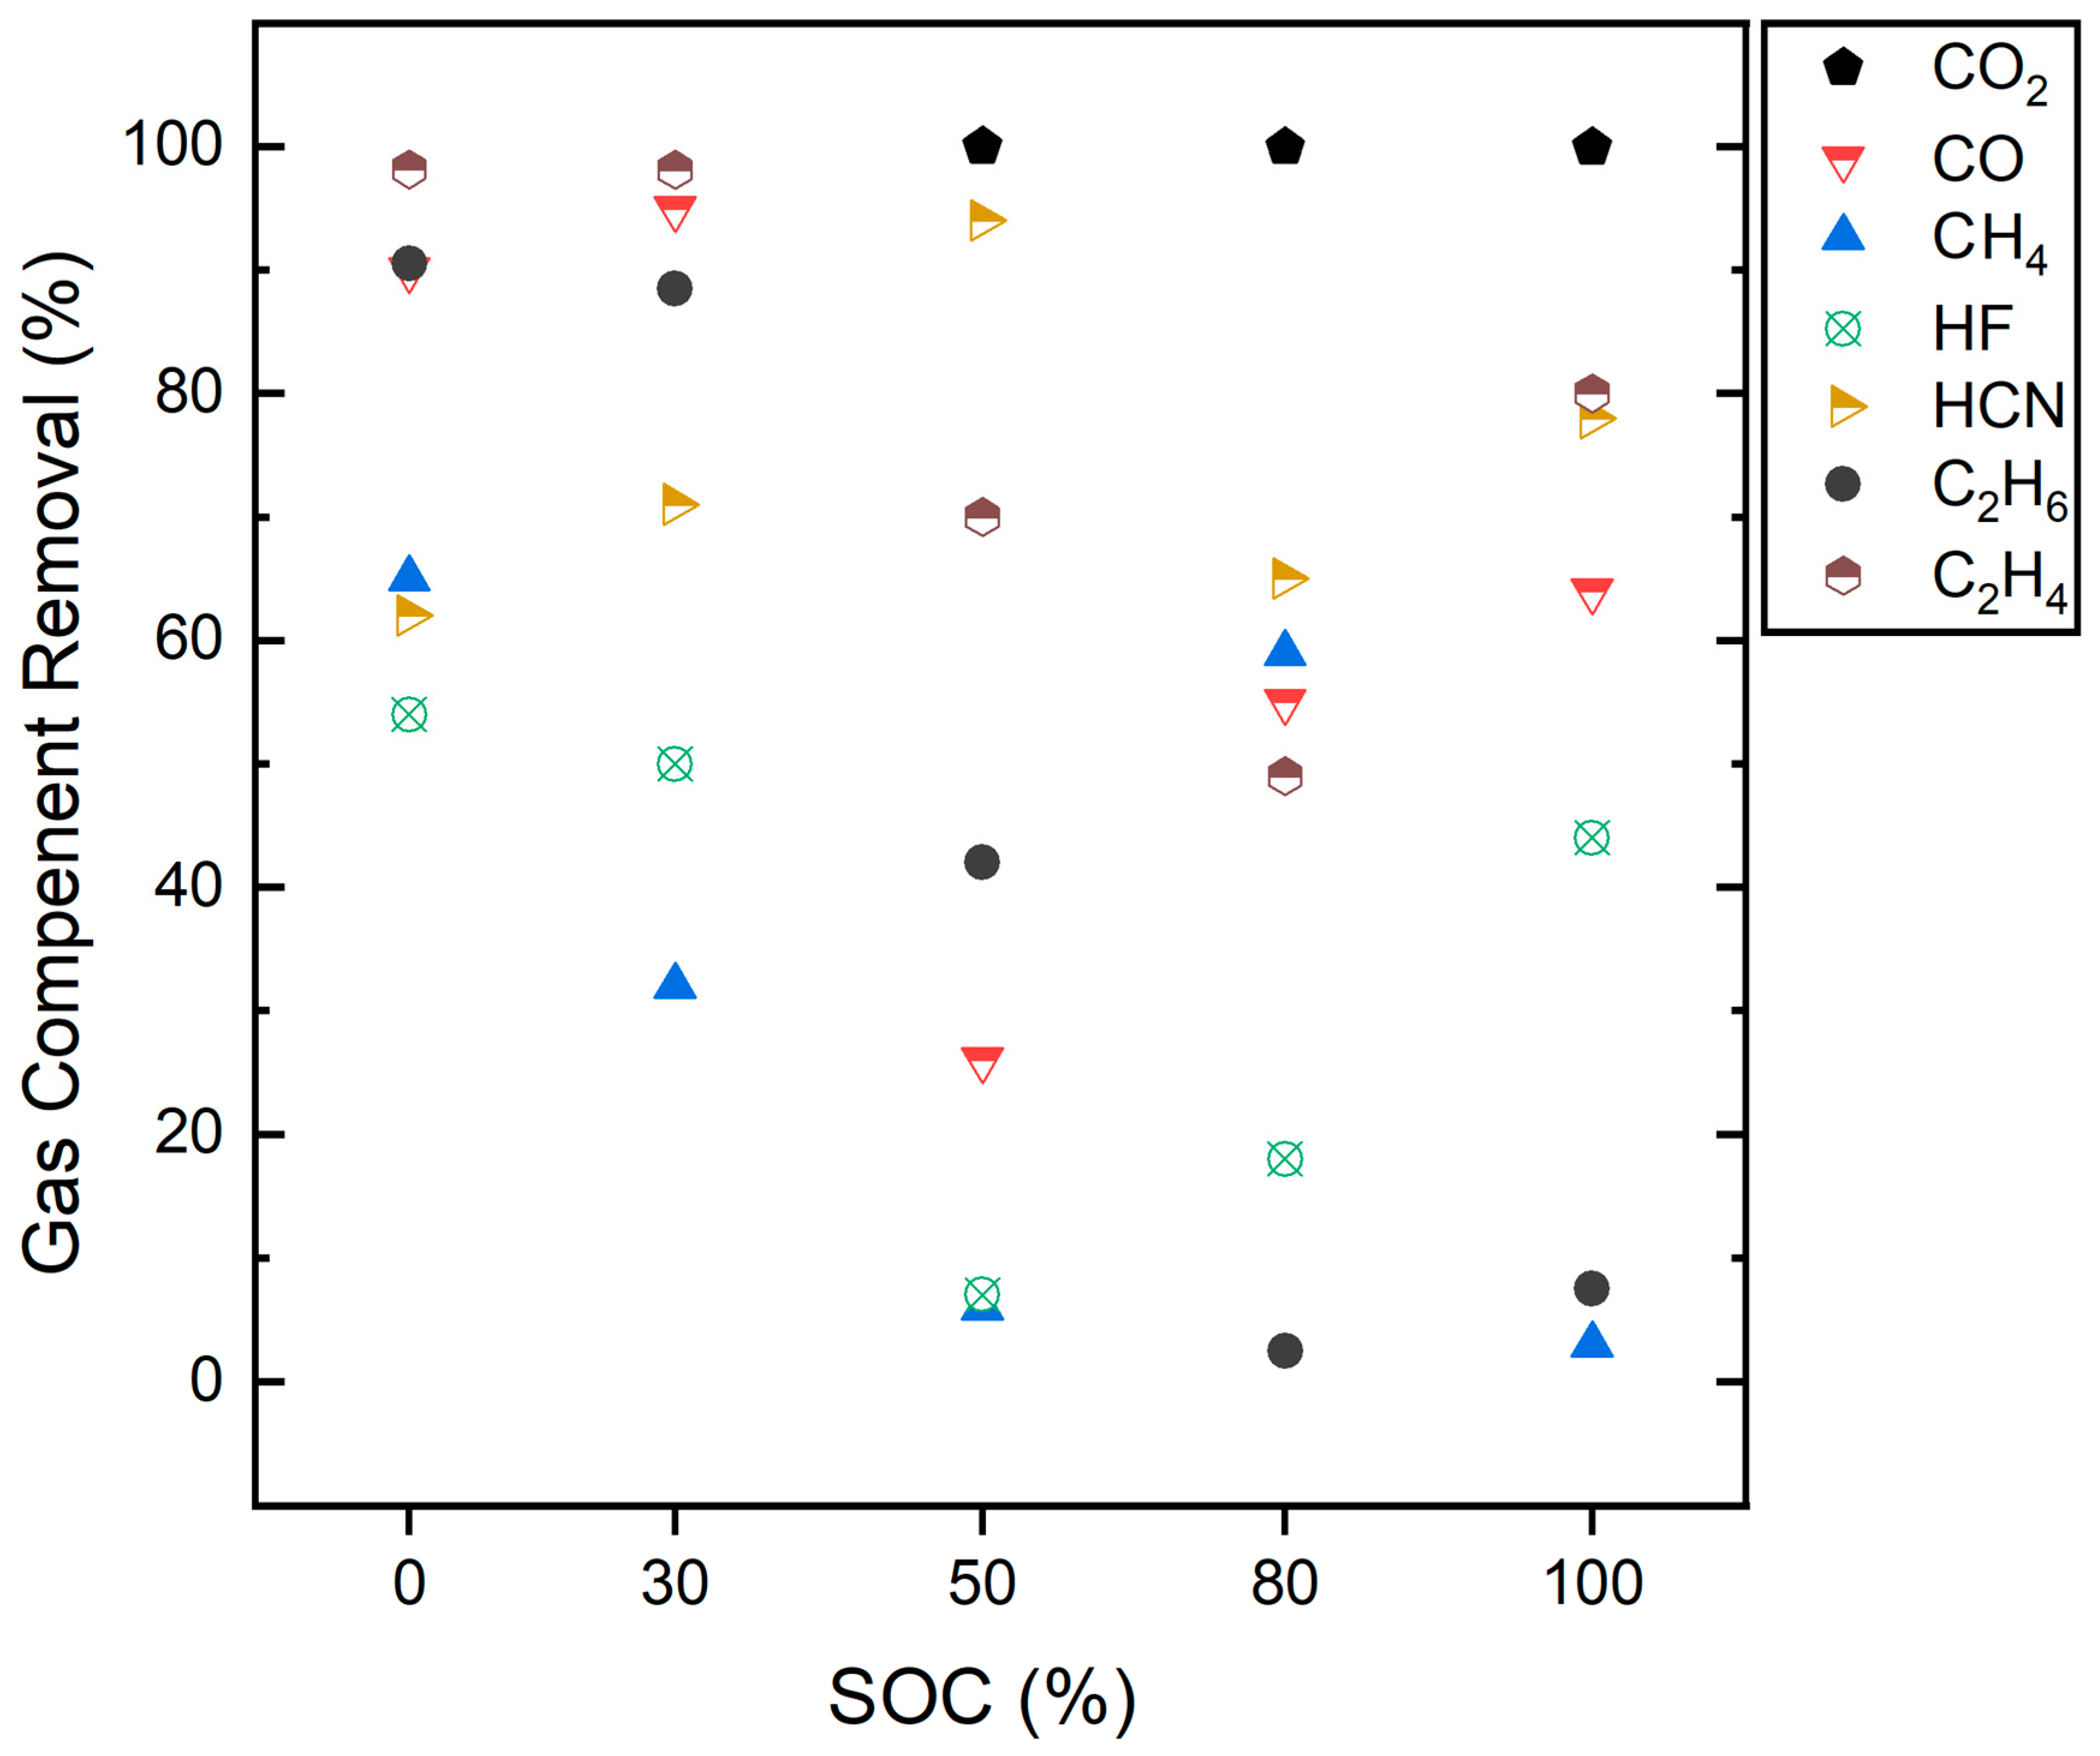
3.5. Gas Treatment with a Pyrobubble Filter
4. Conclusions
Author Contributions
Funding
Institutional Review Board Statement
Informed Consent Statement
Data Availability Statement
Conflicts of Interest
References
- Jindal, P.; Bhattacharya, J. Review—Understanding the Thermal Runaway Behavior of Li-Ion Batteries through Experimental Techniques. J. Electrochem. Soc. 2019, 166, A2165. [Google Scholar] [CrossRef]
- Spotnitz, R.M.; Weaver, J.; Yeduvaka, G.; Doughty, D.H.; Roth, E.P. Simulation of Abuse Tolerance of Lithium-ion Battery Packs. J. Power Sources 2007, 163, 1080–1086. [Google Scholar] [CrossRef]
- Golubkov, A.W.; Fuchs, D.; Wagner, J.; Wiltsche, H.; Stangl, C.; Fauler, G.; Voitic, G.; Thaler, A.; Hacker, V. Thermal-runaway Experiments on Consumer Li-ion Batteries with Metal-oxide and Olivin-type Cathodes. RSC Adv. 2014, 4, 3633–3642. [Google Scholar] [CrossRef]
- Golubkov, A.W.; Scheikl, S.; Planteu, R.; Voitic, G.; Wiltsche, H.; Stangl, C.; Fauler, G.; Thaler, A.; Hacker, V. Thermal Runaway of Commercial 18650 Li-ion Batteries with LFP and NCA Cathodes—Impact of state of charge and overcharge. RSC Adv. 2015, 5, 57171–57186. [Google Scholar] [CrossRef]
- Maloney, T. Lithium Battery Thermal Runaway Vent Gas Analysis; Final Report; Federal Aviation Administration: Washington, DC, USA, 2016; pp. 1–35.
- Larsson, F.; Andersson, P.; Blomqvist, P.; Mellander, B.-E. Toxic Fluoride Gas Emissions from Lithium-ion Battery Fires. Sci. Rep. 2017, 7, 10018. [Google Scholar] [CrossRef]
- Chen, S.; Wang, Z.; Wang, J.; Tong, X.; Yan, W. Lower explosion limit of the vented gases from Li-ion batteries thermal runaway in high temperature condition. J. Loss Prev. Process Ind. 2020, 63, 103992. [Google Scholar] [CrossRef]
- Niu, H.; Chen, C.; Ji, D.; Li, Z.; Liu, Y.; Huang, X. Thermal-Runaway Propagation over a Linear Cylindrical Battery Module. Fire Technol. 2020, 56, 2491–2507. [Google Scholar] [CrossRef]
- Yuan, L.; Dubaniewicz, T.; Zlochower, I.; Thomas, R.; Rayyan, N. Experimental Study on Thermal Runaway and Vented Gases of Lithium-ion Cells. Process Saf. Environ. Prot. 2020, 144, 186–192. [Google Scholar] [CrossRef]
- Kwade, A.; Diekman, J.; Hanisch, C.; Spengler, T.; Thies, C.; Herrmann, C.; Droeder, K.; Cerdas, J.F.; Gerbers, R.; Scholl, S.; et al. Recycling von Lithium-Ionen-Batterien—LithoRec II. Abschl. Der TU Braunschw. 2016, 239, 41. [Google Scholar]
- Nedjalkov, A.; Meyer, J.; Köhring, M.; Doering, A.; Angelmahr, M.; Dahle, S.; Sander, A.; Fischer, A.; Schade, W. Toxic Gas Emissions from Damaged Lithium Ion Batteries—Analysis and Safety Enhancement Solution. Batteries 2016, 2, 5. [Google Scholar] [CrossRef]
- Sturk, D.; Rosell, L.; Blomqvist, P.; Tidblad, A.A. Analysis of Li-Ion Battery Gases Vented in an Inert Atmosphere Thermal Test Chamber. Batteries 2019, 5, 61. [Google Scholar] [CrossRef]
- Essl, C.; Golubkov, A.W.; Gasser, E.; Nachtnebel, M. Comprehensive Hazard Analysis of Failing Automotive Lithium-Ion Batteries in Overtemperature Experiments. Batteries 2020, 6, 30. [Google Scholar] [CrossRef]
- Tutu, A. BMW i8 Catches Fire in The Netherlands, Firefighters Drop It in Water Container. Autoevolution. 2019. Available online: https://www.autoevolution.com/news/bmw-i8-catches-fire-in-the-netherlands-firefighters-drop-it-in-water-container-133267.html (accessed on 20 July 2022).
- Edwards, E. The Battery Behind Dangerous and Deadly E-cigarette Explosions. NBC News. Available online: https://www.nbcnews.com/health/health-news/battery-behind-dangerous-deadly-e-cigarette-explosions-n1032901 (accessed on 24 June 2022).
- Ban-Seok, J. In the Electric Vehicle That Was Being Charged, ‘the Fire of the City’ Vehicle Burner. 2020. Available online: https://news.sbs.co.kr/news/endPage.do?news_id=N1005812034 (accessed on 17 July 2022).
- Sun, P.; Bisschop, R.; Huichang, N.; Huang, X. A Review of Battery Fires in Electric Vehicles. Fire Technol. 2020, 56, 1361–1410. [Google Scholar] [CrossRef]
- Diaz, F.; Wang, Y.; Weyhe, R.; Friedrich, B. Gas Generation Measurement and Evaluation during Mechanical Processing and Thermal Treatment of Spent Li-ion Batteries. Waste Manag. 2019, 84, 102–111. [Google Scholar] [CrossRef]
- Warner, N. Overview of a Year of Battery Fire Testing by DNV GL for Con Ed, NYSERDA and FDNY. In Proceedings of the NFPA 855 Committee Meeting, New York, NT, USA, 4 January 2017; pp. 1–34. [Google Scholar]
- Hattwig, M.; Steen, H. Handbook of Explosion Prevention and Protection; WILEY-VCH Verlag GmbH & Co. KGaA: Weinheim, Germany, 2004. [Google Scholar]
- Webster, H.; Maloney, T.; Summer, S.M.; Dadia, D.; Rehn, S.J.; Karp, M. Summary of FAA Studies Related to the Hazards Produced by Lithium Cells in Thermal Runaway in Aircraft Cargo Compartments; Final Report; U.S. Department of Transportation Federal Aviation Administration: Washington, DC, USA, 2016.
- Somandepalli, V.; Marr, K.; Horn, Q. Quantification of Combustion Hazards of Thermal Runaway Failures in Lithium-ion Batteries. SAE Int. J. Alt. Power 2014, 3, 98–104. [Google Scholar] [CrossRef]
- Muhammad, S. State of Charge Dependent Thermal Runaway Detection of Lithium Ion Battery under Mechanical Abuse Condition. Doctoral Thesis, University of Sunderland, Sunderland, UK, March 2018; p. 228. [Google Scholar]
- Roth, P.E.; Crafts, C.C.; Doughty, D.H.; McBreen, J. Advanced Technology Development Program for Lithium-Ion Batteries: Thermal Abuse Performance of 18650 Li-ion Cells; Technical Report; Sandia National Laboratories: Albuquerque, NM, USA, 2004. [Google Scholar]
- Pan, Q.; Weyhe, R.; Melber, A.; Klavina, I.; Friedrich, B. Investigation on Packaging Materials for Safe Transport of Spent Li-ion Batteries. In Proceedings of the 19th International Congress for Battery Recycling (ICBR), Hamburg, Germany, 24–26 September 2014. [Google Scholar]
- Amano, O.A.K.; Hahn, S.-K.; Tschirschwitz, R.; Rappsilber, T.; Krause, U. An Experimental Investigation of Thermal Runaway and Gas Release of NMC Lithium-Ion Pouch Batteries Depending on the State of Charge Level. Batteries 2022, 8, 41. [Google Scholar] [CrossRef]
- Foss, C.E.L. Thermal Stability and Electrochemical Performance of Graphite Anodes in Li-ion Batteries. Ph.D. Thesis, NTNU-Trondheim, Trondheim, Norway, 2014; pp. 1–47. [Google Scholar]
- Tran, M.-K.; Mevawalla, A.; Aziz, A.; Panchal, S.; Xie, Y.; Fowler, M. A Review of Lithium-Ion Battery Thermal Runaway Modeling and Diagnosis Approaches. Processes 2022, 10, 1192. [Google Scholar] [CrossRef]
- Zu, C.; Yu, H.; Li, H. Enabling the thermal stability of solid electrolyte interphase in Li-ion battery. InfoMat 2021, 3, 648–661. [Google Scholar] [CrossRef]
- Lopez, C.F.; Jeevarajan, J.A.; Mukherjee, P.P. Characterization of Lithium-Ion Battery Thermal Abuse Behavior Using Experimental and Computational Analysis. J. Electrochem. Soc. 2015, 162, A2163. [Google Scholar] [CrossRef]
- Wang, Q.; Sun, J.; Yao, X.; Chen, C. Thermal Behavior of Lithiated Graphite with Electrolyte in Lithium-ion Batteries. J. Electrochem. Soc. 2006, 153, A329–A333. [Google Scholar] [CrossRef]
- Feng, X.; Sun, J.; Ouyang, M.; He, X.; Lu, L.; Han, X.; Fang, M.; Peng, H. Characterization of Large Format Lithium Ion Battery Exposed to Extremely High Temperature. J. Power Sources 2014, 272, 457–467. [Google Scholar] [CrossRef]
- Essl, C.; Golubkov, A.W.; Fuchs, A. Comparing Different Thermal Runaway Triggers for Two Automotive Lithium-Ion Battery Cell Types. J. Electrochem. Soc. 2020, 167, 130542. [Google Scholar]
- Addai, E.K.; Gabel, D.; Krause, U. Minimum Ignition Temperature of Hybrid Mixtures of Burnable Dusts and Gases. In Proceedings of the 25th ICDERS, Leeds, UK, 2–7 August 2015. [Google Scholar]
- CHEMSAFE Database. Available online: https://www.chemsafe.ptb.de (accessed on 10 November 2022).
- Zimmerman, A.H.; Quinzio, M.V. Lithium Plating in Lithium-Ion Cells; NASA Battery Workshop: Huntsville, AL, USA, 2010. [Google Scholar]
- Lin, X.; Khosravinia, K.; Hu, X.; Li, J.; Lu, W. Lithium Plating Mechanism, Detection, and Mitigation in Lithium-Ion Batteries. Prog. Energy Combust. Sci. 2021, 87, 100953. [Google Scholar] [CrossRef]
- Juarez-Robles, D.; Vyas, A.A.; Fear, C.; Jeevarajan, J.A.; Mukherjee, P.P. Overcharge and Aging Analytics of Li-Ion Cells. J. Electrochem. Soc. 2020, 167, 090547. [Google Scholar]
- Ohsaki, T.; Kishi, T.; Kuboki, T.; Takami, N.; Shimura, N.; Sato, Y.; Sekino, M.; Satoh, A. Overcharge Reaction of Lithium-ion Batteries. J. Power Sources 2005, 146, 97–100. [Google Scholar] [CrossRef]
- Leißing, M.; Horsthemke, F.; Wiemers-Meyer, S.; Winter, M.; Niehoff, P.; Nowak, S. The Impact of the C-Rate on Gassing During Formation of NMC622 II Graphite Lithium-Ion Battery Cells. Batter. Supercaps 2021, 4, 1344–1350. [Google Scholar] [CrossRef]
- Razus, D.; Movileanu, C.; Brinzea, V.; Oancea, D. Explosion pressures of hydrocarbon–air mixtures in closed vessels. J. Hazard. Mater. 2006, 135, 58–65. [Google Scholar] [CrossRef] [PubMed]
- Mitu, M.; Movileanu, C.; Giurcan, V. Dynamics of Pressure Evolution during Gaseous Ethane–Air. Energies 2022, 15, 6879. [Google Scholar] [CrossRef]
- Koch, S.; Fill, A.; Birke, K.P. Comprehensive Gas Analysis on Large Scale Automotive Lithium-ion Cells in Thermal Runaway. J. Power Sources 2018, 398, 106–112. [Google Scholar]
- Larsson, F.; Andersson, P.; Mellander, B.-E. Lithium-ion Battery Aspects on Fires in Electrified Vehicles on the Basis of Experimental Abuse Tests. Batteries 2016, 2, 9. [Google Scholar]
- Aluminum Laminated Film for Pouch Cell Case. Available online: https://www.msesupplies.com/en-de/products/aluminum-laminated-film-for-pouch-cell-case-t-113um?variant=31731421446202 (accessed on 20 May 2023).
- Patel, S.N. Thermal and Oxidative Degradation of an Aromatic Polyamide. Doctoral Dissertation, University of Leeds, Leeds, UK, 1992. [Google Scholar]
- Gully, B. Technical Reference for Li-ion Battery Explosion Risk and Fire Suppression; Technical Report; DNV GL: Bærum, Norway, 2019. [Google Scholar]
- Mikolajczak, C.; Kahn, M.; White, K.; Long, R.T. Lithium-Ion Batteries Hazard and Use Assessment; Springer Science & Business Media: Berlin/Heidelberg, Germany, 2011. [Google Scholar]
- Ensola. Definitions LEL. Ensola AG. Available online: https://www.ensola.com/w/images/stories/2012_inhalte/pdf/datenblatt_lower_expolxive_limit.pdf 2012 (accessed on 12 July 2022).
- CDC. Hydrogen Cyanide (AC): Systemic Agent. Centers for Disease Control and Prevention. Available online: https://www.cdc.gov/niosh/ershdb/emergencyresponsecard_29750038.html#:~:text=DESCRIPTION%3A%20Hydrogen%20cyanide%20(AC),AC)%20can%20be%20rapidly%20fatal (accessed on 12 July 2022).


| Parameter | Test Series 1 & 3 | Test Series 2 | Test Series 2 |
|---|---|---|---|
| Manufacturer | Grepow | Hunan CTS | Hunan CTS |
| Capacity, Ah | 2.5 | 10 | 32 |
| Energy density, Wh/kg | 275 | 200 | 200 |
| Mass(max), g | 58 | 178 | 590 |
| Width, mm | 60 | 59 | 102 |
| Length, mm | 78.5 | 156 | 305 |
| Thickness, mm | 5.7 | 8.5 | 11.5 |
| Upper-limit voltage, V | 4.2 | 4.2 | 4.2 |
| Average voltage, V | 3.7 | 3.7 | 3.7 |
| Cutoff voltage, V | 2.7 | 2.75 | 2.75 |
| Test | Capacity per Cell (Ah) | Cells per Test | Cell Total | SOC (%) | Pyrobubble Filter | Trigger | Test Chamber Volume (L) | Ref. [26] |
|---|---|---|---|---|---|---|---|---|
| Series 1 | ||||||||
| #01–#03 | 2.5 | 1 | 3 | 0 | ✗ | Overheating | 10 | - |
| #04 | 1 | 1 | ✓ | - | ||||
| #05–#07 | 1 | 3 | 30 | ✗ | - | |||
| #08 | 1 | 1 | ✓ | - | ||||
| #09–#11 | 1 | 3 | 50 | ✗ | - | |||
| #12 | 1 | 1 | ✓ | - | ||||
| #13–#15 | 1 | 3 | 80 | ✗ | - | |||
| #16 | 1 | 1 | ✓ | - | ||||
| #17–#19 | 1 | 3 | 100 | ✗ | - | |||
| #20 | 1 | 1 | ✓ | - | ||||
| Series 2 | ||||||||
| #21–#23 | 10 | 1 | 3 | 100 | ✗ | Overheating | 100 | Test #07–#09 |
| #24–#26 | 2 | 6 | ✗ | Test #24→Test #10 | ||||
| Test #25→Test #12 | ||||||||
| Test #26→Test #11 | ||||||||
| #27–#29 | 32 | 1 | 3 | ✗ | Test #13–Test #15 | |||
| Series 3 | ||||||||
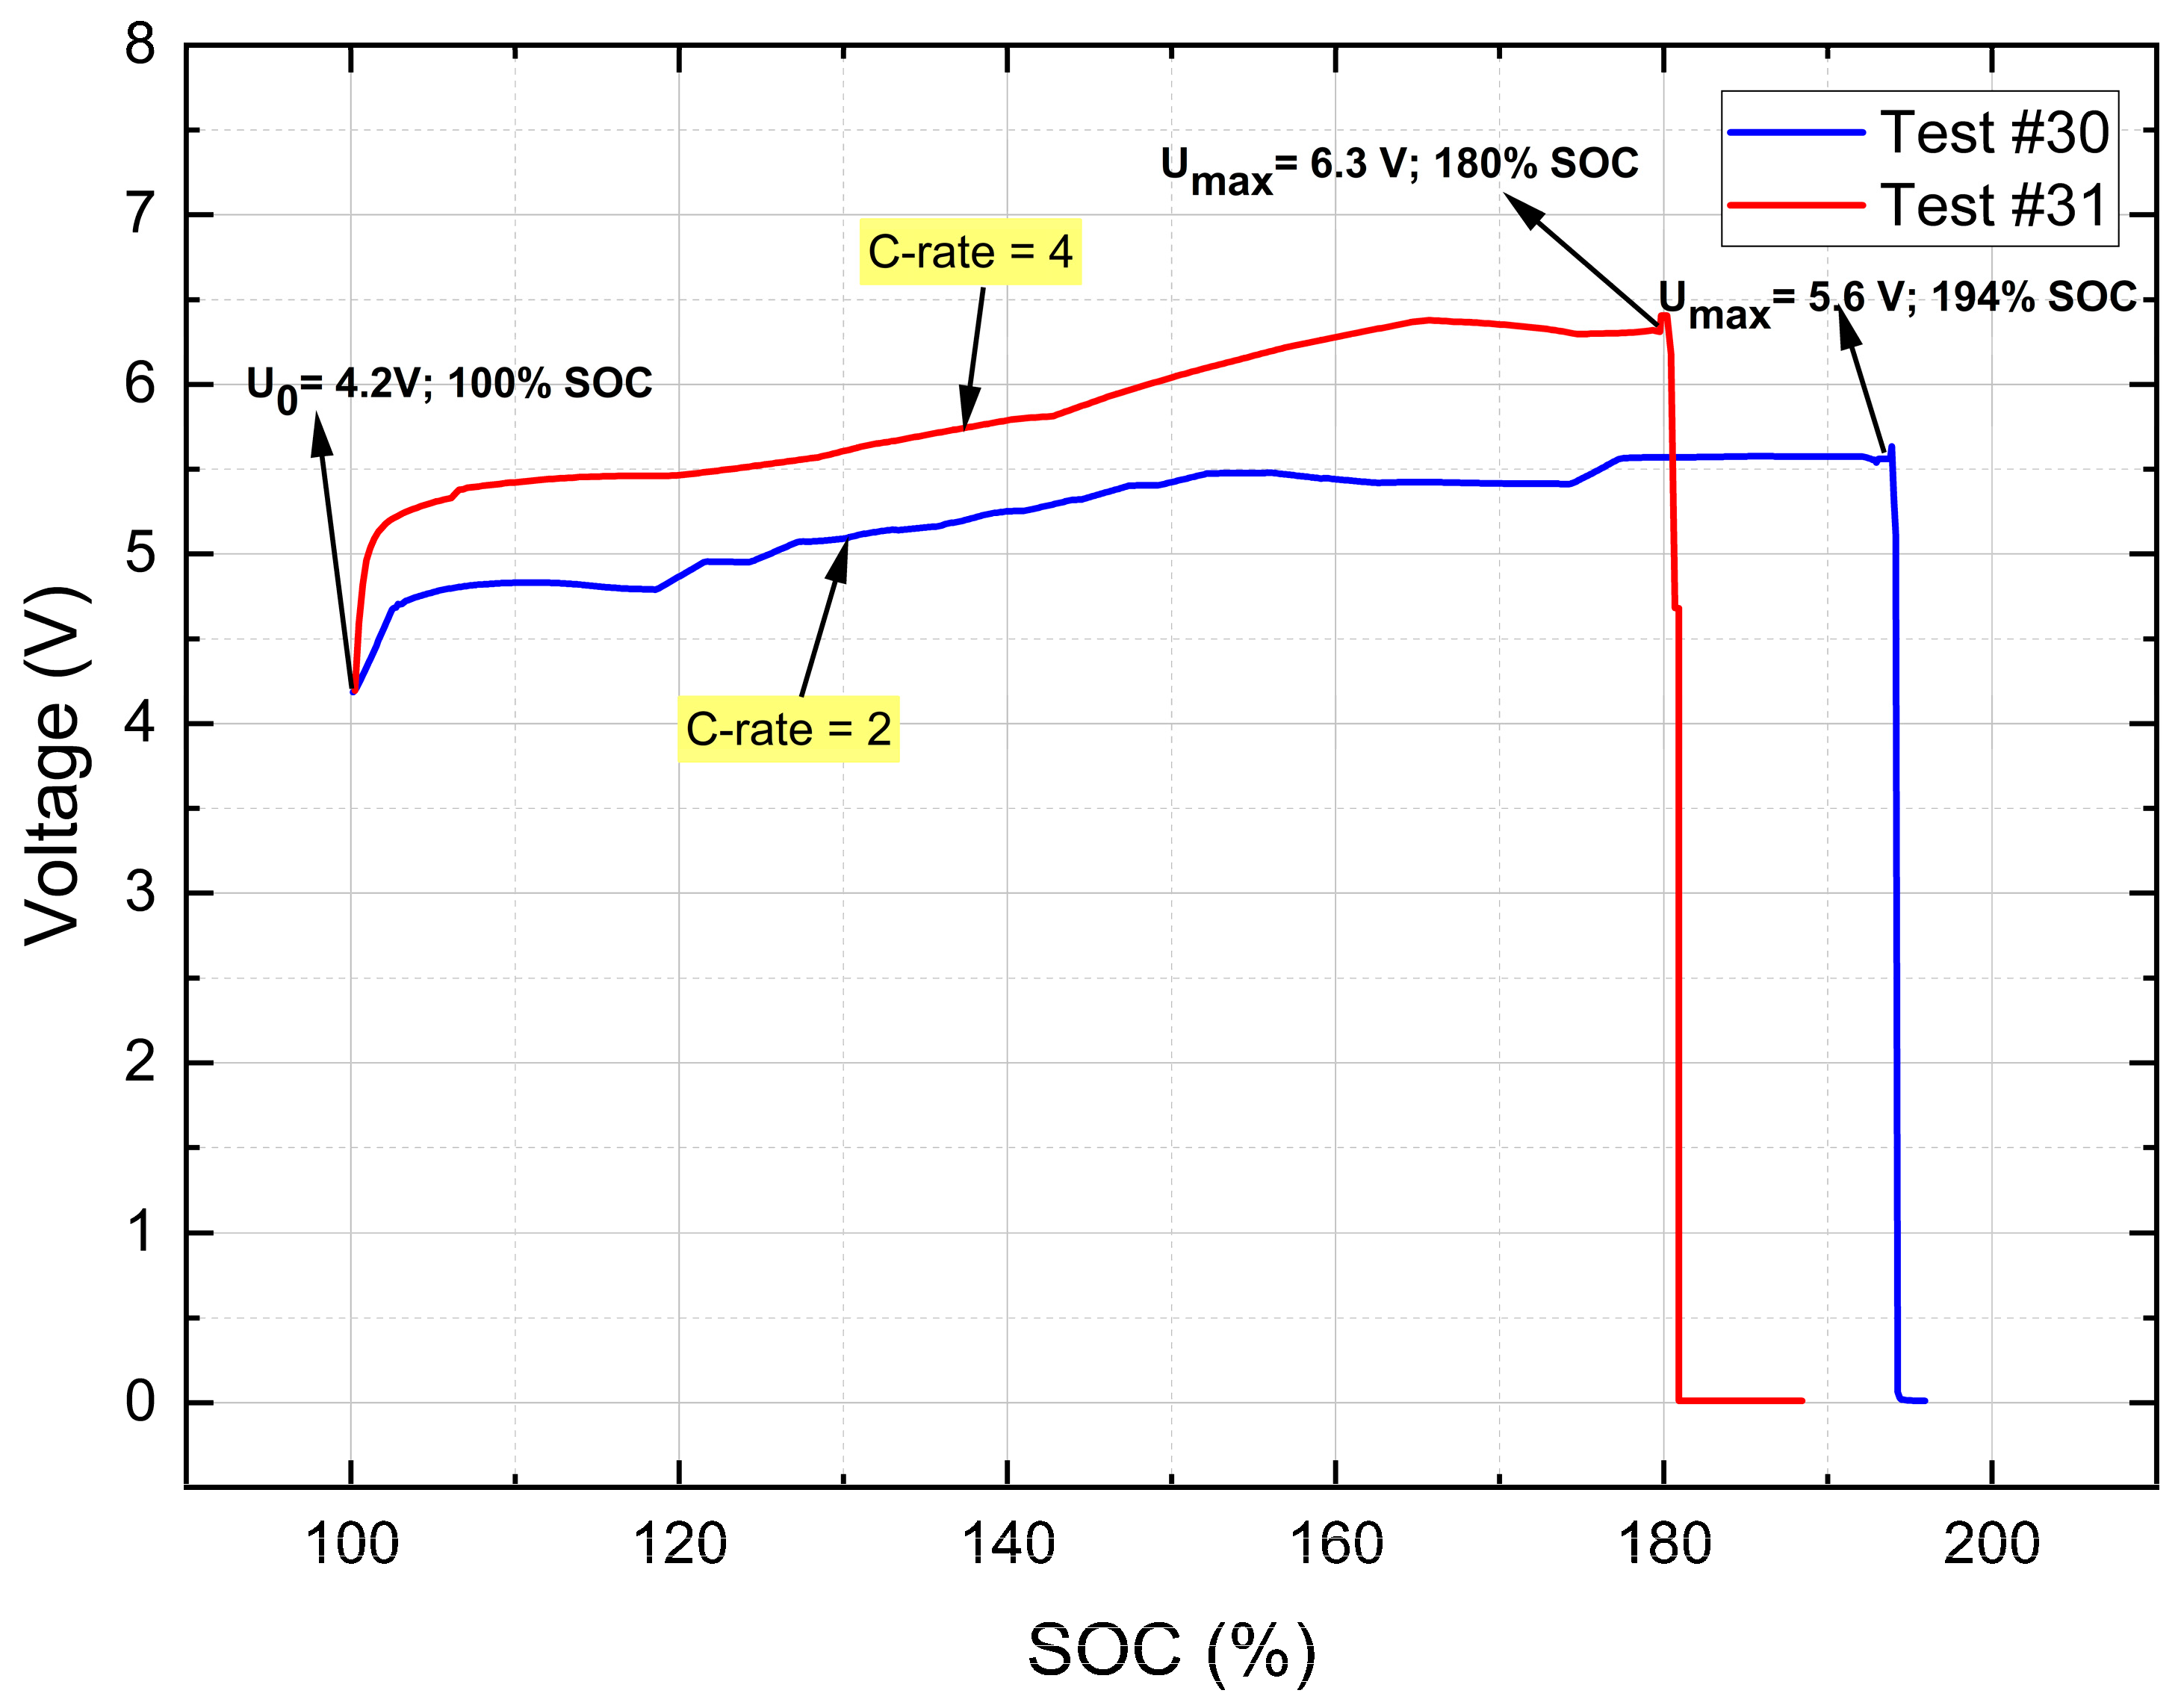
| #30 | 2.5 | 1 | 1 | 100 | ✗ | Overcharge | 45 | - |
| #31 | 1 | 1 | 100 | ✗ | - | |||
| Parameter | Data |
|---|---|
| Thermal conductivity (20 °C), W/(m·K) | 0.075 |
| Density, kg/m3 | 190–230 |
| Melting Temperature, °C | 1100 |
| Heat capacity, J/(kg·K) | 700 |
| Particle size, mm | 1–5 |
| Test | SOC (%) | pmax (bar) | Treac (K) | Ref. [26] |
|---|---|---|---|---|
| Series 1 | ||||
| #01–#03 | 0 | 1.2 ± 0.04 | 378 ± 4 | - |
| #04 | 1.14 | 402 | - | |
| #05–#07 | 30 | 1.3 ± 0.1 | 381 ± 10 | - |
| #08 | 1.5 | 400 | - | |
| #09–#11 | 50 | 1.34 ± 0.15 | 404 ± 14 | - |
| #12 | 1.7 | 416 | - | |
| #13–#15 | 80 | 2.6 ± 0.9 | 515 ± 3 | - |
| #16 | 2.7 | 509 | - | |
| #17–#19 | 100 α | 3.2 ± 0.5 | 520 ± 9 | - |
| #20 | 2.5 | 497 | - | |
| Series 2 | ||||
| #21 | 100 β | 3.9 | 1057 | Test #07 |
| #22 | 2.7 | 853 | Test #09 | |
| #23 | 4.86 | 920 | Test #08 | |
| #24 | 100 γ | 1.83 | 1080 | Test #10 |
| #25 | 1.92 | 1232 | Test #12 | |
| #26 | 7.28 | 1240 | Test #11 | |
| #27 | 100 δ | 7.25 | 930 | Test #13 |
| #28 | 6.55 | 780 | Test #14 | |
| #29 | 7.5 | 826 | Test #15 | |
| Series 3 | ||||
| #30 | 100 α | - | 750 | - |
| #31 | 100 α | - | 978 | - |
| Test | Cell Capacity, Ah | , ppm | , ppm | , ppm | , ppm | , ppm | , ppm | , ppm | Ref. [26] |
|---|---|---|---|---|---|---|---|---|---|
| Test series 1 | |||||||||
| #01–#03 | 2.5 | 11 ± 2.5 | 0 | 8700 ± 450 | 48 ± 4 | 37 ± 3 | 3000 ± 428 | 9750 ± 594 | - |
| #04 | 5 | 0 | 854 | 17 | 14 | 285 | 180 | - | |
| #05–#07 | 8 ± 2.5 | 0 | 8489 ± 715 | 41 ± 5 | 38 ± 4 | 3164 ± 162 | 10,570 ± 2403 | - | |
| #08 | 4 | 0 | 392 | 28 | 11 | 364 | 200 | - | |
| #09–#11 | 15 ± 2 | 10,000 | 12,300 ± 712 | 585 ± 230 | 84 ± 17 | 2970 ± 190 | 17,800 ± 1200 | - | |
| #12 | 14 | 0 | 9050 | 550 | 5 | 1720 | 5390 | - | |
| #13–#15 | 17 ± 1.7 | 286,400 ± 55,400 | 56,400 ± 9140 | 33,060 ± 6270 | 170 ± 23 | 3680 ± 590 | 49,340 ± 12,386 | - | |
| #16 | 14 | 100 | 25,650 | 13,600 | 60 | 3590 | 24,970 | - | |
| #17–#19 | 18 ± 4 | 480,570 ± 11,420 | 67,700 ± 9300 | 43,100 ± 8800 | 165 ± 35 | 3730 ± 666 | 81,200 ± 23,200 | - | |
| #20 | 10 | 200 | 24,650 | 41,700 | 36 | 3450 | 16,010 | - | |
| Test series 2 | |||||||||
| #21 | 10 | - | - | 30,980 | 8040 | 110 | 3095 | 9630 | Test #07 |
| #22 | - | - | 29,220 | 8620 | 100 | 2105 | 6570 | Test #09 | |
| #23 | - | 10,000 | 41,700 | 10,420 | 230 | 9440 | 11,200 | Test #08 | |
| #24 | 20 | - | - | 67,500 | 18,380 | 150 | 4900 | 35,100 | Test #10 |
| #25 | - | - | 68,500 | 19,710 | 180 | 6100 | 37,700 | Test #12 | |
| #26 | - | - | 168,500 | 33,850 | 80 | 6050 | 19,700 | Test #11 | |
| #27 | 32 | - | - | 136,160 | 60,810 | 281 | 10,090 | 71,120 | Test #13 |
| #28 | - | - | 124,100 | 45,570 | 200 | 7000 | 63,400 | Test #14 | |
| #29 | - | - | 148,100 | 76,050 | 380 | 13,000 | 78,600 | Test #15 | |
| Gas Component | Measured Range, vol% | Flammability Range, vol% |
|---|---|---|
| CO | 2.92–16.85 | 12.50–74.00 |
| CH4 | 0.8–7.60 | 5.30–15.00 |
| C2H6 | 0.21–1.30 | 3.00–12.50 |
| C2H4 | 0.70–7.86 | 3.10–32.00 |
| HCN | 0.01–0.04 | 5.60–40.00 |
Disclaimer/Publisher’s Note: The statements, opinions and data contained in all publications are solely those of the individual author(s) and contributor(s) and not of MDPI and/or the editor(s). MDPI and/or the editor(s) disclaim responsibility for any injury to people or property resulting from any ideas, methods, instructions or products referred to in the content. |
© 2023 by the authors. Licensee MDPI, Basel, Switzerland. This article is an open access article distributed under the terms and conditions of the Creative Commons Attribution (CC BY) license (https://creativecommons.org/licenses/by/4.0/).
Share and Cite
Amano, K.O.A.; Hahn, S.-K.; Butt, N.; Vorwerk, P.; Gimadieva, E.; Tschirschwitz, R.; Rappsilber, T.; Krause, U. Composition and Explosibility of Gas Emissions from Lithium-Ion Batteries Undergoing Thermal Runaway. Batteries 2023, 9, 300. https://doi.org/10.3390/batteries9060300
Amano KOA, Hahn S-K, Butt N, Vorwerk P, Gimadieva E, Tschirschwitz R, Rappsilber T, Krause U. Composition and Explosibility of Gas Emissions from Lithium-Ion Batteries Undergoing Thermal Runaway. Batteries. 2023; 9(6):300. https://doi.org/10.3390/batteries9060300
Chicago/Turabian StyleAmano, Kofi Owusu Ansah, Sarah-K. Hahn, Noman Butt, Pascal Vorwerk, Elena Gimadieva, Rico Tschirschwitz, Tim Rappsilber, and Ulrich Krause. 2023. "Composition and Explosibility of Gas Emissions from Lithium-Ion Batteries Undergoing Thermal Runaway" Batteries 9, no. 6: 300. https://doi.org/10.3390/batteries9060300
APA StyleAmano, K. O. A., Hahn, S.-K., Butt, N., Vorwerk, P., Gimadieva, E., Tschirschwitz, R., Rappsilber, T., & Krause, U. (2023). Composition and Explosibility of Gas Emissions from Lithium-Ion Batteries Undergoing Thermal Runaway. Batteries, 9(6), 300. https://doi.org/10.3390/batteries9060300