Article

Composition and Explosibility of Gas Emissions from Lithium-Ion Batteries Undergoing Thermal Runaway

1
Faculty of Process and Systems Engineering Magdeburg, Department of Plant Design and Process Safety, Otto von Guericke University, 39106 Magdeburg, Germany
2
German Fire Protection Association, 48155 Münster, Germany
3
IUP Ingenieur GmbH, 38102 Braunschweig, Germany
4
Bundesanstalt für Materialforschung und -Prüfung (BAM), 12205 Berlin, Germany
*
Authors to whom correspondence should be addressed.
Batteries 2023, 9(6), 300; https://doi.org/10.3390/batteries9060300
Submission received: 25 April 2023 / Revised: 26 May 2023 / Accepted: 29 May 2023 / Published: 30 May 2023

Abstract

:
Lithium-based batteries have the potential to undergo thermal runaway (TR), during which mixtures of gases are released. The purpose of this study was to assess the explosibility of the gaseous emission from LIBs of an NMC-based cathode during thermal runaway. In the current project, a series of pouch lithium-based battery cells was exposed to abuse conditions (thermal) to study the total amount of gases released and the composition of the gas mixture. First, the battery cells were placed in a closed vessel, and the pressure and temperature rise inside the vessel were measured. In a second step, the composition of gases was analysed using a Fourier transform Infrared (FTIR) spectrometer. We found that the amount of released gases was up to 102 ± 4 L, with a clear dependence on the battery capacity. This study showed that the concentration of gaseous emissions such as carbon monoxide (CO), methane (CH4), ethylene (C2H4), ethane (C2H6), and hydrogen cyanide (HCN) increased with higher cell capacity. Of the five studied flammable gases, the maximum concentrations of carbon monoxide (16.85 vol%), methane (7.6 vol%), and ethylene (7.86 vol%) were identified to be within their explosible range. Applying Le Chatelier’s law, a calculated lower explosion limit (LEL) of 7% in volume fraction was obtained for the gas mixture. The upper explosion limit (UEL) of the gas mixture was also found to be 31% in volume. A filter comprising pyrobubbles was used for the removal of the studied gas components released during the thermal abuse. The investigation revealed that the pyrobubbles filter was highly effect in the removal of HCN (up to 94% removal) and CO2 (up to 100% removal). Herein, we report the dependency of the method of thermal runaway trigger on the measured maximum temperature.

1. Introduction

The safety of lithium-ion batteries (LIBs) is of major concern because of their high energy density. The primary safety hazards are the ignition of the cell due to thermal runaway and its accompanying gaseous emissions [1]. Heat transfer during thermal runaway can be induced by the decomposition of individual cell components or by interactive reactions between multiple components [2]. This results in heat generation and, in some circumstances, the release of harmful gases and fire.
Previous investigations have been conducted to quantify gaseous emissions and possible hazards, but most studies do not cover pouch lithium-ion batteries with NMC-based cathodes [3,4,5,6,7,8,9]. The limited number of studies performed on NMC pouch lithium-ion batteries have mostly focused on a 100% state of charge (SOC) [10,11,12,13].
Gas production is a result of several decomposition stages [13]. However, the thermal decomposition of the organic carbonate electrolyte used in an LIB largely influences the main gas emissions at thermal runaway. In a temperature range of 363–493 K, the organic carbonate electrolyte decomposes, and a reaction between Li and electrolytes occurs to produce various organic and inorganic compounds [12,13]. Some main gases produced include carbon monoxide (CO), carbon dioxide (CO2), methane (CH4), ethylene (C2H4), ethane (C2H6), fluoroethane (C2H5F), hydrogen (H2), and hydrogen fluoride (HF) [12,13].
Observations made by Kwade et al. indicated that nail-penetration-induced thermal runaway could result in the release of 1.04–3.28 mg/m3 of CO, 18–90 mg/m3 of HF and 73–257 mg/m3 of CH4 from 2.1 Ah pouch cells with NMC-based cathodes. Nedjalkov et al. (2016) investigated the gaseous emissions from 40 Ah LIBs with NMC-based cathodes. The investigators reported the emission of 1640 ppm of HF from the emerging gases.
Essl et al. analyzed the gas composition and particle emission from 41 Ah LIBs with NMC/LMO-based cathodes for SOC levels as 0%, 30%, and 100% in a N2 atmosphere. The main toxic component measured was CO. The measured explosible components were H2, CH4, and diethyl carbonate (DEC) [13]. However, the explosibility of these components in an enclosed geometry was not studied.
As mentioned by Sturk et al., thermal runaway tests are commonly carried out in an inert atmosphere, and findings may differ from those obtained in normal atmospheres, as some chemical reactions may occur only in the presence of oxygen [12]. These findings demonstrate the need to investigate the explosibility hazard of gaseous releases from the NMC-based pouch cells in a normal atmosphere.
Several accidents have occurred, especially in instances in which the LIBs were not in use (idle) or being charged [14,15,16,17]. Previous investigations of gas emissions during thermal runaway of lithium-ion batteries indicate the release of toxic gases. Studies have shown that a single 18,650 LIB could release up to 0.27 moles (6 L) of toxic gases during thermal runaway at a maximum cell temperature of 1123 K [3].
The mixture of released gases is dependent on the type of Li-ion cells, the test method, and the test equipment used [18]. By heating 18,650 cylindrical batteries, Golubkov et al. observed the emission of relatively large volume fractions of CO2 compared to CO, CH4, and C2H4 from LIBs with lithium iron phosphate (LFP) and nickel cobalt aluminum (NCA) cathodes using gas chromatography (GC) [4]. Experiments performed by Warner revealed that thermal treatment of LFP and NMC LIBs results in the emission of toxic gases such as HF, CO, hydrogen chloride (HCl), and hydrogen cyanide (HCN) in high concentrations [19]. The investigator used a Fourier transform infrared spectroscopy (FTIR)-coupled gas bag-sampling technique.
Other studies indicate the release of combustible gases during thermal abuse tests from LIBs with LFP, lithium manganese nickel oxide (LMNO), and lithium cobalt oxide (LCO) cathodes. Important parameters used in assessing the presence of an explosive atmosphere are the so-called lower and upper explosive limits (LEL/UEL). The lower (fuel-lean range) and upper (fuel-rich range) explosion limits indicate the limiting values of the combustible component content in a mixture of flammable gas, oxidant, and, if present, inert gas at which a hazardous reaction no longer propagates autonomously in the mixture [20]. Webster et al. (2016) found an LEL of 10% in gas volume fraction, while the UEL varied between 35% and 45% gas volume fraction depending on the SOC of the cell [21].
Somandepalli et al. performed a test to determine the maximum pressure (Pmax) of the gases released from 2.1 A h (7.7 W h ) LCO cells in a 20-L explosion sphere [22]. The study revealed that the measured Pmax of over 7 bar is in the range of common hydrocarbons and hydrogen. The current study aims to demonstrate the combustibility of the gases released from lithium-ion batteries.
In most cases, no substantial amount of oxygen gas seems to be released from the LIBs to increase the rate of combustion during thermal runaway. However, thermal decomposition reactions can be enhanced by the temperature of the expelled gases [11]. This could result in a cascade thermal runaway of adjacent cells. The majority of thermal runaway reactions occur during or shortly after the Li-ion cell has reached 100% SOC [23]. From an energy perspective, the occurrence of a thermal runaway is less likely in LIBs with a low SOC [24].
Hollow-sphere glass granulate-like pyrobubbles have found effective applications in fire protection. Foam-like granules made from silicon dioxide with a diameter ranging from 0.5 to 5 mm have low thermal conduction, are not inflammable, are floatable, have outstanding asphyxiation, and have a high melting temperature (>1373 K) [25]. In this study, the effectiveness of pyrobubbles in removing the gas components in gas emission was investigated.
In summary, this work presents investigations of the emissions from NMC lithium-ion batteries during thermal runaway at SOCs of around 0%, 30%, 50%, 80%, and 100%. The main focus of this investigation is the total amount of gases released, the gas composition, and the explosibility parameters of the emissions. The effectiveness of pyrobubbles in the removal of the gas emissions, namely CO, CO2, CH4, HCN, HF, C2H6, and C2H4, at different SOCs was evaluated.

2. Materials and Methods

2.1. Cells

In total, 34 pieces of lithium-ion cells with NMC-based cathode and graphite anode were used for the investigation. The electrolyte is composed of four different mixtures, namely ethylene carbonate (EC), ethyl methyl carbonate (EMC), dimethyl carbonate (DMC), and propylene carbonate (PC). Each cell used lithium hexafluorophosphate (LiPF6) as conducting salt. The batteries tested were pouch LIBs with nominal capacities, Q n o m of 2.5 Ah (≈9.25 W h ), 10 A h (37 W h ), and 32 A h (≈118 W h ). The parameters of the studied cells are presented in Table 1.
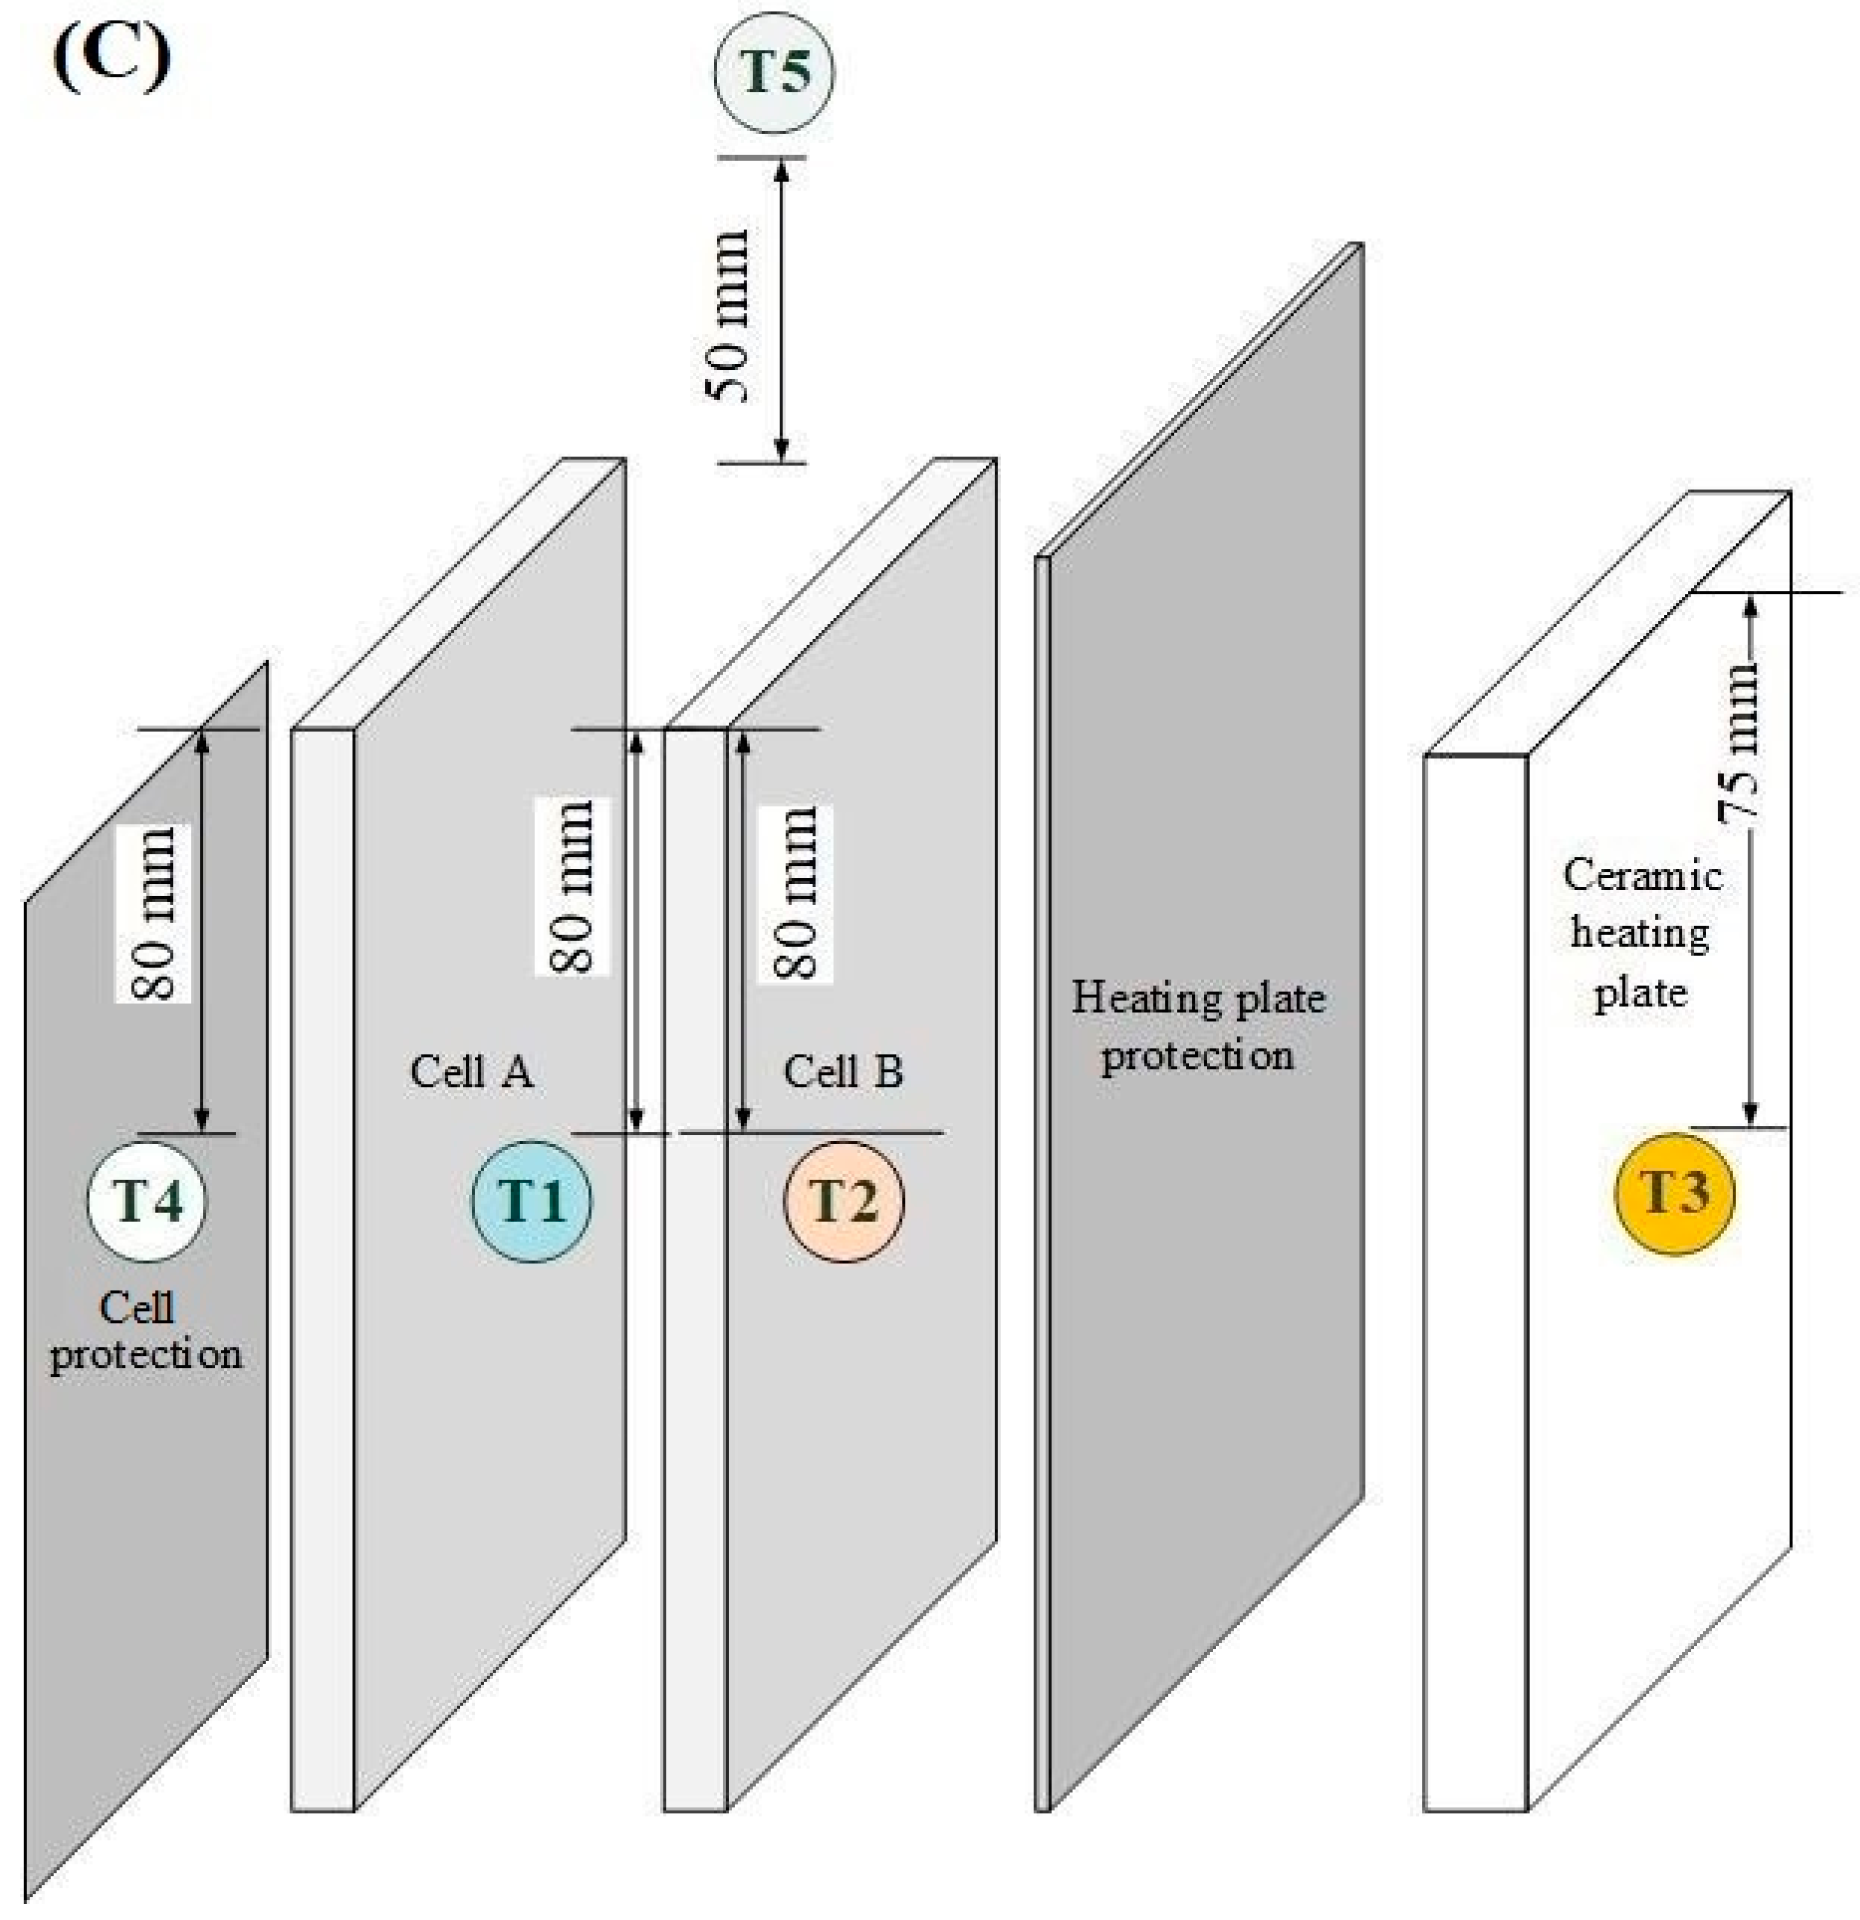
As depicted in Table 2, 31 tests were performed in three different test series. A battery stack consisting of two 10 A h cells (double-cell) assembled together was also studied. As illustrated in Figure 1C, these cells were labeled as A and B.

2.2. Hollo-Sphere Glass Granulate Filter

A filter was used to treat the gases released during thermal runaway. The filter was made up of a stainless-steel container with hollow-sphere glass granulate (pyrobubbles) as the filter media. The properties of the pyrobubbles are shown in Table 3. The cylindrical container had an inner volume of 1.26 L (diameter, Ø = 100 mm; height, h = 160 mm). It had three openings, an inlet for off-gas inflow, an outlet for treated-gas outflow to the FTIR, and a vent. The cylindrical filter chamber was filled with 400 g of pyrobubbles.

2.3. Experimental Setup

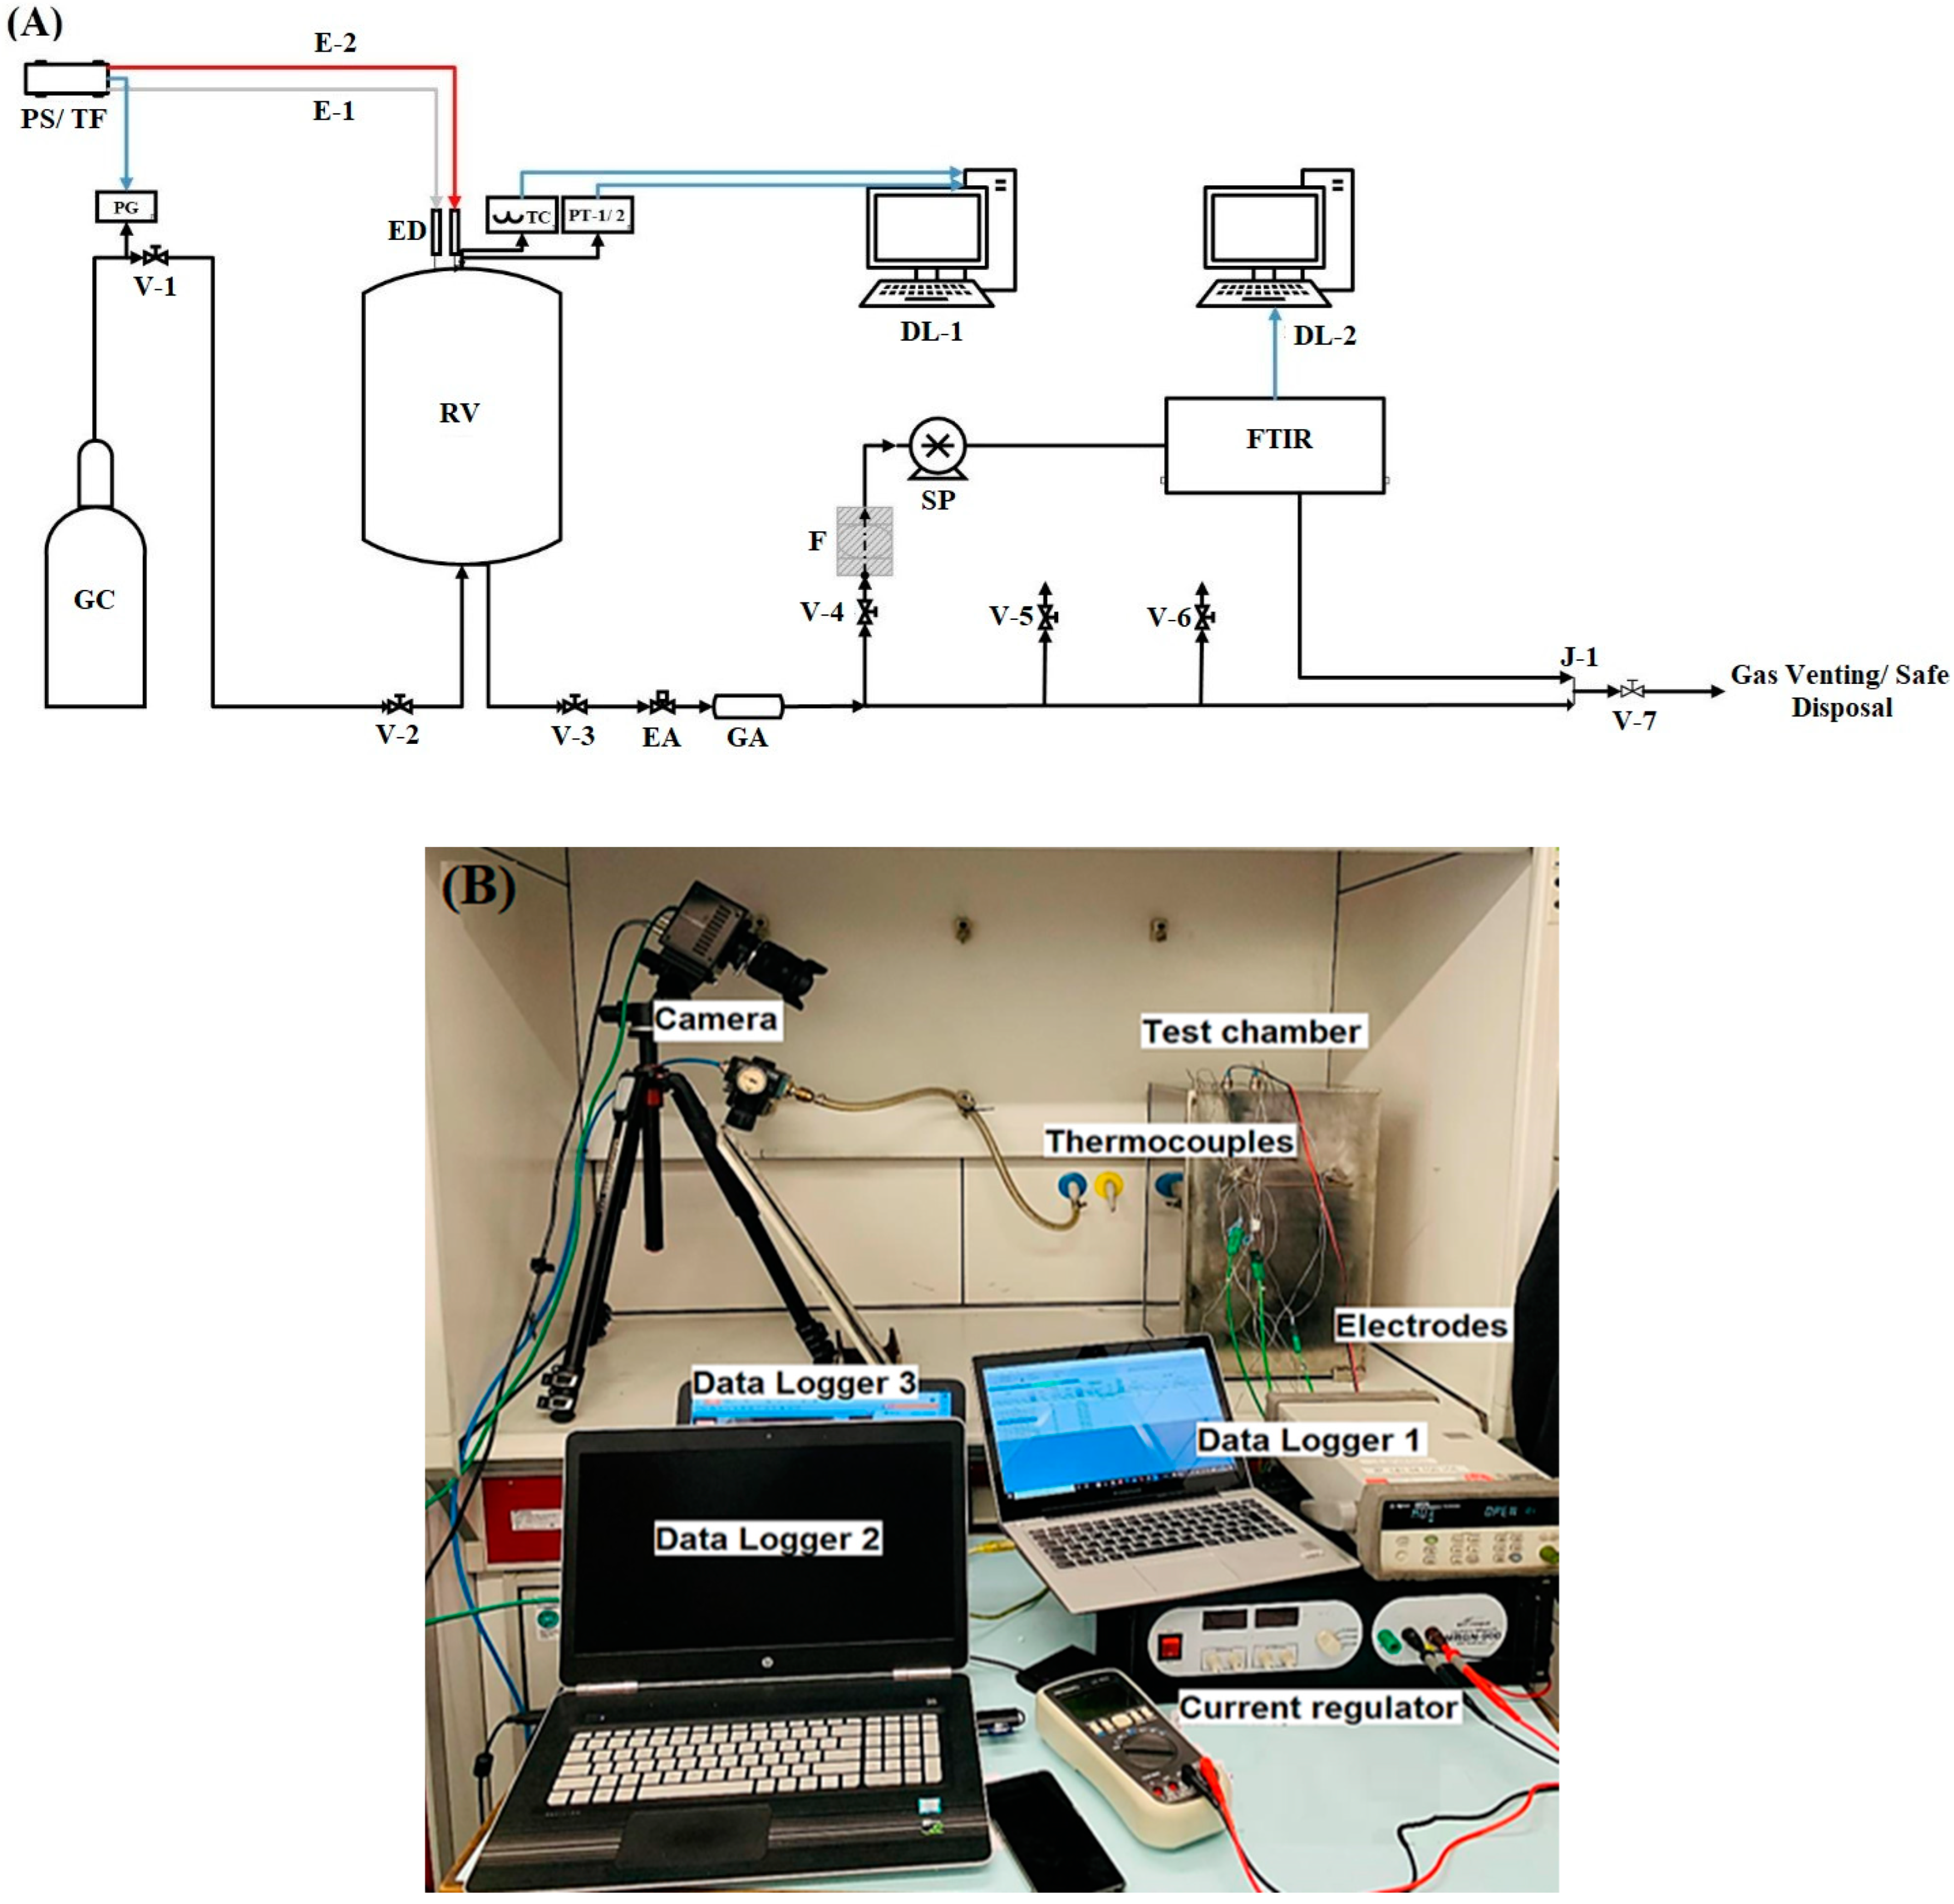
Figure 2 shows the experimental setups for the thermal abuse. For test series 1 and 2, the thermal runaway was triggered inside an air-tight stainless-steel vessel with 10 L and 100 L inner volumes, respectively. A pyrobubble filter was incorporated into the experimental setup for test series 1. The cells used in test series 1 and 2 were forced into thermal runaway by local overheating using a glow plug and a heating plate, respectively. Overcharge experiments were performed in test series 3 in an enclosed explosion chamber with dimensions of 500 mm × 300 mm × 300 mm (height× length × width).
The surface area of the glow plug for heating had a diameter of 5 mm and a height of 10 mm. Heat was supplied from the surface of the heating plate with dimensions 150 mm × 100 mm × 20 mm (height × length × width). To protect the heating plate from the direct impact of the thermal runaway, a stainless steel panel with a thickness of 2 mm was installed between the heating plate and the LIB, as shown in Figure 2. A transformer (TF) (Thalheimer LTS 606 Isolation Transformer, Jagst, Germany) was used to limit the power supply to the ignition sources to a maximum of 400 W .
For the third test series (overcharging), the electrodes of the cell were connected to a current regulator MRGN-900 (E. T. T.—Trading GmbH, Braunschweig, Germany) to maintain the power supply to the electrodes and voltage measurement during the overcharging process. The thermal runaway was triggered by limiting the overcharge rate (C-rate) to 2 C in test #30 and 4 C in test #31. Through the application of the high-speed camera (Photron Deutschland GmbH, Reutlingen, Germany), the thermal runaway was filmed at 250 fps. The data were recorded using Phototron Fastcam Viewer version 4.
To measure the temperature and pressure, K-type thermocouples (5 pieces maximum) and a pressure transducer (Kistler’s Piezoresistive Amplifier 4603b, Kistler Group, Sindelfingen, Germany) were installed on the reaction vessels (i.e., test series 1 and 2). An exception was made in test series 3, for which only the local temperature on the cell surface was measured. The temperature and pressure were measured synchronously by the transducer and thermocouples with a sampling rate of 1 kHz and 0.1 kHz, respectively.
Figure 1 illustrates the arrangement of thermocouples and the positioning of the ignition sources on the test cells. An electrical actuator (EA) and a gas accumulator (GA) were installed to ensure smooth flow of gas and prevent pressurization of the gas during the feeding of the sampling section. N2 gas was used for pressure regulation in the reaction vessels during operation and purging. Data were recorded using two types of data loggers. An Agilent Data Manager (DAQ: U2355A) (DL-1) (Agilent Technologies, Boeblingen, Germany) was used to acquire pressure and temperature readings, and a DL-2 (Gasmet FTIR analyser DX4000, Gasmet Technologies Oy, Helsinki, Finland) was used to record the readings from the FTIR with a P-Hot sampling system (Ansyco GmbH, Karlsruhe, Germany). In test series 3, data logger 3 (Voltsoft (Conrad Electronic International (HK) Limited, Tsuen Wan, Hong Kong) was used to record the voltage readings during the overcharging process.

2.4. Experimental Procedure

The experiments were conducted in three series, as listed in Table 2. In test series 1, 20 pieces of 2.5 Ah Li-ion cells were ignited by a glow plug. The glow plug was installed 20 mm from the top section of the LIBs to supply direct heat, as shown in Figure 1A. Triplicate analysis of single cells in dependence on their SOC levels (≈0%, 30%, 50%, 80%, and 100%) was carried out to study the gas emissions during thermal runaway. Subsequently, single runs were performed at the respective SOC levels to analyse the gas emission removal efficiency of pyrobubbles. Fresh pyrobubbles were used for each test. First, mean values of the triplicate analysis were used for the evaluation of pressures, temperatures, and gas concentrations.
In tests series 2 (tests #21 to #26), the gas emissions from 10 A h (nominal capacity, Q n o m ) NMC cells were investigated. For tests #27 to #29, 32 A h NMC cells were used. All tests were performed with fully charged cells.
In test series 3, the combustibility of the released gases was closely studied with fully charged 2.5 A h cells.
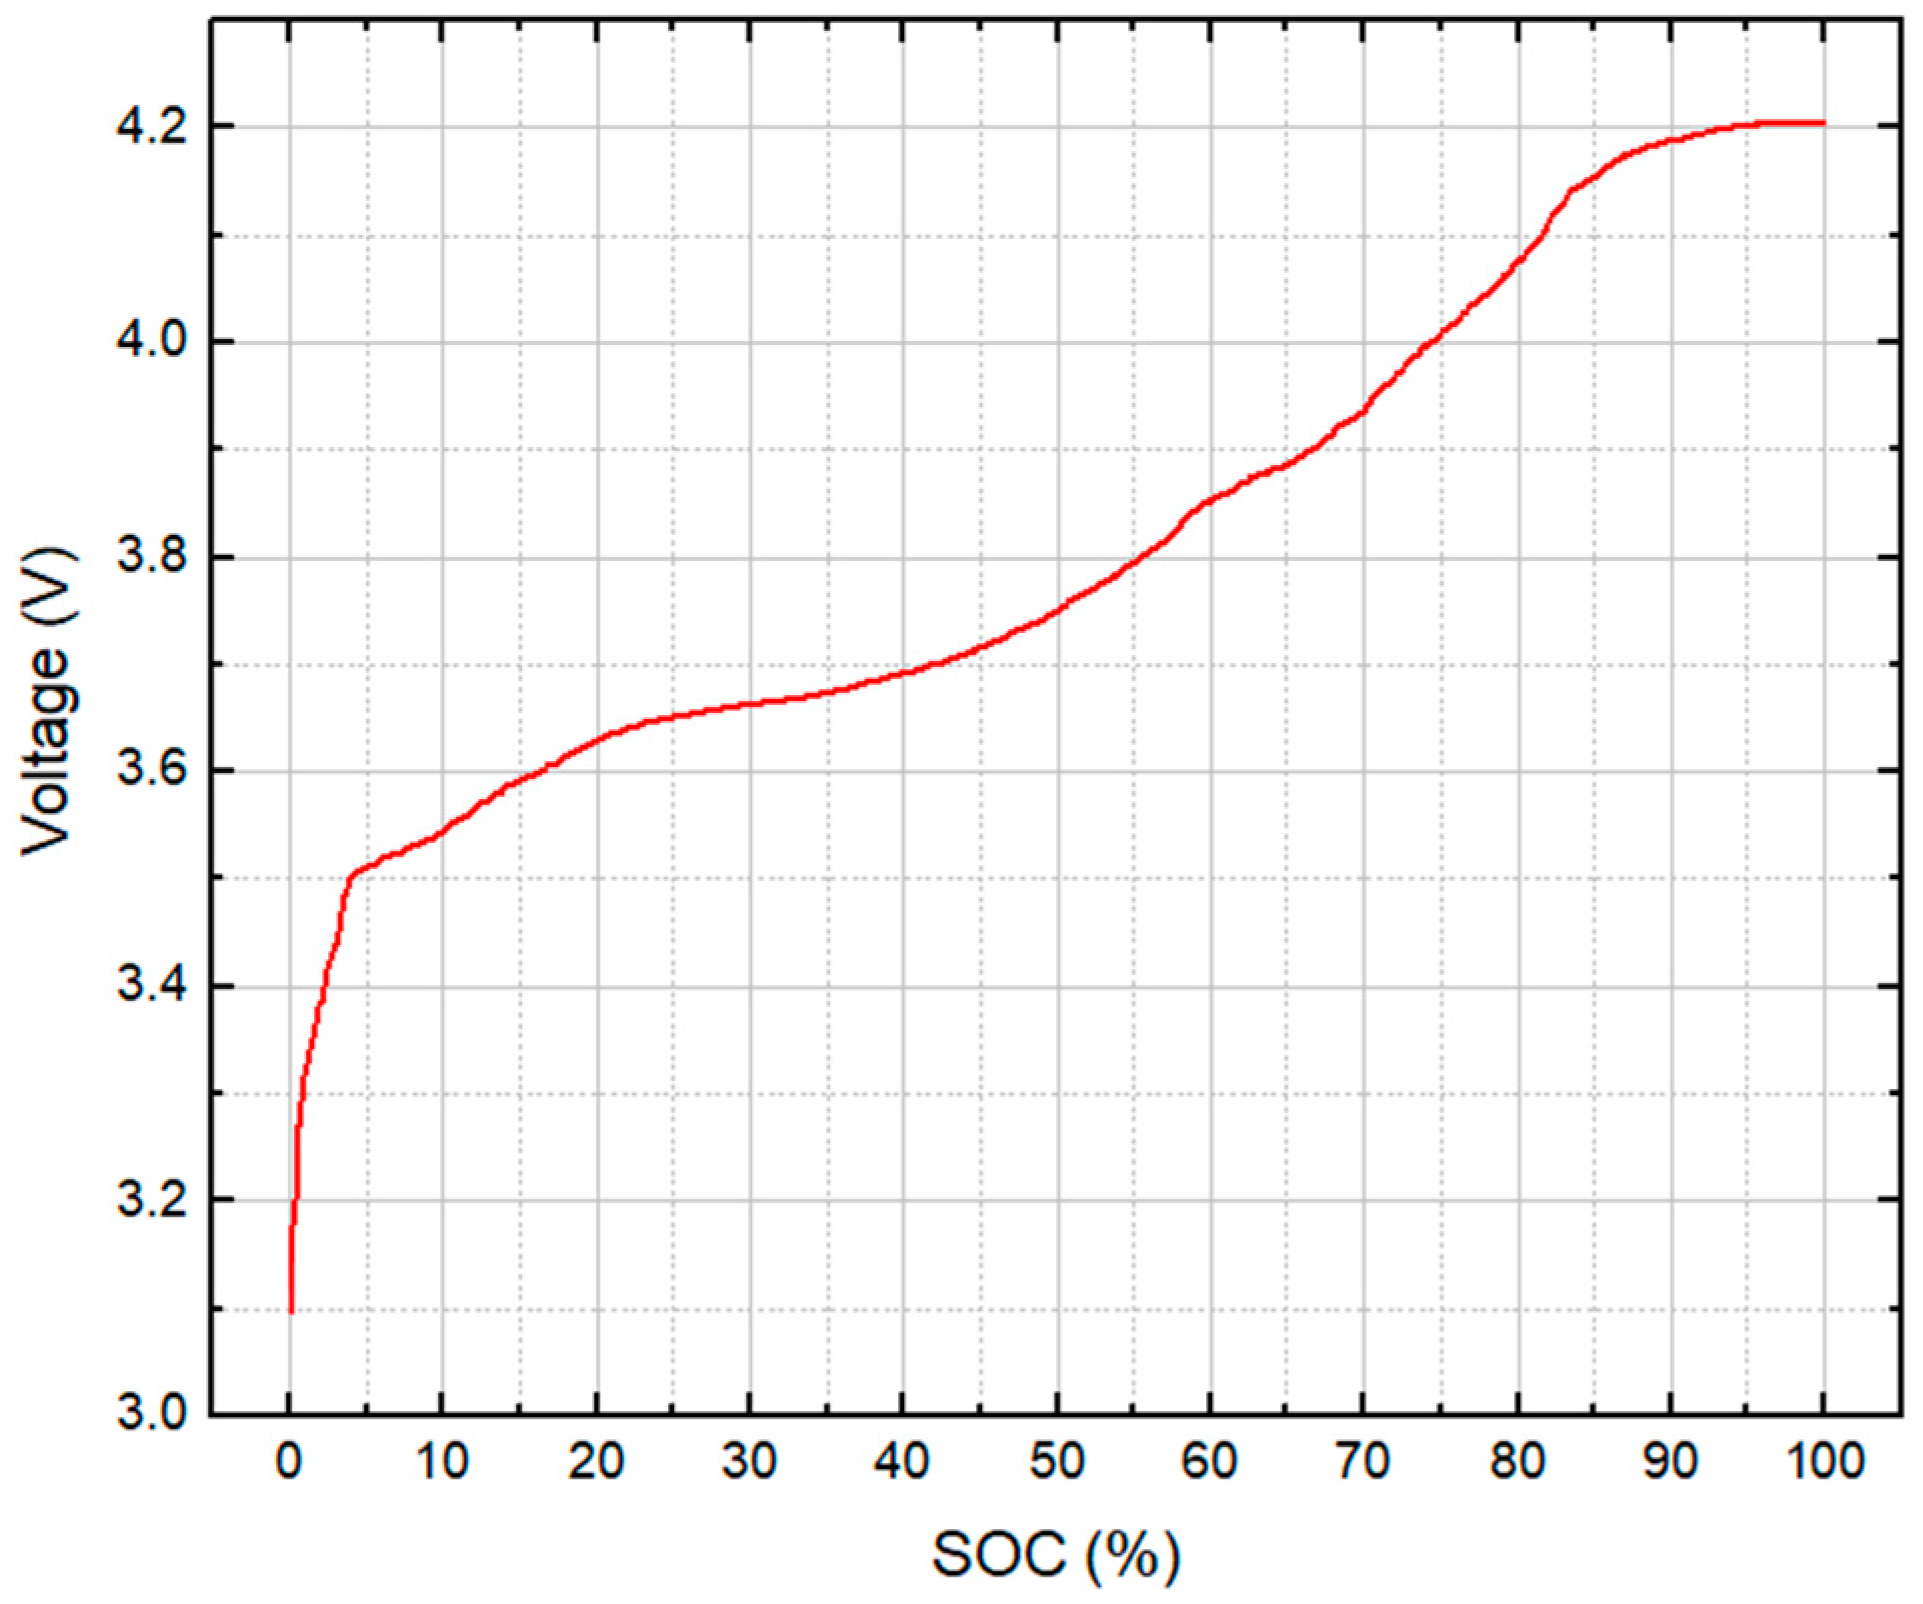
Prior to all tests, the cells were checked to confirm that they did not have any physical damage. The capacities of the cells were determined by three charging and discharging processes (CC-CV) at a C-rate of 0.5 using a Voltcraft multifunctional charger (V-Charge 100 Duo, Conrad Electronic International (HK) Limited, Hong Kong). In this way, the voltage limits, minimum voltage ( U m i n ≈ 0% SOC) and full charge voltage ( U n o m , 100% SOC) were also known, as shown in Figure 3. Each cell was then adjusted to its respective final SOC level ( S O C f ).
A weighing balance (Kern & Sohn GmbH, Balingen-Frommern, Germany) was used to measure the weight of the prepared samples before and after the thermal runaway. The LIB was then placed into a sample container made of stainless steel to reduce and probably inhibit the distribution of particulate fragments in the respective reaction vessels used for test series 1 and 2 and the combustion chamber used for test series 3. All screws were fastened; valves were tightly closed; and the power supply, thermocouples, and pressure transducer were connected.
The pressure and temperature signals were recorded during the test. The total volume of gases released was calculated using the ideal gas law as described in detail in ref. [26].
To measure the gas emissions produced during the thermal runaway, the FTIR analyzer was operated at the required temperature of 180 °C to avoid condensation of flue gas components with a high boiling point in the measuring line. It was calibrated manually using Calcmet Analysis STD Software, (Gasmet Technologies Oy, Helsinki, Finland) ahead of the flue gas analysis. In addition, a gas dilution system was installed to avoid extension of the measurement range of the FTIR, especially for CO, for which the upper limit without a dilution system is 2000 ppm. The dilution factor was 1:100 such that CO concentrations of as much as 20% in volume still could have been resolved.
The flue gas measurements were performed every 10 s, consisting of 3 scans, enabling rapid real-time measurement. The mean values calculated from the 3 scans were used for all gas analysis measurements.

3. Results

Thermal abuse tests at various SOCs (0%, 30%, 50%, 80%, and 100%) were performed on 2.5 Ah, 10 Ah, and 32 Ah Li-cells of NMC chemistry in enclosed vessels. The surface temperature of the cells ( T r e a c ), maximum pressure (absolute), and p m a x inside the reactor were monitored throughout each test conducted in series 1 and 2. The study showed that the thermal stability of lithium-ion pouch cells of NMC chemistry decreases at high SOC levels.

3.1. Thermal Runaway Behavior

As shown in Table 4, the p m a x increased with increasing SOC. The highest p m a x from test series 1 (3.2 ± 0.5 bar) was observed at 100% SOC, and the lowest value (1.2 ± 0.04 bar) was observed at 0% SOC. Low pressure spikes were detected at 0% SOC (test #01–#04). The low measured p m a x may be the result of gas (smoke) released from the cells into the environment. The maximum temperatures ( T r e a c ) measured on the surface of the tested cells (374–402 K) was in the range of the thermal decomposition temperature of the SEI layer [24,27]. This suggests that gas release was only the result of the decomposition of the solid electrolyte interface (SEI) decomposition layer. Visual examination of the post-failure cells indicated that the thermal abuse resulted only in gas release. In addition to the aforementioned observation, the measured p m a x values of 1.3 ± 0.1 bar and 1.34 ± 0.15 bar from the triplicate analysis at 30% SOC (test #05–#07) and 50% SOC (test #09–#11) show that the gas may have been released simply due to the thermally driven decomposition of the solid electrolyte interphase (SEI) layer followed by a reaction between the graphite material with the electrolyte and binder inside the cell. At 80% SOC and 100%, the p m a x values of the cells were measured in ranges of 2.6 ± 0.9 bar and 3.2 ± 0.5 bar, respectively. An explanation of the higher p m a x values measured at an SOC level ≥ 80% could be due to the participation of lithium in the thermal runaway reaction. Further explanation is provided elsewhere [26].
The T r e a c measured at thermal runaway (can be correlated to the sum of the thermal contribution from the decomposition of the SEI layer (Qs), electrolyte (Qe), anode (Qa), and cathode (Qc) in the cell. The initial heat generated from the decomposition of the SEI layer (Qs), which occurs between 363 K and 403 K, leads to the subsequent reaction between the intercalated anode and electrolyte in the temperature range of 373 473 K with the release of energy (Qa-e) [13]. Subsequently, the NMC cathode decomposes (~483 K), followed by an exothermic reaction between the NMC cathode and electrolyte (~503 K). Then, the electrolyte combusts (523–573 K), releasing additional heat energy inside the cell. [28,29]. The total heat generated (Qgen) from the reactions during the abuse test, as mentioned above, can be written as:
Q g e n = Q s + Q a e + Q c + Q c e + Q e
According to the thermal conservation equation, the behavior of the cell during thermal abuse is expressed as [30]:
ρ c p T t = . k T + Q g e n
where ρ  (kg /m3) is the cell density, c p (J/ kg·K) is the specific heat capacity of the cell, T (K) is the temperature, t (s) is time, and k (W /m·K) is the thermal conductivity of the cell.
The total generated heat increases the rate of reaction in the cell, inducing thermal runaway. The occurrence of a series of thermal decompositions showing an SOC dependency is evident in Table 4, as indicated by the presented T r e a c values. In this sense, it can be concluded that the characteristic thermal behavior of the Li cells at an SOC level ≤ 50% is mainly limited to the decomposition of the SEI layer and the reaction between the intercalated anode and electrolyte. The thermal runaway mechanism results in a higher temperature at SOC levels > 50% due to the thermal decomposition involving the cathode and electrolyte.
For cells at 0% (test #01–#03), the T r e a c was measured in a range of 374–402 K. Wang et al. (2006) showed that such cell temperatures could result from the occurrence of a decomposition reaction involving the SEI layer, causing the intercalated lithium anode with electrolyte solvent to release heat [31]. Similarly, the observed T r e a c at 50% SOC could largely be attributed to a successive degradation of the separator materials within the cells [32]. According to Feng et al., the separator material melts during the degradation process. During the phase transition (melting) process, the heat present in the cell is absorbed. This could lead to a small variation in temperature and pressure measurements in #01–#08 (SOC level ≤ 30%) compared to tests #09–#12 (SOC level =50%). It is worth mentioning that the pouch cells tested at SOC level ≤ 50% showed no sign of thermal explosion. However, cell swelling was observed.
At SOC values of approximately 80%, higher T r e a c values were measured. The effects of the high T r e a c and associated P m a x values lead to a thermal expansion and therefore rapture of the cells. However, thermal-runaway-induced explosion of the cells was evident at 100% SOC. It could be reasoned that the level of lithiation at the cathode has an inverse relationship with the thermal stability of the cells. A decrease in the lithiation level at the cathode of the cells as a result of extraction of lithium-ion reduces its thermal stability [33].
The maximum pressure peaks obtained from test series 2 showed distinctive behavior. The p m a x measured from tests #22, #24, and #25 ranged from 1.83 bar to 2.7 bar. The measured p m a x is comparable to measured values obtained from test series 1. In tests #21, #22, #25, #26, and #27–#29, the p m a x range was approximately 4 bar to 7 bar. These high pressure measurements were a resultant of a possible subsequent gas explosion of the gas mixture released into the reaction chamber. Here, the temperatures measured on the cell surface reached the minimum ignition temperature of the ejected gas mixture and therefore caused ignition. For instance, the concentration of CO, CH4, and C2H4 gases measured from tests #27–#29 were within their corresponding explosible range. The gases could have ignited because measured cell surface temperatures exceeded their respective minimum ignition temperatures (CO = 878 K; CH4 = 868 K; C2H4 = 713 K) [34,35].
In test #30 (test series 3), there was no observed ignition of the gas mixture injected into the test chamber. The ignition of the succeeding project from the Li cell was evident in test #31 (Figure 4). Some of the flammable gas emissions were within their explosible range, and the ambient temperature inside the test chamber exceeded the minimum ignition temperature of the emerging gas mixture.
The high T r e a c value measured in test #30 = 750 K, and that measure in test #31 = 978 K, indicating that the gas emission from the cell probably underwent an ignition with a higher T r e a c . Based on tests #21–#29, a T r e a c > 750 K could provide the necessary condition for the ignition of the ejected gas mixture.
It could be deduced from the test series that the ignition source seems to have an influence on the thermal runaway behavior.
On the one hand, the measured T r e a c values from test series 3 (test #30: T r e a c = 750 K at C-rate = 2 and test #31: T r e a c = 978 K at C-rate = 4) are higher than those measured in test series 1 (tests #17–#20: T r e a c ≤ 529 K). One explanation is that the overcharge procedure (test series 3) introduced additional electrical energy into the cell before the thermal runaway was triggered. SOC values of 194% (test #30) and 180% (test #31) were measured prior to thermal runaway (Figure 5). At this point, the amounts of electrical energy inside the cells were 4.85 Ah (test #30) and 4.5 Ah (test #31), resulting in the release of higher energy at a high temperature compared to test series 1 (test #17–#20).
On the other hand, higher values of T r e a c (780–1240 K) were measured in test series 2 compared to both test series 1 and test series 3. The reported correlation between T r e a c and the stored electrical energy of the cell confirms that assumption. In test series 2, the electrical energies stored in the tested cells were 10 Ah (test #21–#23), 20 Ah i.e., 2 × 10 Ah (test #24–#26), and 32 Ah (test #27–#29); therefore, thermal runaway from the test would definitely lead to the measurement of a comparably high T r e a c .
In test series 3, the thermal runaway occurred in tests #30 and #31 in about 1640 s and 720 s, respectively. This indicates that the onset of thermal runaway is dependent on the overcharge rate (C rate). At a high C rate, a greater amount of energy is introduced into the cell per unit time. The onset of thermal runaway in test #30 (at C rate = 2) was approximately 2 times that of test #31 (at C rate = 4). The results indicate that the onset of thermal runaway has an inverse relationship with the overcharge rate.
Upon overcharge, lithium that has not moved to occupy the intercalation site in the anode is deposited on the surface of the anode [36]. This formation is termed lithium plating. According to Lin et. al, lithium plating forms lithium dendrite, which penetrates the separator and causes an internal short circuit [37]. In a study by Juarez-Robles et al., lithium plating and electrolyte decomposition were observed when the voltage in a cell exceeded 4.5 V [38]. As shown in Figure 5, 4.5 V was exceeded earlier in test #31 (C rate = 4) than in test #30 (C-rate = 2). The probable early occurrence of lithium plating during overcharge at a high C rate could have contributed to the earlier onset time of thermal runaway.
It is established that lithium-ion battery degradation is enhanced at a higher C rate. According to the literature, the formation of some combustible gases, namely H2, CH4, CO, C2H6, and C2H4, attributed to the decomposition of the electrolyte was significant at a high C rate [39,40]. The presence of combustible gases in significant amounts (thus, at a high C rate) at an elevated temperature could result in early occurrence of thermal runaway. This was evident in test series 3, for which runaway occurred at a higher SOC (194%) in test #30 compared to test #31 (SOC = 180%).

3.2. Released Gases

The total volume of released gas was calculated by considering the change in pressure in each test and the ideal gas law. Under the assumption that the gas inside the reaction vessel has cooled down to ambient temperature after sufficient time, the change in the number of moles in the gas phase can be calculated according to Equation (3).
n = V R T p
where V is the free inner volume of the reactor, R is the universal gas constant, T is the initial (and final) gas temperature, and Δ p is the difference between the final pressure ( p f ) and initial pressure ( p i ), as illustrated in Figure 6.
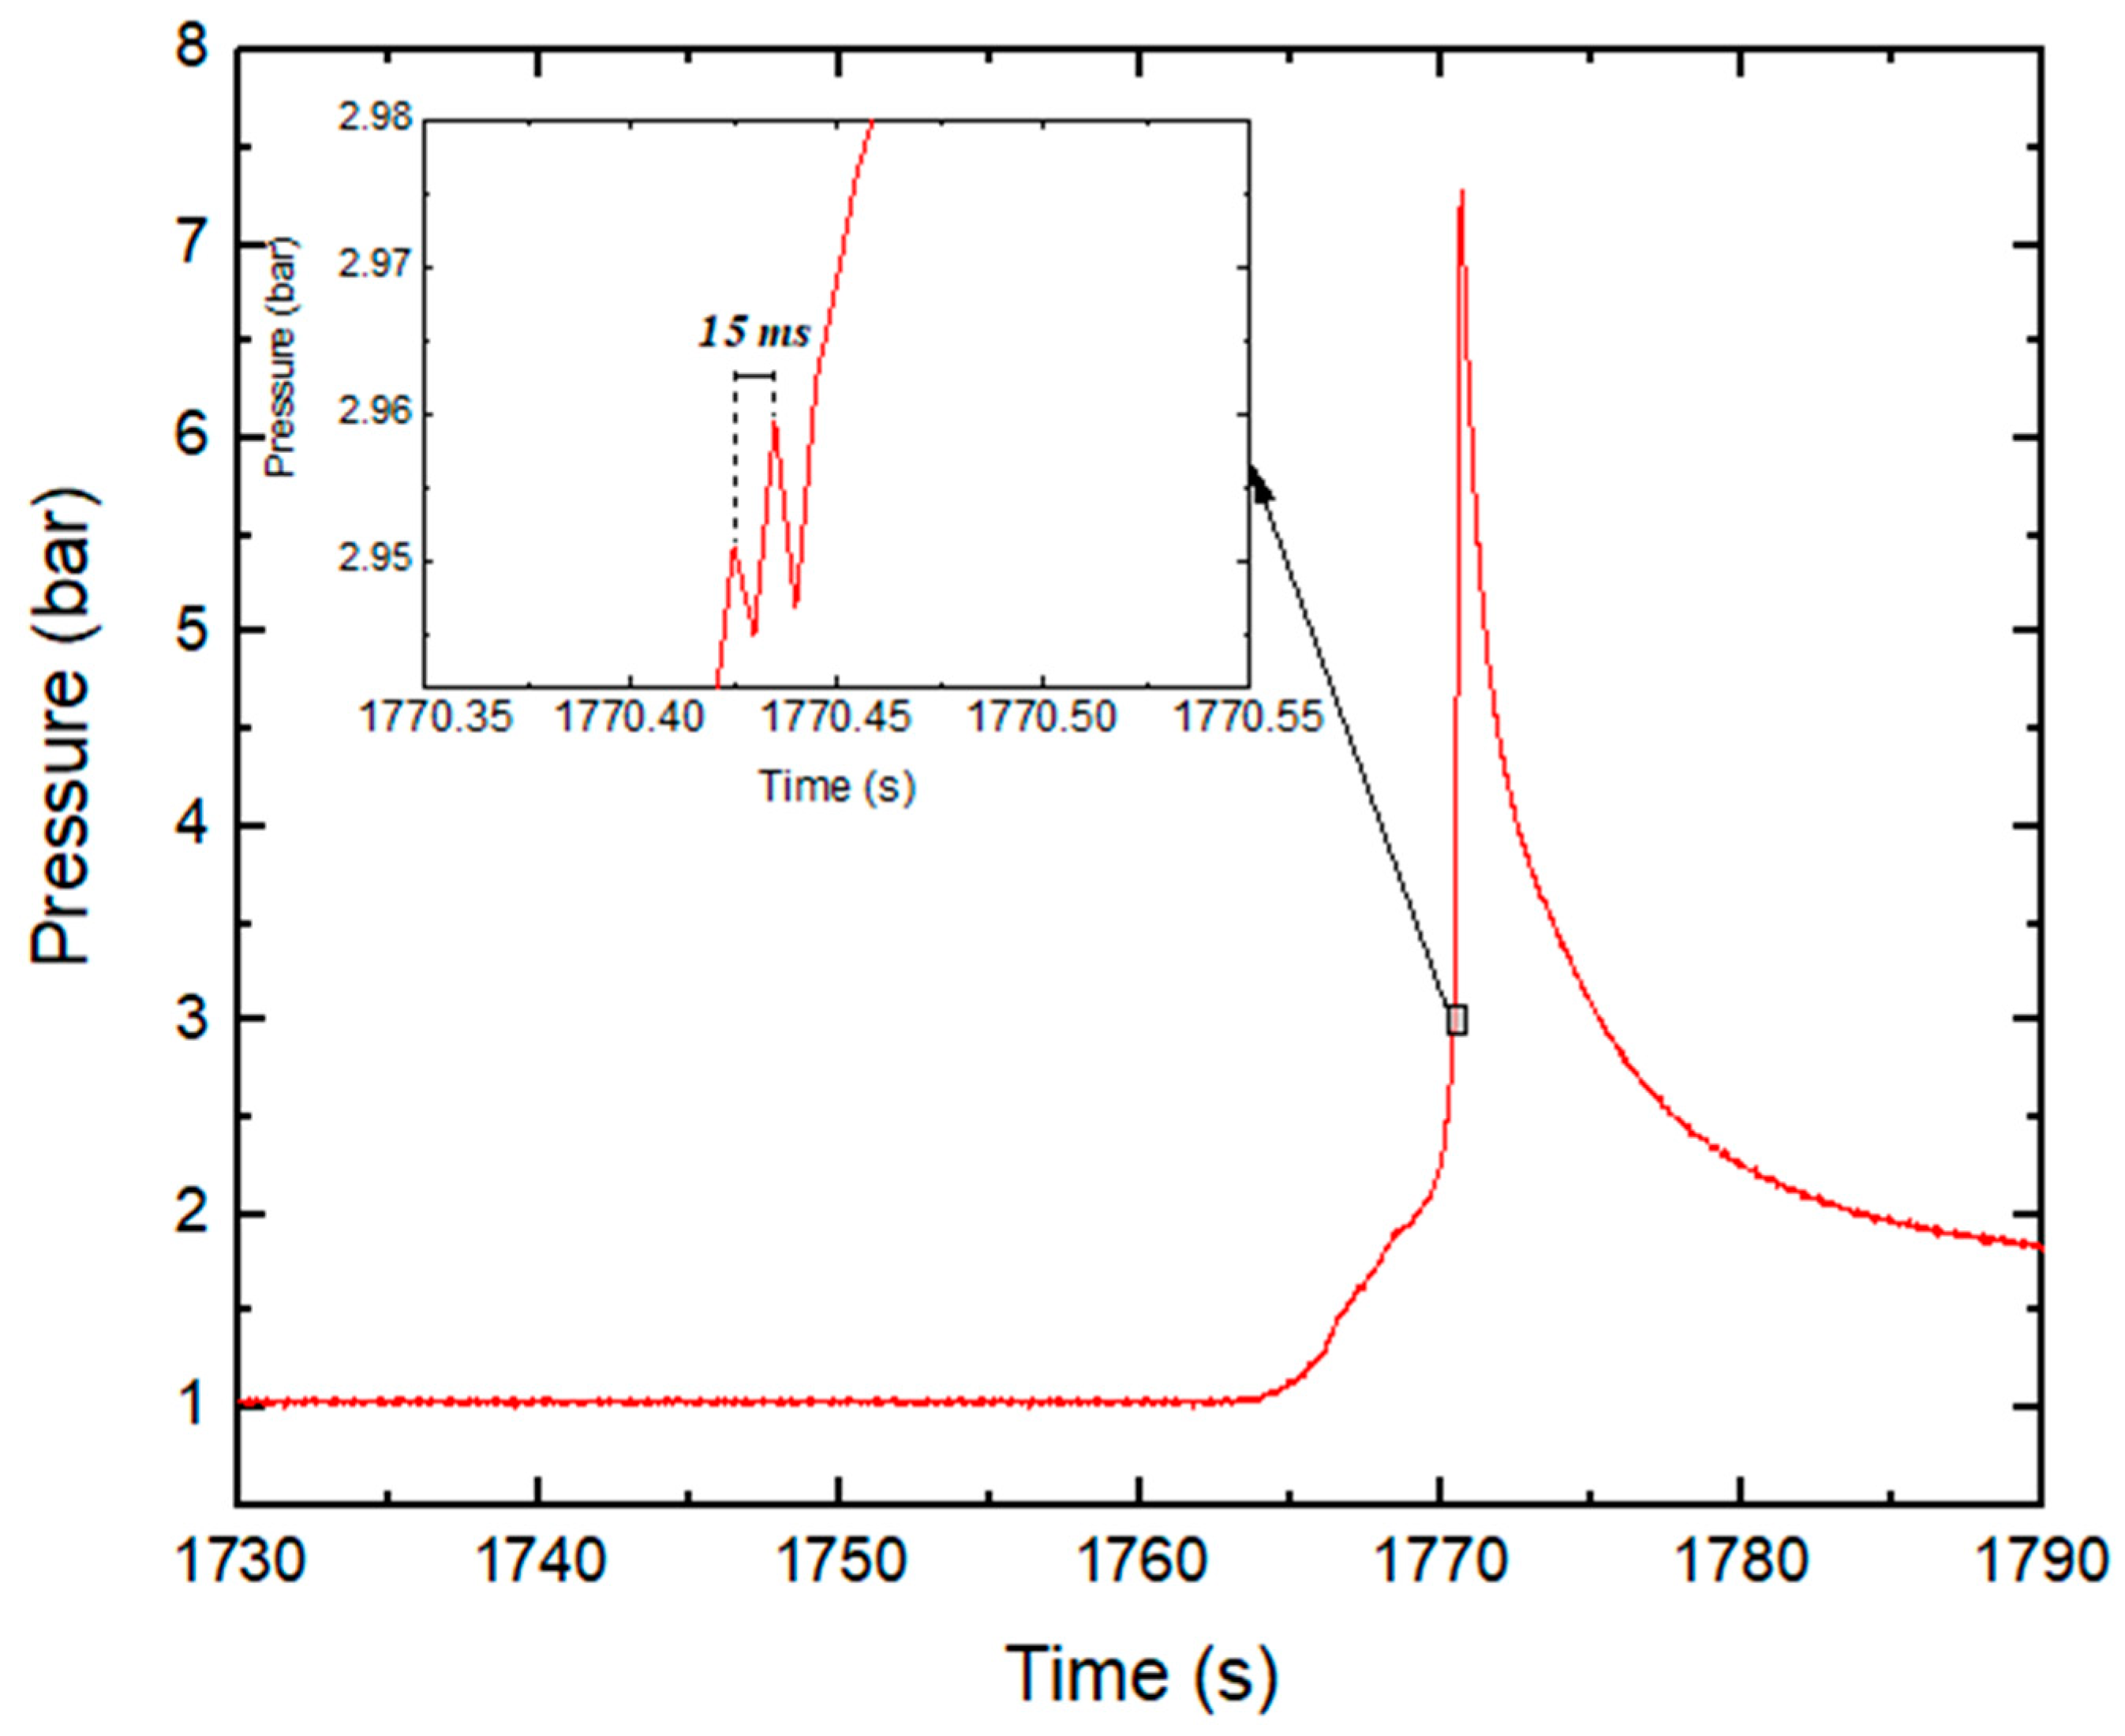
In some experiments, the gas release was followed by an immediate ignition of the gases. Then, the maximum pressure inside the reaction vessel reached a level comparable to that of closed-vessel gas explosions [41,42]. Such a case is depicted in Figure 6.
In test series 1, an insignificant amount of gas emission (⪅1 L) was released at SOC levels ≤ 30%, while the highest amount of gas (6.5 ± 0.4 L) was measured at 100% SOC. The gas release at 100% SOC is in agreement with the findings of Golubkov et al. (2014). At SOC levels ≥ 80%, a comparably significant amount of gas (4.8 ± 0.6 L) was released at thermal runaway. The volume of gas produced at 100% SOC was more than three times larger than the release at 50% SOC (i.e., 1.9 L).
The normalized volumes of gas emission at 30% SOC and 50% SOC were 1.2 ± 0.2 L / A h and 1.2 ± 0.3 L / A h , respectively. The values obtained (at an SOC level ≤ 50%) demonstrated that the gas release occurs with less influence of the SOC.
The normalized volumes of gas released at 80% and 100% SOC were 2.4 ± 0.3 L / A h and 2.6 ± 0.2 L / A h , respectively. This provides a clear indication that the maximum gas release is likely to occur at SOC levels ≥ 80%. In addition, the literature shows that the normalized volume of gas relative to the capacity proportion of NMC cells is in the range of 1.2–2.5 L / A h [13,43]. The measured values fit into the data reported in literature.
In test series 2, the highest level of gas release (102 ± 4 L) was generated from tests #27–#29 (32 A h NMC cells), with a normalized gas volume of 3.2 ± 0.1 L / A h . In three tests (#21, #22, and #23) with 10 Ah single cells, the amount of gas released from tests #21 and #22 was 16.5 ± 1.5 L (1.65 ± 0.15 L / A h ), while a higher volume of up to 42 L (4.2 L / A h ) was produced in test #23. Likewise, tests #24 and #25 (double cells) produced 42 ± 1 L of gas, corresponding to a normalized value of 2.15 ± 0.05 L / A h . The characteristic emission of the abovementioned double cells was smaller than that obtain in test #26 (71 L; 3.6 L / A h ). The divergence of the observation cannot be explained by the increase in the number of moles added to the gas phase due to gas emission.
Figure 7 shows that the thermal runaway in test #26 generated a p m a x of 2.96 bar, followed by a succeeding high-pressure peak ( p m a x = 7.28 bar) within 35 ms. Although the minimum ignition temperatures and lower explosion limits of the gas mixtures released during thermal runaway are the subject of a succeeding project, it can be stated that the composition of the gas mixture inside the RV could have reached the explosible range and that the surface temperatures of the cells during runaway exceeded the minimum ignition temperature of the emerging gas mixtures in these tests.

3.3. Composition of Released Gases

The average concentrations of the most relevant analyzed gas components are presented in Table 5. In test series 1, the prevailing gas components, i.e., CO2 (≈48 ± 1 vol%), C2H4 (≈8.1 ± 2.3 vol%), CO (≈6.8 ± 0.9 vol%), and CH4 (≈4.3 ± 0.9 vol%), were measured at 100% SOC. No CO2 was detected at SOC levels of 0% (tests #01–#04) and 30% (#05–#08), which means that the reaction is less complete during thermal abuse. The production of CO2, CO, CH4, C2H6, and C2H4 was promoted at high SOC levels, indicating that the conversion of the organic content of the cells into the gas phase is highly dependent on the SOC. Notably, a large fraction of the organic compounds was converted to CO2 at a higher SOC. Additionally, the high measured volume of CO is evidence that the gases are released as a result of incomplete combustion.
The measured concentration of HF from the untreated gas emission is ranges from 8.5 ppm to 22 ppm. A clear trend for HF production could not be established. However, the highest HF (22 ppm) was produced at 100% SOC. The range of HF values is consistent with that reported by Larsson et al. (2016) [44]. In test series 2, none of the measured gas mixtures contained HF gas in a substantial concentration. A possible reason could be the test setup (difference in the volume of the reactor vessel). In test series 1, the HF was injected into a 10-L reactor, whereas the gas component was injected a 100-L reactor in test series 2. Therefore, it can be concluded that the ambient air in the void volume of the reactor and further dilution have influence HF detection.
Furthermore, if the HF had been released in low concentrations, the dilution factor of 1:100 might have led to HF concentrations below the limit of detection (LOD, 1 ppm).
The concentration of HCN from the untreated gas mixture was identified to be between 34 ppm and 200 ppm and was clearly higher at high SOC levels. The laminated aluminum film used in the case of pouch cells contains polyamide [45]. In the event of thermal decomposition of the polyamide, ammonia (NH3) could be produced [46]. The resulting reaction of NH3 could possibly be promoted by the presence of CH4 and CO to produce HCN:
CO + NH3 → HCN + H2O
CH4 + NH3 → HCN + 3 H2
CH4 + NH3 + 1.5 O2 → HCN + 3 H2O
Generally, test series 2 shows that the relative concentration of CO increased with higher cell capacity. Higher concentrations of CO release were observed in tests #26 and #27–#29. The measured concentration of CO emission in test #26 (168,500 ppm; 16.85 vol%) was the highest, with lowest emission (29,220 ppm; 2.92 vol%) measured in test #22. The CO emission in test #26 was about 2.5 times higher than that of tests #24–#25 (10 A h double-cells). Additionally, test #26 produced approximately 4–6 times more CO compared to test #21–#23.
The amount of CH4 released was between 8040 ppm and 76,050 ppm. The concentration of CH4 increased with increasing cell capacity. Using test #21 (in which the least amount of CH4 was measured among the series) as a basis, the generated concentration of CH4 increased by a factor of 9.5 with respect to test #29.
Among the ejected gases, HCN was released in the lowest concentrations. HCN emission was measured to be between 80 ppm and 380 ppm. Unlike tests #23 and #27–#29, the concentration of HCN emission in test #26 (80 ppm) did not differ considerably compared to tests #21–#22 (105 ± 5 ppm). The autoignition temperature is known to be 811 K [47]. Such high temperatures were recorded in LIBs with high SOC values and capacities, meaning that HCN could have also autoignited to form other products at temperatures above this set value.
Compared to the other hydrocarbons considered in both test series, the concentration of generated C2H6 was low. The concentrations of C2H6 released from the cells was the lowest compared to the other analyzed hydrocarbons (CH4 and C2H4).
Similarly to CH4, the release of C2H4 showed an increase with regards to cell capacity. A low amount of C2H4 was measured in test #26 compared to the other double cells (tests #24–#25). The reason for this observation might be the decomposition of C2H4 to form other components, as the autoignition temperature of 723 K was exceeded.

3.4. Explosibility of Released Gases

Five combustible gases, namely CO, HCN, CH4, C2H4, and C2H6, were studied using their respective explosible ranges [48,49,50]. The measured ranges of the gas components of the untreated gas mixture from test series 1 and 2 (tests #17–#29) at 100% SOC are presented in Table 6.
Table 6 shows that the concentrations of gases released during the aforementioned tests reached the explosible range. Applying Le Chatelier’s law based on the lowest values measured for the individual components (see Table 6) yields a lower explosion limit (LEL) of 7% in the volume fraction for the gas mixture and an upper explosion limit (UEL) of 31% in volume.
H2O and CO2 are known to be effective inhibitors of fires and explosions; however, the free volume of the reactor vessel contains sufficient oxygen to support a secondary explosion.
As presented in Table 5 and Table 6, two (HCN, C2H6) out of the five analyzed flammable gases had concentrations below that of the explosible range. CO, CH4, and C2H4 were detected at levels within their corresponding limits. Therefore, the risk of further combustion could be supported by these explosible compounds in the presence of an ignition source and substantial amount of air. The 32 A h lithium-ion cells (test #27–#29) released CO, CH4, and C2H4 in concentrations of approximately 13.61 ± 1.2 vol%, 6.08 ± 1.5 vol%, and 7.10 ± 0.8 vol%, respectively, all of which are above the LEL. Similar observations were made in test #26, in which the concentration of released CO was 16.85 vol%; tests #17–#19 (8.12 ± 2.32 vol%); test #24 (3.51 vol%); and test #25 (3.77 vol%), in which the measured C2H4 exceeded the LEL.

3.5. Gas Treatment with a Pyrobubble Filter

A filter comprising hollow sphere glass granulate (so-called pyrobubble) was used for the removal of the studied gas components released during the thermal abuse. The values obtained from the test with the filter were used to calculate the removal efficiency based on the gas component emission from the triplicate tests conducted in test series 1 according to Equation (2).
Here, the removal of gas component i ( r i ) was:
r i % = C i C f C i × 100 %
where C i is the average concentration of gas component i without the pyrobubble filter, while C f is the concentration of gas component i in a test with the pyrobubble filter.
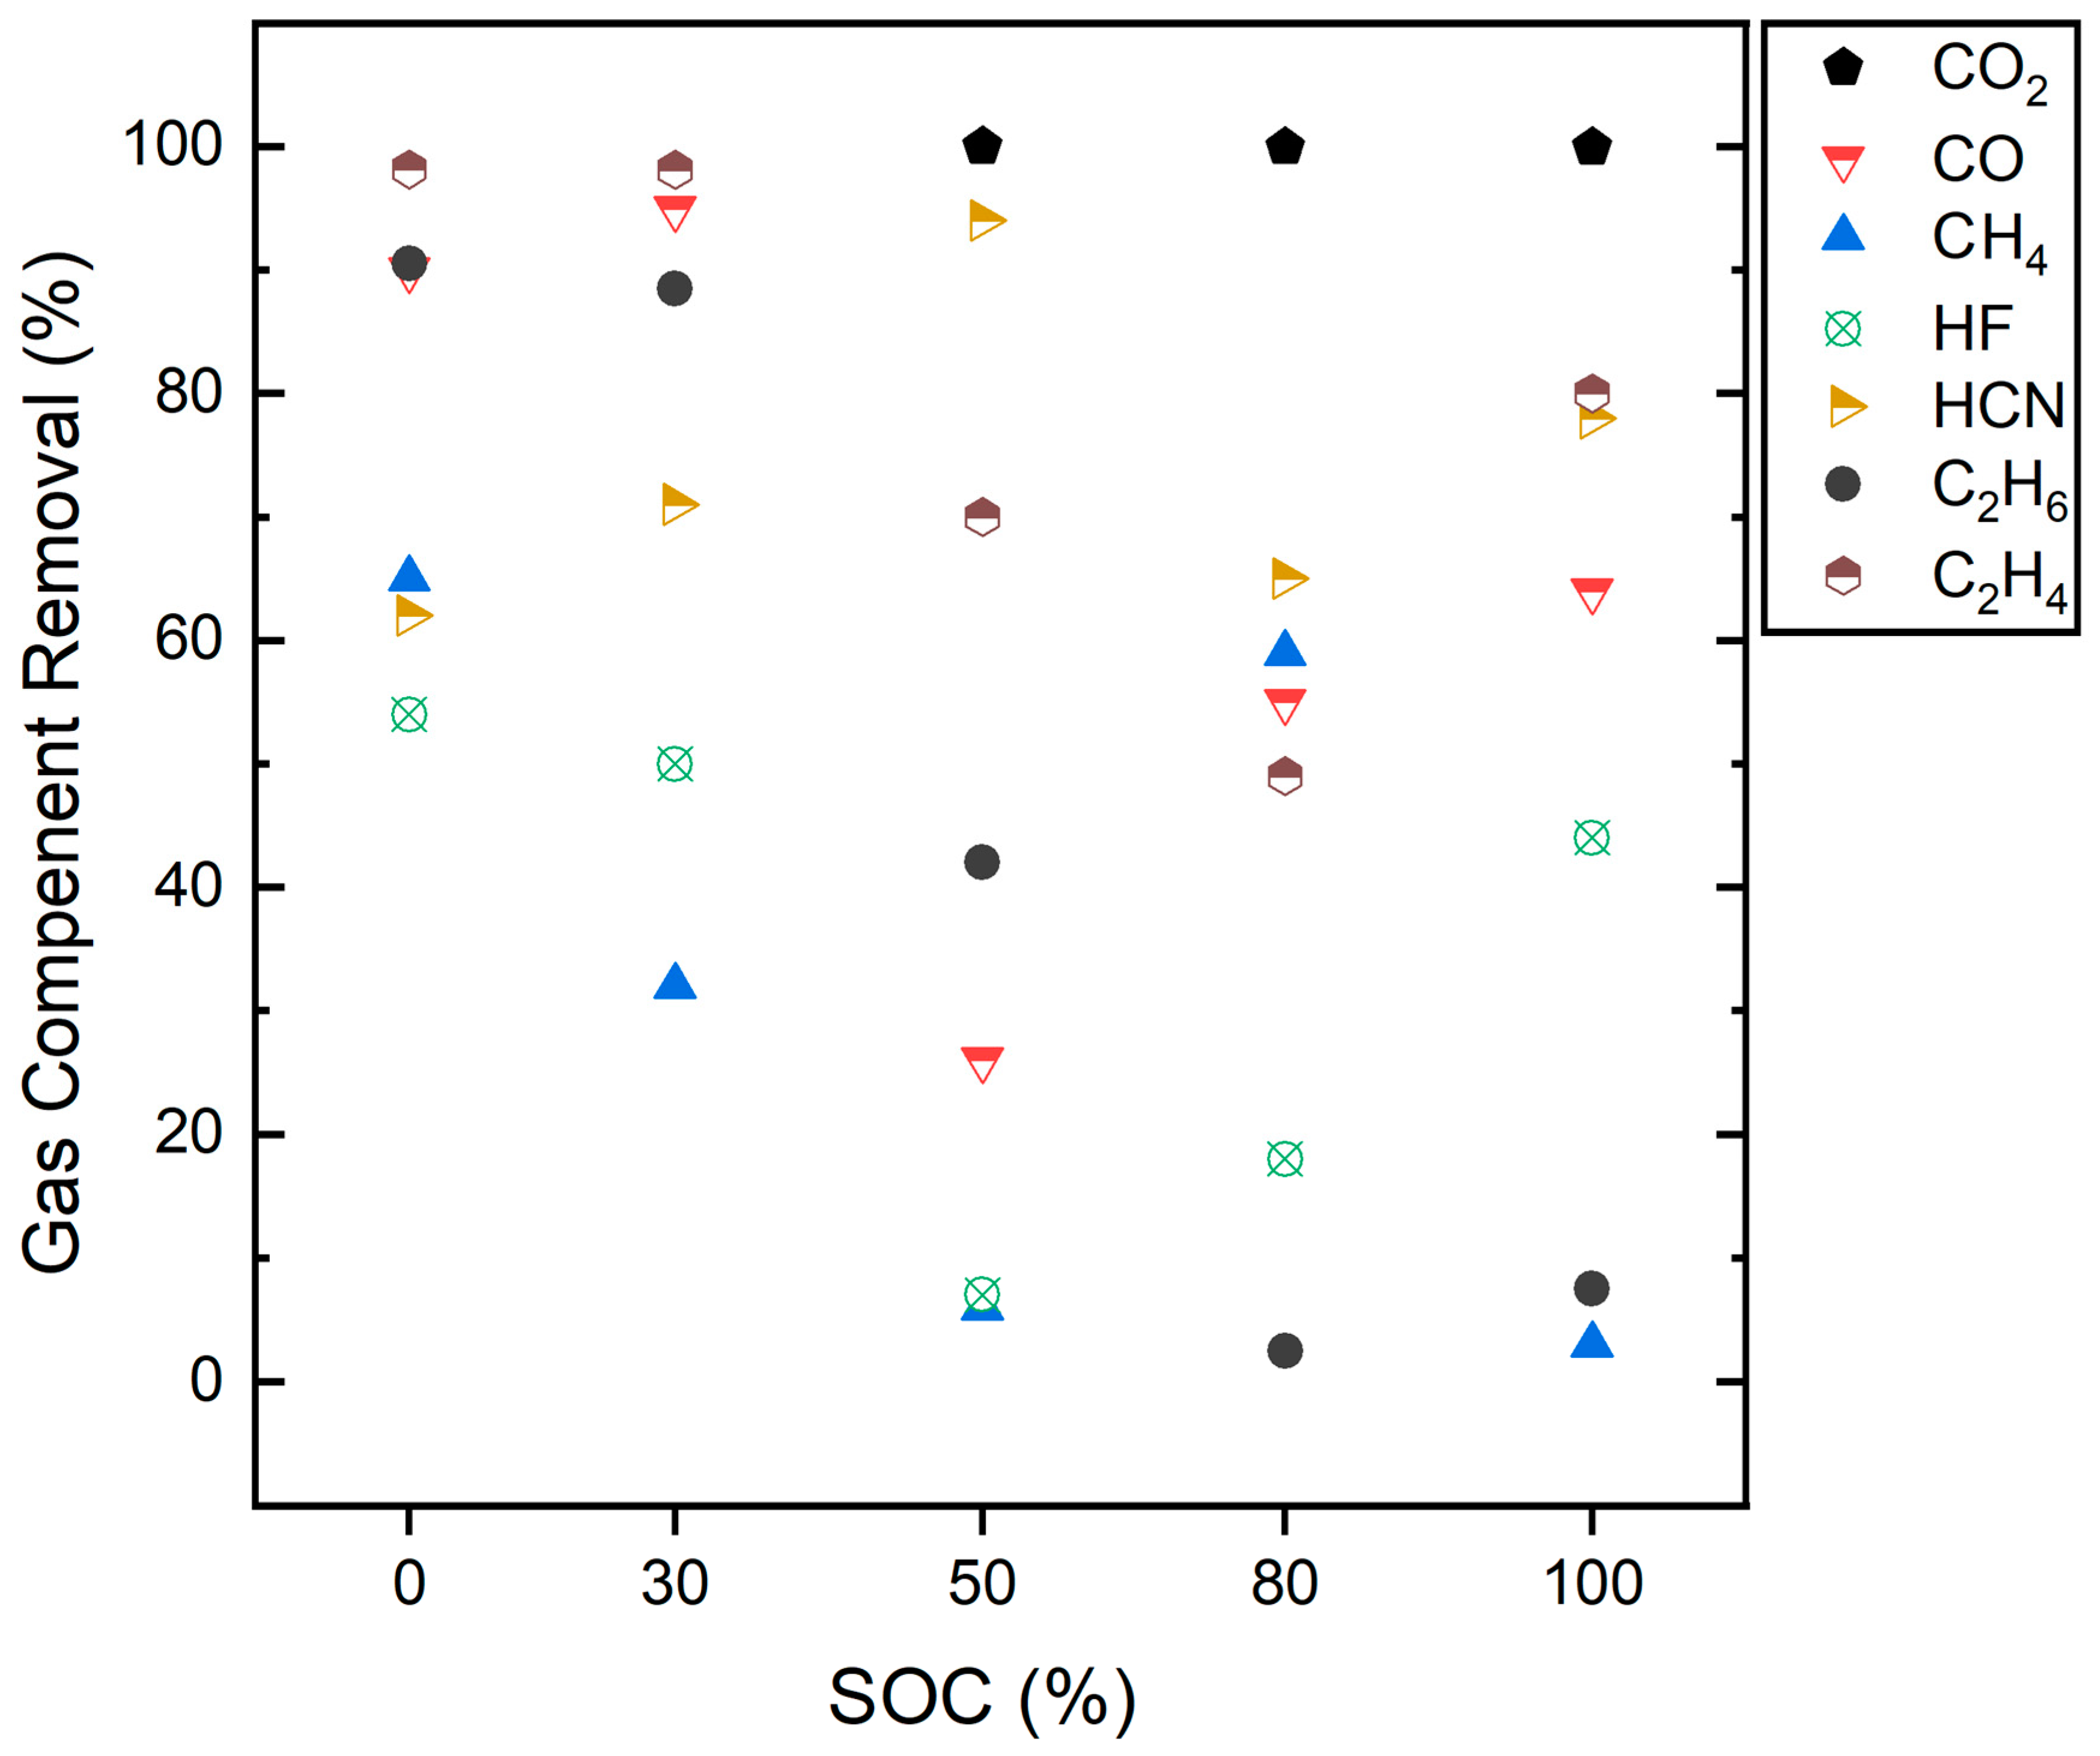
Figure 8 shows gas component removal at various SOC states. According to the gas emission data presented in Table 5, up to 48 vol% of CO2 was detected (see tests #17–#19). The total amount of CO2 released at the respective SOC levels was reduced to an insignificant level (99.96–100% removal), irrespective of the high concentrations detected. The removal of CO ranged between 26 and 95%. A clear relation was not established for CO removal. However, at high SOC values, the removal of CO was less effective.
A similar observation was made for C2H6, with a lower percentage of removal at high SOC states. The removal of C2H6 was observed to be lower at high SOC value, although a linear trend could not be established. Additionally, 86%–92% removal was achieved for C2H6 at SOC levels ≤ 30%. The ineffectiveness of the pyrobubbles at high SOC value may be related to the amount of CO2 released, as elaborated in the following paragraph.
The retention of HF and HCN by the pyrobubble bed did not follow a particular pattern. However, the respective removal ranges of 7–54% and 62–94% cannot be neglected. The removal efficiency of the pyrobubble filter may be influenced by the available active sites. In the case of the gas components such as CH4, C2H4, and C2H6, the removal rate was generally lower at a high-SOC states. After the near-complete removal of highly concentrated CO2, there were likely fewer active sites available for component removal, resulting in the observed outcome.
Although the diffusion of the gas component through the pores of the pyrobubbles was not studied, we can deduce that retention of high-concentration gas components such as CO2 resulted in the saturation of the pyrobubbles. At this point, gas component reduction cannot be controlled by diffusion, and it is possible for some gas components to pass through the pyrobubble bed without being adsorbed.

4. Conclusions

This study revealed that the concentrations of gaseous emissions consisting of CO, CH4, C2H4, C2H6, and HCN are likely to exceed the LEL of the gas mixture. Among the analyzed gases, CO and CH4, together with C2H4, were detected in levels within their corresponding individual flammability ranges. The inhibiting effect of inert gases such as CO2 and water vapor does not reliably prevent ignition of the gas mixture ejected from batteries. In the presented test series, a secondary explosion occurred in one test, leading to a maximum pressure of about 7 bars in the 100 L-reactor. Presumable ignition sources were either the hot gases themselves or hot metal parts of the battery. A test performed in an enclosed vessel showed an ignition of the hot gas ejected into the environment. This observation confirmed that hazards associated with the occurrence of secondary explosion cannot be neglected.
It could be deduced from the test series that the ignition source seems to have an influence on the thermal runaway behavior. For cells triggered by the overcharge procedure, the addition electrical energy introduced into the cell resulted in the release of higher energy at a higher temperature compared to cells triggered by overheating. The results indicate that the onset of thermal runaway has an inverse relationship with the overcharge rate. Therefore, lithium-ion battery degradation is enhanced at higher C rates.
Overall, the test series revealed that treatment with hollow-sphere glass granulate can be used to lower the concentration of the gas components released during thermal runaway. The drop in the concentration of the gas components minimizes the risk of occurrence of a secondary explosion.

Author Contributions

Conceptualization, U.K. and R.T.; Investigation, K.O.A.A., E.G., N.B., R.T. and T.R.; Supervision, S.-K.H., R.T. and U.K.; writing—original draft preparation, K.O.A.A. and U.K.; writing—review and editing, U.K., P.V., E.G., N.B., R.T., K.O.A.A., T.R. and S.-K.H. All authors have read and agreed to the published version of the manuscript.

Funding

This research received no external funding.

Institutional Review Board Statement

Not applicable.

Informed Consent Statement

Not applicable.

Data Availability Statement

All the data are included in the paper.

Conflicts of Interest

The authors declare no conflict of interest.

References

  1. Jindal, P.; Bhattacharya, J. Review—Understanding the Thermal Runaway Behavior of Li-Ion Batteries through Experimental Techniques. J. Electrochem. Soc. 2019, 166, A2165. [Google Scholar] [CrossRef]
  2. Spotnitz, R.M.; Weaver, J.; Yeduvaka, G.; Doughty, D.H.; Roth, E.P. Simulation of Abuse Tolerance of Lithium-ion Battery Packs. J. Power Sources 2007, 163, 1080–1086. [Google Scholar] [CrossRef]
  3. Golubkov, A.W.; Fuchs, D.; Wagner, J.; Wiltsche, H.; Stangl, C.; Fauler, G.; Voitic, G.; Thaler, A.; Hacker, V. Thermal-runaway Experiments on Consumer Li-ion Batteries with Metal-oxide and Olivin-type Cathodes. RSC Adv. 2014, 4, 3633–3642. [Google Scholar] [CrossRef]
  4. Golubkov, A.W.; Scheikl, S.; Planteu, R.; Voitic, G.; Wiltsche, H.; Stangl, C.; Fauler, G.; Thaler, A.; Hacker, V. Thermal Runaway of Commercial 18650 Li-ion Batteries with LFP and NCA Cathodes—Impact of state of charge and overcharge. RSC Adv. 2015, 5, 57171–57186. [Google Scholar] [CrossRef]
  5. Maloney, T. Lithium Battery Thermal Runaway Vent Gas Analysis; Final Report; Federal Aviation Administration: Washington, DC, USA, 2016; pp. 1–35.
  6. Larsson, F.; Andersson, P.; Blomqvist, P.; Mellander, B.-E. Toxic Fluoride Gas Emissions from Lithium-ion Battery Fires. Sci. Rep. 2017, 7, 10018. [Google Scholar] [CrossRef]
  7. Chen, S.; Wang, Z.; Wang, J.; Tong, X.; Yan, W. Lower explosion limit of the vented gases from Li-ion batteries thermal runaway in high temperature condition. J. Loss Prev. Process Ind. 2020, 63, 103992. [Google Scholar] [CrossRef]
  8. Niu, H.; Chen, C.; Ji, D.; Li, Z.; Liu, Y.; Huang, X. Thermal-Runaway Propagation over a Linear Cylindrical Battery Module. Fire Technol. 2020, 56, 2491–2507. [Google Scholar] [CrossRef]
  9. Yuan, L.; Dubaniewicz, T.; Zlochower, I.; Thomas, R.; Rayyan, N. Experimental Study on Thermal Runaway and Vented Gases of Lithium-ion Cells. Process Saf. Environ. Prot. 2020, 144, 186–192. [Google Scholar] [CrossRef]
  10. Kwade, A.; Diekman, J.; Hanisch, C.; Spengler, T.; Thies, C.; Herrmann, C.; Droeder, K.; Cerdas, J.F.; Gerbers, R.; Scholl, S.; et al. Recycling von Lithium-Ionen-Batterien—LithoRec II. Abschl. Der TU Braunschw. 2016, 239, 41. [Google Scholar]
  11. Nedjalkov, A.; Meyer, J.; Köhring, M.; Doering, A.; Angelmahr, M.; Dahle, S.; Sander, A.; Fischer, A.; Schade, W. Toxic Gas Emissions from Damaged Lithium Ion Batteries—Analysis and Safety Enhancement Solution. Batteries 2016, 2, 5. [Google Scholar] [CrossRef]
  12. Sturk, D.; Rosell, L.; Blomqvist, P.; Tidblad, A.A. Analysis of Li-Ion Battery Gases Vented in an Inert Atmosphere Thermal Test Chamber. Batteries 2019, 5, 61. [Google Scholar] [CrossRef]
  13. Essl, C.; Golubkov, A.W.; Gasser, E.; Nachtnebel, M. Comprehensive Hazard Analysis of Failing Automotive Lithium-Ion Batteries in Overtemperature Experiments. Batteries 2020, 6, 30. [Google Scholar] [CrossRef]
  14. Tutu, A. BMW i8 Catches Fire in The Netherlands, Firefighters Drop It in Water Container. Autoevolution. 2019. Available online: https://www.autoevolution.com/news/bmw-i8-catches-fire-in-the-netherlands-firefighters-drop-it-in-water-container-133267.html (accessed on 20 July 2022).
  15. Edwards, E. The Battery Behind Dangerous and Deadly E-cigarette Explosions. NBC News. Available online: https://www.nbcnews.com/health/health-news/battery-behind-dangerous-deadly-e-cigarette-explosions-n1032901 (accessed on 24 June 2022).
  16. Ban-Seok, J. In the Electric Vehicle That Was Being Charged, ‘the Fire of the City’ Vehicle Burner. 2020. Available online: https://news.sbs.co.kr/news/endPage.do?news_id=N1005812034 (accessed on 17 July 2022).
  17. Sun, P.; Bisschop, R.; Huichang, N.; Huang, X. A Review of Battery Fires in Electric Vehicles. Fire Technol. 2020, 56, 1361–1410. [Google Scholar] [CrossRef]
  18. Diaz, F.; Wang, Y.; Weyhe, R.; Friedrich, B. Gas Generation Measurement and Evaluation during Mechanical Processing and Thermal Treatment of Spent Li-ion Batteries. Waste Manag. 2019, 84, 102–111. [Google Scholar] [CrossRef]
  19. Warner, N. Overview of a Year of Battery Fire Testing by DNV GL for Con Ed, NYSERDA and FDNY. In Proceedings of the NFPA 855 Committee Meeting, New York, NT, USA, 4 January 2017; pp. 1–34. [Google Scholar]
  20. Hattwig, M.; Steen, H. Handbook of Explosion Prevention and Protection; WILEY-VCH Verlag GmbH & Co. KGaA: Weinheim, Germany, 2004. [Google Scholar]
  21. Webster, H.; Maloney, T.; Summer, S.M.; Dadia, D.; Rehn, S.J.; Karp, M. Summary of FAA Studies Related to the Hazards Produced by Lithium Cells in Thermal Runaway in Aircraft Cargo Compartments; Final Report; U.S. Department of Transportation Federal Aviation Administration: Washington, DC, USA, 2016.
  22. Somandepalli, V.; Marr, K.; Horn, Q. Quantification of Combustion Hazards of Thermal Runaway Failures in Lithium-ion Batteries. SAE Int. J. Alt. Power 2014, 3, 98–104. [Google Scholar] [CrossRef]
  23. Muhammad, S. State of Charge Dependent Thermal Runaway Detection of Lithium Ion Battery under Mechanical Abuse Condition. Doctoral Thesis, University of Sunderland, Sunderland, UK, March 2018; p. 228. [Google Scholar]
  24. Roth, P.E.; Crafts, C.C.; Doughty, D.H.; McBreen, J. Advanced Technology Development Program for Lithium-Ion Batteries: Thermal Abuse Performance of 18650 Li-ion Cells; Technical Report; Sandia National Laboratories: Albuquerque, NM, USA, 2004. [Google Scholar]
  25. Pan, Q.; Weyhe, R.; Melber, A.; Klavina, I.; Friedrich, B. Investigation on Packaging Materials for Safe Transport of Spent Li-ion Batteries. In Proceedings of the 19th International Congress for Battery Recycling (ICBR), Hamburg, Germany, 24–26 September 2014. [Google Scholar]
  26. Amano, O.A.K.; Hahn, S.-K.; Tschirschwitz, R.; Rappsilber, T.; Krause, U. An Experimental Investigation of Thermal Runaway and Gas Release of NMC Lithium-Ion Pouch Batteries Depending on the State of Charge Level. Batteries 2022, 8, 41. [Google Scholar] [CrossRef]
  27. Foss, C.E.L. Thermal Stability and Electrochemical Performance of Graphite Anodes in Li-ion Batteries. Ph.D. Thesis, NTNU-Trondheim, Trondheim, Norway, 2014; pp. 1–47. [Google Scholar]
  28. Tran, M.-K.; Mevawalla, A.; Aziz, A.; Panchal, S.; Xie, Y.; Fowler, M. A Review of Lithium-Ion Battery Thermal Runaway Modeling and Diagnosis Approaches. Processes 2022, 10, 1192. [Google Scholar] [CrossRef]
  29. Zu, C.; Yu, H.; Li, H. Enabling the thermal stability of solid electrolyte interphase in Li-ion battery. InfoMat 2021, 3, 648–661. [Google Scholar] [CrossRef]
  30. Lopez, C.F.; Jeevarajan, J.A.; Mukherjee, P.P. Characterization of Lithium-Ion Battery Thermal Abuse Behavior Using Experimental and Computational Analysis. J. Electrochem. Soc. 2015, 162, A2163. [Google Scholar] [CrossRef]
  31. Wang, Q.; Sun, J.; Yao, X.; Chen, C. Thermal Behavior of Lithiated Graphite with Electrolyte in Lithium-ion Batteries. J. Electrochem. Soc. 2006, 153, A329–A333. [Google Scholar] [CrossRef]
  32. Feng, X.; Sun, J.; Ouyang, M.; He, X.; Lu, L.; Han, X.; Fang, M.; Peng, H. Characterization of Large Format Lithium Ion Battery Exposed to Extremely High Temperature. J. Power Sources 2014, 272, 457–467. [Google Scholar] [CrossRef]
  33. Essl, C.; Golubkov, A.W.; Fuchs, A. Comparing Different Thermal Runaway Triggers for Two Automotive Lithium-Ion Battery Cell Types. J. Electrochem. Soc. 2020, 167, 130542. [Google Scholar]
  34. Addai, E.K.; Gabel, D.; Krause, U. Minimum Ignition Temperature of Hybrid Mixtures of Burnable Dusts and Gases. In Proceedings of the 25th ICDERS, Leeds, UK, 2–7 August 2015. [Google Scholar]
  35. CHEMSAFE Database. Available online: https://www.chemsafe.ptb.de (accessed on 10 November 2022).
  36. Zimmerman, A.H.; Quinzio, M.V. Lithium Plating in Lithium-Ion Cells; NASA Battery Workshop: Huntsville, AL, USA, 2010. [Google Scholar]
  37. Lin, X.; Khosravinia, K.; Hu, X.; Li, J.; Lu, W. Lithium Plating Mechanism, Detection, and Mitigation in Lithium-Ion Batteries. Prog. Energy Combust. Sci. 2021, 87, 100953. [Google Scholar] [CrossRef]
  38. Juarez-Robles, D.; Vyas, A.A.; Fear, C.; Jeevarajan, J.A.; Mukherjee, P.P. Overcharge and Aging Analytics of Li-Ion Cells. J. Electrochem. Soc. 2020, 167, 090547. [Google Scholar]
  39. Ohsaki, T.; Kishi, T.; Kuboki, T.; Takami, N.; Shimura, N.; Sato, Y.; Sekino, M.; Satoh, A. Overcharge Reaction of Lithium-ion Batteries. J. Power Sources 2005, 146, 97–100. [Google Scholar] [CrossRef]
  40. Leißing, M.; Horsthemke, F.; Wiemers-Meyer, S.; Winter, M.; Niehoff, P.; Nowak, S. The Impact of the C-Rate on Gassing During Formation of NMC622 II Graphite Lithium-Ion Battery Cells. Batter. Supercaps 2021, 4, 1344–1350. [Google Scholar] [CrossRef]
  41. Razus, D.; Movileanu, C.; Brinzea, V.; Oancea, D. Explosion pressures of hydrocarbon–air mixtures in closed vessels. J. Hazard. Mater. 2006, 135, 58–65. [Google Scholar] [CrossRef] [PubMed]
  42. Mitu, M.; Movileanu, C.; Giurcan, V. Dynamics of Pressure Evolution during Gaseous Ethane–Air. Energies 2022, 15, 6879. [Google Scholar] [CrossRef]
  43. Koch, S.; Fill, A.; Birke, K.P. Comprehensive Gas Analysis on Large Scale Automotive Lithium-ion Cells in Thermal Runaway. J. Power Sources 2018, 398, 106–112. [Google Scholar]
  44. Larsson, F.; Andersson, P.; Mellander, B.-E. Lithium-ion Battery Aspects on Fires in Electrified Vehicles on the Basis of Experimental Abuse Tests. Batteries 2016, 2, 9. [Google Scholar]
  45. Aluminum Laminated Film for Pouch Cell Case. Available online: https://www.msesupplies.com/en-de/products/aluminum-laminated-film-for-pouch-cell-case-t-113um?variant=31731421446202 (accessed on 20 May 2023).
  46. Patel, S.N. Thermal and Oxidative Degradation of an Aromatic Polyamide. Doctoral Dissertation, University of Leeds, Leeds, UK, 1992. [Google Scholar]
  47. Gully, B. Technical Reference for Li-ion Battery Explosion Risk and Fire Suppression; Technical Report; DNV GL: Bærum, Norway, 2019. [Google Scholar]
  48. Mikolajczak, C.; Kahn, M.; White, K.; Long, R.T. Lithium-Ion Batteries Hazard and Use Assessment; Springer Science & Business Media: Berlin/Heidelberg, Germany, 2011. [Google Scholar]
  49. Ensola. Definitions LEL. Ensola AG. Available online: https://www.ensola.com/w/images/stories/2012_inhalte/pdf/datenblatt_lower_expolxive_limit.pdf 2012 (accessed on 12 July 2022).
  50. CDC. Hydrogen Cyanide (AC): Systemic Agent. Centers for Disease Control and Prevention. Available online: https://www.cdc.gov/niosh/ershdb/emergencyresponsecard_29750038.html#:~:text=DESCRIPTION%3A%20Hydrogen%20cyanide%20(AC),AC)%20can%20be%20rapidly%20fatal (accessed on 12 July 2022).
Figure 1. Positioning of the ignition source and thermocouples on the LIB (A) cell in test series 1, (B) cell in test series 2, and (C) double-cell in test series 2.
Batteries 09 00300 g001aBatteries 09 00300 g001b
Figure 2. (A) Schematic representation of the experimental setup used for the thermal runaway in test series 1 and 2; (B) test series 3.
Batteries 09 00300 g002
Figure 3. Experimental SOC versus voltage curve of the 2.5 Ah NMC pouch cell.
Batteries 09 00300 g003
Figure 4. Video screenshot of the thermal runaway event with ignition of the ejected explosible gas mixture.
Batteries 09 00300 g004
Figure 5. SOC versus voltage from test #30 and test #31.
Batteries 09 00300 g005
Figure 6. Pressure evolution over time in a 100 L vessel with gas release and subsequent ignition during thermal runaway in a 10 Ah lithium pouch cell [26].
Batteries 09 00300 g006
Figure 7. Successive pressure peak in test #26 after thermal runaway [26].
Batteries 09 00300 g007
Figure 8. Removal of gas components released in test series 1 versus SOC.
Batteries 09 00300 g008
Table 1. Cell parameters.
ParameterTest Series 1 & 3Test Series 2Test Series 2
ManufacturerGrepowHunan CTSHunan CTS
Capacity, Ah2.510 32
Energy density, Wh/kg275200200
Mass(max), g58178590
Width, mm6059102
Length, mm78.5156305
Thickness, mm5.78.511.5
Upper-limit voltage, V4.24.24.2
Average voltage, V3.73.73.7
Cutoff voltage, V2.72.752.75
Table 2. Experiments carried out for test series 1, 2, and 3.
TestCapacity per Cell (Ah)Cells per TestCell TotalSOC (%)Pyrobubble FilterTriggerTest Chamber Volume (L)Ref. [26]
Series 1
#01–#032.5130Overheating10-
#04 11-
#05–#071330-
#0811 -
#09–#111350-
#1211-
#13–#151380-
#1611-
#17–#1913100-
#2011-
Series 2
#21–#231013100Overheating100Test #07–#09
#24–#2626Test #24→Test #10
Test #25→Test #12
Test #26→Test #11
#27–#293213Test #13–Test #15
Series 3
#302.511100Overcharge45-
#3111100-
Table 3. Properties of the pyrobubbles [25].
ParameterData
Thermal conductivity (20 °C), W/(m·K)0.075
Density, kg/m3190–230
Melting Temperature, °C1100
Heat capacity, J/(kg·K)700
Particle size, mm1–5
Table 4. p m a x and T r e a c measured from the experiments.
TestSOC (%)pmax (bar)Treac (K)Ref. [26]
Series 1
#01–#0301.2 ± 0.04378 ± 4-
#04 1.14402-
#05–#07301.3 ± 0.1381 ± 10-
#081.5400-
#09–#11501.34 ± 0.15404 ± 14-
#121.7416-
#13–#15802.6 ± 0.9515 ± 3-
#162.7509-
#17–#19100 α3.2 ± 0.5520 ± 9-
#202.5497-
Series 2
#21100 β3.91057Test #07
#222.7853Test #09
#234.86920Test #08
#24100 γ1.831080Test #10
#251.921232Test #12
#267.281240Test #11
#27100 δ7.25930Test #13
#286.55780Test #14
#297.5826Test #15
Series 3
#30100 α-750-
#31100 α-978-
α, 2.5 Ah single cells; β, 10 Ah single cells; γ, 10 Ah double cells; δ, 32 Ah single cells.
Table 5. Concentration of released gas from LIBs.
TestCell Capacity, Ah C H F , ppm C C O 2 , ppm C C O , ppm C C H 4 , ppm C H C N , ppm C C 2 H 6 , ppm C C 2 H 4 , ppm Ref. [26]
Test series 1
#01–#032.511 ± 2.508700 ± 45048 ± 437 ± 33000 ± 4289750 ± 594-
#04508541714285180-
#05–#078 ± 2.508489 ± 71541 ± 538 ± 43164 ± 16210,570 ± 2403-
#08403922811364200-
#09–#1115 ± 210,00012,300 ± 712585 ± 23084 ± 172970 ± 19017,800 ± 1200-
#121409050550517205390-
#13–#1517 ± 1.7286,400 ± 55,40056,400 ± 914033,060 ± 6270170 ± 233680 ± 59049,340 ± 12,386-
#161410025,65013,60060359024,970-
#17–#1918 ± 4480,570 ± 11,42067,700 ± 930043,100 ± 8800165 ± 353730 ± 66681,200 ± 23,200-
#201020024,65041,70036345016,010-
Test series 2
#2110--30,980804011030959630Test #07
#22--29,220862010021056570Test #09
#23-10,00041,70010,420230944011,200Test #08
#2420--67,50018,380150490035,100Test #10
#25--68,50019,710180610037,700Test #12
#26--168,50033,85080605019,700Test #11
#2732--136,16060,81028110,09071,120Test #13
#28--124,10045,570200700063,400Test #14
#29--148,10076,05038013,00078,600Test #15
Table 6. Ranges of explosible gaseous components.
Gas ComponentMeasured Range, vol%Flammability Range, vol%
CO2.92–16.8512.50–74.00
CH40.8–7.605.30–15.00
C2H60.21–1.303.00–12.50
C2H40.70–7.863.10–32.00
HCN0.01–0.045.60–40.00
Disclaimer/Publisher’s Note: The statements, opinions and data contained in all publications are solely those of the individual author(s) and contributor(s) and not of MDPI and/or the editor(s). MDPI and/or the editor(s) disclaim responsibility for any injury to people or property resulting from any ideas, methods, instructions or products referred to in the content.