Article

Model-Based Analysis and Optimization of Acidic Tin–Iron Flow Batteries

1
School of Materials Science and Engineering, Yancheng Institute of Technology, Yancheng 224051, China
2
Jiangsu Provincial Key Laboratory of Eco-Environmental Materials, Yancheng Institute of Technology, Yancheng 224051, China
3
Key Laboratory for Photonic and Electronic Bandgap Materials, Ministry of Education, School of Physics and Electronic Engineering, Harbin Normal University, Harbin 150500, China
*
Authors to whom correspondence should be addressed.
Batteries 2023, 9(5), 278; https://doi.org/10.3390/batteries9050278
Submission received: 24 February 2023 / Revised: 28 April 2023 / Accepted: 17 May 2023 / Published: 18 May 2023

Abstract

:
Acidic tin–iron flow batteries (TIFBs) employing Sn/Sn2+ and Fe2+/Fe3+ as active materials are regarded as promising energy storage devices due to their superior low capital cost, long lifecycle, and high system reliability. In this paper, the performance of TIFBs is thoroughly investigated via a proposed dynamic model. Moreover, their design and operational parameters are comprehensively analyzed. The simulation results show that (i) a flow factor of two is favorable for practical TIFBs; (ii) about 20% of the system’s efficiency is decreased as the current density increases from 40 mA cm−2 to 200 mA cm−2; (iii) the optimal electrode thickness and electrode aspect ratio are 6 mm and 1:1, respectively; and (iv) reducing the compression ratio and increasing porosity are effective ways of lowering pump loss. Such in-depth analysis can not only provide a cost-effective method for optimizing and predicting the behaviors and performance of TIFBs but can also be of great benefit to the design, management, and manufacture of tin–iron flow batteries.

1. Introduction

In recent years, flow batteries have received much ongoing attention due to their benefits with respect to decoupling power and energy, long cycling lives, and safety [1]. Among the flow batteries discussed in the literature and implemented in practical applications, all-vanadium flow batteries (VFBs) number among the most promising technologies and have been successfully applied in a number of commercial energy storage stations by employing a vanadium element as an active substance for both sides, thus avoiding cross-contamination [2,3]. However, further applications of VFBs are seriously impeded by expensive vanadium-based electrolytes. Thus, to produce substitutes for VFBs and achieve cost-competitive flow battery systems, it is of vital importance to develop new types of flow batteries with cost-effective active species [4].
Accordingly, large numbers of alternative flow battery systems with low-cost active species, such as all-iron flow batteries, zinc-based flow batteries, and tin-based flow batteries, have been proposed by researchers and engineers. Among them, all-iron flow batteries have received the most attention due to their environmentally friendliness and low cost [5]. However, hydrogen evolution in the anode and inferior Fe plating/stripping reversibility limit their efficiency and capacity retention [6,7]. On the other hand, zinc-based flow batteries, offering benefits such as inexpensiveness and a theoretical specific energy density of over 400 Wh kg−1 [8] (which is about 10 times that of VFBs), have been widely studied, and a series of zinc-based flow batteries have been proposed, such as zinc–bromine flow batteries [9], zinc–iodine flow batteries [10], zinc–cerium flow batteries [11], zinc–manganese flow batteries [12], zinc–nickel flow batteries [13], the zinc–iron flow batteries [14], and zinc–air flow batteries [15]. Nevertheless, the safety issues associated with zinc dendrite (towards which great efforts [16,17,18] have been exerted, each failing to thoroughly eliminate said problems [19]) constitute an obstacle to its commercial utilization [20]. Thus, non-dendrite tin-based flow batteries have become a significant research focus. To date, tin–bromine flow batteries [21], tin–vanadium flow batteries [20], tin–iodide flow batteries [22], and tin–iron flow batteries [23] have been proposed by researchers. Among these batteries, tin–iron flow batteries are regarded as one of the most promising options because of their combination of non-dendrite components, low cost, and long lifespan.
Tin–iron flow batteries (TIFB), especially acidic tin–iron flow batteries, have been envisioned as a favorable alternative and shown superior performance according to reports in the literature. For instance, Zhou and co-workers proposed a tin–iron flow battery with excellent rate and cycle performance by using FeCl2 as an active material for the positive side, SnCl2 as an active material for the negative side, and HCl as a supporting electrolyte [23]. Afterwards, they performed an in-depth analysis on the effects of the component materials and flow fields to further understand the behavior of TIFBs and improve their overall performance [24]. Alongside acidic tin–iron flow batteries, a low-cost neutral tin–iron flow battery was developed in our previous work by employing Sn2+/Sn and [Fe(CN)6]3−/Fe(CN)6]4− as active pairs and KCl as a supporting electrolyte, thus avoiding environmental unfriendliness and the harshness of the inside material under acidic conditions [25]. Despite these efforts, few TIFBs offering commercial large-scale energy storage can be seen in practical applications. This can mainly be attributed to the fact that before a battery comes into use, it is very important to optimize its cell design and operational conditions as an energy storage technology to render it suitable for large-scale applications [26]. Thus, mathematical modelling is considered an effective method with which to thoroughly study the performance of TIFBs and, subsequently, optimize their design and operation due to the avoidance of considerable amounts of experimental testing [27]. However, until now, no such mathematical models concentrating on the optimization of cell design and operational parameters for TIFBs have been available in the literature.
In this work, dynamic models the tin–iron flow batteries are proposed, and consequent in-depth investigations are conducted to optimize the performance of TIFBs and understand their characteristics. This paper begins with the development of a comprehensive dynamic TIFB model based on mass conservation. Then, the proposed dynamic model is validated at two applied currents. Afterwards, the key factors of flow rates, current densities, and electrode parameters are evaluated, and their effects are analyzed. The simulation results demonstrate that it is beneficial to adopt a flow factor of two for TIFBs to achieve optimal system efficiency. In addition, electrodes with a thickness of 6 mm and an aspect ratio of 1:1 are preferable for the development of practical tin–iron flow batteries. Moreover, moderate porosity and compression ratios are favored for tin–iron flow batteries to enhance their comprehensive performances. This work develops the first comprehensive dynamic model for tin–iron flow batteries, thus providing a cost-effective method with which to understand their behavior and enhance their performance. In addition, the optimization of operational parameters and electrode geometry is of great significance for the design, manufacturing, and management of TIFBs.
There are three further sections in this paper. The experimental methods are expressed in Section 2, including materials, modelling, and cell performance testing. Subsequently, in Section 3, the effects of key factors are studied, and the results are discussed. Finally, the conclusions are expressed in Section 4.

2. Experimental Methods

2.1. Materials

Porous electrodes (JinGu-42) used in this work were received from Liaoning Jingu Carbon Materials Co., Ltd. (Liaoyang, China). Bipolar plates (KVFP1010) were purchased from Liaoning Kejing New Materials Technology Co., Ltd. (Shenyang, China). Membranes (Nafion 212) were obtained from DuPont Co., Ltd. (Shanghai, China). Sulfuric acid, stannous chloride, and ferrous chloride were purchased from Sinopharm (Shenyang, China) and were of analytical regent grade.

2.2. Electrolyte Preparations

The electrolytes used for the charging–discharging test were made with deionized water, containing 0.5 M Sn2+ plus 3 M H2SO4 in the negative half-cell and 1 M Fe2+ plus 3 M H2SO4 in the positive half-cell.

2.3. Cell Performance Tests

A typical TIFB commonly consists of pumping systems, a flow cell, and two reservoirs containing electrolytes for both sides. A schematic of a TIFB is depicted in Figure 1a. To understand the characteristics of TIFBs, a laboratory flow cell was prepared and tested. The analyzed flow cell with an area of 28 cm2 is composed of electrodes, flow frames, ion exchange membrane, collectors, bipolar plates, gaskets, and essential fasteners, as shown in Figure 1b. The electrochemical reactions for the two half-cells and the cell are expressed as follows:
At the negative side
S n S n 2 + + 2 e E 0 = 0.13   V
At the positive side
F e 3 + + e F e 2 + E 0 = 0.77   V
Cell reaction:
F e 3 + + 1 2 S n F e 2 + + 1 2 S n 2 + ( E 0 = 0.9   V )
Figure 1. (a) A schematic of a tin–iron flow battery and (b) the structure of laboratory flow cell.
Batteries 09 00278 g001
Cell performance was tested using a Neware cell tester (CT-3008 5 V/12 A). In the charge–discharge test, the current densities were set to be operated within a voltage range of 0.4–1.2 V at 50 mA cm−2 and 100 mA cm−2. A 60 mL electrolyte was filled in each side and circulated from cell to electrolyte reservoirs. The flow rate was constantly 40 mL min−1. The specific parameters of the cell are listed in Table 1. The efficiencies of the flow cell can be calculated according to Equations (4)–(6).
C o u l o m b i c   e f f i c i e n c y = 0 t d I discharge d t 0 t c I charge d t × 100 %
E n e r g y   e f f i c i e n c y = 0 t d U discharge I discharge d t 0 t c U charge I charge d t × 100 %
V o l t a g e   e f f i c i e n c y = E n e r g y   e f f i c i e n c y C o u l o m b i c e f f i c i e n c y × 100 %
where td and tc represent the time of discharge and charge process, respectively, and U and I are the voltage and current of the cell, respectively.

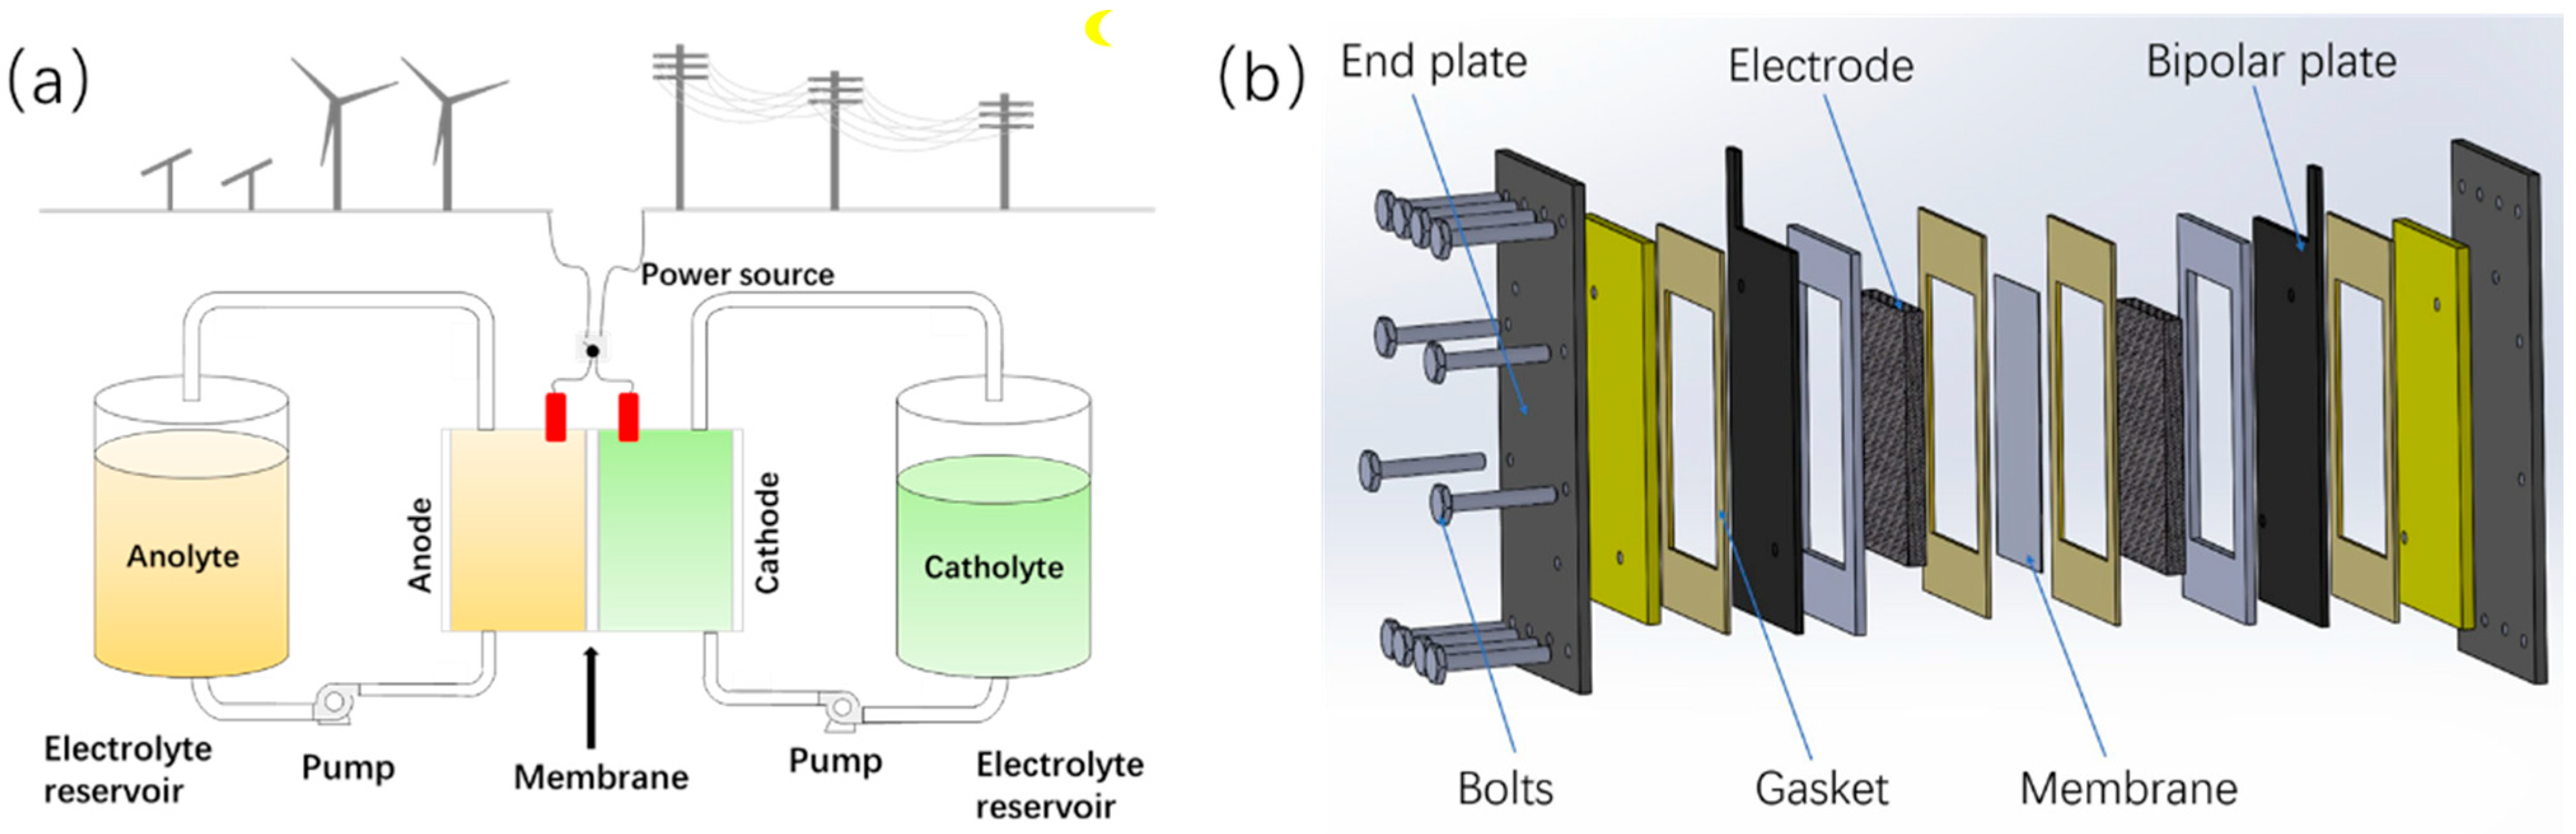
2.4. Dynamic Modeling

A tin–iron flow battery dynamic model should, on the one hand, be sufficiently complex such that it captures the underlying physics and, on the other hand, be adequately simplicial to be solved promptly. Thus, in this study, the following assumptions are made before the establishment of the tin–iron flow battery dynamic model.
(1)
The electrolyte concentrations are uniform in the cell and reservoirs;
(2)
Gassing side reactions are negligible;
(3)
The temperature in the reservoirs and the cell are constant during operation;
(4)
Contact resistances between electrode and bipolar plate are minimized;
(5)
The variations of electrolyte volume in the cell and reservoirs can be neglected.

2.4.1. Electrochemical Model

The voltage of the cell for a typical charge–discharge process of a TIFB is commonly the sum of the open-circuit voltage ( E ocv ), the activation polarization ( η act ), the concentration polarization ( η con ), and ohmic loss ( I R cell ), as expressed in the form of Equation (7)
E cell = E OCV + η act + η con + I R cell
where E OCV and η con can be further described as Equations (8) and (9)
E OCV = E 0 + R T z F ln c Fe III c Sn II c Fe II
η con = η con + + η con = R T z F ln 1 i z F k m c r + + R T z F ln 1 i z F k m c r
where
  • E 0 is the cell’s formal potential;
  • R denotes the molar gas constant;
  • T is temperature;
  • z refers to the unit activity coefficient;
  • F is the Faraday constant;
  • i is current density;
  • c Sn II , c Fe II , and c Fe III are the concentrations of Sn2+, Fe2+, and Fe3+ in TIFB cell, respectively;
  • c r and c r + are the concentrations of reactant in negative and positive half-cell, respectively;
  • km denotes the local mass transfer coefficient as expressed in Equation (10), where A1 is the cross-sectional area of the electrode and Q is the flow rate.
k m = 1.6 × 10 4 Q A 1
The η act can be obtained using the Butler–Volmer equation in the form of Equation (11). As a porous electrode with a surface area that can be up to several hundred times its geometric area is applied in flow batteries, thus lowering real current density, η act is commonly small in flow cells [28]. In addition, current is one of the key factors that affects activation overpotential, according to Equation (11). Thus, a new definition of overall ohmic drop, I R cell , is defined in the form of Equation (12) to combine the ohmic loss and activation overpotential of a cell [29]
i = i 0 exp α a n F η act R T exp α c n F η act R T
I R cell = I R cell + η act
where I R cell is the defined overall ohmic loss, i 0 denotes exchange current density, and α a and α c are the charge transfer coefficients of the negative and positive side, respectively.
As a consequence, the voltage of a cell can be obtained by solving Equations (13) and (14), as expressed below
For charging:
E cell = E 0 + R T z F ln c V II c Fe III c V III c Fe II + R T z F ln 1 i 1.6 × 10 4 Q A 1 z F c r + + R T z F ln 1 i 1.6 × 10 4 Q A 1 z F c r + I R cell
For discharging:
E cell = E 0 + R T z F ln c V II c Fe III c V III c Fe II R T z F ln 1 i 1.6 × 10 4 Q A 1 z F c r + R T z F ln 1 i 1.6 × 10 4 Q A 1 z F c r I R cell

2.4.2. Mass Balance

On the basis of mass balance, the ion concentrations can be obtained by calculating their time derivatives in the form of Equations (15)–(18):
  • for Fe3+ ion:
V d c Fe III t d t = Q c Fe III t c Fe III t ± N I z F A 2 θ k 1 c Fe III t + 2 k 3 c V II t V d c Fe III t d t = Q c Fe III t c Fe III t
  • for Fe2+ ion:
V d c Fe II t d t = Q c Fe II t c Fe II t N I z F A 2 θ k 2 c Fe II t 2 k 3 c V II t V d c Fe II t d t = Q c Fe II t c Fe II t
  • for Sn2+ ion:
V d c Sn II t d t = Q c Sn II ' t c Sn II t N I z F A 2 θ k 3 c Sn II t 1 2 k 1 c Sn II t V d c Sn II t d t = Q c Sn II t c Sn II t
where
  •   c Fe II t ,   c Fe III t ,   and   c Sn II t denote the concentrations of Fe2+, Fe3+, and Sn2+ in the reservoirs at time t, respectively;
  • θ denotes the membrane thickness;
  • V and V′ denote the electrolyte volume in the flow cell and reservoirs, respectively;
  • A2 denotes the cross-sectional area of the membrane;
  • “+” and “−”denote the charging and discharging processes, respectively;
  • k 1 ,   k 2 ,   and   k 3 denote the diffusion coefficients of Fe3+, Fe2+, and Sn2+, respectively.
The flow rate can be obtained in the form of Equation (18), where f is the flow factor and the c r for fixed flow rate control is the concentration of the reactant at the end of the charge/discharge process, as described in Equation (19).
Q = N f I z F c r
c r = c r t end  

2.5. Cell Pressure, Pump Loss, and System Efficiency

2.5.1. Pressure Loss in Flow Cell

The total pressure loss of a TIFB commonly consists of the pressure loss in the pipe and the pressure loss in the cell. It can be expressed in the form of Equation (20), assuming that the pressure drop in the cell is totally a result of the carbon felt
Δ P total = Δ P felt + Δ P pipe
where
  • Δ P total is the total pressure loss;
  • Δ P pipe is the pressure loss through the pipe;
  • Δ P felt is the pressure loss through the porous electrode, which can be determined according to Darcy’s law, as shown in Equations (21) and (22).
Δ P felt = μ l Q κ A
κ = d f 2 16 K ε 3 1 ε 2  
where
  • l is the length of the porous electrode;
  • μ denotes the viscosity of electrolyte;
  • A is the cross-sectional area of the porous electrode;
  • κ is the permeability of the porous electrode;
  • d f is the fiber diameter of the porous electrode;
  • ε is the permeability of the porous electrode.
Moreover, the pressure loss through the pipe can be attained in the form of Equation (23) according to the Darcy–Weisbach equation:
Δ P pipe = f D L D ρ v 2 2
where
  • f D denotes Darcy friction factor;
  • D denotes pipe diameter;
  • v denotes velocity of the flow;
  • L denotes pipe length.
Assuming the flow in the piping corresponds to laminar flow [28], f D can be expressed in the form of Equation (24).
f D = 64 R e
In Equation (24), Re is the Reynolds number described below, where A p is the cross-sectional area.
R e = ρ D Q μ A p
As the pressure loss in a pipe is more preferably expressed in terms of volumetric flow rate, Equation (26) can be substituted into Equation (23).
v 2 = Q 2 A p 2

2.5.2. Pump Loss and System Efficiency

The pump power can be obtained by employing Equation (27), where α is the efficiency of pump, which depends on the operational conditions and pump configuration (assumed to be 80% in this paper).
P pump = Δ P total Q α
Thus, for constant current working conditions, the total energies required for charging or deliverable for discharging are expressed in Equation (28)
W = I · 0 t E cell t d t ± 0 t P pump t d t
Thus, the system efficiency of flow batteries can be determined using Equation (29)
System   efficiency = W discharge W charge

3. Results and Discussion

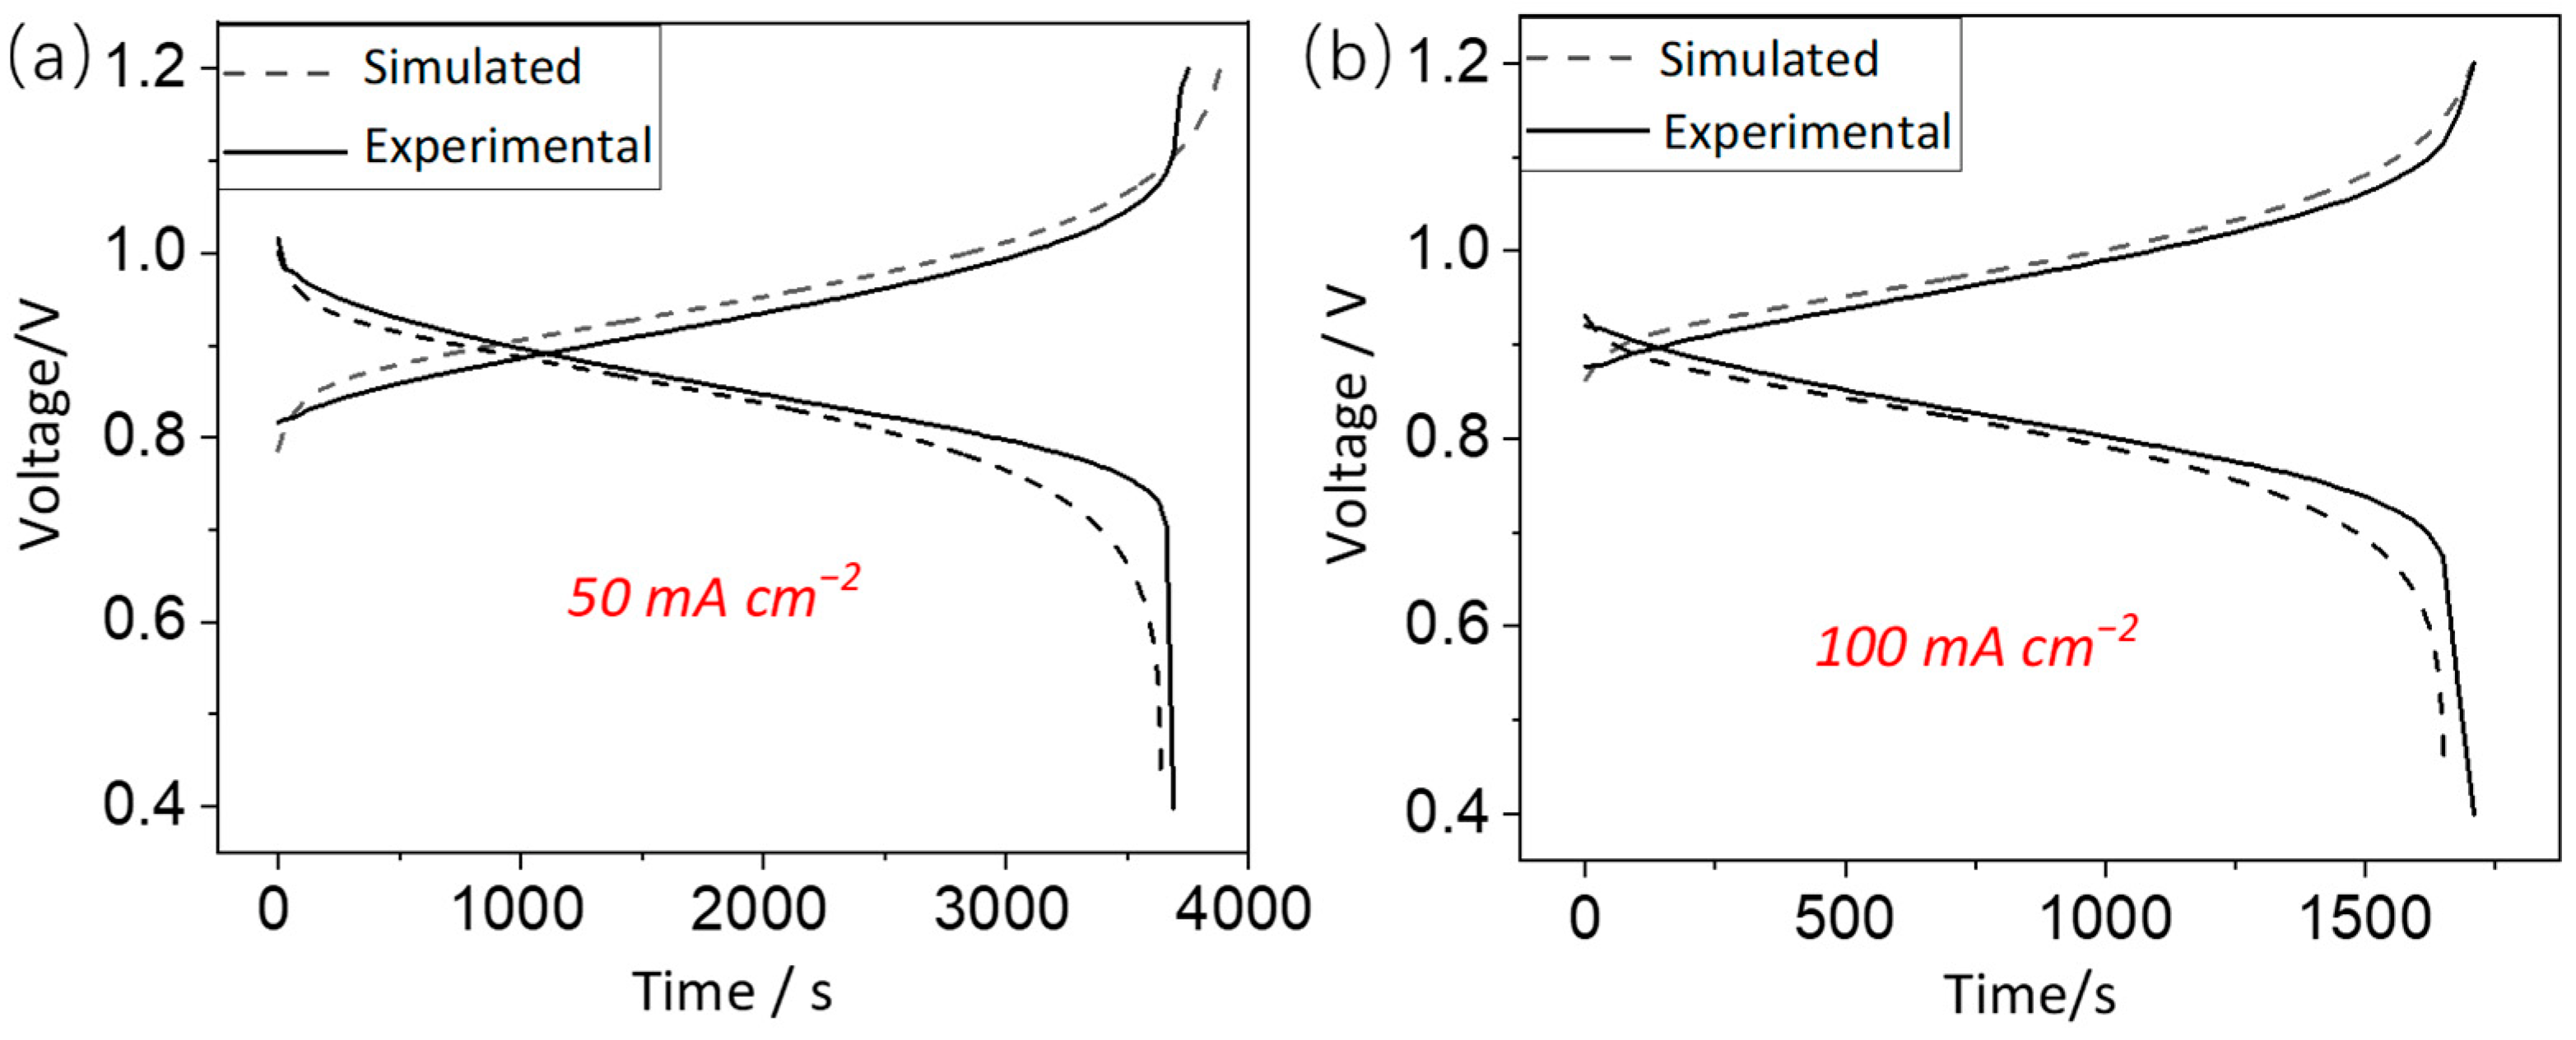
3.1. Model Validation

The experimental and simulated cell voltages at 50 mA cm−2 and 100 mA cm−2 are shown in Figure 2a,b, respectively, in which the simulated curves are obtained on the basis of the electrochemical model and mass balance provided in Section 2.4.1 and Section 2.4.2. It can be seen that the simulated battery voltages at the two current densities fit well with the testing voltages. It is suggested that the proposed model is, on the one hand, capable of capturing the electrochemical characteristics of a TIFB and, on the other hand, able to optimize the cell design and operational conditions. Moreover, Figure 2a,b also show that different operational conditions can result in a great difference of cell behaviors for TIFBs. Hence, it is of vital significance to perform a thorough analysis in order to optimize the cell’s design and the running strategy, thus achieving enhanced overall performance for a tin–iron flow battery.
After the model’s validation, a flow cell of 2000 cm−2 is employed to facilitate the simulation of a TIFB. The specific cell geometry and model parameters are provided in Table 2. In the following sections (Section 3.2 and Section 3.3), the key operational factors and electrode parameters are studied, and their effects are comprehensively discussed.

3.2. Key Operational Factors

3.2.1. Effects of Flow Rate

The applied flow rate of a flow battery should not only be sufficient, thus achieving a superior concentration potential, but also appropriately lowered to avoid additional cell pressure. Hence, it is necessary for a battery’s flow rate to be carefully managed for practical use. Therefore, the impacts of flow rate are investigated in this subsection in order to determine the optimal flow rate of a TIFB and, subsequently, enhance its overall performance. To ease analysis, the theoretical flow rate of the TIFB, with the operational conditions and cell geometries listed in Table 2, is defined to be a flow factor of one. Thus, the flow factor, which is the ratio of the applied flow rate to the theoretical flow rate (as depicted in Equation (18)), can be used to quantify the flow rate. Figure 3a shows the cell voltages with the flow factors from one to five at 100 mA cm−2. It can be observed that a higher flow rate is of great benefit to realizing longer charging–discharging times and a lower cell potential. Thus, capacity and cell efficiency can be greatly improved at a high flow rate. As illustrated in Figure 3b,c, as the flow factor increases from one to five, the battery’s capacity and energy efficiency are enhanced by up to 20% and 4%, respectively. However, the negative impacts of a high flow rate, despite the above improvements, can still occur, particularly the unwanted loss of cell pressure, pump energy, and, consequently, the additional loss of system efficiency. The cell pressure at different flow rates is shown in Figure 3d, which shows that it markedly increased from 15.8 kPa at a flow factor of one to 79 kPa at flow factor of five, which can not only give rise to excess pump loss but also induce a risk of electrolyte leakage. The degree of pump loss is analyzed and illustrated in Figure 3e, where pump loss dramatically increases with the increase in flow rate. More specifically, the pump loss increases from 0.41 W to 10.28 W as the flow factor increases from 1 to 5. As a result, the system efficiency while accounting for pump loss is greatly affected. The system efficiency at different flow factors is demonstrated in Figure 3f, where optimal system efficiency is achieved at a flow factor of two. Therefore, although a high flow rate is beneficial for the improvement of cell efficiency and capacity, the flow rate must be appropriately managed for practical TIFB systems to obtain enhanced overall performance.

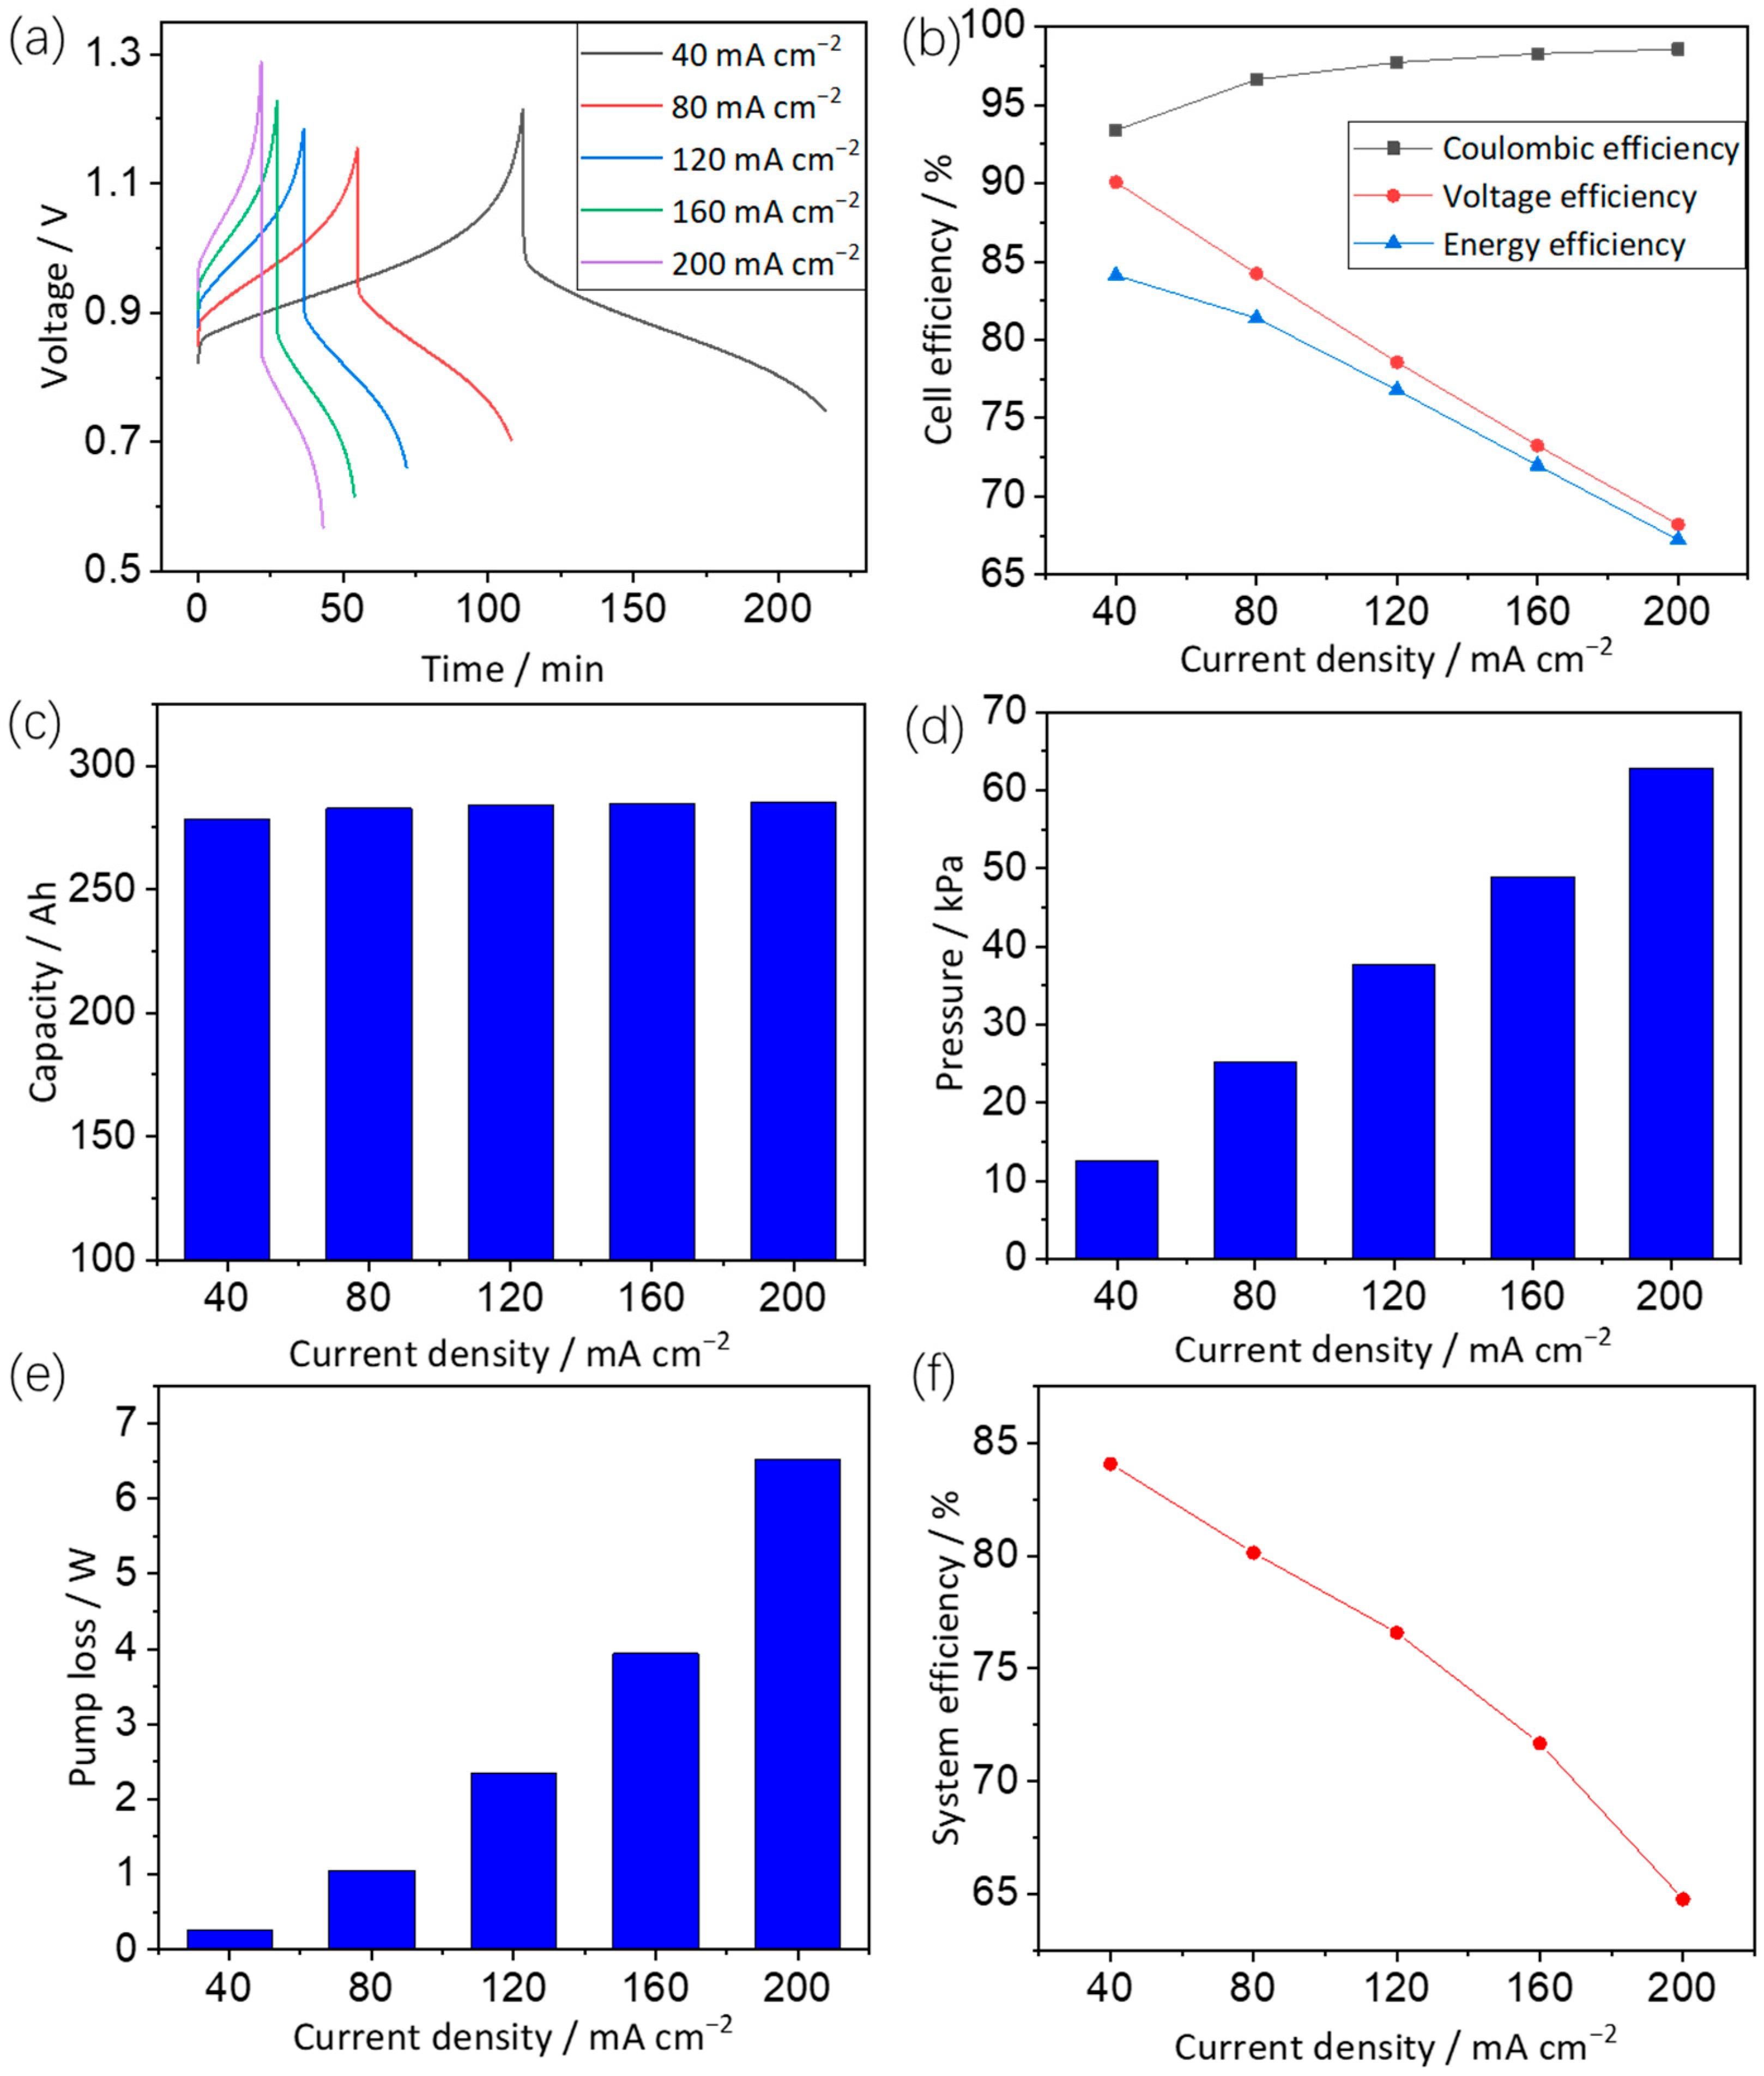
3.2.2. Effects of Current Density

Since a flow factor of two is favorable for a TIFB to realize optimized overall performance, this flow factor is analyzed in the following investigation. In addition to the flow factor, current density also greatly influences a flow battery’s performance. Figure 4a illustrates the cell voltages at various current densities, where the various current densities result in different cell voltages, which can potentially affect cell efficiency. Thus, cell efficiency is investigated and shown in Figure 4b. As illustrated, the coulombic efficiency slightly increases as the current density increases, while the voltage efficiency is notably decreased. Hence, energy efficiency is significantly decreased with the increase in current density. Specifically, as the current density increases from 40 mA cm−2 to 200 mA cm−2, energy efficiency decreases by as much as 17%. Besides cell efficiency, cell capacity is also studied and shown in Figure 4c, where the capacity at each current density is similar owing to the fact that the cell is set to be operated in the fixed SOC range and a high flow rate is applied at high current densities. However, such a high flow rate can result in safety risks and additional pressure and pump loss. The observed cell pressure and pump loss are depicted in Figure 4d,e, respectively, where they increase from 12.6 kPa to 62.9 kPa and from 0.3 W to 6.5 W, respectively, as the current density increases from 40 mA cm−2 to 200 mA cm−2. As a result, the system efficiency, which is shown in Figure 4f, decreases by about 20% with this variation in the current density. Hence, even though it is favorable for large-scale TIFB systems to operate at a high current density to lower their unit cost and enhance their power density, it is still necessary for the practical current density to be properly controlled to avoid additional system efficiency loss and safety risks.

3.3. Electrode Parameters

The key materials in a flow cell, for instance, the membrane, electrode, electrolyte, and bipolar plate, often highly influence cell performance. Among them, an electrode with different dimensions and characteristics can significantly influence the design and management of flow batteries. For instance, the porosity and compression ratio of electrodes can greatly impact the operational strategy regarding flow rate and pressure. Moreover, the electrode’s dimensions can directly affect the cell’s geometry. Thus, in the design of TIFBs, it is very important to understand the impacts of the electrode parameters on the overall performance and, subsequently, to optimize the cell’s design and the operational strategy. In this section, key parameters of electrodes are investigated by simulating the TIFB’s behavior at 80 mA cm−2.

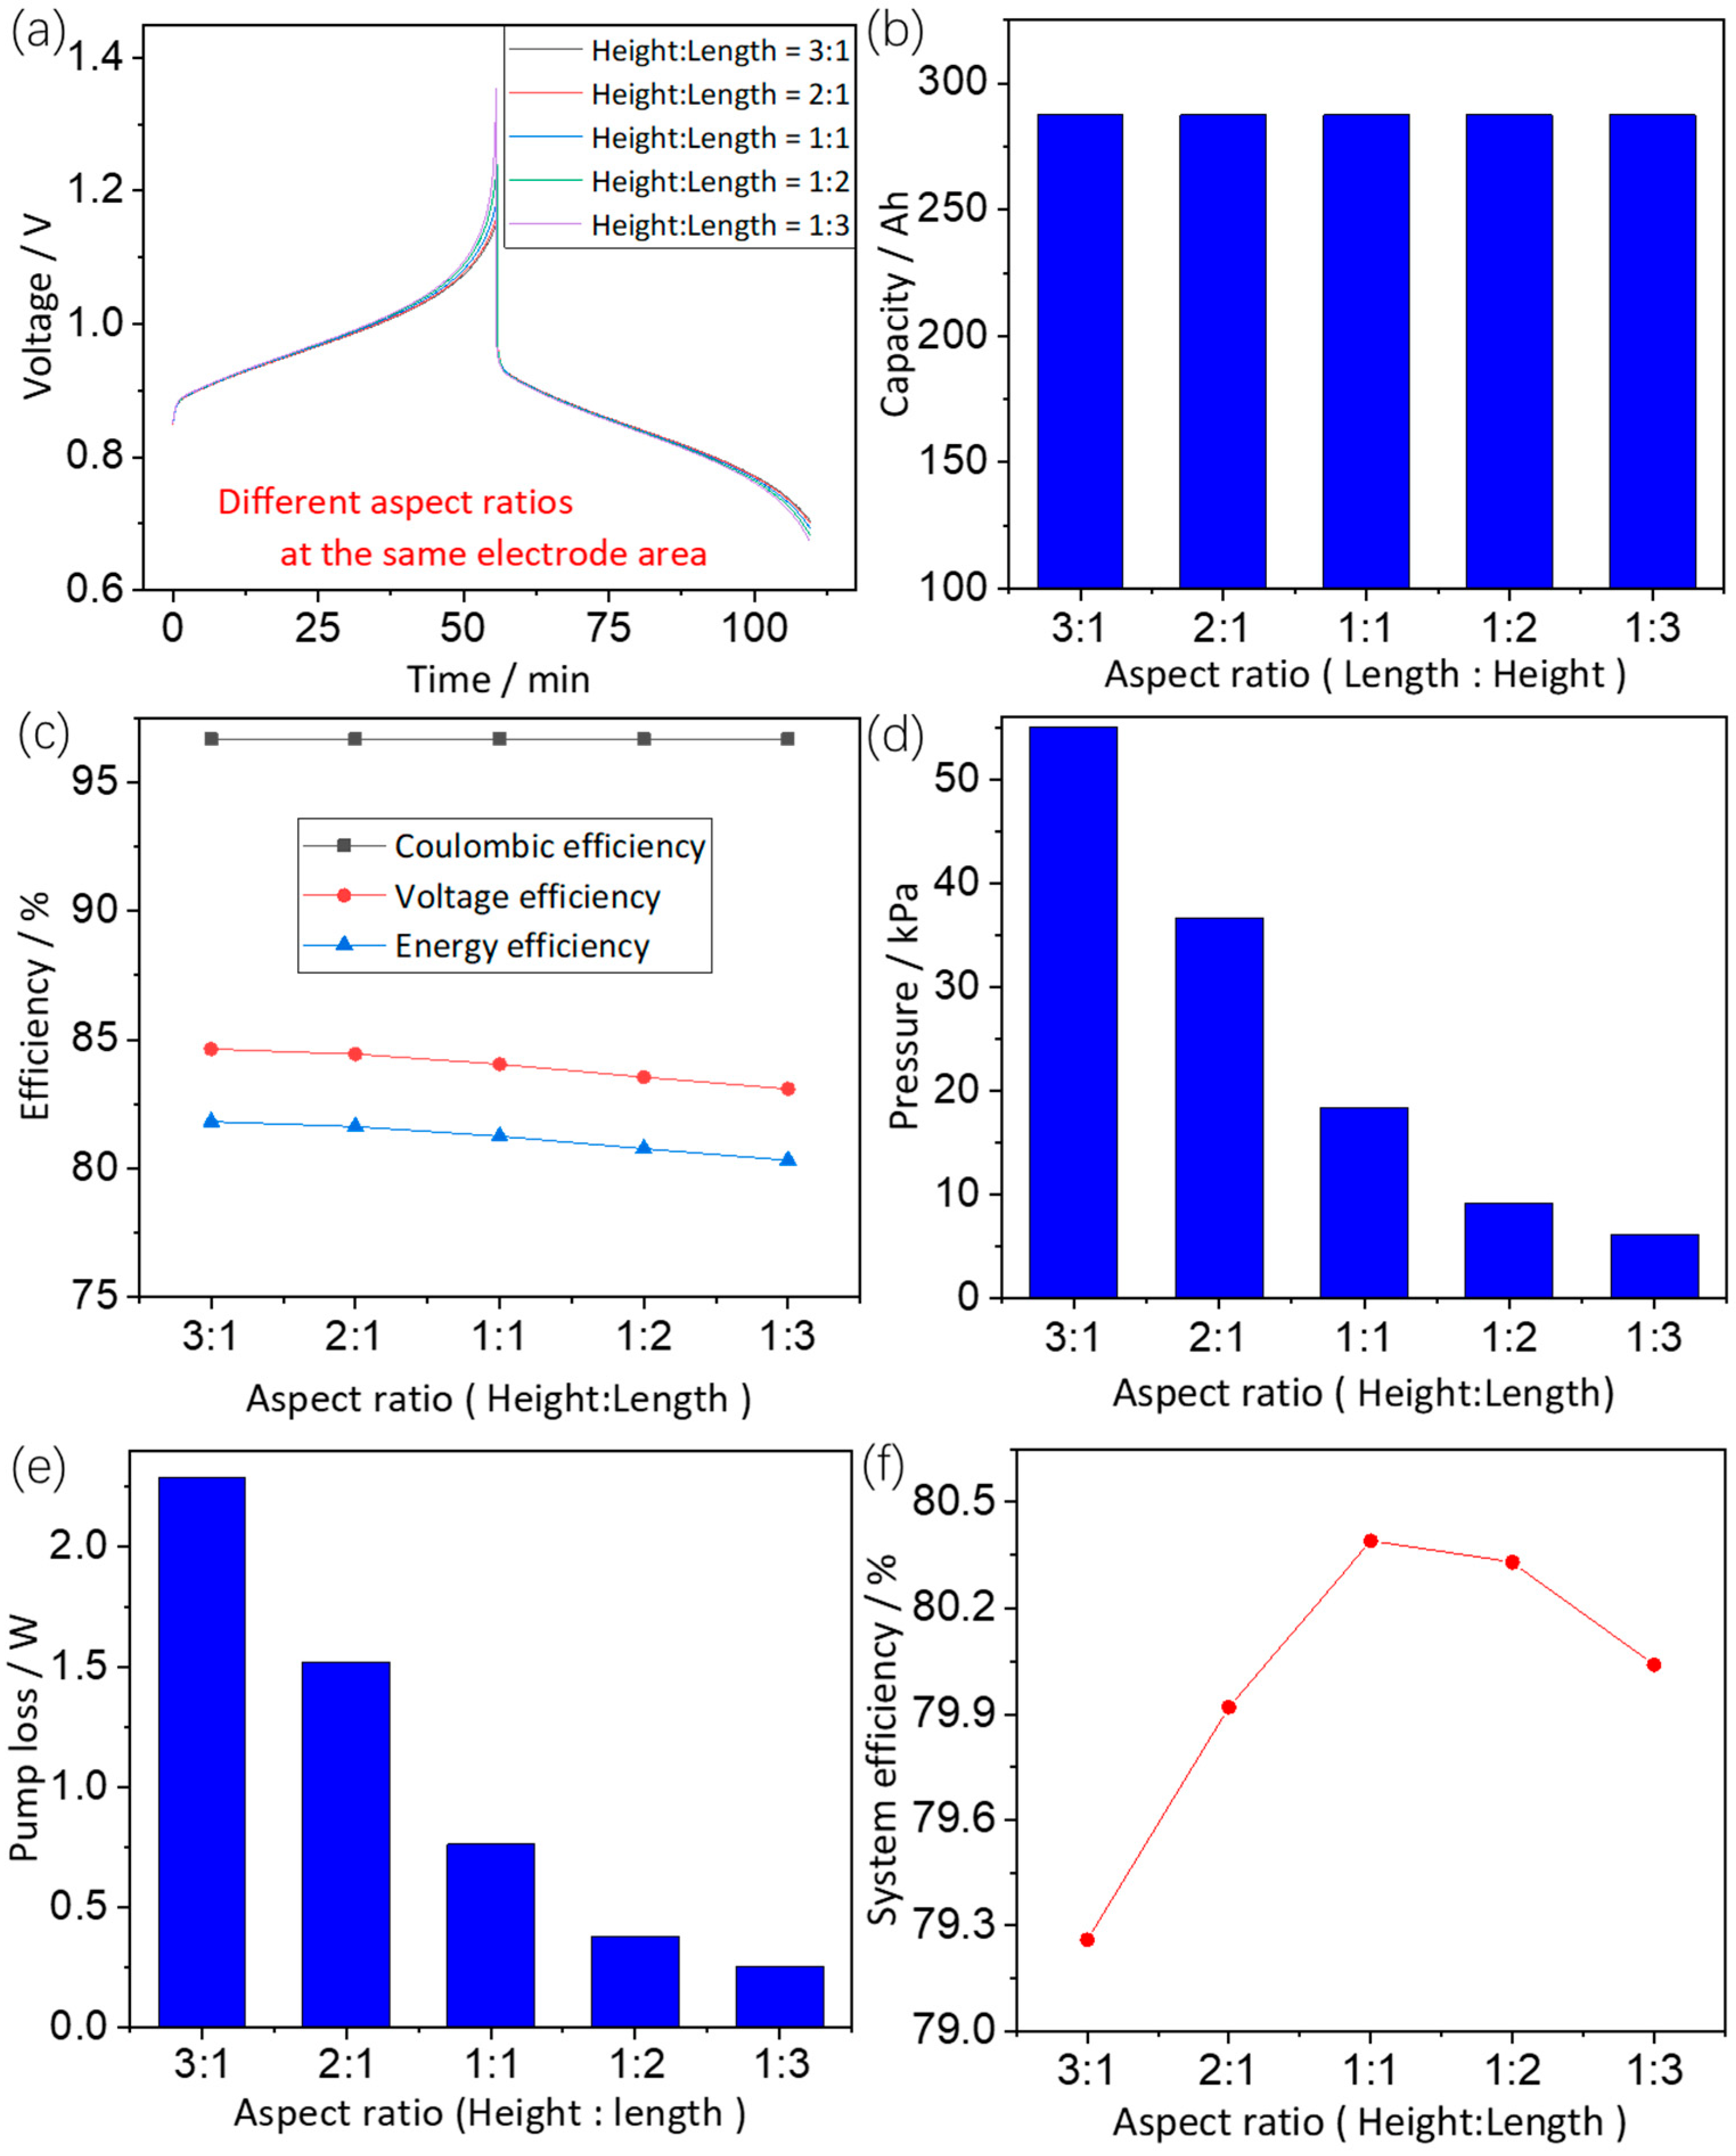
3.3.1. Effects of Electrode Dimensions

Both the thickness and aspect ratio (height/length) of electrodes can impact the performance of a flow cell. The cell voltages of a TIFB with electrodes of different thicknesses are shown in Figure 5a, where significant differences in the charging–discharging curves occur at the end of the charging period. This can mainly be attributed to the fact that the concentration potential of a cell with very thick electrodes can be significantly increased at the end of charge, which is in conformity with Equation (9). Accordingly, it is necessary that the state of charge (SOC) for practical large-scale TIFBs with thick electrodes is prudently regulated to avoid overvoltage. Aside from cell voltage, capacity and efficiency are also investigated and illustrated in Figure 5b,c, in which the capacity and energy efficiency are increased by 14 Ah and decreased by 1.5%, respectively, with the thickness increasing from 2 mm to 10 mm. It is shown that the variation in capacity and energy efficiency is relatively small; thus, the electrode’s thickness can hardly affect the cell’s capacity and efficiency since the voltage curves (illustrated in Figure 5a) are very similar in most parts. However, electrode thickness can strongly influence cell pressure and pump loss according to Darcy’s law [30]. Accordingly, Figure 5d,e illustrate the calculated cell pressure and pump loss, respectively, which both notably decrease as the electrode thickness increases. More specifically, the pressure and pump loss of the cell with a 2 mm thick electrode are about five times that of a 2 mm. Thus, the TIFB with thin electrodes potentially suffers from decreased system efficiency. The system efficiency of the cell with electrodes of different thickness is shown in Figure 5f. As expected, the system efficiency is significantly decreased at an electrode thickness of 2 mm. On the other hand, the cell with a 10 mm thick electrode also provides relatively low system efficiency owing to its low energy efficiency. It can be observed that optimized system efficiency is achieved at a thickness of 6 mm. Hence, the electrodes employed in a TIFB should be neither very thick nor very thin. In practice, an appropriate electrode thickness, in particular 6 mm or so, is desirable to allow practical large-scale TIFBs to achieve preferrable system efficiency.
Besides electrode thickness, TIFB cells with the same area but different electrode aspect ratios (height/length) can have different levels of cell performance, according to Equations (13) and (14). Specifically, the height of an electrode is the direction parallel to the flow, and the length of an electrode corresponds to the direction perpendicular to the flow. To specifically evaluate its effects, the voltages of a cell with an electrode with different aspect ratios are simulated and shown in Figure 6a. As depicted, the initial cell voltages are similar; however, at the end of a charge or discharge period, the voltages gradually differ with the alteration of the electrode’s aspect ratio. This result is in accordance with Equations (13) and (14), and such a variation in cell voltage can affect the cell’s efficiency. Moreover, it was observed that the charge–discharge time of the cell shows little difference as the aspect ratio changes. Thus, the aspect ratio of an electrode only slightly impacts cell capacity, as illustrated in Figure 6b. Figure 6c shows the cell efficiencies, where, as the aspect ratio varies from 3:1 to 1:3, the energy efficiency decreases from 81.8% to 80.3%, suggesting that the use of an electrode with greater height helps allow TIFBs to realize enhanced energy efficiency. Nevertheless, employing electrodes with greater height in a flow cell can entail long distances for electrolyte transportation, thus leading to undesirable cell pressure and pump loss. Figure 6d shows the cell pressure with an electrode of different aspect ratios, where the cell pressure gradually decreases from 55 kPa at an aspect ratio of 3:1 to 6 kPa for an aspect ratio of 3:1. As a consequence, the pump loss gradually decreases from 2.3 W to 0.25 W, as shown in Figure 6e. Accordingly, the system efficiency of the cell with an electrode of different aspect ratios can also differ. The system efficiency values are presented in Figure 6f, where the highest system efficiency was realized at an aspect ratio of 1:1. Hence, electrodes with a similar length and height are preferable for practical TIFB energy storage systems.

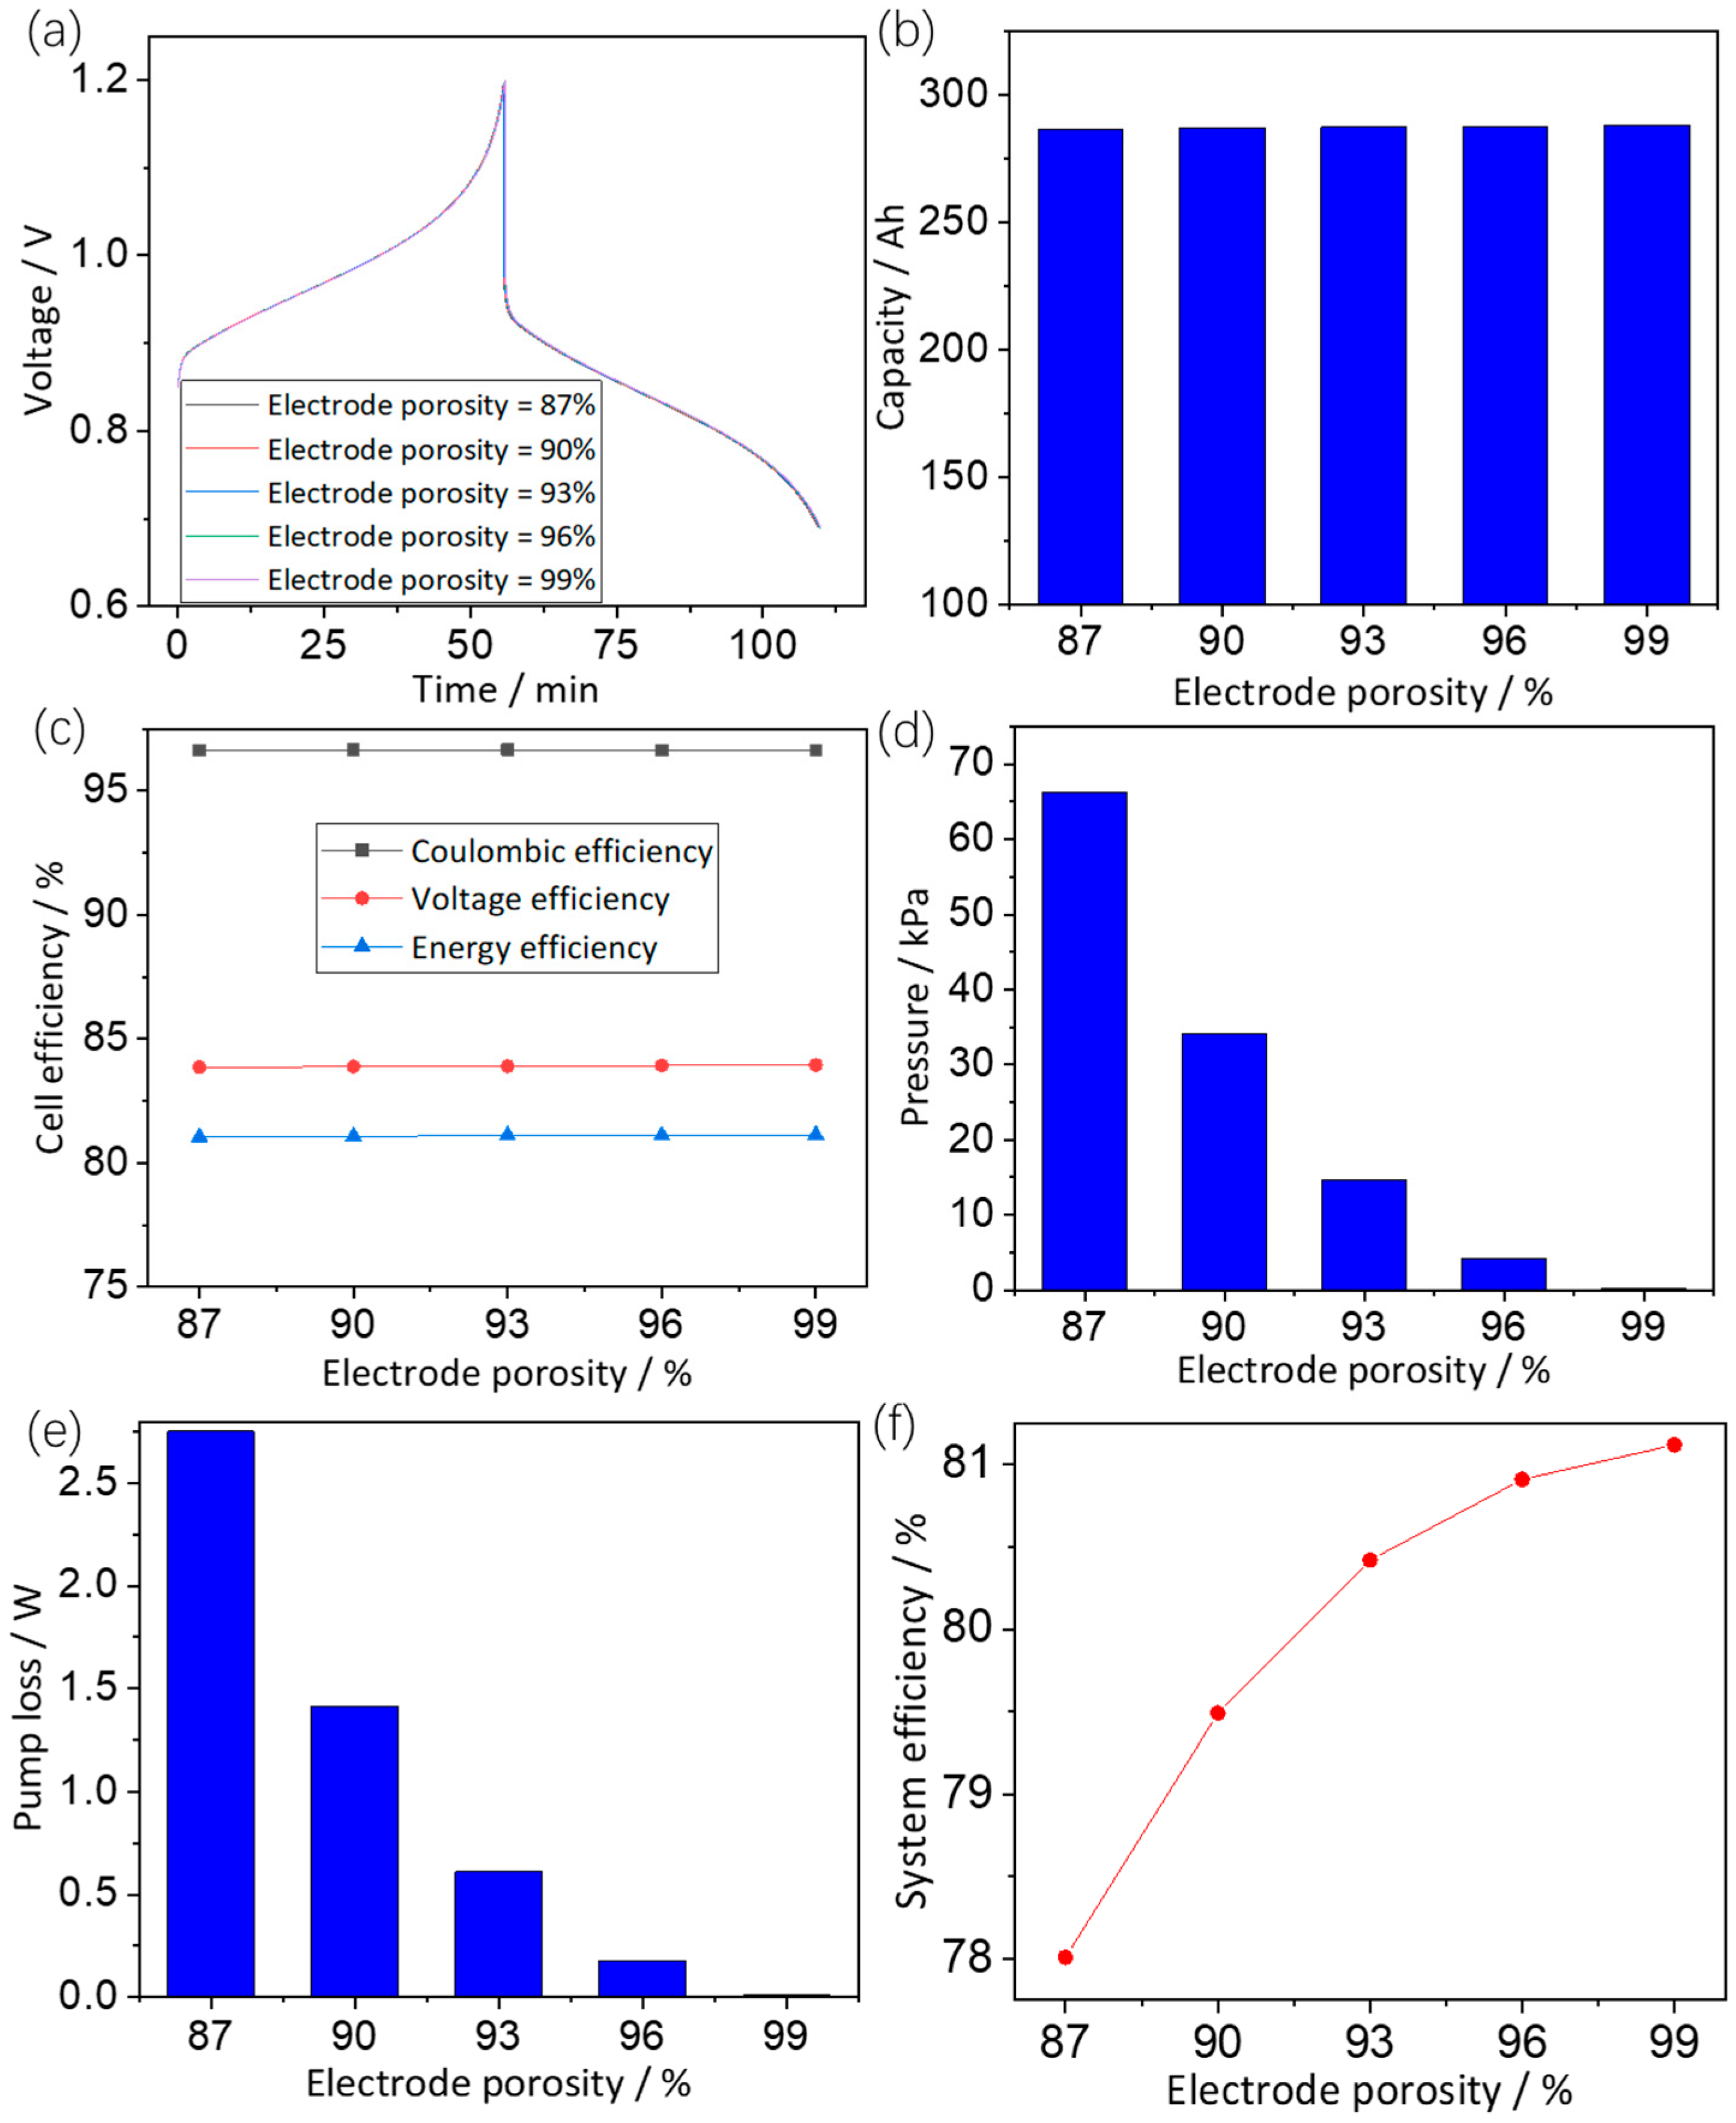
3.3.2. Effects of Electrode Porosity

Figure 7a illustrates the cell voltage with an electrode with different porosities. It can be observed that the cells with electrodes of different porosities achieve similar voltages, which is in accordance with Equations (13) and (14). Thus, the similar cell voltages result in similar cell capacities and efficiencies, as depicted in Figure 7b,c. Nevertheless, the overall performance can still differ with the variation of porosity. For instance, an electrode with greater porosity is thought to be beneficial in terms of cell pressure and pump loss. Figure 7d shows the cell pressure, which is notably lowered as the porosity increases. Similarly, the pump loss illustrated in Figure 7e also significantly decreased as the electrode porosity increased. Thus, high electrode porosity can greatly aid the realization of enhanced system efficiency. Unsurprisingly, system efficiency, as shown in Figure 7f, is greatly improved as the electrode porosity increases. More specifically, the system efficiency increases from 78% to 81% as the electrode porosity increases from 87% to 99%. Nevertheless, it is not recommended to adopt electrodes with extremely high porosity in practice since such porosity can potentially degrade the mechanical properties of the electrode. Thus, it is necessary for the electrodes in TIFBs to have proper porosity to realize superior overall performance for practical large-scale applications.

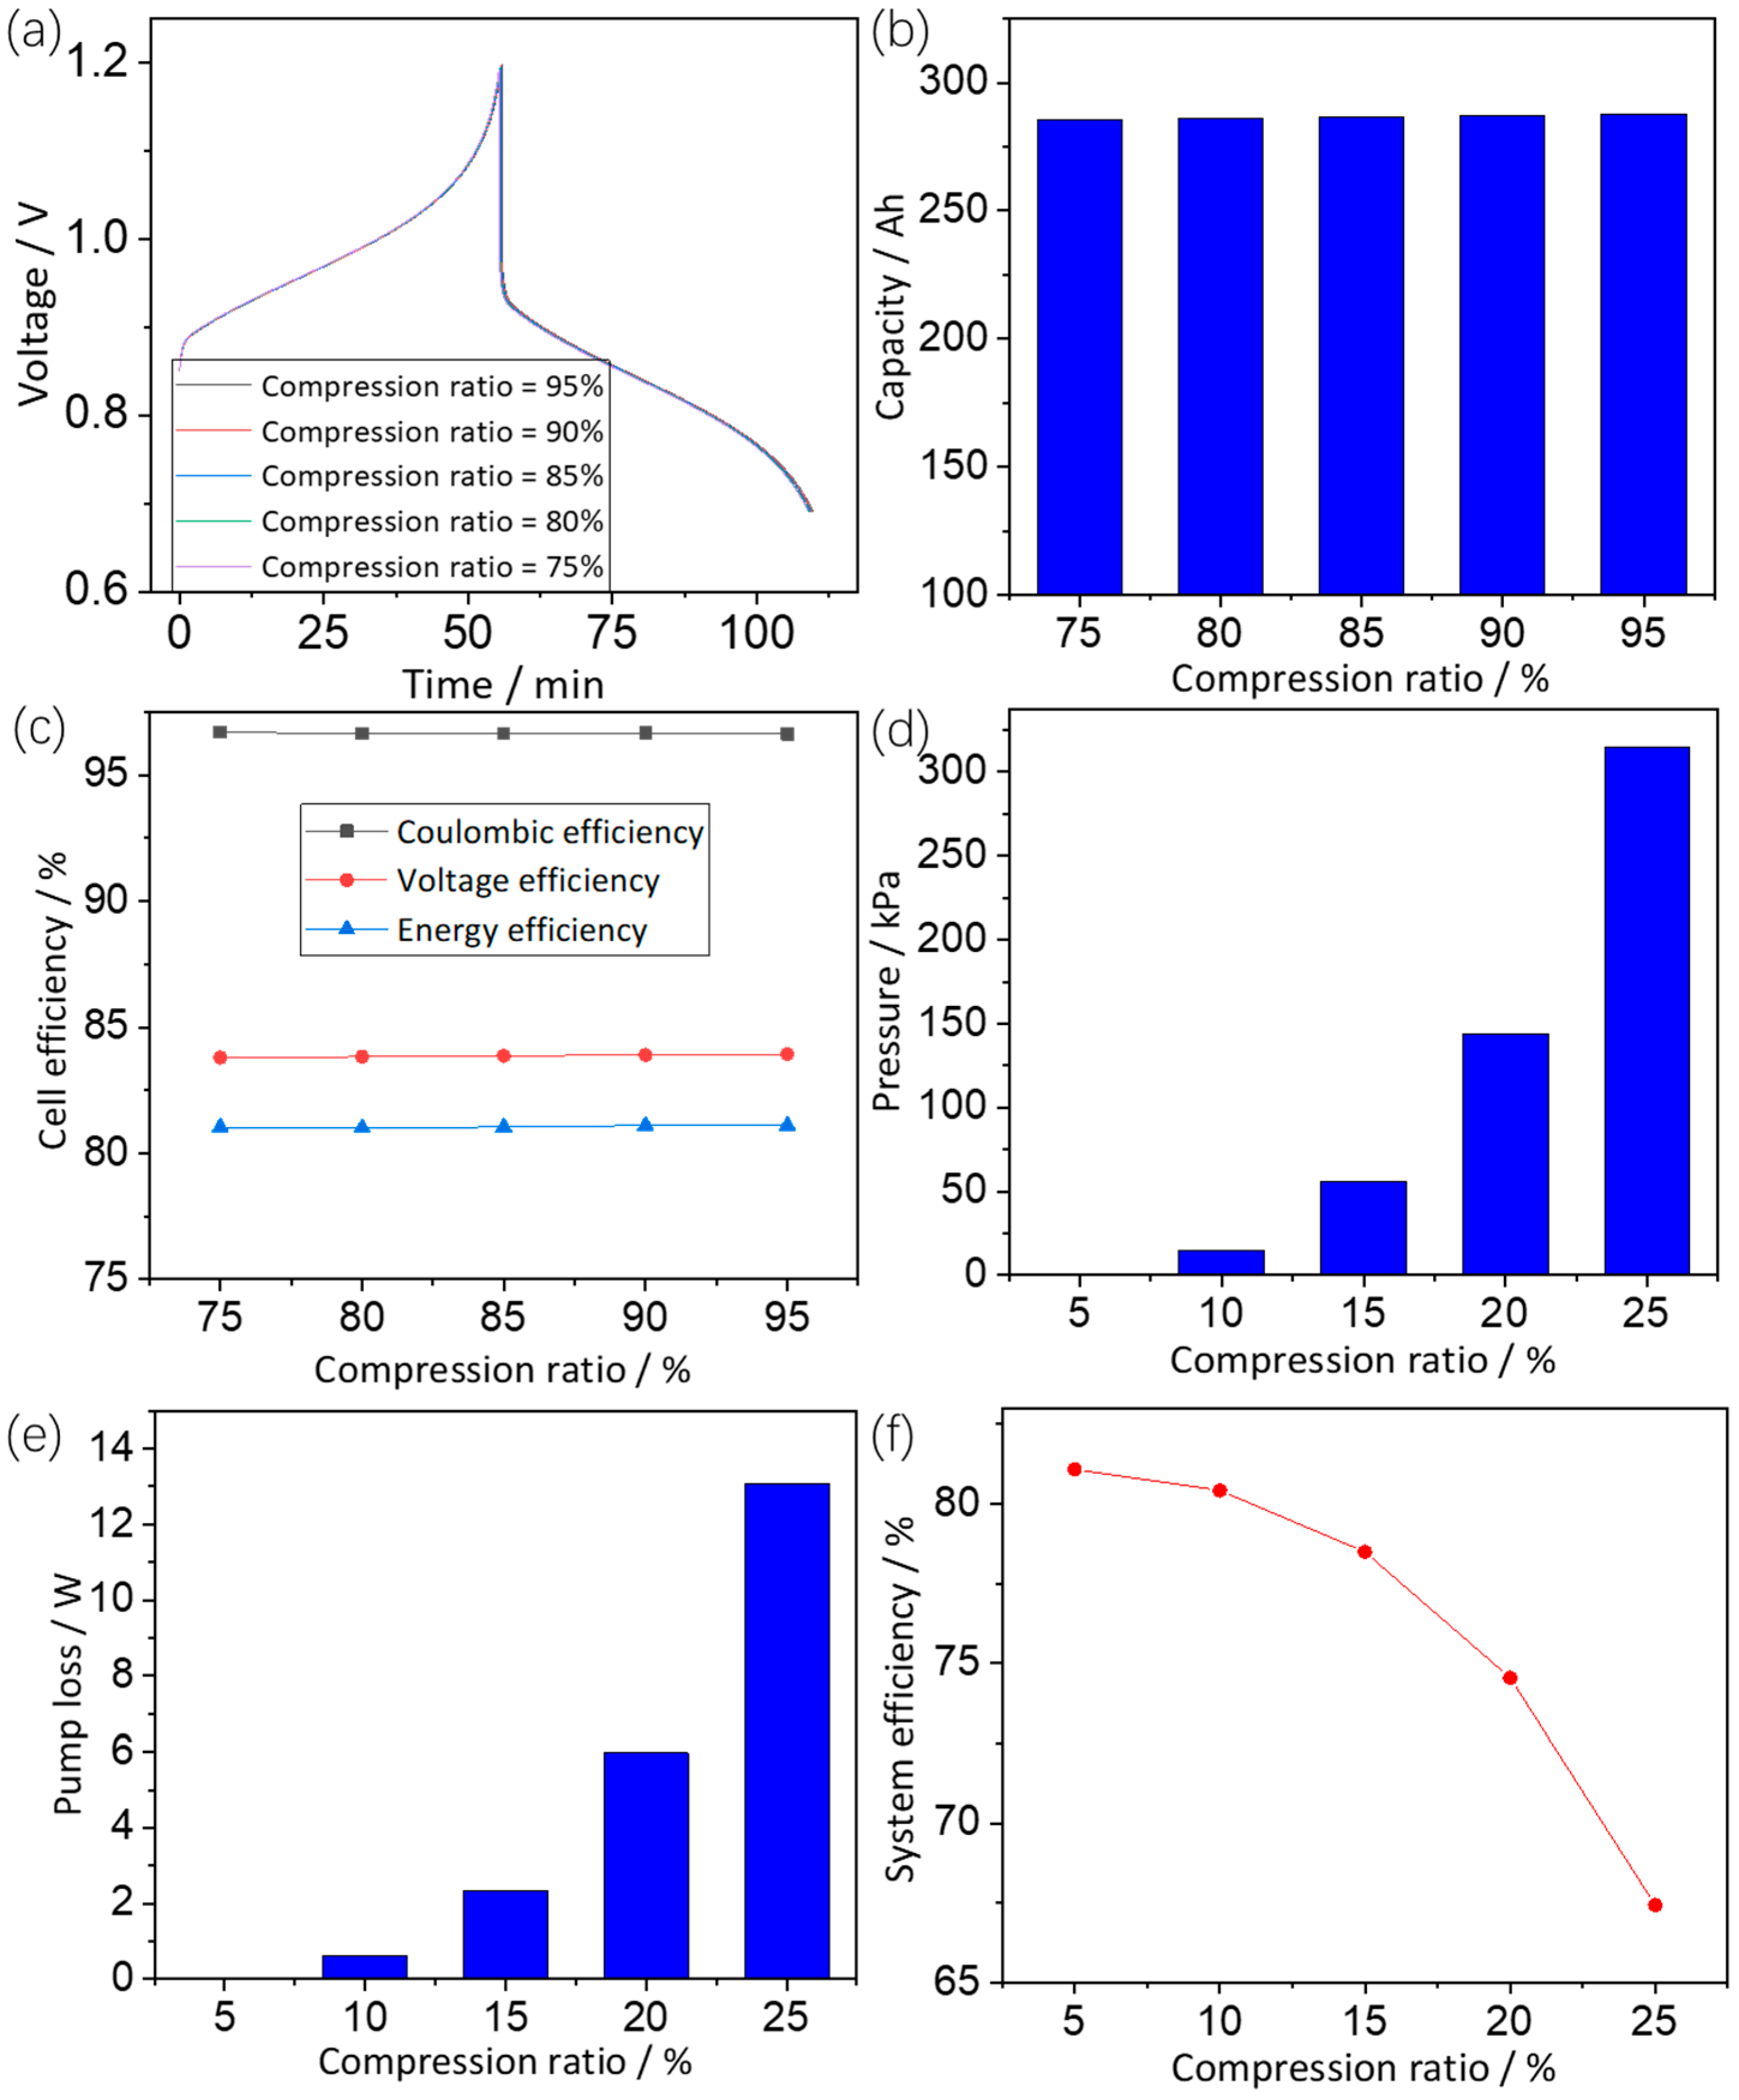
3.3.3. Effects of Compression Ratio

Aside from the factors that have been analyzed, the compression ratio of an electrode, which is the ratio of the electrode thickness in an assembled cell to the electrode thickness in its initial state, can also affect a TIFB’s performance. The charge–discharge voltages of a cell with an electrode with different compression ratios are illustrated in Figure 8a. As depicted, the cell voltages hardly differ as the compression ratio changes. As a consequence, the cell capacity and efficiency are also similar, as shown in Figure 8b,c, respectively. The main influence on cell performance is cell pressure, pumping energy loss, and system efficiency. Figure 8d,e present the observed cell pressure and pump loss, respectively. As depicted, pressure loss and pump loss both noticeably increased with the increase in the electrode compression ratio. Specifically, they both increased by up to several hundred times at a compression ratio of 25% compared with that of 5%. Hence, it is not desirable for a TIFB to employ an electrode with such a large compression ratio. The system efficiency of a cell with electrodes of different compression ratios was simulated to investigate its effects on system efficiency (Figure 8f). It can be observed that the system efficiency is notably decreased at a high compression ratio. However, employing an electrode with an extremely small compression ratio is also not preferable for practical applications owing to the significantly enlarged contact resistance between the electrode and the bipolar plate. Hence, an electrode with a moderate compression ratio is preferrable for a TIFB to realize optimized overall performance.

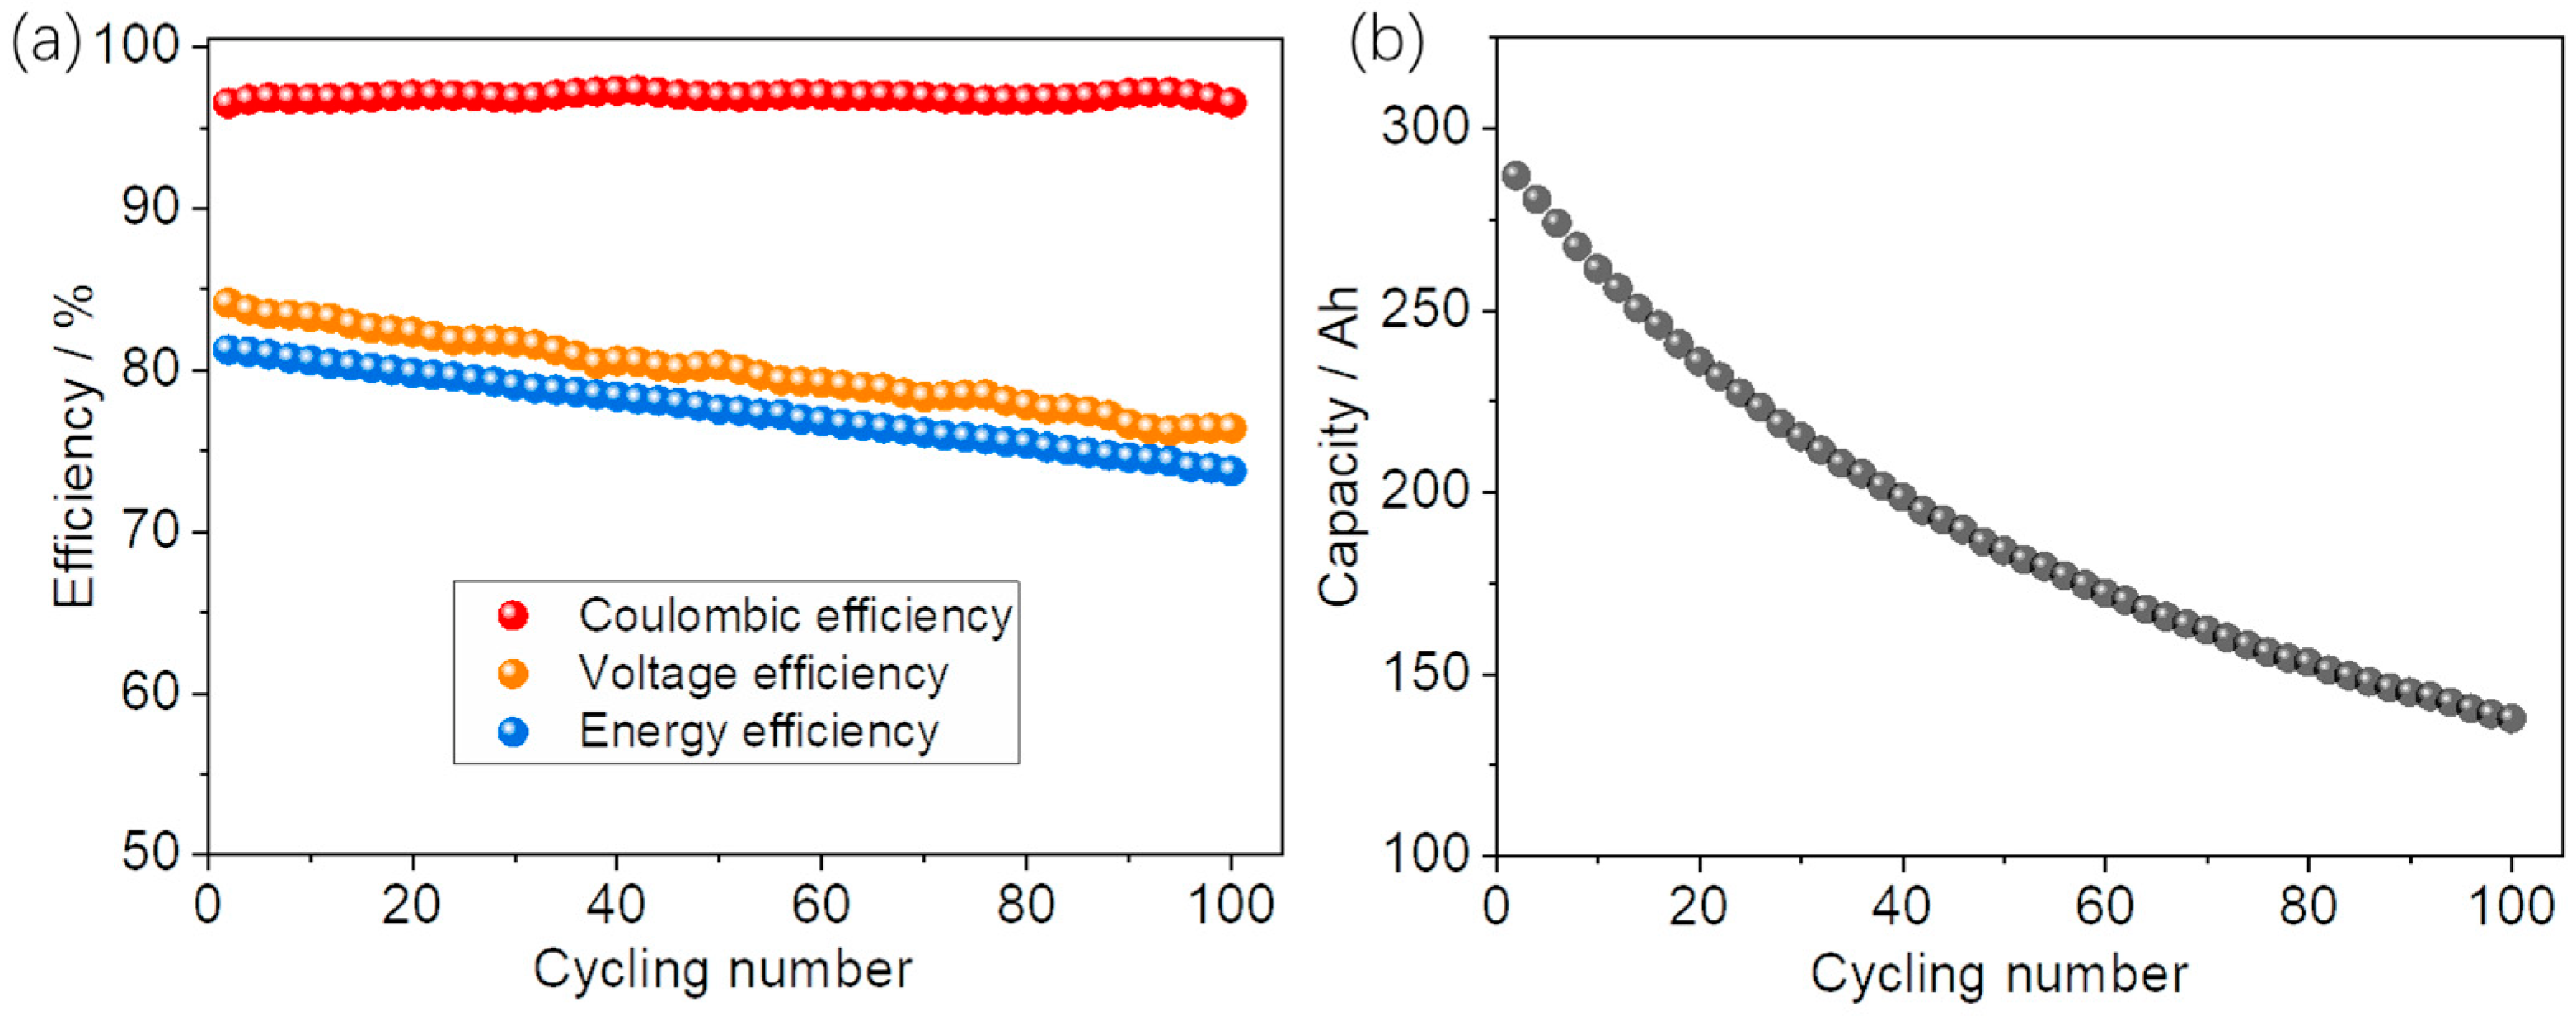
3.4. Stability Evaluation

In order to evaluate the stability of TIFBs, cycling performance was simulated using the above optimized parameters, and the results are depicted in Figure 9a,b. Figure 9a shows the cell efficiency versus the cycling number, where the coulombic efficiency is stabilized at about 97% during the 100-cycles test. The voltage efficiency and energy efficiency decreased by 7.7% and 7.4%, respectively. Figure 9b shows the discharge capacity of the TIFB, where the capacity decreases from 287 Ah to 168 Ah, with a capacity retention of about 60%, indicating that the TIFBs with optimized operational parameters and cell design present superior stability during long-term use.

4. Conclusions

This work proposed a dynamic model based on mass conservation to thoroughly investigate the characteristics of acidic tin–iron flow batteries and further optimize their performance. To facilitate the simulation, a TIFB flow cell with a 2000 cm−2 effective area was employed, and the results show that a flow factor of two is favorable to allow TIFBs to realize optimal system efficiency. Moreover, the system efficiency at 200 mA cm−2 is nearly 20% lower in comparison with that at 40 mA cm−2. In addition, it was determined that the optimized thickness and aspect ratio for an electrode are 6 mm and 1:1, respectively. Furthermore, a small compression ratio and high porosity are highly beneficial for the reduction in pump loss for TIFBs. This work represents the first effort to evaluate tin–iron flow battery performance on the basis of a dynamic model, thus avoiding repetitive field trials, the consumption of a considerable amount of electrical energy, and extensive testing times. Furthermore, such thorough investigation, especially with respect to the effects of electrode parameters, is greatly helpful to the comprehension and optimization of TIFBs.

Author Contributions

Conceptualization, H.C.; software, F.C.; investigation, Y.W.; data curation, F.C. and Y.S.; writing—original draft preparation, F.C.; writing—review and editing, H.C. and X.M.; supervision, Q.Z.; funding acquisition, F.C., X.M. and Q.Z. All authors have read and agreed to the published version of the manuscript.

Funding

This work was supported by the National Natural Science Foundation of China (No. 12274361 and No. 22005263), the Natural Science Foundation of Jiangsu Province (BK20211361), College Natural Science Research Project of Jiangsu Province (20KJA430004), and the Open Project Program of Key Laboratory for Photonic and Electric Bandgap Materials, Ministry of Education (PEBM202106).

Data Availability Statement

Data sharing not applicable.

Conflicts of Interest

The authors declare no conflict of interest.

References

  1. Wang, G.; Zou, H.; Zhu, X.; Ding, M.; Jia, C. Recent progress in zinc-based redox flow batteries: A review. J. Phys. D-Appl. Phys. 2022, 55, 163001. [Google Scholar] [CrossRef]
  2. Chen, H.; Cheng, M.; Feng, X.; Chen, Y.; Chen, F.; Xu, J. Analysis and optimization for multi-stack vanadium flow battery module incorporating electrode permeability. J. Power Sources 2021, 515, 230606. [Google Scholar] [CrossRef]
  3. Jiang, Y.; Liu, Z.; Lv, Y.; Tang, A.; Dai, L.; Wang, L.; He, Z. Perovskite enables high performance vanadium redox flow battery. Chem. Eng. J. 2022, 443, 136341. [Google Scholar] [CrossRef]
  4. Hu, Z.; Miao, Z.; Xu, Z.; Zhu, X.; Zhong, F.; Ding, M.; Wang, J.; Xie, X.; Jia, C.; Liu, J. Carbon felt electrode modified by lotus seed shells for high-performance vanadium redox flow battery. Chem. Eng. J. 2022, 450, 138377–138384. [Google Scholar] [CrossRef]
  5. Schroder, P.; Aguilo-Aguayo, N.; Obendorf, D.; Bechtold, T. Near to neutral pH all-iron redox flow battery based on environmentally compatible coordination compounds. Electrochim. Acta 2022, 430, 141042. [Google Scholar] [CrossRef]
  6. Liu, X.; Li, T.; Yuan, Z.; Li, X. Low-cost all-iron flow battery with high performance towards long-duration energy storage. J. Energy Chem. 2022, 73, 445–451. [Google Scholar] [CrossRef]
  7. Song, Y.; Zhang, K.; Li, X.; Yan, C.; Liu, Q.; Tang, A. Tuning the ferrous coordination structure enables a highly reversible Fe anode for long-life all-iron flow batteries. J. Mater. Chem. A 2021, 9, 26354–26361. [Google Scholar] [CrossRef]
  8. Yuan, Z.; Li, X. Perspective of alkaline zinc-based flow batteries. Sci. China Chem. 2022, 65, 1–16. [Google Scholar] [CrossRef]
  9. Chakraborty, M.; Murcia-Lopez, S.; Morante, J.; Andreu, T. Structural influence of the anode materials towards efficient Zn deposition/dissolution in aqueous Zn-Iodide flow batteries. J. Electrochem. Soc. 2021, 168, 040532. [Google Scholar] [CrossRef]
  10. Wang, P.; Jia, T.; Wang, B. Review-Recent Advance in Self-Supported Electrocatalysts for Rechargeable Zinc-Air Batteries. J. Electrochem. Soc. 2020, 167, 110564. [Google Scholar] [CrossRef]
  11. Yao, S.; Huang, X.; Sun, X.; Zhou, R.; Cheng, J. Structural modification of negative electrode for Zinc—Nickel single-flow battery based on polarization analysis. J. Electrochem. Soc. 2021, 168, 070512. [Google Scholar] [CrossRef]
  12. Xu, Z.; Fan, Q.; Li, Y.; Wang, J.; Lund, P. Review of zinc dendrite formation in zinc bromine redox flow battery. Renew. Sustain. Energy Rev. 2020, 127, 109838. [Google Scholar] [CrossRef]
  13. Liu, N.; Mohanapriya, K.; Pan, J.; Hu, Y.; Sun, Y.; Liu, X. A facile preparation of λ-MnO2 as Cathode material for high-performance zinc-manganese redox flow battery. J. Electrochem. Soc. 2020, 167, 040517. [Google Scholar] [CrossRef]
  14. Amini, K.; Pritzker, M. A two-dimensional transient model for a zinc-cerium redox flow battery validated by extensive experimental data. J. Power Sources 2021, 506, 230237. [Google Scholar] [CrossRef]
  15. Selverston, S.; Savinell, R.; Wainright, J. Zinc-Iron flow batteries with common electrolyte. J. Electrochem. Soc. 2017, 164, A1069–A1075. [Google Scholar] [CrossRef]
  16. Hu, J.; Yuan, G.; Zhi, L.; Zhang, H.; Yuan, Z.; Li, X. In Situ Defect-Free Vertically Aligned Layered Double Hydroxide Composite Membrane for High Areal Capacity and Long-Cycle Zinc-Based Flow Battery. Adv. Funct. Mater. 2021, 32, 1906803. [Google Scholar] [CrossRef]
  17. Kim, M.; Yun, D.; Jeon, J. Effect of a bromine complex agent on electrochemical performances of zinc electrodeposition and electrodissolution in Zinc—Bromide flow battery. J. Power Sources 2019, 438, 227020. [Google Scholar] [CrossRef]
  18. Guo, L.; Guo, H.; Huang, H.; Tao, S.; Cheng, Y. Inhibition of zinc dendrites in zinc-based flow batteries. Front. Chem. 2020, 8, 557. [Google Scholar] [CrossRef]
  19. Xu, Z.; Wu, M. Toward Dendrite-Free Deposition in Zinc-Based Flow Batteries: Status and Prospects. Batteries 2022, 8, 117. [Google Scholar] [CrossRef]
  20. Yao, Y.; Wang, Z.; Li, Z.; Lu, Y. A dendrite-free tin anode for high-energy aqueous redox flow batteries. Adv. Mater. 2021, 33, 2008095. [Google Scholar] [CrossRef]
  21. Chen, F.; Sun, Q.; Gao, W.; Liu, J.; Yan, C.; Liu, Q. Study on a high current density redox flow battery with tin (II)/tin as negative couple. J. Power Sources 2015, 280, 227–230. [Google Scholar] [CrossRef]
  22. Zeng, Y.; Yang, Z.; Lu, F.; Xi, Y. A novel tin-bromine redox flow battery for large-scale energy storage. Appl. Energy 2019, 255, 113756. [Google Scholar] [CrossRef]
  23. Zhou, X.; Lin, L.; Lv, Y.; Zhang, X.; Wu, Q. A Sn-Fe flow battery with excellent rate and cycle performance. J. Power Sources 2018, 404, 89–95. [Google Scholar] [CrossRef]
  24. Zhou, X.; Lin, L.; Lv, Y.; Zhang, X.; Fan, L.; Wu, Q. Elucidating effects of component materials and flow fields on Sn-Fe hybrid flow battery. J. Power Sources 2020, 450, 227613. [Google Scholar] [CrossRef]
  25. Chen, H.; Wang, Z.; Zhang, S.; Cheng, M.; Chen, F.; Xu, Y.; Luo, J. A low-cost neutral aqueous redox flow battery with dendrite-free tin Anode. J. Electrochem. Soc. 2021, 168, 110547. [Google Scholar] [CrossRef]
  26. Ma, Q.; Xing, L.; Su, H.; Zhang, W.; Yang, W.; Xu, Q. Numerical investigation on the dispersion effect in vanadium redox flow battery. Chem. Eng. J. 2022, 393, 124753. [Google Scholar] [CrossRef]
  27. Chen, Z.; Yu, W.; Liu, Y.; Zeng, Y.; He, Q.; Tan, P.; Ni, M. Mathematical modeling and numerical analysis of alkaline zinc-iron flow batteries for energy storage applications. Chem. Eng. J. 2021, 405, 126684. [Google Scholar] [CrossRef]
  28. Tang, A.; Bao, J.; Skyllas-Kazacos, M. Studies on pressure losses and flow rate optimization in vanadium redox flow battery. J. Power Sources 2014, 248, 154–167. [Google Scholar] [CrossRef]
  29. Li, Y.; Skyllas-Kazacos, M.; Bao, J. A dynamic plug flow reactor model for a vanadium redox flow battery cell. J. Power Sources 2016, 311, 57–67. [Google Scholar] [CrossRef]
  30. Chen, H.; Cheng, M.; Liu, L.; Wang, Y.; Chen, F.; Ma, X.; Zhang, Q. Mathematical modeling and in-depth analysis of 10 kW-class iron-vanadium flow batteries. J. Power Sources 2023, 563, 232813. [Google Scholar] [CrossRef]
Figure 2. Experimental and simulated voltages at (a) 50 mA cm−2 and (b) 100 mA cm−2.
Batteries 09 00278 g002
Figure 3. Effects of flow rate on (a) voltage, (b) capacity, (c) cell efficiency, (d) pressure, (e) pump loss, and (f) system efficiency.
Batteries 09 00278 g003
Figure 4. Effects of current density on (a) voltage, (b) cell efficiency, (c) capacity, (d) pressure, (e) pump loss, and (f) system efficiency.
Batteries 09 00278 g004
Figure 5. Effects of electrode thickness on (a) voltage, (b) capacity, (c) cell efficiency, (d) pressure, (e) pump loss, and (f) system efficiency.
Batteries 09 00278 g005
Figure 6. Effects of electrode aspect ratio on (a) voltage, (b) capacity, (c) cell efficiency, (d) pressure, (e) pump loss, and (f) system efficiency.
Batteries 09 00278 g006
Figure 7. Effects of electrode porosity on (a) voltage, (b) capacity, (c) cell efficiency, (d) pressure, (e) pump loss, and (f) system efficiency.
Batteries 09 00278 g007
Figure 8. Effects of electrode compression ratio on (a) voltage, (b) capacity, (c) cell efficiency, (d) pressure, (e) pump loss, and (f) system efficiency.
Batteries 09 00278 g008
Figure 9. Cycling performance: (a) efficiency; (b) capacity.
Batteries 09 00278 g009
Table 1. Operating parameters and cell geometry.
ParametersValue
Sn ion concentration0.5 mol L−1
Fe ion concentration1 mol L−1
Electrolyte volume60 mL
Flow rate40 mL min−1
Electrode size4 cm × 7 cm × 4.2 mm
Voltage range0.4–1.2 V
Table 2. Simulation parameters and cell geometry.
ParametersValue
Electrolyte volume25 L
Fe-ion concentration1 mol L−1
Sn-ion concentration0.5 mol L−1
Electrode size50 cm × 40 cm × 4.2 mm
Electrode porosity93%
Temperature298.15 K
Cell formal potential0.9 V
Area resistance of cell0.7 Ω cm2
Diffusion coefficient of Fe3+4.0 × 10⁻¹²
Diffusion coefficient of Fe2+4.8 × 10⁻¹²
Diffusion coefficient of Sn2+5.0 × 10⁻¹²
Cut-off for dischargingSOC = 10%
Cut-off for chargingSOC = 90%
Pipe length1 m
Pipe radius2.5 cm
Disclaimer/Publisher’s Note: The statements, opinions and data contained in all publications are solely those of the individual author(s) and contributor(s) and not of MDPI and/or the editor(s). MDPI and/or the editor(s) disclaim responsibility for any injury to people or property resulting from any ideas, methods, instructions or products referred to in the content.

