1. Introduction
Due to the shortage of resources and environmental pollution, the energy supply for transportation is constantly changing. As electric power resources can be obtained with a variety of energy sources, electrification has become an important direction for the development of automotive technology. Many types of batteries are used in electric vehicles (EVs) for energy storage. Considering the performance of batteries, it is necessary to obtain battery state information to ensure the safety of the energy storage system [
1,
2]. In a vehicle battery management system (V-BMS), various hardware resources are used to measure the battery voltage, current, temperature, insulation, and other states to ensure the safety of the battery system [
3,
4,
5]. With the establishment of new energy vehicle cloud data platforms, it is feasible to use cloud platform data to evaluate the states of battery packs. The concept of a cloud-based battery management system (C-BMS) is proposed [
6]. A cloud platform has advantages in data quantity and computing ability, which provides favorable conditions for battery state estimation.
Among the states of batteries, the battery state of charge (SOC) is an important and basic parameter. SOC is important not only for safety but also for an estimation of the remaining available energy, which is needed for range estimation. SOC allows us to evaluate performance with discharge and recharge power. Additionally, to more effectively utilize the energy storage resources of electric vehicles, an accurate estimation of the battery state is essential [
7]. It has been widely studied by scholars in recent years. Many battery SOC estimation methods have been proposed. The methods can be roughly divided into three categories. The first category is single-factor SOC estimation methods, such as the ampere-hour (Ah) counting method [
8], the open circuit voltage (OCV) method [
9], and the internal resistance method [
10,
11]. Battery SOC estimation algorithms have low complexity and are easy to apply in V-BMSs. The second category is multifactor fusion methods mainly based on Kalman filters [
1,
12]. The methods are combined with battery model techniques, such as battery physical models [
13] and equivalent circuit models [
14] to solve the battery SOC estimation problem with high accuracy and robustness. The third category is battery SOC estimation methods based on multiple factors and machine learning [
15,
16]. In recent years, with the development of artificial intelligence technologies, the third category has been increasingly developed. Based on the review of the application of machine learning technologies in lithium-ion battery fault diagnosis and state estimation, methods such as logic regression, random forest, support vector machine, neural network, and Bayesian process regression have been applied in battery state estimation and fault diagnosis. With the accumulation of lithium-ion battery data and the development of computing chip technology, machine learning technology will play a greater role in battery state assessment [
16].
To build the relationships of the voltage, current, temperature and the state of the battery, Liu et al. [
17] adopted a back-propagation neural network (BPNN) model. The model achieved good accuracy without a large computational cost. However, BPNN cannot easily capture temporal information. To process time series and avoid gradient vanishing, a long short-term memory (LSTM) network [
18] and a gated recurrent unit (GRU) network [
19] were employed for battery SOC estimation. Generally, there was a positive correlation between the complexity and accuracy of the model. However, the more complex the model, the harder it is to converge. To solve this problem, Tian et al. [
20] and Yang et al. [
21] introduced the adaptive cubature Kalman filter (ACKF) and unscented Kalman filter (UKF) on the basis of LSTM. The proposed methods were verified by dynamic tests at various temperatures. Good feature extraction is beneficial for the training of the battery SOC estimation model. In the method, the voltage and current data of the battery are not directly used as inputs for the state estimation model. Instead, an automatic encoder is used to extract new features of the input quantity. Considering the close correspondence between battery OCV and SOC, Li et al. [
22] combined recursive least squares (RLS) with an LSTM recurrent neural network model for the multi-state estimation of lithium-ion supercapacitors. In the method, new feature parameters are generated using RLS and LSTM. The SOC of the energy storage device is obtained through the constructed energy storage device status lookup table. It can be seen that reasonable processing of the input parameters of the model helps to improve the training effectiveness of the neural network model. To capture the information in both forward and reverse directions, Bian et al. [
23] introduced a bidirectional mechanism on the basis of LSTM. The bidirectional LSTMs were stacked to enhance the precision of SOC estimation. Later, Bian et al. [
24] employed a bidirectional LSTM encoder–decoder architecture for the estimation of the SOC sequence. With a more complex structure, it had a stronger sequence expression ability than their former work. To simplify the process of model training, Bhattacharjee et al. used parameter-transfer learning for the development of SOC estimation models with different battery types and working conditions [
25]. To make full use of the cloud platform, Li et al. adopted stacked denoising autoencoders (SDAE) and an extreme learning machine (ELM) to realize EV battery pack SOC estimation for C-BMS applications [
1]. A joint operation mode of C-BMS and V-BMS was presented. In this research, the battery pack SOC estimated by the C-BMS was used to update the equivalent circuit model parameters and the hyperparameters of the Kalman filter in the V-BMS.
Based on the investigation of the SOC estimation methods, the results of the research have proven the effectiveness of machine learning for battery state estimation. However, most of the existing technical solutions cannot be directly applied to C-BMS applications. The particularity of battery state estimation based on C-BMS is mainly reflected in the following aspects:
With the increase in the number of new energy vehicles, the cloud data platform needs to manage a large amount of vehicle data. The data logging interval on the data platform is large. In China, the data recording interval is within 30 s according to the requirements of national standards. A large recording interval makes the data unable to meet the sampling theorem. It is difficult to adapt to the phenomenon. Estimating the battery SOC with a large data recording interval is a difficult problem.
- 2.
Various driving conditions.
Due to the variety of driving periods and working conditions, the accuracy of the state estimation with machine learning methods is reduced due to the poor generalization ability of the method. How to construct the common features among various working conditions from the original voltage, current, and temperature, and improve the correlation between features and SOC need to be studied.
- 3.
Differences between laboratory and vehicle batteries.
Due to the differences between the laboratory and vehicle battery samples, such as the battery types, capacities, scales, working conditions, etc., the SOC estimation model obtained based on the laboratory training data cannot be used in the cloud data platform directly. How to revise the model and training method so that the model can be applied to each vehicle in the cloud platform and can be applied to different operating conditions and battery aging states is a problem to be solved.
With unresolved problems, a battery SOC estimation method based on common feature extraction and transfer learning for C-BMS applications is proposed in this paper. The empirical mode decomposition (EMD) method and a compensation strategy based on the internal resistance model are used to extract the common features. An analysis of correlation is conducted to select the appropriate features for SOC estimation. In terms of battery SOC estimation, an LSTM neural network is used to build the cell-level battery SOC estimation model with laboratory data. Subsequently, in view of the inconsistency of the laboratory battery data and the cloud platform data, the cell-level battery SOC estimation model for the C-BMS application is obtained through parameter-based transfer learning. With the adaptive weighting strategy, the battery pack SOC estimation model for C-BMS application is obtained.
The remainder of this paper is organized as follows. In
Section 2, the definitions of the cell-level battery SOC and the battery pack SOC are given. In
Section 3, a common feature extraction method based on EMD and the internal resistance model is introduced. In
Section 4, a battery SOC estimation model for a C-BMS application is presented. Discussions of the experimental results are shown in
Section 5. Some conclusions are given in
Section 6.
3. Feature Extraction for Battery SOC Estimation
Due to the influence of driving habits, battery current distribution has great randomness and fluctuation. Battery terminal voltage also fluctuates greatly with the dynamic current. In the process of battery SOC estimation, conventional methods mainly rely on the terminal voltage, load current, and environmental temperature time series data of the battery. The initial feature pool is battery voltage, current, and temperature data. The battery terminal voltage is related to the battery open circuit voltage. It is generally believed that there is a one-to-one correspondence between the two parameters. The integral result of the battery current with time reflects the amount of charge capacity discharged or charged into the battery. Due to the large fluctuation of the battery operating current and the large sampling interval, directly using battery voltage and current timing data cannot accurately calculate the battery SOC. The inputs of the machine learning model parameters such as the battery terminal voltage and current is not optimal. Herein, a common feature extraction method for EV working condition data on the cloud platform is proposed. EMD is used to extract the tendency features from the original voltage and current to reduce the fluctuation of the original data. The voltage residue is compensated for by the average voltage on the internal resistance of the battery. Subsequently, according to the correlation analysis result, the common features for battery SOC estimation are selected.
3.1. Empirical Mode Decomposition
Compared with the original voltage, the change trend of the battery terminal voltage is more stable during the driving process of the vehicle. To obtain the change trend information, EMD is adopted for battery feature extraction. By giving an original time series signal Xk (k = 1, 2, …, N), the process of EMD can be described by Algorithm 1.
| Algorithm 1: Empirical mode decomposition |
| Step 1: Initialize: |
| Step 2: Acquire the i th intrinsic mode function (IMF): |
| (a): Initialize: |
| (b): Identify all the extreme points of hj−1,k and then adopt the three-order Hermite interpolation function to obtain the upper envelope uk and the lower envelope lk of hj−1,k. Later, the average envelope mlk of uk and lk can be computed using Equation (2).
|
| (c): Subtract the average envelope mlk from the signal hj−1,k. The new signal hj,k can be obtained, as shown in Equation (3).
|
| (d): Judge whether hj,k meets the two characteristics of IMF. If hj,k satisfies the above characteristics, it will be defined as the ith IMF named by IMFi,k and step 3 will be executed. If hj,k does not satisfy the above characteristics, j = j + 1 and step (b) to (d) will be executed until hj,k satisfies the above characteristics. The Cauchy convergence criterion is adopted for the termination condition of screening IMF. It is shown in Equation (4).
where the screening process of IMFi,k is terminated when the value is [0.2, 0.3]. It is considered that the current hlj,k fully meets the two characteristics of IMF. |
| Step 3: Equation (5) is used to extract residue ri,k. If the extreme points’ number of residue ri,k is greater than 2, i = i + 1 and Step 2 is executed. Otherwise, the decomposition is stopped and the current ri,k is the original signal Xk’ s residue named by Rk.
|
Finally, the original time series signal
Xk can be reconstructed by
IMFi,k and
Rk:
where
m is the number of
IMFs of the original time series signal.
Substitute voltage Uk for Xk and conduct the process of the EMD algorithm. The IMFi,k (i = 1, 2, …, m) of voltage and voltage residue Uresidue,k can be obtained (k = 1, 2, …, N). In this paper, the IMFi,k of the terminal voltage are added, and the sum is regarded as voltage IMFs UIMFs,k. It can reflect the local change in the battery parameters. Uresidue,k can reflect the variation trend of the voltage. In addition, for the acquirement of a stable variate, current Ik is processed similarly. Current IMFs IIMFs,k and current residue Iresidue,k are obtained. As temperature values are relatively stable compared with voltage and current, they are not decomposed through EMD.
3.2. Online Parameter Identification and the Compensation Strategy
In the case of a large sampling interval among the battery data on the cloud platform, using complicated models to simulate batteries will introduce a systematic error during the course of discretization. Hence, a simplified internal resistance model [
13] shown in
Figure 1 was adopted to model batteries in this paper.
In
Figure 1,
U and
I are the terminal voltage and current of the internal resistance model, respectively.
OCV represents the open-circuit voltage.
RΩ is the internal resistance of the battery.
The terminal voltage of the battery can be expressed as follows:
It is assumed that there is little difference between the OCV and OCV tendency in the local range. In view of the average voltage deviation on the internal resistance between the OCV tendency and voltage residue, the following relationship is established:
where
is the mean current in a period of time.
The linear regression equation for the internal resistance parameter identification is shown in Equation (9). The least-squares (LS) method is used to obtain the optimal solution through Equation (11).
where
and
.
To further improve the dependency between the voltage residue and SOC, the voltage residue is compensated for through Equation (11).
where
Uc,residue,k is the compensated voltage residue at time
k.
3.3. Feature Selection Based on Correlation Analysis
For the training of an artificial neural network model, too many input features with high or low correlation will lead to overfitting [
31]. As a result, correlation analysis should be executed to select the appropriate features as the inputs of the model. Herein, the selectable features are mainly about voltage, voltage residue, compensated voltage residue, current, current residue, and temperature.
Figure 2 shows the Pearson correlation coefficients (PCCs) between features and SOC. To simplify the analysis, the calculation results of PCCs were taken as absolute values.
In
Figure 2, it can be seen that features such as voltage, voltage residue, and compensated voltage residue have high PCCs with SOC. Among them, the compensated voltage residue has the highest value of 0.953. Among the three features, to avoid overfitting, only the compensated voltage residue was selected. Considering that voltage IMFs represent the local variation in voltage, which contains detailed information on the SOC, voltage IMFs that have a low PCC with the SOC should also be selected. In addition, as the current residue can reflect the average change rate of SOC, it was also regarded as one of the input features. Combined with the current residue, the current IMFs can represent the instantaneous change direction of SOC, so it should also be chosen. As the batteries release different capacities at diverse temperatures, temperature should also be chosen. In conclusion, the final input features of the model were the compensated voltage residue, voltage IMFs, current residue, current IMFs, and temperature.
4. Battery SOC Estimation for C-BMS
The battery cell SOC estimation model for C-BMS application in this paper was built using common feature extraction and the transfer learning method. To shorten the development period of battery SOC estimation models with different types and working conditions, the battery cell SOC estimation model for C-BMS was transferred from the laboratory battery cell SOC estimation model. The transferring process includes data range matching and parameter-transfer learning. In addition, a battery SOC calibration method based on a cloud platform was designed to provide training samples for model training.
4.1. Battery SOC Estimation with Laboratory Data
In recent years, with the development of data-driven technology, machine learning has become increasingly popular with researchers. As the battery SOC estimation task refers to time series data, recurrent neural networks (RNNs) can be adopted. However, the classical RNN suffers from vanishing gradients and exploding gradients. In 1997, Sepp Hochreiter proposed the LSTM network, which consists of input gate
i, forgetting gate
f, output gate
o, hidden layer
h, and cell state
c, to solve the problems [
32]. The model is very suitable for addressing time series data modeling problems. As a result, it is used for laboratory battery SOC estimation. The structure of the LSTM cell is shown in
Figure 3.
In
Figure 3,
x is the model input. The range of the three gate units is from 0 to 1, which determines how much information is stored. Hidden layer
h is used for storing short memory, while the cell state is used for storing long memory. The forget gate
f determines the forgetfulness level of the last cell state
c, while the input gate
i determines the absorption level of the current input information
. Both of them determine the current cell state
c. Later, the current hidden layer
h is obtained through the current state cell
c and the output gate
o. The above mechanism of LSTM can be described by Equations (12)–(17):
where
W and
U represent weight matrices, and
b represents the corresponding bias. sigm is the sigmoid function, which scales the output value into the range of 0 to 1, and tanh is the hyperbolic tangent function, which scales the output value into the range of 0 to 1.
is the operator of a dot product.
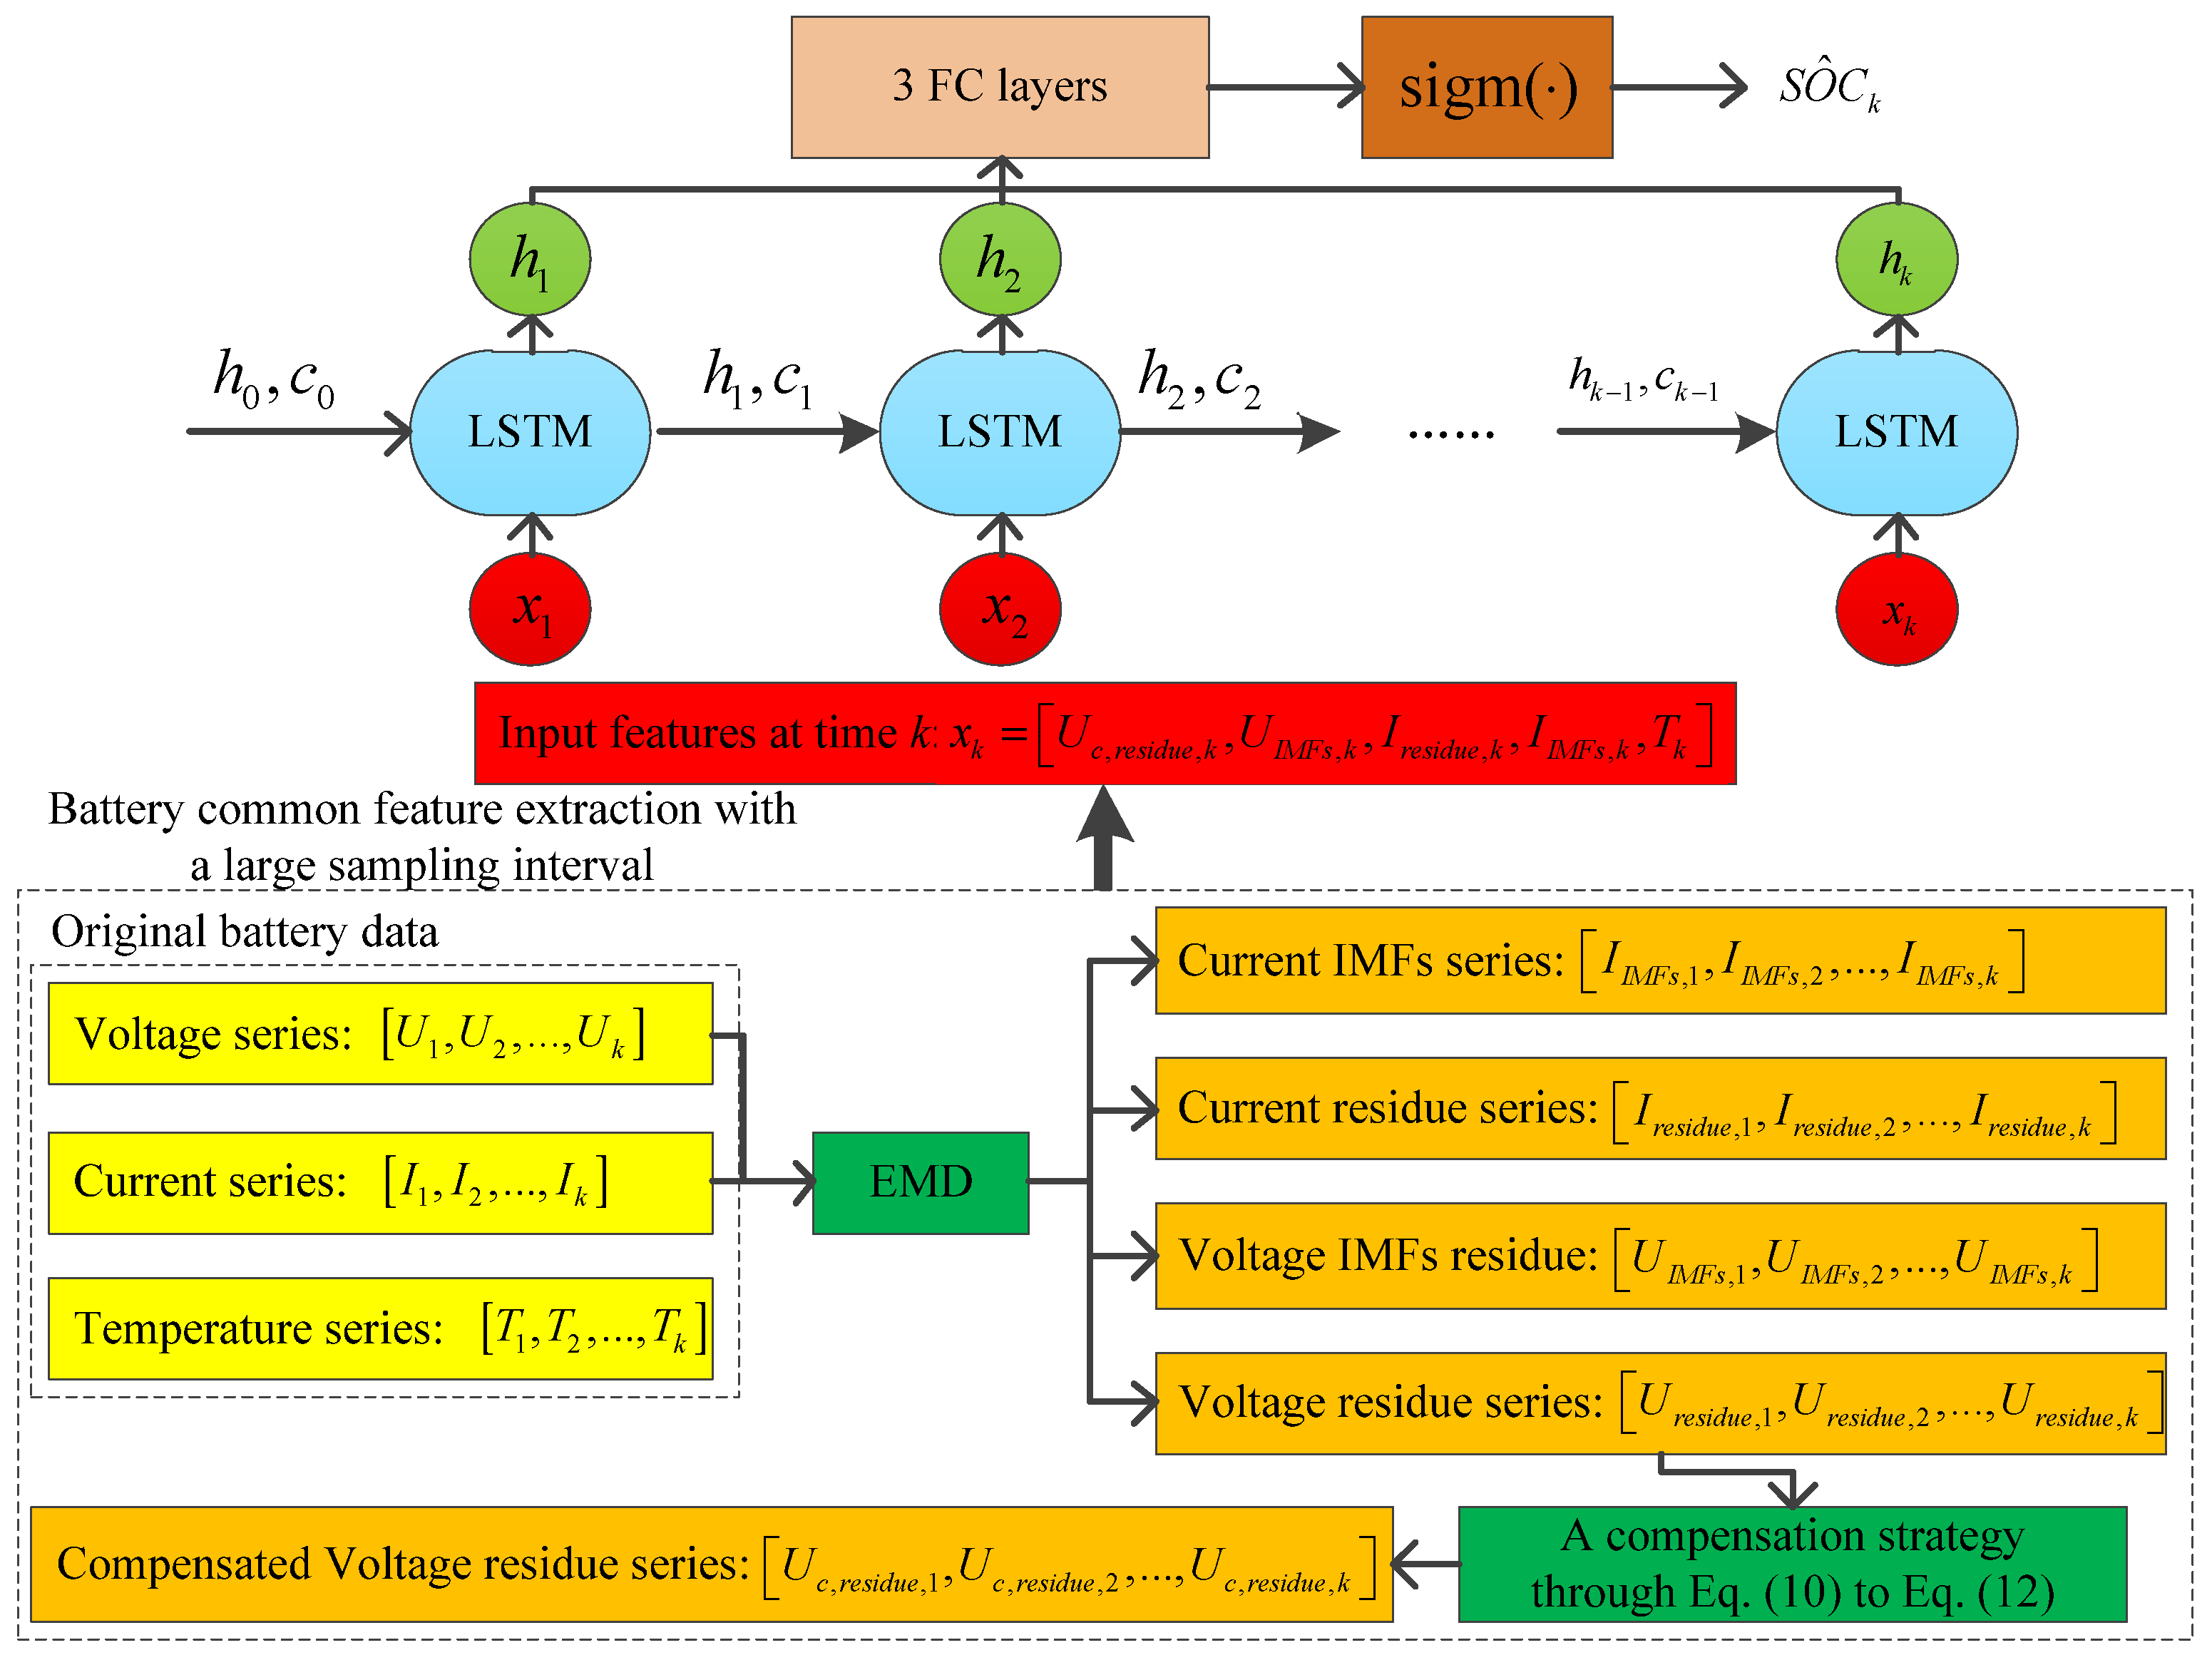
Figure 4 shows the laboratory battery SOC estimation model in this paper. The experimental data are processed by the common feature extraction method. The new series of battery feature data, including the compensated voltage residue, voltage IMFs, current residue, current IMFs and temperature, are obtained.
h0 and
c0 are the initial values of hidden layer
h and cell state
c, respectively. Based on the long- and short-term memory function of hidden layer
h and cell state
c, the model can learn the internal characteristics of the batteries from the series data. Three layers of the fully connected (FC) neural network are connected to the hidden layer
hk for dimension conversion. Finally, with the numerical conversion through the sigm(·) activation function, the battery SOC at time
k is obtained.
4.2. Model Transferring for C-BMS Applications
Compared with laboratory battery cells, a vehicle battery has a complex structure, which is composed of multiple battery cells in series and parallel. There are significant differences between vehicle battery data and the laboratory battery cell data in terms of battery model, data magnitude, and operating conditions. As a result, the battery cell SOC estimation model obtained from laboratory data cannot be directly used for C-BMS battery SOC estimation. Existing studies have shown that transfer learning has the ability to capture model differences and usage condition differences between batteries [
32,
33]. Model transfer is implemented to solve the problem.
4.2.1. Data Range Matching
Before model transfer, data range matching is used to reduce model differences and operating condition differences. The main purpose of battery data range matching is to improve the consistency between the input parameters during model usage and the input parameters during model training, which is beneficial for enhancing the model’s generalization ability. In this process, it is necessary to consider the characteristics of the battery to scale the battery voltage and voltage data reasonably to avoid losing physical meaning after scaling. Therefore, the cloud platform battery cell data and the input volume of the laboratory battery cell SOC estimation model are consistent in the data range.
In terms of battery voltage, the cloud platform battery cell voltage is processed using Equation (18) to match the voltage range of the laboratory battery cell:
where
and
are the voltages before and after the data matching of the actual vehicle battery cells, respectively.
and
are the upper cutoff voltage and lower cutoff voltage of the actual vehicle battery cells, respectively.
and
are the upper cutoff voltage and lower cutoff voltage of the laboratory battery cells, respectively.
Since the actual vehicle current data are much larger than the current data of the laboratory battery cell, the load current of the vehicle needs to be scaled using Equation (19):
where
and
are the currents before and after data matching, respectively.
and
are the cell capacities of the vehicle battery and the laboratory battery, respectively.
Figure 5 shows the data range matching result of the battery load current. In
Figure 5a, the statistical results of the battery load current values under laboratory and driving conditions are shown. The discharge current is set to a negative value, and the energy feedback current is set to a positive value. The load current fluctuates under both laboratory and driving conditions. In the statistical result, the horizontal axis represents the range of numerical changes in the load current, and the vertical axis represents the proportion of the load current value that appears under two battery operating conditions. The current distributions are significantly different without data range matching. In
Figure 5b, after data range matching, the current distribution is relatively consistent.
4.2.2. Parameter-Transfer Learning
Due to the large recording interval of cloud platform data, the amount of data that can be used as battery SOC samples is small. Considering that transfer learning technologies are suitable for few-shot learning tasks, transfer learning was selected to solve the problem of battery SOC estimation on the cloud platform. In a transfer learning task, given a source domain DS and learning task TS, a target domain DT and learning task TT, transfer learning is devoted to using the knowledge of the source domain DS and the source domain learning task TS to help improve the estimation result of the target domain DT. In the process, DS ≠ DT or TS ≠ TT [
34]. In general, the source domain DS is rich in a large amount of labeled data, while the target domain DT has little labeled data. As the target domain data distribution is not the same as the source domain data distribution, the model obtained by the source domain data cannot be applied to the target task. However, transfer learning can solve the problem well [
35]. According to the classification of the transferred contents, transfer learning methods can be classified into four cases, including sample-based transfer learning, feature-based transfer learning, relation-based transfer learning, and parameter-based transfer learning. In this paper, parameter-based transfer learning was used to solve the SOC estimation task of the C-BMS. The method shares prior knowledge and some parameters between the source domain model and the target domain model to reduce the complexity of the transfer learning training process.
In this paper, the transfer of the laboratory battery cell SOC estimation model to the cloud platform battery cell SOC estimation model was implemented. The source domain DS is the laboratory battery cell dataset, and the target domain DT is the cloud platform battery cell dataset, which is derived from a real vehicle. Both the source task TS and the target task TT are battery cell SOC estimations.
The cloud platform battery cell SOC estimation model shares the initial weight parameters of the laboratory battery cell SOC estimation model. During the model transfer process, the LSTM network parameters of the time series feature extraction layer are frozen. Only the output layer FC network parameters with nonlinear mapping relationships are adjusted to capture the model difference and working condition difference between the laboratory battery cell and the real vehicle battery cell to obtain the cloud platform battery cell SOC estimation model. The transfer learning process is shown in
Figure 6.
4.3. Battery Pack SOC Estimation
Battery pack SOC is associated with the remaining driving range of EVs and needs to be estimated accurately. For the battery pack, when the first battery cell reaches the charging cutoff voltage with a low current rate, it should stop charging, and its SOC is 100%. When the first battery cell reaches the discharging cutoff voltage, it should stop discharging, and its SOC is 0%. The definition can avoid the abuse of the battery pack. These two representative battery cells are of great significance to the battery pack.
The initial terminal voltage reflects the order of the battery cells reaching the charging or discharging cutoff voltages. With it, the representative battery cells mentioned above can be selected. The battery cell with the highest initial voltage is called the strongest battery cell, and it reaches the charging cutoff voltage fastest during the charging process. The battery cell with the lowest initial voltage is called the weakest battery cell, and it reaches the discharging cutoff voltage fastest [
36]. When estimating the battery pack SOC with representative battery cells, these four guidelines should be followed [
37].
When the battery pack nears full charging, the battery pack SOC should converge to the SOC of the strongest battery cell quickly. When the battery pack nears full discharging, the battery pack SOC should converge to the SOC of the weakest battery cell quickly. When the battery pack is between full charging and full discharging, the battery pack SOC should transition smoothly between the SOCs of the representative battery cells.
In view of the above criteria, the battery pack SOC can be weighted by the SOCs of the strongest battery cell and the weakest battery cell. The weighted strategy is shown in Equation (20).
where
SOCstrongest,k and
SOCweakest,k are the SOCs of the strongest battery cell and the weakest battery cell at time
k, respectively.
wstrongest,k and
wweakest,k are the weighted coefficients of the strongest battery cell and the weakest battery cell at time
k, respectively.
SOCpack,k is the battery pack SOC at time
k.
The weighted coefficients of a charging process are shown in Equation (21), and the weighted coefficients of a discharging process are shown in Equation (22). They can satisfy the above four criteria.
where
and
are the charging cutoff voltage and the discharging cutoff voltage, respectively.
Ustrongest,k and
Uweakest,k are the voltages of the strongest battery cell and the weakest battery cell at time
k, respectively.
At the start or end of charging and at the start or end of discharging, the battery terminal voltage changes rapidly. At the end of charging, wstrongest and wweakest converge to 1 and 0, respectively. This makes the battery pack SOC converge to the SOC of the strongest battery cell rapidly. At the end of the discharging, wstrongest and wweakest converge to 0 and 1, respectively. This makes the battery pack SOC converge to the SOC of the weakest battery cell. At the mid period of charging or discharging, the battery terminal voltage changes gently, so wstrongest and wweakest change slowly. This makes the battery pack SOC transition smoothly between the SOCs of the strongest battery cell and the weakest battery cell.
The data transmitted from the EV to the cloud platform contain the battery cell data with the highest and lowest voltages. It can ensure the smooth SOC estimation of the EV’s battery pack on the cloud platform. The battery pack SOC estimation model based on the cloud platform is shown in
Figure 7.
The current EV data are uploaded to the cloud platform in real time, and the established battery cell SOC estimation model is used to obtain the SOCs of the strongest battery cell and weakest battery cell. Finally, with Equation (20) to Equation (22), the EV’s battery pack SOC is acquired on the cloud platform.
4.4. Battery SOC Calibration with C-BMS
For the cloud platform battery cell SOC estimation model, both its acquisition and online update process depend on real vehicle battery measurement data. The key issue of model transfer is how to calibrate the SOC of a real vehicle battery based on cloud platform data and build a real vehicle battery training dataset. Due to dynamic and changeable driving conditions, the on-board BMS cannot guarantee the long-term stable operation of the battery SOC estimation strategy. Therefore, the battery module SOC uploaded by the on-board BMS cannot be used as the real SOC value for model training. In response to this problem, two cloud-based SOC calibration methods are presented as follows:
(1) The cloud platform requires the real vehicle to upload battery data with a sampling interval of 1 s in a certain period. Battery capacity values and SOC-tagged datasets are obtained through data analysis. In terms of battery capacity calculation, a long continuous full charge segment can be selected, and the ampere-hour integration method can be used to obtain the charging capacity of the battery cell in this interval. The battery cell capacity is updated by scaling the voltage interval. In addition, the cell capacity can also be obtained using a voltage reconstruction model based on partial charge data [
38]. In this paper, the former is used to obtain the battery cell capacity. In the production of datasets with SOC labels, the ampere-hour integration method is used to calibrate the SOC of the discharge segment, which provides a training sample set for the cloud platform battery SOC estimation.
(2) When the cloud data platform cannot regularly obtain battery data with a 1 s sampling interval, the discharge segment data before and after long-term rest can be selected. Battery SOC can be obtained by using the OCV-SOC curve. For a qualified discharge segment of a vehicle, only one training sample can be provided. The cloud data platform monitors a large number of electric vehicles, which can provide rich training samples with different aging states, driving conditions, and a wide range of battery SOCs. The data can be used for model transfer learning. It should be noted that, considering the battery aging problem, the cloud platform needs to correct the OCV-SOC curve to ensure SOC calibration accuracy [
39].
In this paper, method (1) was used to build the battery SOC dataset on the cloud data platform. The data of two different types of electric buses were calibrated and could be used for model transfer learning and method validation.
5. Experiments
The lithium-ion battery (LIB) experimental datasets in the laboratory originate from the University of Wisconsin–Madison. The experiments were carried out on the same type of battery, a Panasonic NCR18650PF LiNiCoAlO
2. Its main parameters are shown in
Table 1. Among the datasets, there were nine dynamic driving cycles, which consisted of Cycle1–4, neural network (NN), urban dynamometer driving schedule (UDDS), unified driving schedule (LA92), HWFET and US06. The driving cycles were repeated at four ambient temperatures: 25 °C, 10 °C, 0 °C, and −10 °C. During the test, the battery was charged to 4.2 V with a constant current–constant voltage (CC-CV) test whose charge rate and cutoff current were 1 C and 50 mA, respectively. After charging, the battery rested for enough time to ensure stability. Cycles 1–4 were the random combinations of NN, UDDS, LA92, HWFET and US06. NN consisted of LA92, US06, and some additional dynamic conditions, which was useful for the convergence of the network models. HWFET and US06 were used to test the performance of the battery cell SOC estimation model named EMD-ACS-LSTM, while the other driving cycle data were regarded as training datasets. The laboratory battery data were processed using downsampling to simulate the data storage interval of the cloud platform before training and testing.
Two different types of electric buses monitored by the cloud platform were used to verify the battery SOC estimation method for C-BMS application in this paper. Both of them were from YIXING ELECTRIC AUTO limited company in China’s Shandong province. The battery pack of electrical bus 1 came from Boston Power Battery company, and the battery pack of electrical bus 2 came from Shandong Weihai Dongsheng Energy Technology company. Both of them were lithium-ion batteries. Their specifications are shown in
Table 2. The modeling data used for battery state estimation (battery voltage, current, temperature) and actual vehicle operating conditions data were all measurement data.
Due to the different battery manufacturers, the model transferring processes of the two electric buses were separate. Discharging fragments were selected from the two electric buses’ battery data. They were be divided into respective training sets during the model transfer. Then, two discharging fragments were selected from the two electric buses’ battery data to verify the battery SOC estimation method for C-BMS application in this paper.
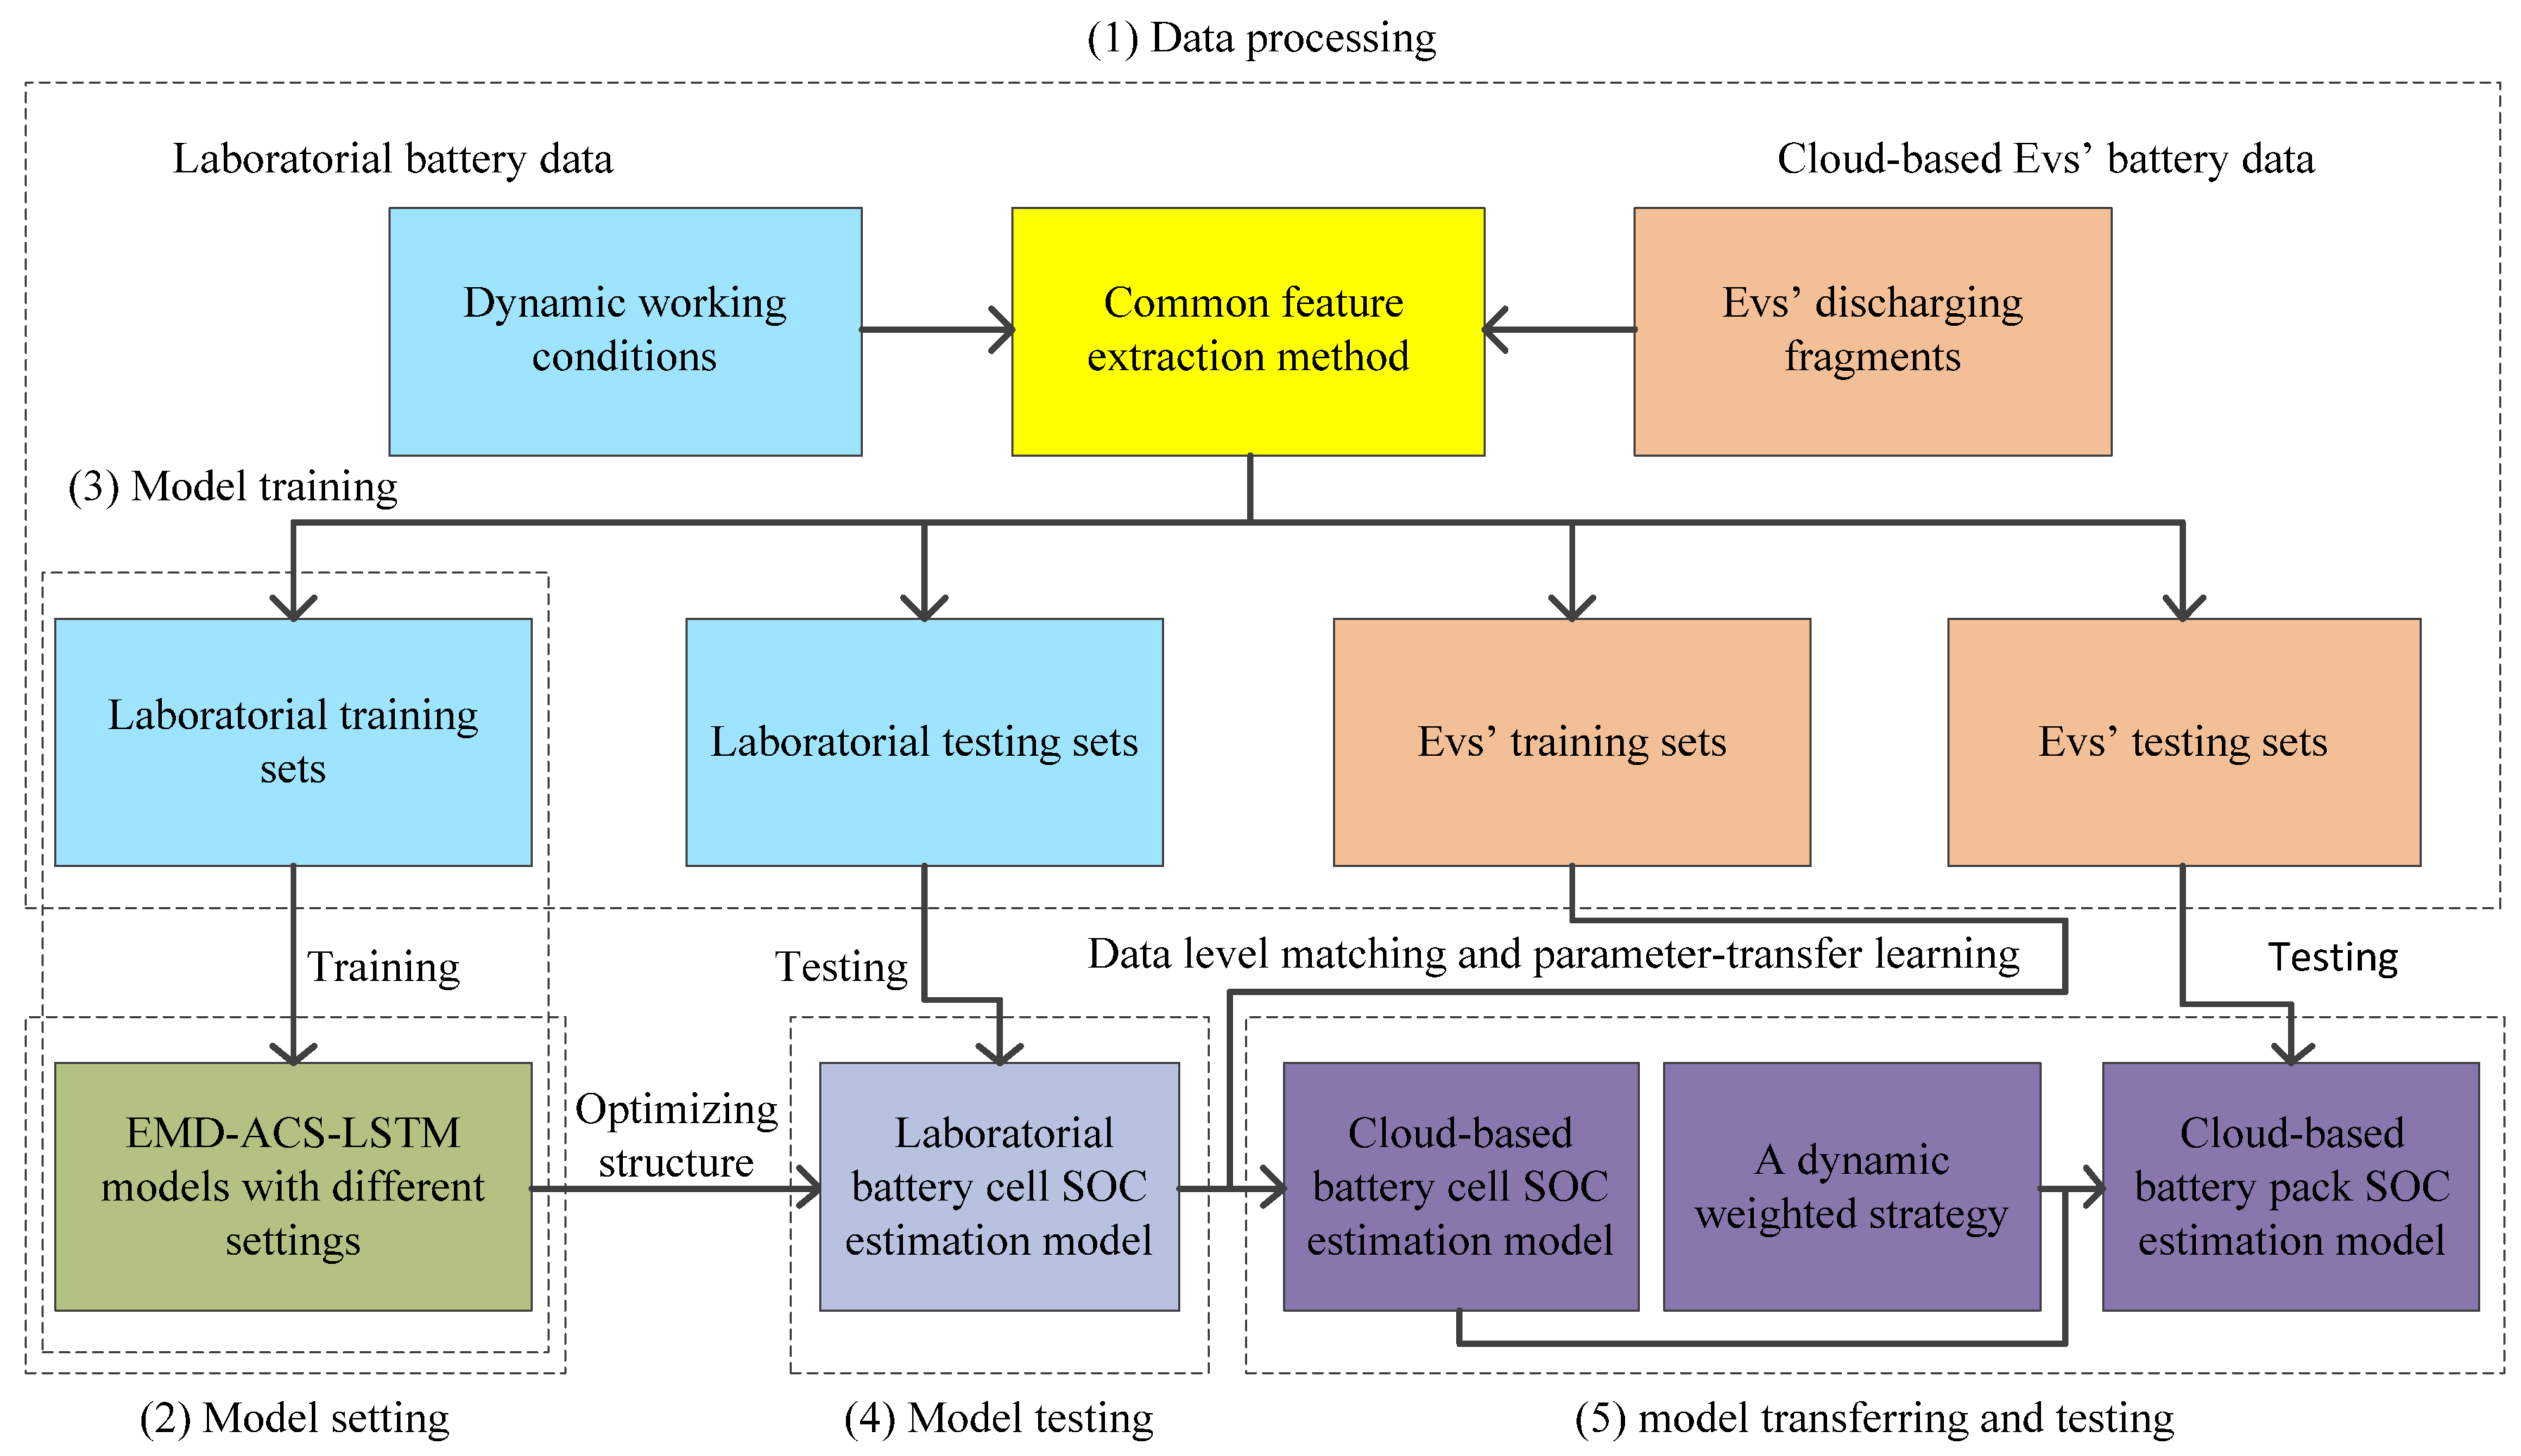
Figure 8 shows the main process for implementing and verifying the proposed battery SOC estimation method. It will be described in detail as follows:
(1) Data processing: The EV battery data were matched and calibrated based on
Section 4.2.1 and
Section 4.4, and the laboratory battery data were calibrated by the Ah counting method. Subsequently, the sampling frequencies of both were reduced to 0.1 Hz to simulate the sparsity of the platform data. A sliding window with size
N was set to determine series data of voltage
U1:N, current
I1:N, and temperature
T1:N. To reduce the fluctuations of
U1:N and
I1:N, EMD was used to decompose them into the voltage IMFs
UIMFs,1:N, voltage residue
Uresidue,1:N, current IMFs
IIMFs,1:N, and current residue
Iresidue,1:N. The stable component,
Uresidue,1:N,, was compensated for through the average voltage of the internal resistance identified online, further improving the correlation with SOC.
xk = [
Uc,residue,k,
UIMFs,k,
Iresidue,k,
IIMFs,k,
Tk] (
k = 1, 2, 3, ……,
N) was the input vector of the LSTM network, and it was normalized to a range [0, 1] to accelerate the convergence of training.
Uc,residue,k was the compensated voltage residue.
SOCN represented the true SOC at time step
N, which was also the true value of the model’s output. With the sliding window, the above course was repeated, and many sample points could be acquired for training and testing.
(2) Model setting: Experiments were conducted to explore the influence of various lengths of the input sequence and different numbers of hidden layers on the battery cell SOC estimation model. A suitable setting could effectively guarantee the accuracy of the model. The model structure was optimized.
(3) Model training: Stratified sampling was used to divide the laboratory training sets into 10 disjoint subsets with the same size. One of them was selected as the laboratory validation set, and the other was regarded as the laboratory training set. This process was repeated 10 times. Each model was trained 10 times, and the results were averaged to provide a more valid estimation result. The laboratory training sets were used to adjust the model parameters. The laboratory validation sets were used to select the model during training to prevent the model from overfitting. The training process consisted of forward propagation and back propagation based on the Adam algorithm.
(4) Model testing: The test sets were used to obtain the performance of the trained models with different settings, and the best model was chosen. Laboratory test sets, including HWFET and US06, were used to test the battery SOC estimation model EMD-ACS-LSTM under different model settings, and the optimal structure of the battery cell SOC estimation model was confirmed.
(5) Model transferring and testing: Through data level matching and parameter-transfer learning, the laboratorial battery cell SOC estimation model was fine-tuned to obtain the battery cell SOC estimation model for C-BMS application. With the battery pack SOC estimation model, battery pack SOC estimation for C-BMS applications was realized. It was tested using two electric buses monitored by the cloud platform.
7. Conclusions
In this paper, a battery pack SOC estimation method for C-BMS applications is proposed. The contributions of this paper can be summarized in three parts:
(1) In terms of extracting common features of batteries’ working conditions, this paper studies a common feature extraction method for C-BMS applications to reduce the volatility of working conditions. It includes EMD, an internal resistance model, online parameter identification, and a compensation strategy. The PCC between the compensated voltage residue and SOC reaches a maximum value of 0.953. Based on the correlation analysis and SOC influencing factors, the compensated voltage residue, voltage IMF, current residue, current IMF, and temperature are treated as the new model inputs.
(2) In terms of constructing the battery pack SOC estimation method for C-BMS applications, the battery cell SOC estimation model is built by combining the common feature extraction method and LSTM network first. Later, with the weighted strategy, the battery pack SOC estimation model is obtained. To shorten the development cycle of the model, the laboratory battery cell SOC estimation model is fine-tuned to obtain the battery cell SOC estimation model for C-BMS applications. Before transferring, data level matching reduces the difference between EV battery data and laboratory battery data and improves the stability of the transferred model. A battery SOC calibration method with C-BMS is designed to provide training samples for model transfer.
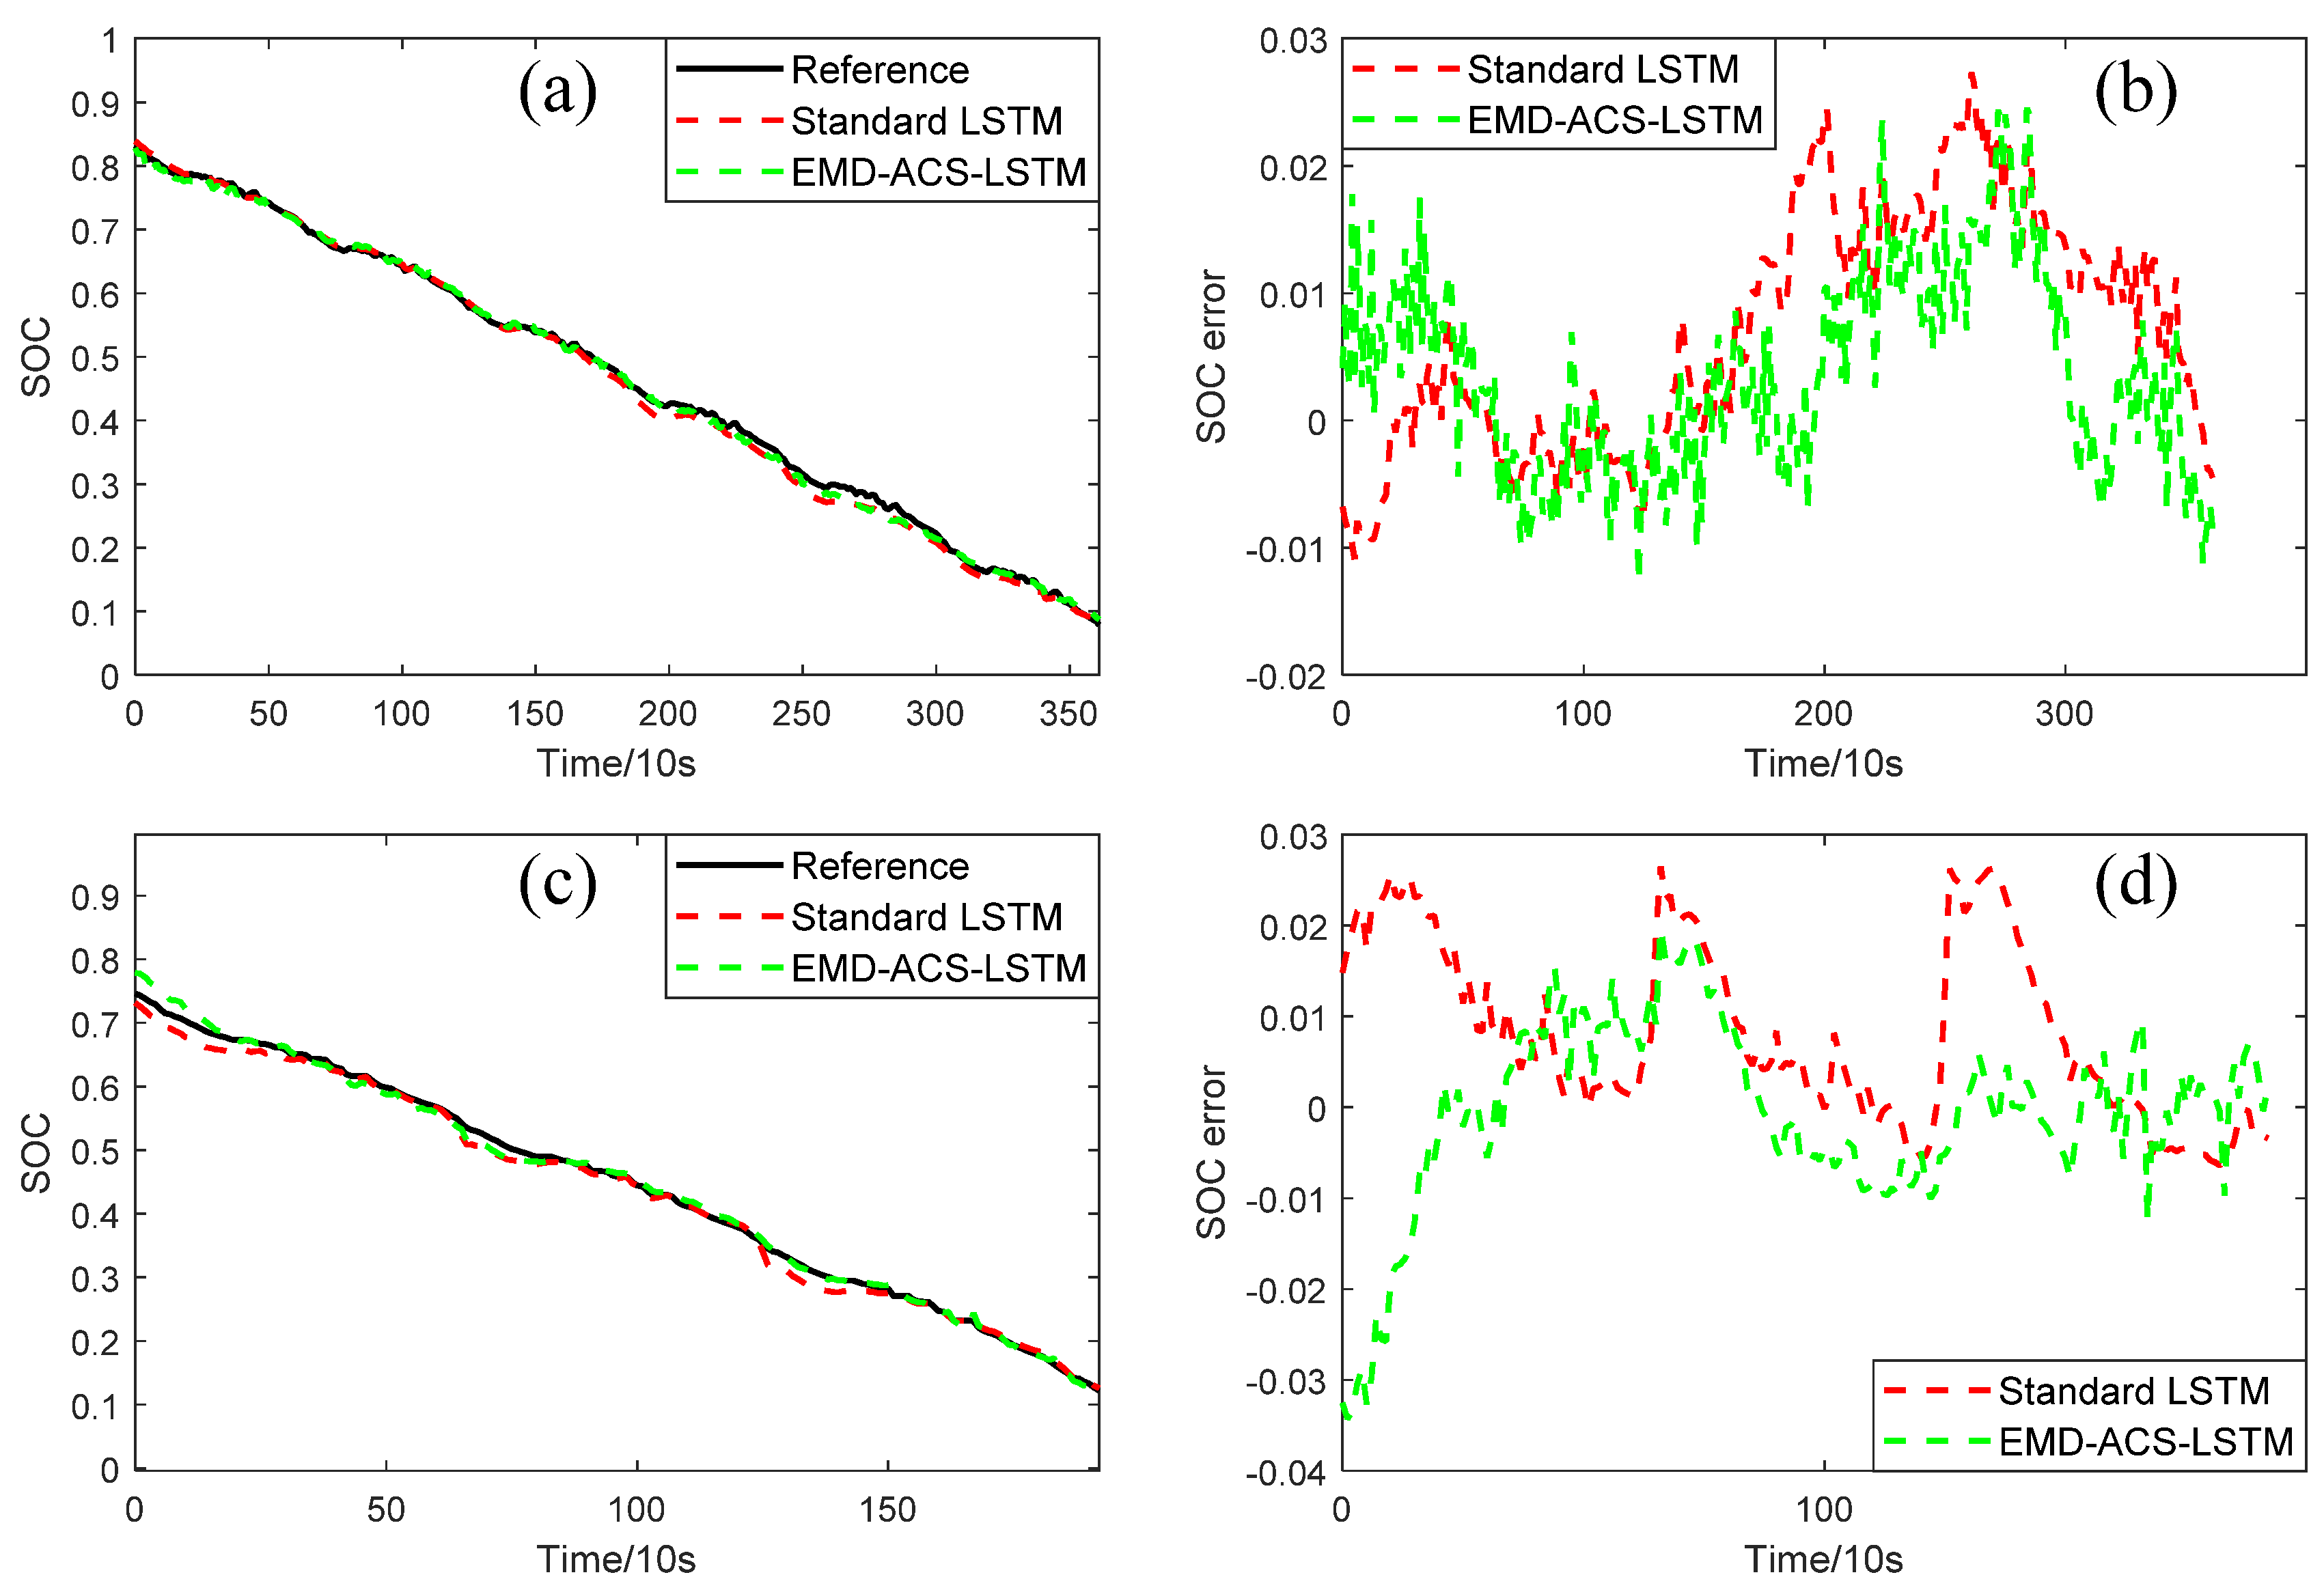
(3) In terms of the verification of the proposed battery SOC estimation method, verifications of the laboratory and cloud platform have been carried out. On the laboratory battery cell data, the maximum RMSE of battery cell SOC estimation obtained using the proposed EMD-ACS-LSTM is only 2.2%. Its overall performance is better than that of the standard LSTM. On the battery pack data of two electric buses monitored by the cloud platform, the maximum RMSE of battery pack SOC estimation is only 1.3%, showing good performance.
The method proposed in this paper can be used on the new energy vehicle big data platforms. The state estimation result can provide a unified basis for the calibration of the vehicle SOC estimation value and vehicle state evaluation. In future work, we will focus on the application of machine learning methods to the battery state of energy, state of power estimation, and battery safety assessment.


